making maps and plotting data with gmt and igmt
TRANSCRIPT

Making maps and plotting data with
GMT and iGMT
Thorsten Becker
University of Southern CaliforniaLos Angeles CA
April 2012
The problem
● Produce publication quality plots (including x – y) and geographic maps
● Achieve flexibility and automated processing (which requires modularity and script based operation)
● Do it the open source way (low cost, high transparency, high portability, high robustness)
The solution
● The Generic Mapping Tools (GMT)● “~65 tools for manipulating geographic and
Cartesian data sets (including filtering, trend fitting, gridding, projecting, etc.) and producing Encapsulated PostScript File (EPS) illustrations”
● It has a somewhat steep learning curve, and no graphical user interface
● iGMT: a GMT GUI and script generator
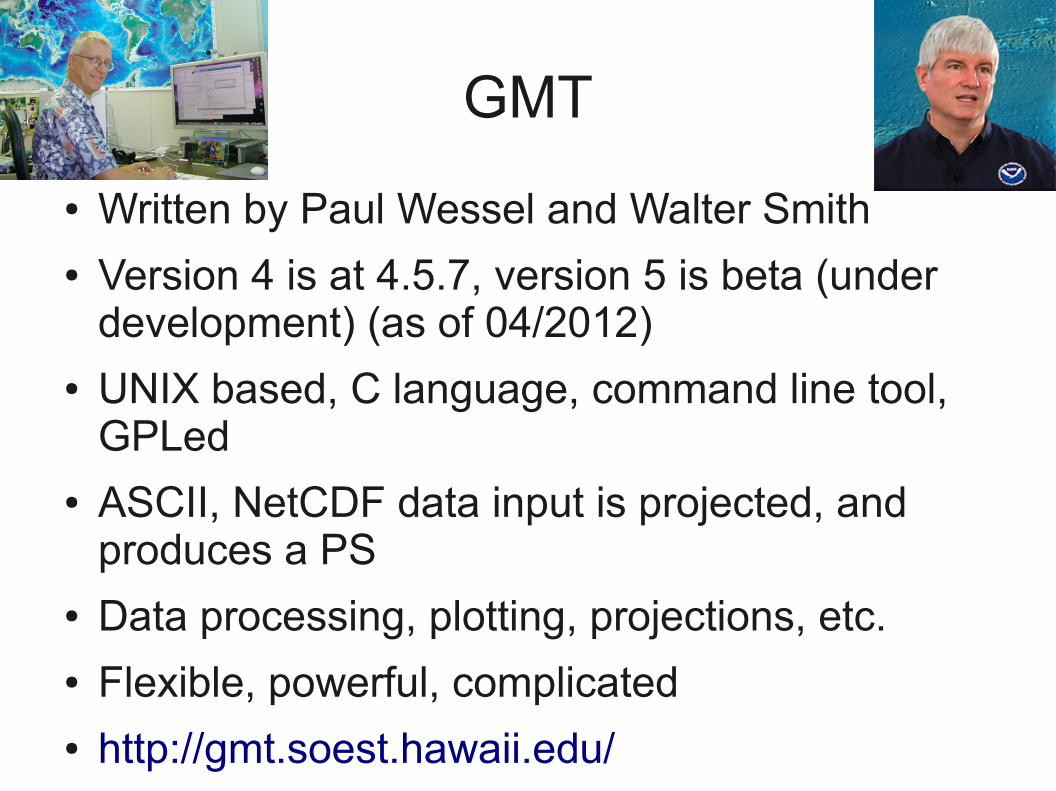
GMT
● Written by Paul Wessel and Walter Smith● Version 4 is at 4.5.7, version 5 is beta (under
development) (as of 04/2012)● UNIX based, C language, command line tool,
GPLed● ASCII, NetCDF data input is projected, and
produces a PS● Data processing, plotting, projections, etc.● Flexible, powerful, complicated● http://gmt.soest.hawaii.edu/
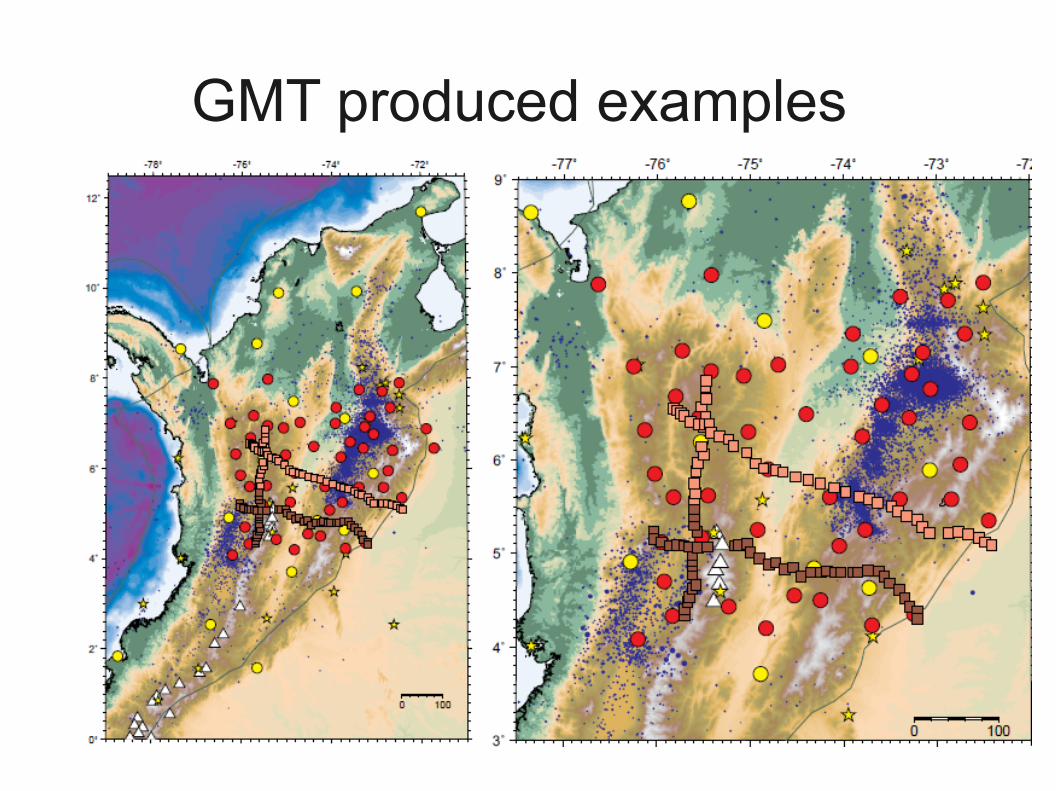
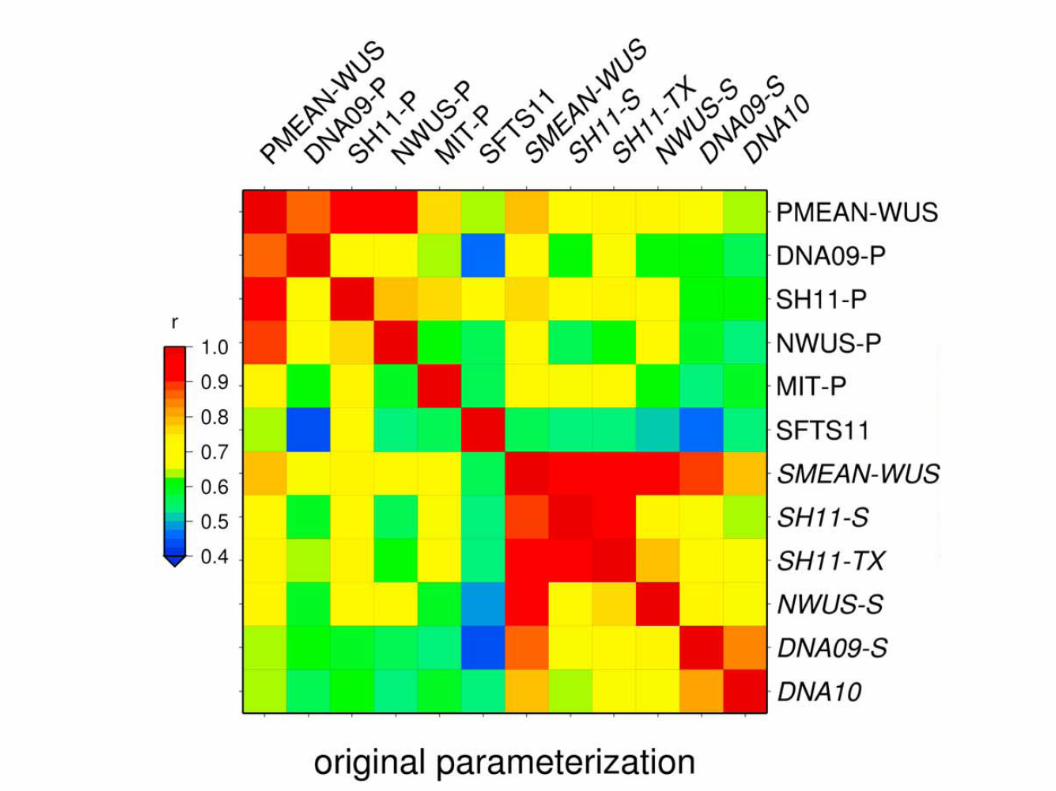
GMT produced examples
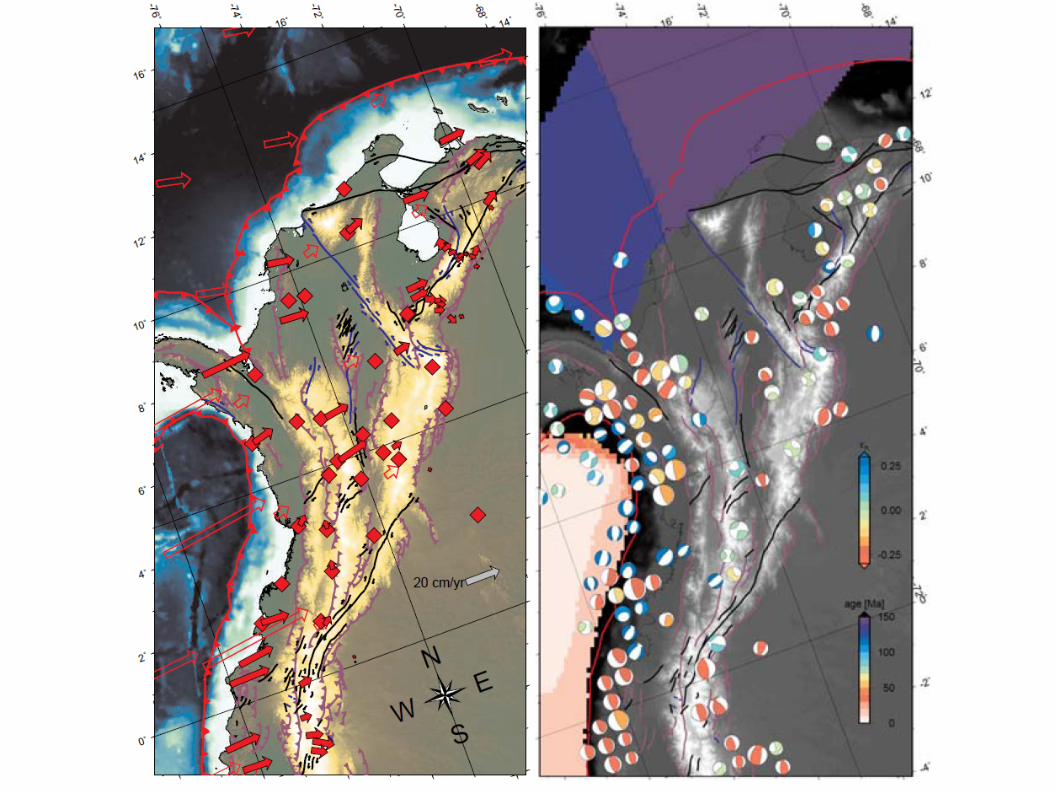
Examples


How to get it?
● Download from GMT web page and install● http://gmt.soest.hawaii.edu/ ● Requires Linux or OS-X● prerequisites such as NetCDF
● Install via package manager (yum, fink)● Install the USC Geodynamics Earth Science
Computing Environment at● http://geodynamics.usc.edu/~becker/ugesce.html

GMT documentation

Running GMT#!/bin/bash # GMT EXAMPLE 07 # # Purpose: Make a basemap with earthquakes and isochrons etc # GMT progs: pscoast, pstext, psxy # Unix progs: $AWK, echo, rm # ps=../example_07.ps pscoast -R-50/0/-10/20 -JM9i -K -GP300/26 -Dl -Wthinnest -B10 -U~Example 7 in Cookbook~ > $ps psxy -R -J -O -K -m fz.xy -Wthinner,- >> $ps $AWK ’{print $1-360.0, $2, $3*0.01}’ quakes.xym | psxy -R -J -O -K -H1 -Sci -Gwhite -Wthinnest >> $ps psxy -R -J -O -K -m isochron.xy -Wthin >> $ps psxy -R -J -O -K -m ridge.xy -Wthicker >> $ps psxy -R -J -O -K -Gwhite -Wthick -A >> $ps << END -14.5 15.2 -2 15.2 -2 17.8 -14.5 17.8 END psxy -R -J -O -K -Gwhite -Wthinner -A >> $ps << END -14.35 15.35 -2.15 15.35 -2.15 17.65 -14.35 17.65 END echo ~-13.5 16.5~ | psxy -R -J -O -K -Sc0.08i -Gwhite -Wthinner >> $ps echo ~-12.5 16.5 18 0 6 LM ISC Earthquakes~ | pstext -R -J -O -K >> $ps pstext -R -J -O -Sthin -Gwhite >> $ps << END -43 -5 30 0 1 CM SOUTH -43 -8 30 0 1 CM AMERICA -7 11 30 0 1 CM AFRICA END rm -f .gmt*

WTF is happening here?
● UNIX uses shell/shell script interactions with the OS system, traditionally
● This is a good thing, but can take some time to get used to
● Check out some UNIX introduction, e.g.● http://geodynamics.usc.edu/~becker/teaching/unix/lecture1.pdf
● http://geodynamics.usc.edu/~becker/teaching/unix/lecture2.pdf
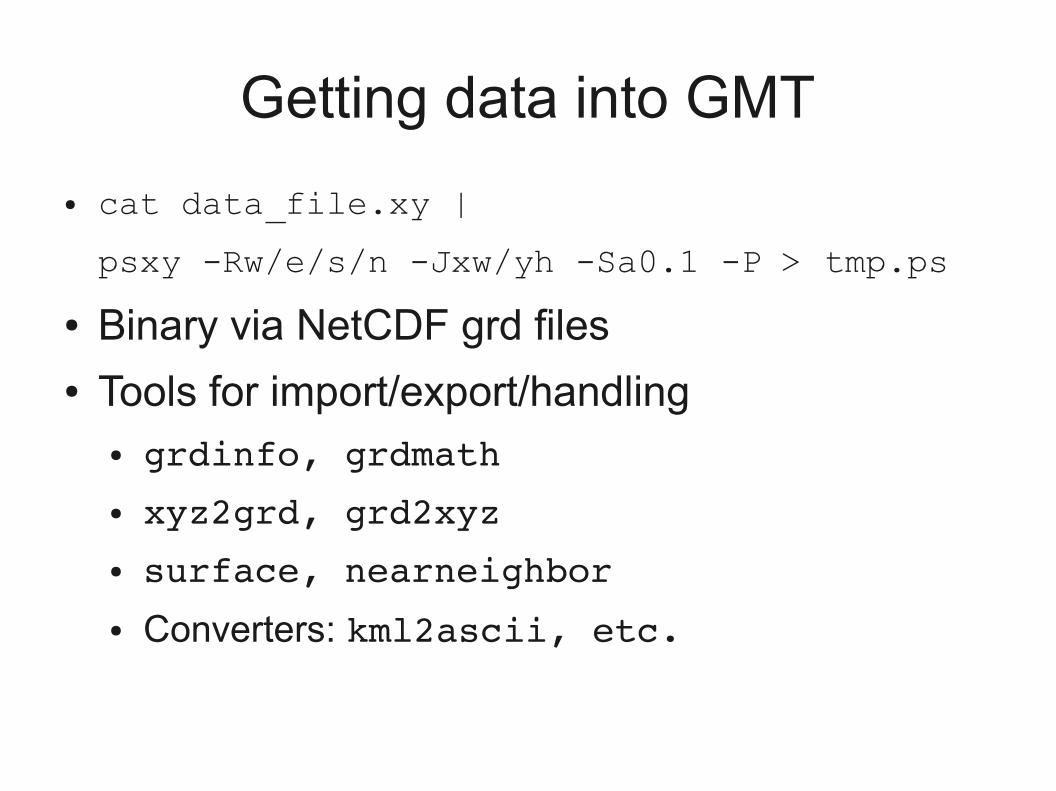
Getting data into GMT
● cat data_file.xy |
psxy -Rw/e/s/n -Jxw/yh -Sa0.1 -P > tmp.ps
● Binary via NetCDF grd files● Tools for import/export/handling
● grdinfo, grdmath● xyz2grd, grd2xyz● surface, nearneighbor● Converters: kml2ascii, etc.

Some GMT things● Region:
● R125/130/20/30
● Projection:
● JM7i
● JH127.5/6c
● Line styles:
● W2,45/50/50
● Wthick,black,
● Boundary annotation:
● Ba10f1
● Ba5f.5g1:”x”:/a10f1:”y”::.”plot title”:WeSn


GMT problems and solutions
● K-O
1) Some-GMT-command -K > tmp.ps
2) Some-other-command -O -K >> tmp.ps
3) Yet-another-command -O -K >> tmp.ps
4) Some-last-command -O >> map.ps
● RTFM, the cookbook, or the tutorial● Join the GMT help list (and google if someone
has experienced the same problem before)● Get a working script and modify● iGMT
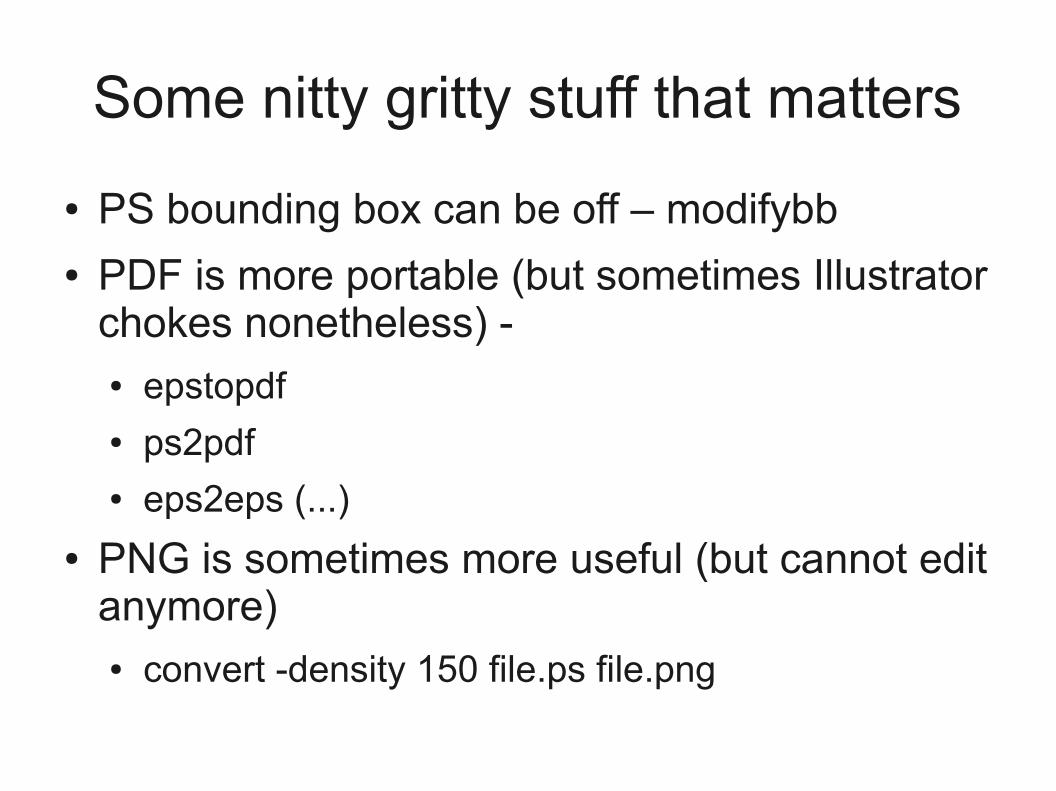
Some nitty gritty stuff that matters
● PS bounding box can be off – modifybb● PDF is more portable (but sometimes Illustrator
chokes nonetheless) - ● epstopdf● ps2pdf● eps2eps (...)
● PNG is sometimes more useful (but cannot edit anymore)● convert -density 150 file.ps file.png

Some GMT caveats
● There are bugs, sometimes (e.g. supp packages)
● Not necessarily spherical (surface vs. sphtriangulate)
● Hidden parameters in .gmtdefaults file● Wrong scaling (-Jx100) will kill your machine● Non interactive, not fully 3D● However, it's the best and there's a large user
community
iGMTInteractive mapping ofgeoscientific datasets
● Written by Thorsten Becker and Alexander Braun
● UNIX based, TclTk script graphical user interfact for GMT
● Access to several Earth science datasets● Produces GMT/bash scripts● (development discontinued, in favor of python
based SEATREE)● http://geodynamics.usc.edu/~becker/igmt/

● Installed on USC Geodynamics Earth Science Computing Environment

iGMT produced maps
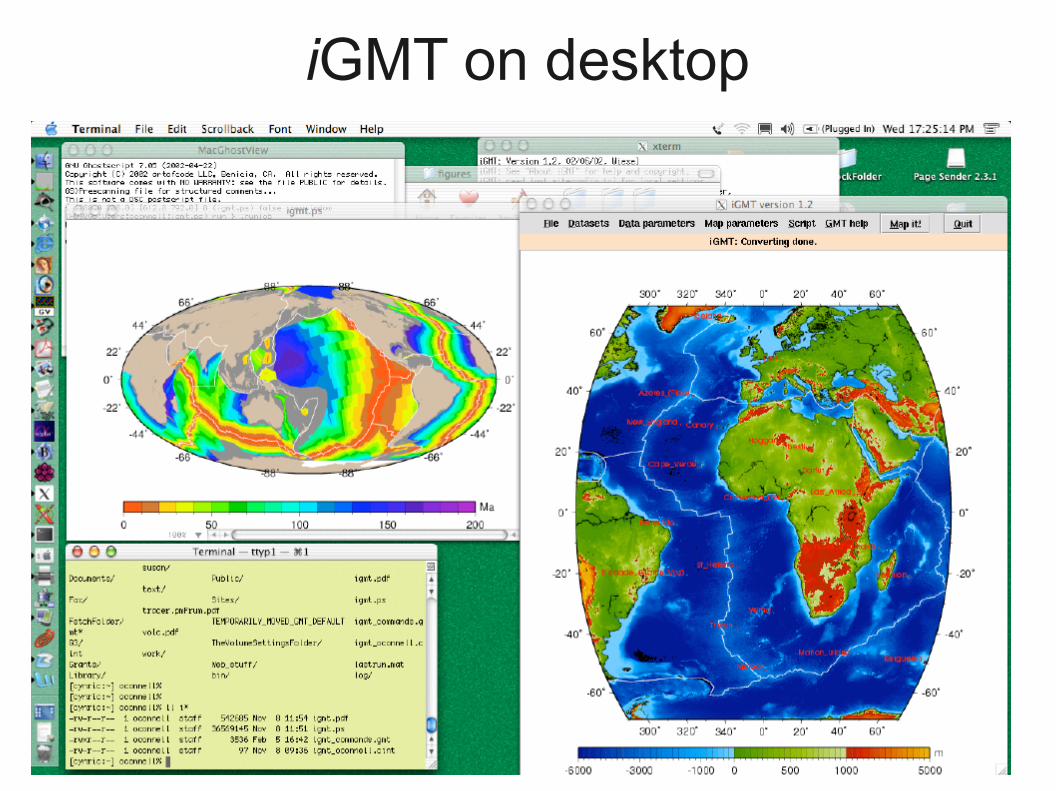
iGMT on desktop

Solid Earth Research and Teaching Environment (SEATREE)

Python interface for GMT plots
(Only very rudimentary implementation; there are previous attempts on python-GMT, anda proper interface is in the works.)