making health care affordable for all americans
DESCRIPTION
Making Health Care Affordable for All Americans. Karen Davis President, The Commonwealth Fund January 28, 2004 Hearing on “What’s Driving Health Care Costs and the Uninsured?” Senate Committee on Health, Education, Labor, and Pensions. 1. - PowerPoint PPT PresentationTRANSCRIPT

THE COMMONWEALTH
FUND
Making Health Care Affordablefor All Americans
Karen DavisPresident, The Commonwealth Fund
January 28, 2004
Hearing on“What’s Driving Health Care Costs and the Uninsured?”
Senate Committee on Health, Education, Labor, and Pensions

THE COMMONWEALTH
FUND
0
3
6
9
12
15
18
1985 1988 1991 1994 1997 2000 2003*
Growth in Per Enrollee Private Health Insurance Premiums and Benefits, 1985–
2003
Source: S. Heffler et al., “Health Spending Projections for 2002–2012,” Health Affairs (Web Exclusive February 7, 2003) for 1985–2001 premiums and benefits (historical data) and 2002-2003 benefits (projected data); Employer Health Benefits 2003 Annual Survey, The Kaiser Family Foundation and Health Research and Educational Trust, September 2003 for 2002–2003 premiums (historical data).
Percent
Premiums per enrollee
Benefits per enrollee
* Data for growth between Spring 2002 and Spring 2003
13.9%
8.5%
1
THE COMMONWEALTH
FUND
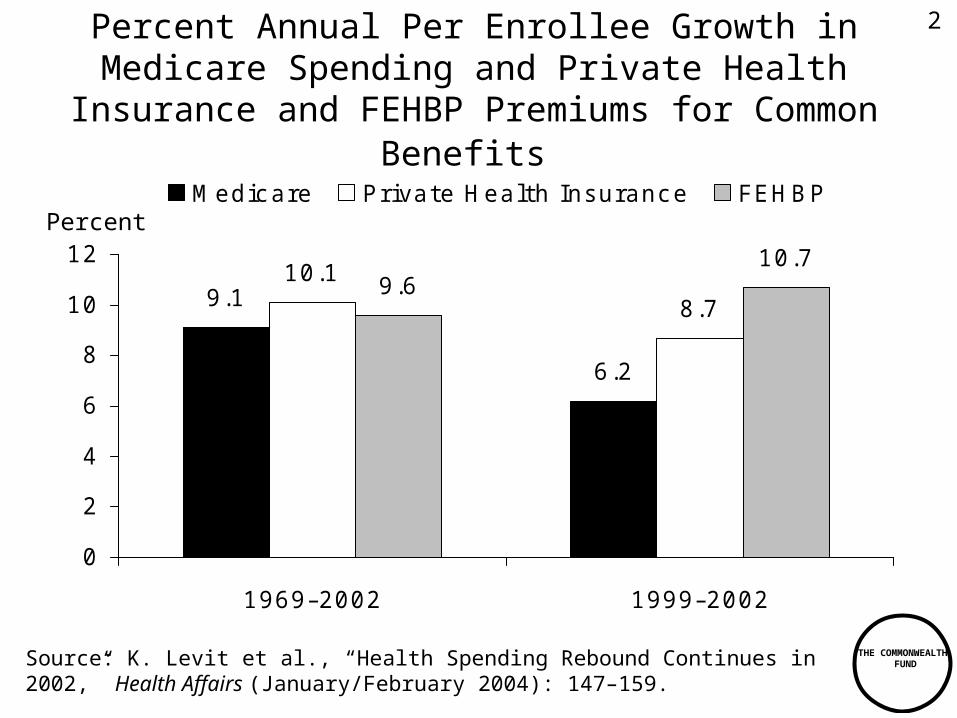
Percent Annual Per Enrollee Growth in Medicare Spending and Private Health Insurance and FEHBP
Premiums for Common Benefits
9.1
6.2
10.1
8.79.6
10.7
0
2
4
6
8
10
12
1969–2002 1999–2002
Medic are P rivate Health Insuranc e FEHBP
Source: K. Levit et al., “Health Spending Rebound Continues in 2002,” Health Affairs (January/February 2004): 147–159.
Percent
2

THE COMMONWEALTH
FUND
Uninsured Workers Lack Insurance Coverage for Multiple Reasons, Including Not Accepting
Offered Coverage
Employer doesn’t offer coverage
60%Employer offers,
worker eligible, doesn’t participate
22%
Employer offers, worker ineligible
11%
Worker doesn’t know if offered or if eligible
7%
Source: S.R. Collins et al., On the Edge: Low-Wage Workers and Their Health Insurance Coverage, Commonwealth Fund, April 2003.
Total 15.4 Million Uninsured Workers Ages 19–64
3
THE COMMONWEALTH
FUND
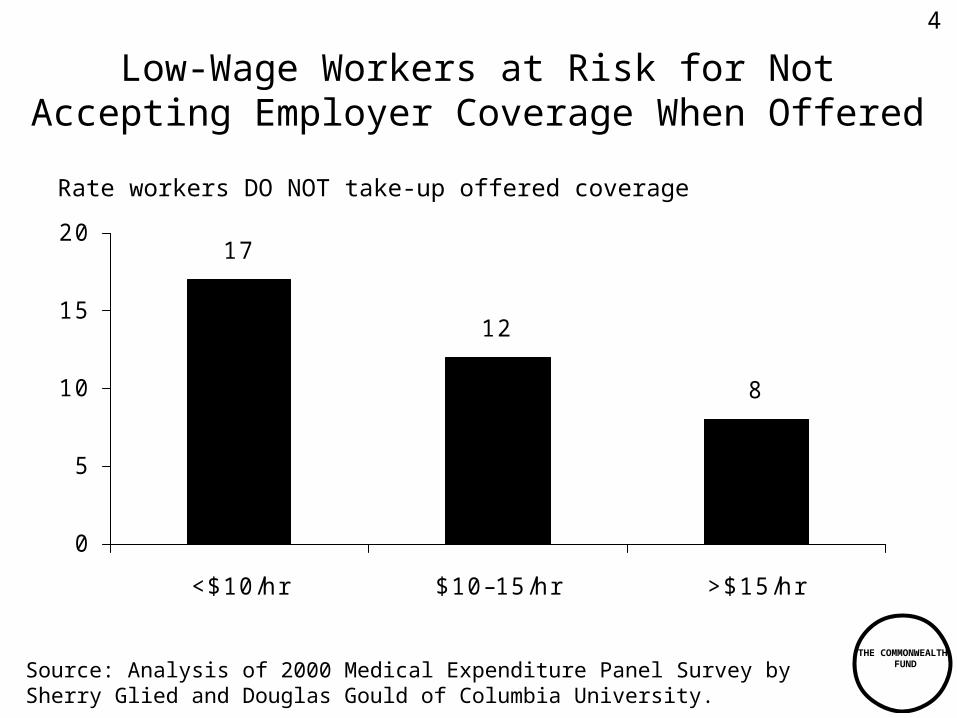
Low-Wage Workers at Risk for Not Accepting Employer Coverage When Offered
17
12
8
0
5
10
15
20
<$10/hr $10–15/hr >$15/hr
Rate workers DO NOT take-up offered coverage
Source: Analysis of 2000 Medical Expenditure Panel Survey by Sherry Glied and Douglas Gould of Columbia University.
4

THE COMMONWEALTH
FUND
High Premiums and Out-of-Pocket CostsCreate Financial Burdens on Patients
50
38
27
57
5
32
11
2022
1118
12
0
10
20
30
40
50
60
Not A ble to P ay
Medic al B ills
Contac ted by
Collec tion A genc y
Had to Change
Way of L ife to P ay
Medic al B ills
A ny of the T hree
Medic al B ill
P roblems
Low er-income* uninsured Low er-income insured** H igher-income insured
Source: The Commonwealth Fund 2001 Health Insurance Survey.
* “Lower-income” is defined as having annual family income of less than $35,000.** “Insured” is insured all year.
Percent of workers who had the following problems in the past year due to cost
5
THE COMMONWEALTH
FUND
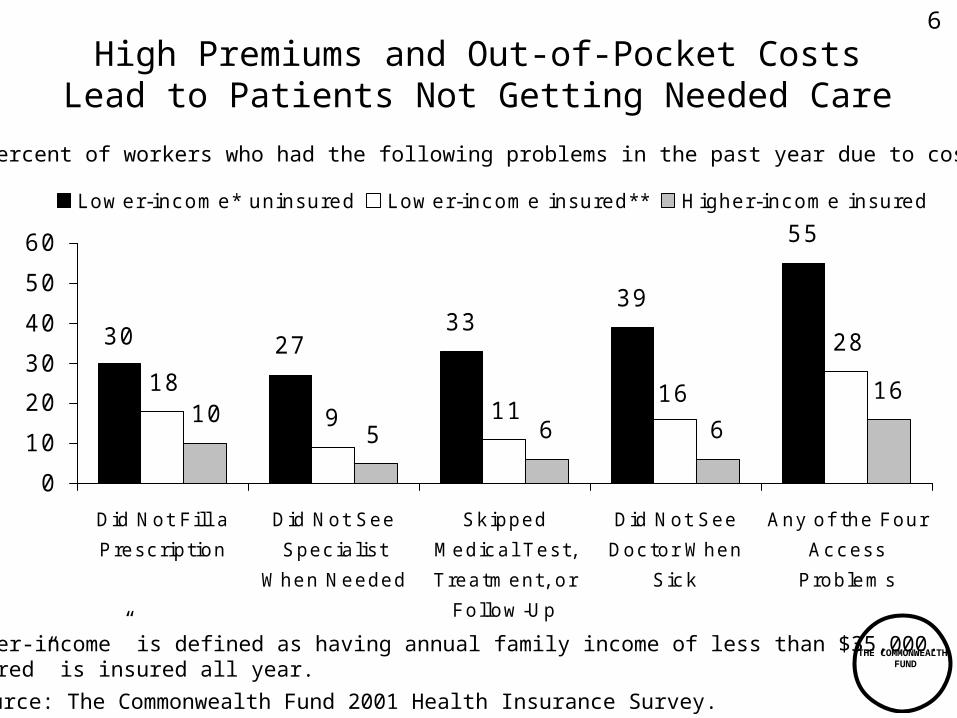
High Premiums and Out-of-Pocket CostsLead to Patients Not Getting Needed Care
3339
55
6 6
2730 28
16119
18 16
510
0
10
20
30
40
50
60
Did Not F ill a
P resc ription
Did Not See
Spec ialis t
When Needed
Sk ipped
Medic al T es t,
T reatment, or
Follow -U p
Did Not See
Doc tor When
S ic k
Any of the Four
Ac c ess
P roblems
Low er-income* uninsured Low er-income insured** H igher-income insured
Percent of workers who had the following problems in the past year due to cost
* “Lower-income” is defined as having annual family income of less than $35,000.** “Insured” is insured all year.
Source: The Commonwealth Fund 2001 Health Insurance Survey.
6

THE COMMONWEALTH
FUND
0
2
4
6
8
10
12
1991 1993 1995 1997 1999 2001 2003*
Annual Change Per Capita in Health Care Spending and Per Capita Gross Domestic
Product, 1991–2003
Source: B. Strunk and P. Ginsburg, “Tracking Health Care Costs: Trends Stabilize But Remain High in 2002,” Health Affairs (Web Exclusive June 11, 2003); B. Strunk and P. Ginsburg, Tracking Health Care Costs: Trends Slow in First Half of 2003, Center for Studying Health System Change, December 2003.
Percent
Health Care Spending
GDP
* Data for January through June 2003, compared with corresponding months in 2002.
8.5%
2.9%
7
THE COMMONWEALTH
FUND
0
2
4
6
8
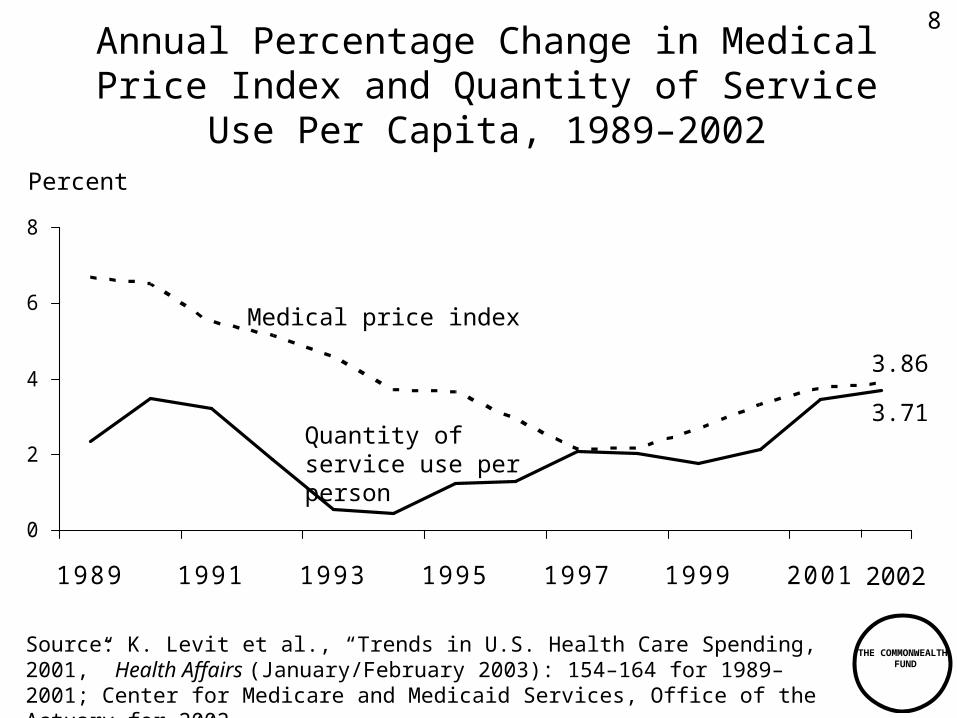
1989 1991 1993 1995 1997 1999 2001
Source: K. Levit et al., “Trends in U.S. Health Care Spending, 2001,” Health Affairs (January/February 2003): 154–164 for 1989–2001; Center for Medicare and Medicaid Services, Office of the Actuary for 2002.
Annual Percentage Change in Medical Price Index and Quantity of Service Use Per
Capita, 1989–2002Percent
Medical price index
Quantity of service use per person
3.86
3.71
2002
8

THE COMMONWEALTH
FUND
Percentage Growth in Medicare Per Capita Use of Physician Services, by Selected
Type of Service, 2001–2002
2.3
4.4
6.5
10.8
14.6
10.1 9.98.9
0
10
20
Offi c e visits Consultations E mergenc y
room visits
E c hography-
heart
MRI - brain E ndosc opy -
c olonosc opy
K nee
replac ement
P ac emaker
insertion
Source: Medicare Payment Advisory Commission, Report to the Congress: Medicare Payment Policy. March 2003.
Percent
9
THE COMMONWEALTH
FUND
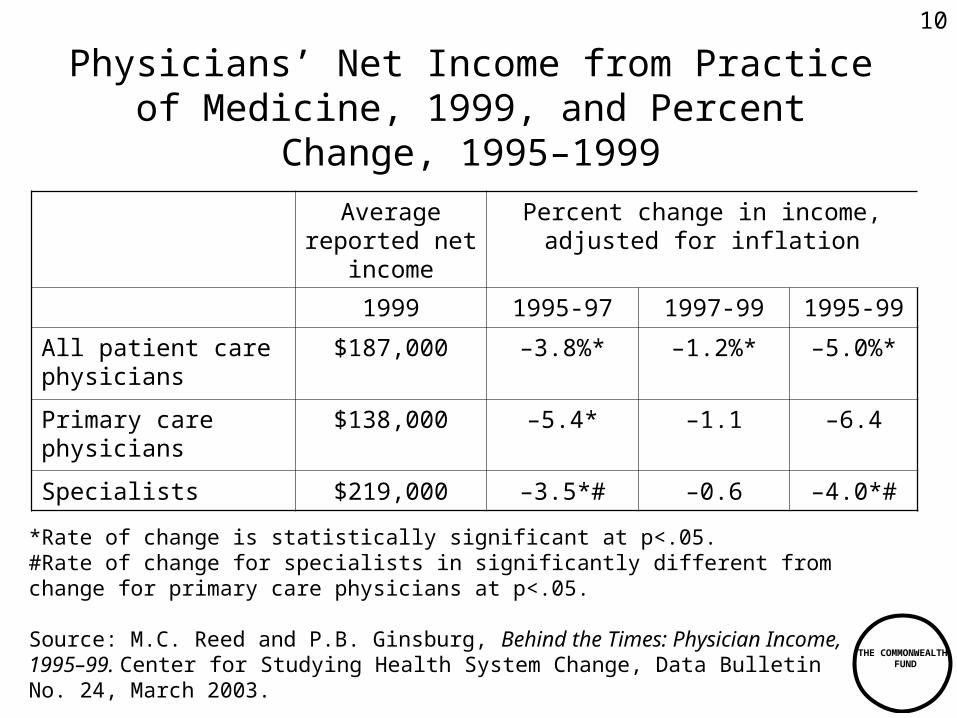
Physicians’ Net Income from Practice of Medicine, 1999, and Percent Change, 1995–
1999
Average reported net
income
Percent change in income, adjusted for inflation
1999 1995-97 1997-99 1995-99
All patient care physicians
$187,000 –3.8%* –1.2%* –5.0%*
Primary care physicians
$138,000 –5.4* –1.1 –6.4
Specialists $219,000 –3.5*# –0.6 –4.0*#
*Rate of change is statistically significant at p<.05.#Rate of change for specialists in significantly different from change for primary care physicians at p<.05.
Source: M.C. Reed and P.B. Ginsburg, Behind the Times: Physician Income, 1995–99. Center for Studying Health System Change, Data Bulletin No. 24, March 2003.
10
THE COMMONWEALTH
FUND
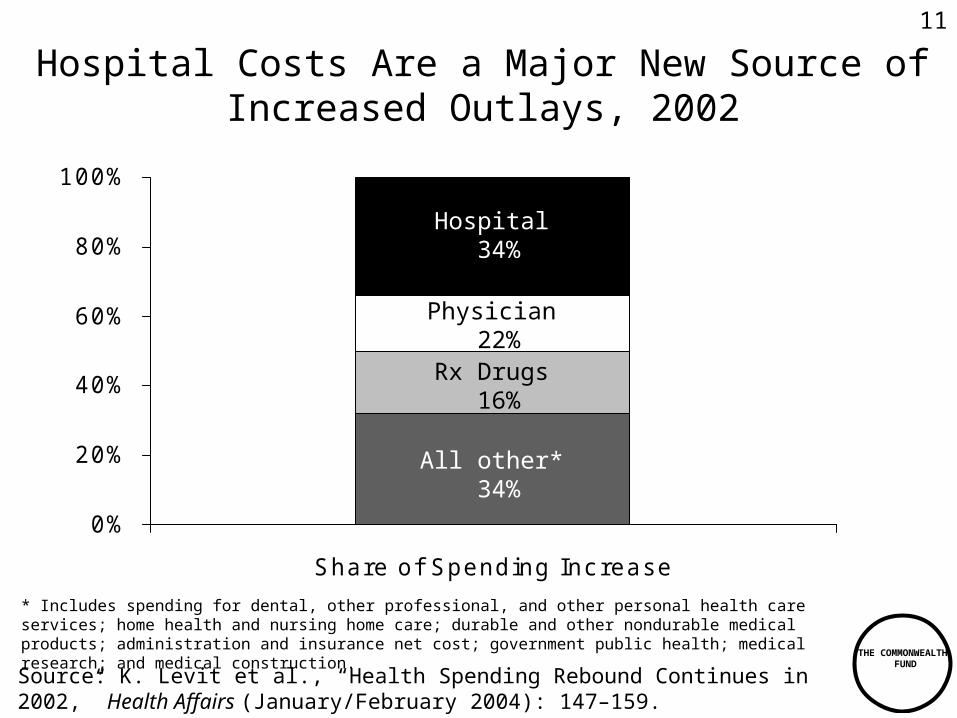
Hospital Costs Are a Major New Source of Increased Outlays, 2002
0%
20%
40%
60%
80%
100%
Share of Spending Inc rease
Hospital 34%
Physician 22%
Rx Drugs 16%
All other* 34%
* Includes spending for dental, other professional, and other personal health care services; home health and nursing home care; durable and other nondurable medical products; administration and insurance net cost; government public health; medical research; and medical construction.
Source: K. Levit et al., “Health Spending Rebound Continues in 2002,” Health Affairs (January/February 2004): 147–159.
11

THE COMMONWEALTH
FUND
Average Annual Growth in Hospital Costs, 1988–2002
8.8
3.54.0
7.5
9.5
0
1
2
3
45
6
7
8
9
10
1988–1993 1993–1997 1997–2000 2000–2001 2001–2002
Percent
Source: K. Levit et al., “Health Spending Rebound Continues in 2002,” Health Affairs (January/February 2004): 147–159.
12

THE COMMONWEALTH
FUND
Factors Accounting for Growth in Prescription Drug Spending per Capita, 1980–2011
Note: Data for 2000–2011 are projections.”Other” includes quality and intensity of services, and age-gender effects.Source: Centers for Medicare and Medicaid Services, The CMS Chart Series, 2003.
9
2.84.6 4.9 4.9
2.2
5 3.3 2.44.2
6.5
5.1
2.70.90.8
0
2
4
6
8
10
12
14
16
18
1980-1993 1993-1997 1997-2000 2000-2003 2003-2011
Calendar Y ears
Other
Drug U tilization (N umber of P resc riptions)
Drug P ric es (Consumer P ric e Index - Drugs)
10.79.2
16.1
13.3
10.0
Average annual percent change
13

THE COMMONWEALTH
FUND
Administrative Costs Are Surging
6.2
9.78.5
12.5
9.3
16.2
02468
1012141618
National Health Expenditure A dministrative Costs of P rivate
Insurance and Public
A dministration
Annual Grow th 1997–2000Annual Grow th 2000–2001Annual Grow th 2001–2002
Source: K. Levit et al., “Health Spending Rebound Continues in 2002,” Health Affairs (January/February 2004): 147–159.
Percent
14

THE COMMONWEALTH
FUND
Private Insurance Administrative Costs as a Percent of Private Insurance Outlays and Public Program
Administration as a Percent of Public Outlays, 2002
12.8
4.9
0
5
10
15
P rivate insuranc e adminis tration P ublic adminis tration
Percent
Source: K. Levit et al., “Health Spending Rebound Continues in 2002,” Health Affairs (January/February 2004): 147–159.
15

THE COMMONWEALTH
FUND
Out-of-Pocket Costs to Patients Are a Major Expense, 1970–2002
25.1
58.2
146.9
212.5
0
50
100
150
200
250
1970 1980 1993 2002
Dollars, billions
Source: K. Levit et al., “Health Spending Rebound Continues in 2002,” Health Affairs (January/February 2004): 147–159.
16
THE COMMONWEALTH
FUND
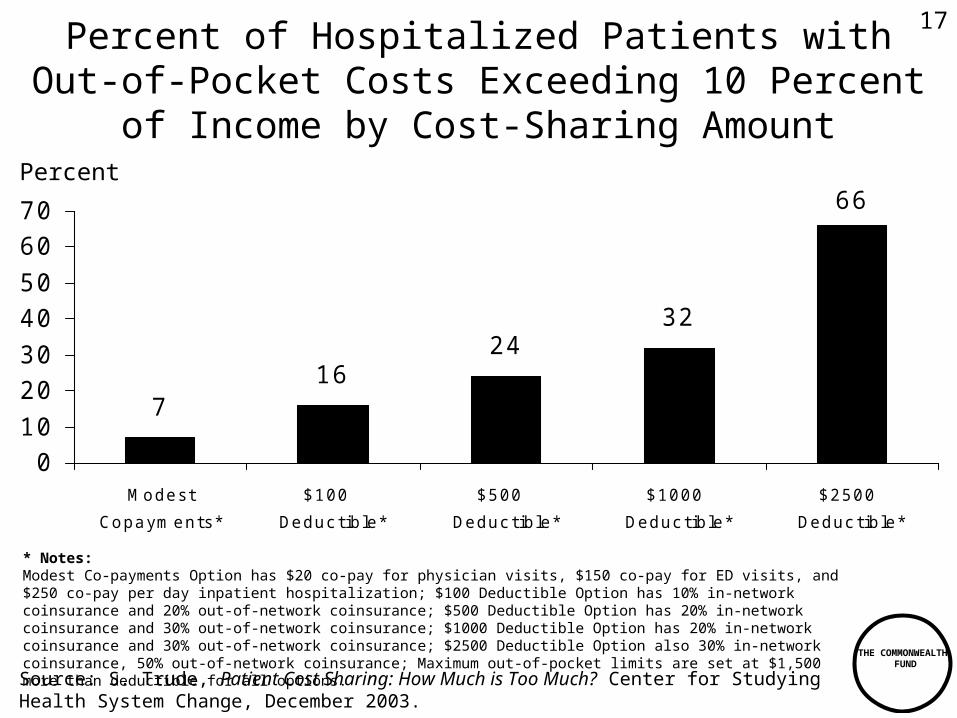
Percent of Hospitalized Patients withOut-of-Pocket Costs Exceeding 10 Percent
of Income by Cost-Sharing Amount
Source: S. Trude, Patient Cost Sharing: How Much is Too Much? Center for Studying Health System Change, December 2003.
716
2432
66
010
2030
4050
6070
Modest
Copayments*
$100
Deduc tible*
$500
Deduc tible*
$1000
Deduc tible*
$2500
Deduc tible*
Percent
* Notes:Modest Co-payments Option has $20 co-pay for physician visits, $150 co-pay for ED visits, and $250 co-pay per day inpatient hospitalization; $100 Deductible Option has 10% in-network coinsurance and 20% out-of-network coinsurance; $500 Deductible Option has 20% in-network coinsurance and 30% out-of-network coinsurance; $1000 Deductible Option has 20% in-network coinsurance and 30% out-of-network coinsurance; $2500 Deductible Option also 30% in-network coinsurance, 50% out-of-network coinsurance; Maximum out-of-pocket limits are set at $1,500 more than deductible for all options.
17
THE COMMONWEALTH
FUND
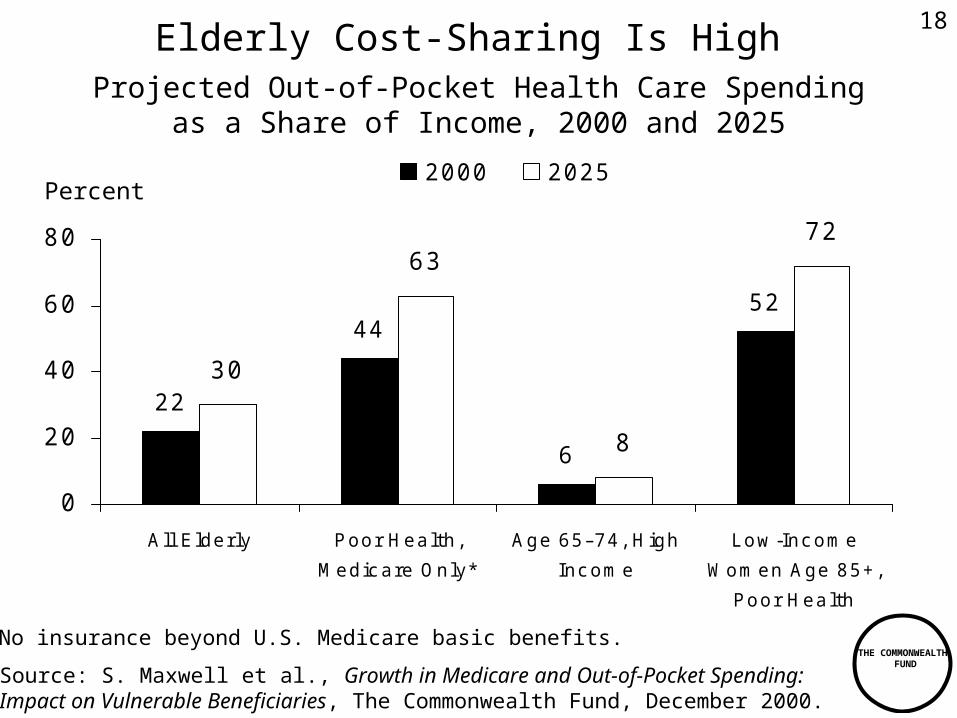
52
6
44
22
72
8
63
30
0
20
40
60
80
A ll E lderly P oor Health,
Medic are Only*
A ge 65–74, H igh
Inc ome
L ow -Inc ome
Women A ge 85+,
P oor Health
2000 2025
Elderly Cost-Sharing Is High
Source: S. Maxwell et al., Growth in Medicare and Out-of-Pocket Spending: Impact on Vulnerable Beneficiaries, The Commonwealth Fund, December 2000.
* No insurance beyond U.S. Medicare basic benefits.
Percent
Projected Out-of-Pocket Health Care Spendingas a Share of Income, 2000 and 2025
18

THE COMMONWEALTH
FUND
Cost-Sharing Reduces Likelihood of Receiving Effective Medical Care
56
85
5971
0
20
40
60
80
100
Low -Inc ome in Cost-Sharing P lans H igher-Inc ome in Cost-Sharing
P lans
Children Adults
Source: K.N. Lohr et al., “Use of Medical Care in the RAND HIE,” Medical Care 24, supplement 9 (1986): S1–S87.
Percent
Probability of receiving highly effective care for acute conditions that is appropriate and necessary compared to those with no cost-sharing
19

THE COMMONWEALTH
FUND
Cost-Sharing Reduces Use of Both Essential and Less Essential Drugs and Increases Risk
of Adverse Events
9
1514
22
0
5
10
15
20
25
Essential Less Essential
Elderly Low-Income
Source: R. Tamblyn et al., “Adverse Events Associated With Prescription Drug Cost-Sharing Among Poor and Elderly Person,” Journal of the American Medical Association (January 24, 2001): 421–429.
Percent reduction in drugs per day
117
43
9778
0
20
40
60
80
100
120
140
Adverse Events ED Visits
Elderly Low-Income
Percent increase in incidence per 10,000
20

THE COMMONWEALTH
FUND
16.2
21.3
6.4
10.6
0
5
10
15
20
25
A CE Inhibitors S tatins
Copayments Inc reased Copayments NOT Inc reased
Tiered Prescription Drug Cost-SharingLeads to People Not Filling Prescriptions
Source: H.A. Huskamp et al., “The Effect of Incentive-Based Formularies on Prescription-Drug Utilization and Spending,” New England Journal of Medicine (December 4, 2003): 2224–32.
Percent of enrollees discontinuing use of all drugs in class
21

THE COMMONWEALTH
FUND
Average Annual Growth Rate of Real Health Care Spending per Capita Between 1990 and
2000 in Selected Countries
3.9 3.7
3.2 3.1 3.12.9
2.32.1
1.8
0.0
1.0
2.0
3.0
4.0
J apan U nited
K ingdom
U nited
S tates
Australia OE CD
Median
New
Zealand
Franc e Germany Canadaa
a 1992–2000Source: G. Anderson, et al., Multinational Comparisons of Health Systems Data, 2002.The Commonwealth Fund, October 2002.
Percent
22
THE COMMONWEALTH
FUND
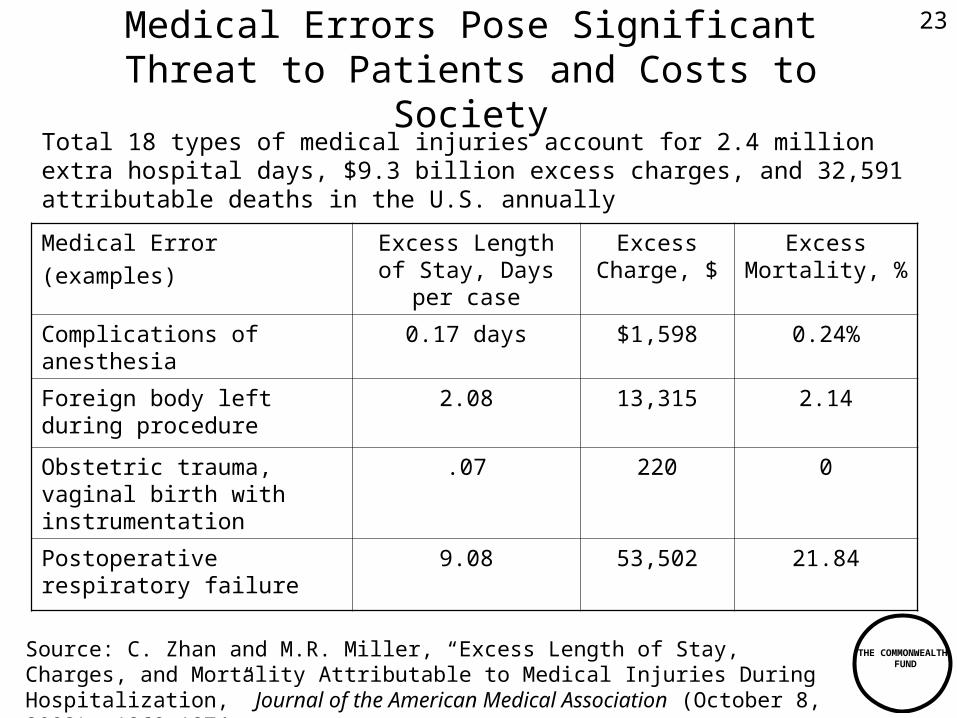
Medical Errors Pose Significant Threat to Patients and Costs to Society
Medical Error(examples)
Excess Length of Stay, Days per
case
Excess Charge, $
Excess Mortality, %
Complications of anesthesia
0.17 days $1,598 0.24%
Foreign body left during procedure
2.08 13,315 2.14
Obstetric trauma, vaginal birth with instrumentation
.07 220 0
Postoperative respiratory failure
9.08 53,502 21.84
Source: C. Zhan and M.R. Miller, “Excess Length of Stay, Charges, and Mortality Attributable to Medical Injuries During Hospitalization,” Journal of the American Medical Association (October 8, 2003): 1868–1874.
Total 18 types of medical injuries account for 2.4 million extra hospital days, $9.3 billion excess charges, and 32,591 attributable deaths in the U.S. annually
23

THE COMMONWEALTH
FUND
Care Coordination in Five Nations
In past two years, Percent of sicker adults:
AUS CAN NZ UK US
Sent for duplicate tests by different health professionals
13% 20% 17% 13% 22%
Medical records/test results did not reach doctor’s office in time for appointment
14 19 16 23 25
Medical errors caused serious problems
13 15 14 9 18
Source: 2002 Commonwealth Fund International Health Policy Survey of Sicker Adults.
24

THE COMMONWEALTH
FUND
About Half of U.S. Adults ReceiveRecommended Care
Adherence to Quality Indicators Varies Significantly by Medical Condition
Source: E.A. McGlynn et al., “The Quality of Health Care Delivered to Adults in the United States,” New England Journal of Medicine 348 (June 26, 2003): 2635–45.
55
7665
54
39
23
0
20
40
60
80
Overall Breas t Canc er Hypertens ion As thma P neumonia Hip F rac ture
Percent receiving recommended care
25

THE COMMONWEALTH
FUND
Cost and Quality Vary Widely Across Hospitals
Coronary Artery Bypass Graft: Observed/Expected Cost vs. Observed/Expected Quality
Outcomes by Hospital
0.0
0.5
1.0
1.5
2.0
0.0 0.5 1.0 1.5 2.0 2.5
Poor Outcomes - Observed/Expected
Co
st p
er C
ase
- O
bse
rved
/Exp
ecte
d
High Quality Low Quality
High Cost
Low Cost
Source: S. Grossbart, Ph.D., Director, Healthcare Informatics, Premier, Inc., “The Business Case for Safety and Quality: What Can Our Databases Tell Us,” 5 th Annual NPSF Patient Safety Congress, March 15, 2003.
26

THE COMMONWEALTH
FUND
Health Care Costs Concentrated in Sick Few
0%
10%
20%
30%
40%
50%60%
70%
80%
90%
100%
U.S. Population Health Expenditures
1%5%
10%
55%
69%
27%
Source: A.C. Monheit, “Persistence in Health Expenditures in the Short Run: Prevalence and Consequences,” Medical Care 41, supplement 7 (2003): III53–III64.
Distribution of Health Expenditures for the U.S. Population, by Magnitude of Expenditure, 1997
50%
97%
$27,914
$7,995
$4,115
$351
Expenditure Threshold (1997
Dollars)
27
THE COMMONWEALTH
FUND
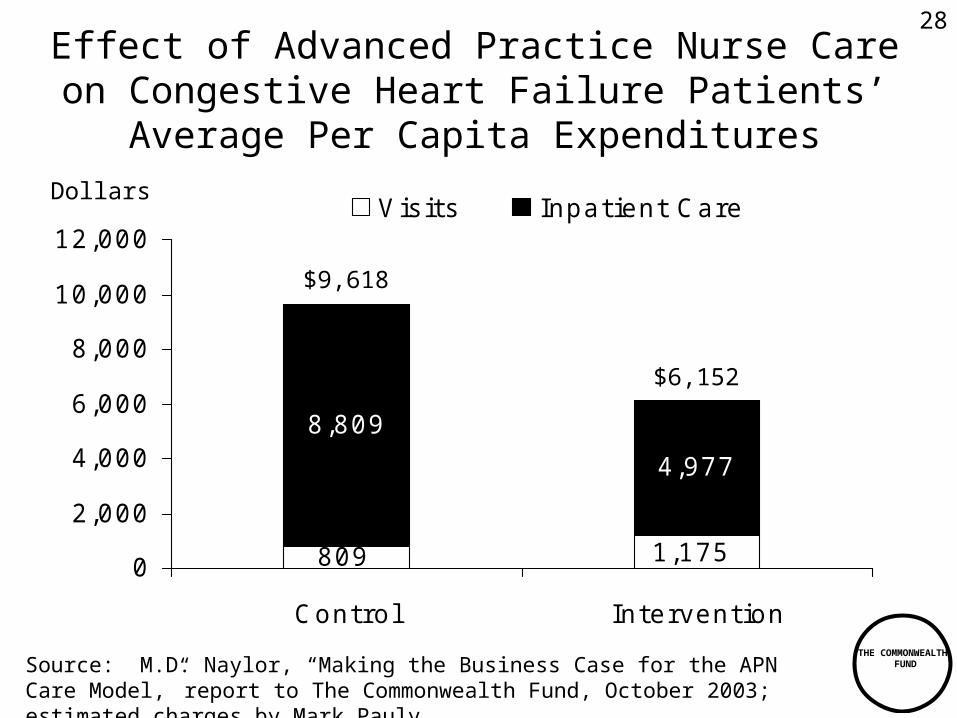
8,809
4,977
809 1,1750
2,000
4,000
6,000
8,000
10,000
12,000
Control Intervention
V is its Inpatient Care
Effect of Advanced Practice Nurse Care on Congestive Heart Failure Patients’ Average
Per Capita Expenditures
Source: M.D. Naylor, “Making the Business Case for the APN Care Model,” report to The Commonwealth Fund, October 2003; estimated charges by Mark Pauly.
Dollars
$9,618
$6,152
28

THE COMMONWEALTH
FUND
Coney Island Hospital’s Asthma Buddy Pilot: Effect on Asthma Hospitalization
(69 Children Ages 8–16 years, 2001–2003)
3.4
0.01
14.4
0.0102468
10121416
Asthma Patients Over 6–mo.
Winter, P rior to Intervention
Asthma Patients Over 6–mo.
Winter, With As thma Buddy
ED V is it Hospitalization
Source: Coney Island Hospital, Asthma Buddy Pilot data, 2003.
Number per Child
(Oct. 2001 – Mar. 2002) (Oct. 2002 – Mar. 2003)
29

THE COMMONWEALTH
FUND
Achieving a High PerformanceHealth System: What It Requires
• Enhanced federal role to promote quality and efficiency:– Public data on provider quality and efficiency– Federal agency to establish clinical guidelines, quality
standards (e.g. NICE, NICS)– Financial rewards to providers for high quality, efficient care– Standards and incentives to adopt IT– Research and demonstrations on cost-effective care, new
incentive payment methods
• Public-private partnership:– Engage entire health care system in continuous quality
improvement– Develop and disseminate quality improvement tools– Identify and spread best practices – Encourage learning collaboratives to improve care– Promote modern information technology– Reward quality and efficiency
30
THE COMMONWEALTH
FUND
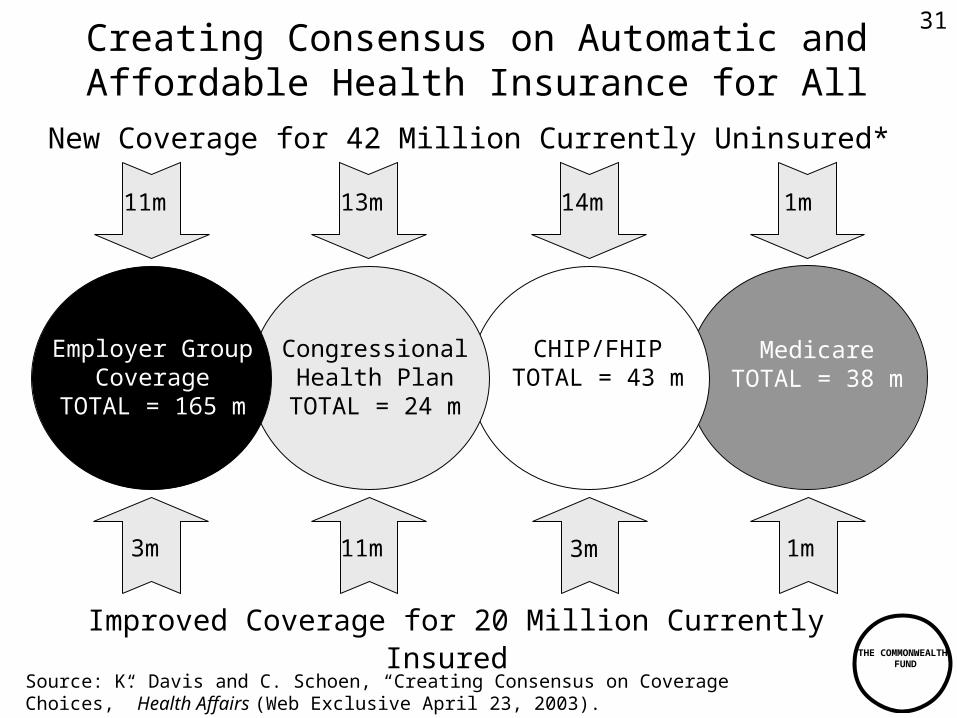
New Coverage for 42 Million Currently Uninsured*
Congressional Health Plan
TOTAL = 24 m
MedicareTOTAL = 38 m
11m 13m
CHIP/FHIPTOTAL = 43 m
Employer Group Coverage
TOTAL = 165 m
14m 1m
Improved Coverage for 20 Million Currently Insured
3m 1m3m 11m
Source: K. Davis and C. Schoen, “Creating Consensus on Coverage Choices,” Health Affairs (Web Exclusive April 23, 2003).
Creating Consensus on Automatic and Affordable Health Insurance for All
31