making connections straight talk about electricity in...
TRANSCRIPT

2005
Making ConnectionsStraight Talk About Electricity in Ontario2018 Energy Conservation Progress Report, Volume One

In 2005, Ontario’s electricity system was a major contributor of greenhouse gas emissions, air pollution and smog.
In 2017, Ontario’s system was 96% emission-free.
Ontario’s clean electricity system is the key to our energy future…

April 2018
The Honourable Dave Levac Speaker of the Legislative Assembly of Ontario
Room 180, Legislative BuildingLegislative AssemblyProvince of OntarioQueen’s Park
Dear Speaker,
In accordance with section 58.1 of the Environmental Bill of Rights, 1993 (EBR), I am pleased to present Volume One of the 2018 Energy Conservation Progress Report of the Environmental Commissioner of Ontario for your submission to the Legislative Assembly of Ontario.
The 2018 Energy Conservation Progress Report, my independent, non-partisan review of Ontario’s progress in conserving energy, will be issued in two separate volumes. This first volume examines the impacts of Ontario’s transition to a low-carbon electricity system. The second volume, to be released later in 2018, will focus on the progress of energy conservation programs in 2016.
In summary, Ontario can be proud of its cleaner, more reliable electricity system, and the resulting improvement in air quality and public health. Since 2005, we have taken the first, indispensable steps in building a low-carbon economy: conservation and minimizing fossil fuel use in electricity generation. Looking ahead, much more conservation and low-carbon electricity will be needed to displace fossil fuels as the climate crisis continues to worsen. Ontario is not yet preparing seriously for this future.
Sincerely,
Dianne SaxeEnvironmental Commissioner of Ontario
1075 Bay Street, Suite 605 Toronto, Canada M5S 2B1 E: [email protected]: 416.325.3377 T: 1.800.701.6454 eco.on.ca
1075, rue Bay, bureau 605 Toronto, Canada M5S 2B1
E: [email protected] T: 416.325.3377
T: 1.800.701.6454 eco.on.ca
1075, rue Bay, bureau 605 Toronto, Canada M5S 2B1
E: [email protected] T: 416.325.3377
T: 1.800.701.6454 eco.on.ca
1075 Bay Street, Suite 605 Toronto, Canada M5S 2B1 E: [email protected] T: 416.325.3377 T: 1.800.701.6454 eco.on.ca

20054 Making Connections: Straight Talk About Electricity in Ontario
C O N T E N T SSummary 6
O N TA R I O ’ S T R A N S I T I O N TO A LO W - C A R B O N E L E C T R I C I T Y SYS T E M
Q1 What’s this report about? 14
Q2 How does Ontario make decisions about its sources of electricity? 22
Q3 How and why has Ontario’s electricity demand changed? 30
Q4 Where does our electricity come from and how has the supply mix changed? 44
I M PAC T O N T H E E L E C T R I C I T Y SYS T E M
Q5 Has Ontario’s electricity system become more reliable and able to meet peak demand? 64
Q6 How does Ontario deal with the variability of wind and solar electricity output? 80
Q7 Why does Ontario export and curtail so much electricity? 94
I M PAC T O N E L E C T R I C I T Y P R I C E S
Q8 How high are Ontario electricity prices? 110
Q9 What do higher electricity costs pay for? 126

2005
I M PAC T O N T H E E N V I R O N M E N T
Q10 What are the environmental impacts of Ontario’s electricity sources? 148
Q11 How much have the coal phase-out, renewable electricity, and conservation reduced greenhouse gas emissions? 162
Q12 How much did the coal shutdown reduce pollution in Ontario? 178
O N TA R I O ’ S E L E C T R I C I T Y F U T U R E
Q13 What does the 2017 Long-Term Energy Plan propose for Ontario’s electricity future? 198
Q14 What are the consequences of the Long-Term Energy Plan’s commitment to nuclear power? 210
Q15 How much of Ontario’s energy system must be electrified to meet Ontario’s legal greenhouse gas limits? 228
Q16 How can Ontario make full use of clean off-peak electricity and prevent it from going to waste? 246
Q17 What impact will Ontario’s electricity market redesign have on the cost and greenhouse gas emissions of our electricity system? 270
Q18 What impact will net metering have on the future of renewable electricity in Ontario? 284
Q19 What is the value of conservation? 304

Summary
Dianne Saxe Environmental Commissioner of Ontario
This report answers 19 questions about electricity in Ontario. Each question and answer is a separate report chapter. The chapters are grouped into five sections:
Ontario’s Transition to a Low-Carbon Electricity System
Impact on the Electricity System
Impact on Electricity Prices
Impact on the Environment
Ontario’s Electricity Future
Throughout this report, section icons and question numbers are used to indicate that additional information can be found in other report chapters. For example, Q10 is a cross-reference to question 10 within the “Impact on the Environment” section.
Why is our electricity system so important?
Electricity provided only 20% of Ontario’s energy in 2015. But low-carbon electricity is the key to Ontario’s energy future.
Electricity is the smallest and greenest of Ontario’s energy sources, providing only 20% of Ontario’s energy in 2015. Because the other 80% comes almost entirely from fossil fuels (natural gas and petroleum products for heating, transportation and industry), electricity is the key to our energy future.
Ontario’s energy use, by fuel type in 2015, including demand reduced by utility-run conservation programs.
Natural Gas Conservation Programs
Natural Gas
Transportation Fuel
Other Fuels
Propane
Oil
Fossil-Based Fuels
Electricity
Electricity Conservation Programs
1%(21 PJ)
1%(33 PJ)
1%(31 PJ)
2%(54 PJ)
37%(904 PJ)
39%(933 PJ)
20%(494 PJ)
2%(36 PJ)
Electricity
Transportation Fuel
Natural Gas
Natural Gas Conservation Programs
Natural Gas
Transportation Fuel
Other Fuels
Propane
Oil
Fossil-Based Fuels
Electricity
Electricity Conservation Programs
1%(21 PJ)
1%(33 PJ)
1%(31 PJ)
2%(54 PJ)
37%(904 PJ)
39%(933 PJ)
20%(494 PJ)
2%(36 PJ)
Natural Gas Conservation Programs
Natural Gas
Transportation Fuel
Other Fuels
Propane
Oil
Fossil-Based Fuels
Electricity
Electricity Conservation Programs
1%(21 PJ)
1%(33 PJ)
1%(31 PJ)
2%(54 PJ)
37%(904 PJ)
39%(933 PJ)
20%(494 PJ)
2%(36 PJ)
6 Making Connections: Straight Talk About Electricity in Ontario

2005 2017
74% 96%
Greenhouse gas emissions from burning fossil fuels are the major cause of climate change, the defining challenge of our time. Governments of the world have agreed to dramatically reduce these emissions. Key first steps include increasing conservation, and minimizing fossil fuel use in the electricity system. Second steps are to convert other fossil fuel uses to low-carbon electricity, plus even more conservation.
Ontario is midway through this crucial transformation. In 2005, Ontario had a creaking, highly indebted, high-polluting electricity system that strained to meet demand. Coal-fired electricity looked cheap on the power bill but came at a high cost to the environment, the climate and human health. This could not continue.
Today, Ontario has a more expensive but a more reliable, cleaner electricity system that was 96% carbon-emission free in 2017. This transformation has created dramatic changes and opportunities for those who provide Ontario’s electricity, for all of us who depend on that system, for the economy and for our natural environment. And much more change is ahead.
This report, the first volume of the ECO’s 2018 Energy Conservation Progress Report, analyzes this transformation. Volume Two (to be released in summer 2018) will focus on the progress of conservation programs in 2016.
Ontario’s electricity system went from 74%low-carbon generation in 2005 to 96%
low-carbon generation in 2017
Where does our electricity come from?
Mostly nuclear, plus hydro (water), wind, natural gas and solar. Plus conservation.
Since 2005, Ontario has replaced coal and added capacity with nuclear, solar, wind, hydro (water) and natural gas generation facilities. Conservation has helped reduce demand. In 2016, conservation and new renewable power equalled most of the electricity formerly provided by coal. ( Q3, Q4)
Coal provided 29.3 TWh ofelectricity in Ontario in 2005.
In 2016, conservation, wind, solar and additional hydro
provided about the same amount.
Ontario uses different sources of electricity at different times. Demand swings from high to low at different times of day, weekdays versus weekends, and as seasons change. Peak electricity use on the hottest days and coldest evenings can be more than double off-peak electricity use. ( Q3) Peak demand has an outsized impact on Ontario electricity costs. ( Q9)
Natural Gas Conservation Programs
Natural Gas
Transportation Fuel
Other Fuels
Propane
Oil
Fossil-Based Fuels
Electricity
Electricity Conservation Programs
1%(21 PJ)
1%(33 PJ)
1%(31 PJ)
2%(54 PJ)
37%(904 PJ)
39%(933 PJ)
20%(494 PJ)
2%(36 PJ)
Coal (29.3 TWh)
2005
Coal provided 29.3 TWh ofelectricity in Ontario in 2005.
In 2016, conservation, wind, solar and additional hydro
provided about the same amount.
Solar(3.5 TWh)
Wind(10.7 TWh)
29.3 TWh
2016
Conservation(12.3 TWh)
Additionalhydro (2.8 TWh)
74%
2005 2017
Ontario’s electricity system went from 74%low-carbon generation in 2005 to 96%
low-carbon generation in 2017
96%
Coal (29.3 TWh)
2005
Solar(3.5 TWh)
Wind(10.7 TWh)
29.3 TWh
2016
Conservation(12.3 TWh)
Additionalhydro (2.8 TWh)
7Environmental Commissioner of Ontario 2018 Energy Conservation Progress Report, Volume One
Summary

In most hours of the year, Ontario uses little or no gas-fired generation. When demand is low (e.g., nights, weekends, spring and fall), nuclear, water and wind provide the power. Solar helps on sunny days. When demand is high, Ontario uses all its sources of power, including natural gas. ( Q3, Q4)
How well does Ontario’s electricity system work?
Much better than in 2005.
Ontario’s electricity system is in much better shape than it was in 2005. Ontario is self-sufficient, with about the right amount of reliable power available for peak demand, with no brownouts or emergency appeals to reduce electricity use. ( Q5)
After conservation, which source of power is best?
Every source of electricity has advantages and disadvantages.
Ontario's Electricity by the Numbers
Hourly electricity demand patterns over a week in January, April and July-August of 2017.
27,961solar projects
210waterpower
facilities
18nuclearreactors
66bioenergyprojects
0coal plants
16,000+home and business
retrofits (2016)
29natural gas
plants
2,465wind turbines
Ontario’sElectricity
by theNumbers
10,000
12,000
14,000
16,000
18,000
20,000
Sun
12 a
mSu
n 6
amSu
n 12
pm
Sun
6 pm
Mon
12
amM
on 6
am
Mon
12
pmM
on 6
pm
Tues
12
amTu
es 6
am
Tues
12
pmTu
es 6
pm
Wed
12
amW
ed 6
am
Wed
12
pmW
ed 6
pm
Thur
s 12
amTh
urs 6
am
Thur
s 12
pmTh
urs 6
pm
Fri 1
2 am
Fri 6
am
Fri 1
2 pm
Fri 6
pm
Sat 1
2 am
Sat 6
am
Sat 1
2 pm
Sat 6
pm
Sun
12 a
m
Elec
trici
ty D
eman
d (M
W)
Hours of the week
Jan-17 Apr-17 July-Aug 17
8 Making Connections: Straight Talk About Electricity in Ontario
27,961solar projects
210waterpower
facilities
18nuclearreactors
66bioenergyprojects
0coal plants
16,000+home and business
retrofits (2016)
29natural gas
plants
2,465wind turbines

Nuclear
Nuclear power provides most of Ontario’s electricity, with no air pollution or greenhouse gas emissions and a relatively low cost per kilowatt-hour. To justify refurbishment of the Bruce and Darlington nuclear reactors, Ontario has committed to buy billions of dollars of power from them every year until 2064. ( Q14)
Nuclear power has risks that Ontario must balance against Ontario’s share of the grave consequences of climate change. Ontario has made a heavy commitment to nuclear while largely abandoning renewables. Nuclear power may not be cheaper than renewables over the long run. ( Q14, Q16)
Waterpower (hydro)
Ontario’s electricity system was originally built on waterpower, starting with Niagara. Most accessible Ontario waterpower sites were developed long ago, and provide Ontario’s cheapest electricity. Some existing sites have added capacity since 2005, and there is underused storage capacity. Ontario has a weak approval process for waterpower with no public hearings, despite the serious ecosystem disruptions that dams often cause. Waterpower’s environmental footprint is usually lower if it takes place at sites that have already been altered. ( Q4, Q10)
Natural gas
Natural gas-fired electricity can be turned on and off at will, which makes it useful for meeting peak demand and as backup power. Importing the gas drains money out of Ontario. Its price fluctuates on international markets beyond Ontario’s control; in 2005, it was much more expensive than it is now. ( Q4) Natural gas is a fossil fuel that causes air and greenhouse gas pollution; upstream methane emissions are potent greenhouse gases. ( Q11)
Wind and solar
Wind and solar do not cause air pollution or greenhouse gas emissions and are the world’s fastest growing sources of electricity. Costs started high, but they are increasingly competitive with fossil fuels and nuclear power. ( Q4, Q9)
The Green Energy Act, 2009, fulfilled its key objectives of growing distributed renewable power and a renewable electricity industry, although not as much as planned. Having a Feed-in Tariff was the international best practice, and the rates paid were reduced as costs fell. ( Q9)
Wind turbines can have adverse impacts, especially on birds and bats. Appropriate siting helps minimize these impacts. ( Q10)
The contributions of solar and wind are systematically underrepresented in some public reports. For example, the 87% of solar power and the 12% of wind power that are embedded (connected to local distribution utilities instead of the bulk grid) are not included in the Independent Electricity System Operator’s real-time online energy reporting (Power Data). ( Q4)
With the end of procurements such as the FIT program, Ontario has largely abandoned its renewable electricity industry, though customers may still generate some of their own power, through net metering. ( Q17, Q18)
Aren’t solar and wind too variable? Ontario can use them well, as others do.
Ontario’s electricity system is successfully integrating wind and solar power. For example, solar power helps meet peak summer demand, the most expensive to serve. ( Q6)
9Environmental Commissioner of Ontario 2018 Energy Conservation Progress Report, Volume One
Summary

As renewable electricity grows, Ontario will need more ways to match supply and demand, including storage and more flexible pricing. Ontario can learn how from other jurisdictions who use much more wind and solar electricity than we do. ( Q6, Q16)
How much good did phasing out coal do?
A lot, actually.
Taking coal out of electricity dramatically reduced Ontario’s greenhouse gas emissions, and has improved air quality and public health. ( Q11, Q12)
Almost all of Ontario electricity’s remaining greenhouse gas emissions and air pollution come from natural gas-fired power plants, which are used mostly to meet peak demand. ( Q4, Q11)
Smog over downtown Toronto
Ontario historical GHG emissions by economic sector relative to 1990 levels.
Why does electricity cost what it does?
There are many good reasons. And some bad ones.
There are many good reasons why Ontario electricity prices have gone up and will rise further.
Ontario’s cleaner, more reliable electricity system costs about $21 billion each year, up from about $15 billion in 2006. Most of the extra cost is for additional generation capacity. All new sources of power (except conservation) cost more than the old ones, partly because of inflation. Building electricity infrastructure with private capital also costs more than building it with publicly guaranteed debt, as Ontario Hydro used to do. ( Q9)
Nuclear, solar and wind power have contributed the most to the rise in rates. Going forward, nuclear costs will rise and solar and wind power costs will fall. ( Q9)
0%
50%
100%
150%
200%
1990 1995 2000 2005 2010 2015
Rela
tive
to 1
990
Transportation
Industry
Buildings
Agriculture
Waste
Electricity
10 Making Connections: Straight Talk About Electricity in Ontario

Electricity source as a share of generation costs, and share of generation (Ontario, 2016).
Note that additional hydro and wind power was available at no extra cost but was not used as supply. See Q7.
In setting the Feed-in Tariff rates for solar and wind electricity, the government balanced multiple public policy goals, including encouraging small-scale and community power, economic development and environmental protection. Ontario’s climate makes wind and solar more expensive here than in many other places. The Green Energy Act added costs and delays, including an elaborate process of environmental approvals, a unique third-party right of appeal to the Environmental Review Tribunal and, initially, domestic content requirements. ( Q9, Q10 )
There are also some bad reasons for today’s electricity prices. The Environmental Commissioner of Ontario, the Financial Accountability Officer and the Auditor General of Ontario have all documented mistakes in Ontario’s energy policy and implementation, some of which affect rates. For example, the relocation of gas plants from Oakville and Mississauga will cost about $40 million a year for 20 years after 2017, increasing system costs about a fifth of one percent (0.2%). Past nuclear plant cost overruns added about seven-tenths of a cent ($0.007) per kilowatt-hour until March 31, 2018. On the other hand, the sale of Hydro One has not materially affected electricity rates. ( Q9 )
Today’s electricity customers pay only 80% of the cost of the electricity system through their electricity bills. The other 20% has been shifted to taxpayers and to future ratepayers, who will also pay $21 billion in interest on money the province has borrowed under the Fair Hydro Plan. ( Q9) Electricity rates will go up again after 2021, when the borrowed money must start to be repaid. ( Q13)
Why conserve?
Why bother conserving? To save money, to reduce emissions at peak, and to make electricity available to replace fossil fuels.
The average Ontario household uses 13% less electricity today than it did in 2005. This has helped to buffer the impact of higher electricity rates. ( Q8 )
Electricity conservation remains the cheapest way to match supply and demand, but Ontario needs to focus more on conserving electricity when demand is high (e.g., hot summer weekdays and cold winter evenings). ( Q19)
Electricity production and conservation by resource, 2005-2016.
Nuclear, 45%Nuclear, 58%
Hydro, 15%
Hydro, 23%Gas/Oil, 15%
Gas/Oil, 8%Wind, 12%
Wind, 7%Solar, 12%Solar, 2%Bioenergy, 2%
Bioenergy, 0.4%
Other, 0.5% Other, 0.4%
0%
10%
20%
30%
40%
50%
60%
70%
80%
90%
100%
Electricity source as % of generation costs (2016) Electricity source as % of generation (2016)
0
20
40
60
80
100
120
140
160
180
2005 2006 2007 2008 2009 2010 2011 2012 2013 2014 2015 2016
TWh
Nuclear Waterpower Natural Gas/Oil Bioenergy/otherCoal Solar Wind Conservation
11Environmental Commissioner of Ontario 2018 Energy Conservation Progress Report, Volume One
Summary

Is there a surplus?
Why does Ontario sell cheap power to the U.S.? Because it turns spare capacity into money.
When demand is low, Ontario often has surplus power. This off-peak surplus is a natural consequence of an electricity system based on nuclear and renewables, because supply is not determined by demand. The surplus may largely disappear after 2020. ( Q7)
Ontario exports surplus power for more than it costs us to generate that power; Ontario does not lose money by exporting. But there are better options for using this power in Ontario, such as storage, charging electric vehicles and making hydrogen (“power to gas”). Flexible pricing would encourage demand to shift to when there is surplus power. ( Q16)
What’s ahead?
We need more clean electricity and conservation to replace natural gas, gasoline and diesel. But Ontario is not getting ready.
The limits on greenhouse gas pollution in Ontario’s Climate Change Mitigation and Low-carbon Economy Act mean that more than 40% of the fossil fuels now used for heating and transportation must be replaced by conservation, active transportation, biofuels, direct renewable energy and low-carbon electricity over the next 13 years, within the lifetime of today’s vehicles and furnaces. This means that low-carbon electricity supply must increase much more than the government plans. ( Q15 )
The Ontario government is not prepared for this transformation. The 2017 Long-Term Energy Plan mostly ignores the urgency of climate change and the 80% of Ontario’s energy that comes from fossil fuels. ( Q13 )
Ontario’s current plans for obtaining future electricity supplies (other than nuclear) may save money in the short run if electricity demand remains flat. But they will discourage the growth of renewable electricity, may not save money if demand grows, and may not produce the low-pollution, low-carbon electricity supply that Ontario will need. ( Q15, Q17, Q18 )
12 Making Connections: Straight Talk About Electricity in Ontario

Summary of ECO recommendationsThe ECO recommends that:
1. Ontario’s Long-Term Energy Plan should berequired by law to be consistent with the ClimateChange Mitigation and Low-carbon EconomyAct. It should plan Ontario’s energy system, notjust electricity, and should prepare for significantelectrification of transportation and heating.
2. Conservation should play a larger role than it doesnow and should be focussed on times of highdemand. It will have more value as demand grows.
3. Ontario should do more to minimize adverseimpacts of electricity generation, such as bird andbat kills by wind turbines.
4. To help people who are unduly affected byelectricity rates, low-income and Aboriginal financialsupport programs should be supplementedwith enhanced conservation programs to makeelectrically heated homes more efficient.
5. Ontario should learn from jurisdictions whoalready use much more renewable electricity,and update electricity infrastructure and energysystem regulations to encourage the low-carbontransformation. For example:
a. Ontario should get better at using flexibilitytools, such as storage, demand response,interties and prices, to match supply anddemand, instead of turning off (curtailing)low-carbon off-peak electricity and runninggas-fired generation at peak.
b. Net metering and Market Renewal shouldprovide sufficient incentives to grow renewableelectricity as needed to keep Ontario’selectricity supply low-carbon.
c. Local distribution utilities should facilitate agrowing level of renewable generation andstorage.
An energy system that meets our climateobligations by 2030 could mean:
much more conservation/efficiency
40% less fossil fuel use
2030 (ECO model)Today
equi
vale
nt T
Wh
900
800
700
600
500
400
300
200
100
0
Energy use
35% more electricity use
more renewable fuel use
13Environmental Commissioner of Ontario 2018 Energy Conservation Progress Report, Volume One
Summary

2005
O N TA R I O ’ S T R A N S I T I O N TO A LO W - C A R B O N E L E C T R I C I T Y SYS T E M
Q U ES T I O N 1
What’s this report about?
Ontario’s transition to a low-carbon electricity system.
Ontario electricity prices have been a subject of much public concern, but it is important to put them into context. In 2005, Ontario had a polluting electrical system that was straining to meet demand, had accumulated a large debt and deferred much-needed investments; today we have a more expensive but much greener and more reliable system that opens the door to a low-carbon economy. Replacing coal-fired electricity with nuclear, renewables, conservation, and natural gas has cleaned the air, reduced greenhouse gas emissions, and increased electrical grid capacity and resilience.
To meet Ontario’s climate obligations, low-carbon electricity and conservation must steadily replace much of the fossil fuel that Ontario now uses (e.g., for transportation and heating). Fuel switching and conservation must increase for the foreseeable future, dramatically increasing electricity’s share of Ontario’s energy supply within the working lifetime of today’s vehicles and furnaces.
This report examines the first low-carbon transition, and its impact on our electricity system, electricity prices, and the environment. It also assesses how to apply the lessons learned as Ontario moves into its next low-carbon transition.

Contents
Structure of this report . . . . . . . . . . . . . . . . . . . . . . . . . . . . . . . . . . . . . . . . . . . . . . . . . . . . . . . . . . . 15
THE DETAILS . . . . . . . . . . . . . . . . . . . . . . . . . . . . . . . . . . . . . . . . . . . . . . . . . . . . . . . . . . . . . . . . . . . 16
Purpose of this report . . . . . . . . . . . . . . . . . . . . . . . . . . . . . . . . . . . . . . . . . . . . . . . . . . . . . . . . . . . . 16
Context and scope . . . . . . . . . . . . . . . . . . . . . . . . . . . . . . . . . . . . . . . . . . . . . . . . . . . . . . . . . . . . . . 18
Timeline of key events in Ontario’s electricity transition . . . . . . . . . . . . . . . . . . . . . . . . . . . . . . . . 19
Structure of this reportThe report is grouped into five major sections, each containing questions and answers on key topics.
Ontario’s Transition to a Low-Carbon Electricity System looks at changes in Ontario demand, our mix of electricity resources, and the planning process that has made these changes happen.
Impact on the Electricity System looks at how the change in resources has affected the operation and reliability of the grid.
Impact on Electricity Prices looks at how and why electricity prices have gone up.
Impact on the Environment compares the environmental impact of our different energy sources, assesses the impact of the coal phase-out on air quality and public health, and reviews the greenhouse gas emissions reductions achieved by Ontario.
After a brief summary of lessons learned, Ontario’s Electricity Future discusses whether Ontario’s new Long-Term Energy Plan and the redesign of Ontario’s electricity market prepare the energy sector for a low-carbon, highly efficient future. The section also examines:
- The prospects (and barriers) to further electrification of the energy system
- How to prevent renewable electricity from going to waste, and
- What role conservation, renewable electricity (including distributed generation from net metering), and nuclear power will play.
Note to reader: Throughout the report, icons are used to indicate cross-references to other chapters. For example, Q10 is a cross-reference to question 10 within the “Impact on the Environment” section.
15Environmental Commissioner of Ontario 2018 Energy Conservation Progress Report, Volume One
What’s this report about? Q1

The details…
Purpose of this reportA reliable electricity system is a universal requirement for a modern society, and a clean electricity system is an essential requirement of a low-carbon economy.
Ontario’s electricity system in 2018 is very different than the system we had thirteen years ago. By 2005, the Ontario electricity system had been starved of resources for years and reliability was at risk. Ontario’s electricity grid had one of Canada’s lowest prices per kilowatt-hour, but it had a very high carbon footprint, strained to meet demand, and had accumulated a large debt and deferred much-needed investments.
While not caused by Ontario, the 2003 blackout drove home the fragility and under-funding of the system. Investments were urgently needed to increase capacity and reliability, to provide power for a growing population and economy, and to pay the true costs of running the
system. These investments would necessarily increase rates. It was an enormous challenge to, at the same time, shut down and replace the heavily-polluting coal-fired generating stations that supplied 19% of Ontario’s electricity (29 TWh) in 2005.
Today, Ontario has caught up, with a greener, more reliable electricity system. Instead of coal, we now rely on nuclear, waterpower, non-hydro renewables, conservation, and natural gas. As a result, 96% of Ontario’s electricity in 2017 was low-carbon. Low-carbon electricity is an essential first step towards a modern low-carbon economy. Considering Ontario’s comparatively limited waterpower resources, Ontario now produces impressively low-carbon electricity (Figure 1.1).
Figure 1.1. Provincial electricity generation, by resource type (2016).
Note: “Other” includes a small amount of electricity from sources such as biomass and tidal power. The percentages shown do not account for imports and exports. Prince Edward Island obtains the majority of its electricity from imports from New Brunswick, which are not shown here.
Source: Statistics Canada, Electric power generation, by class of electricity producer, Table 127-007 (Ottawa: Statistics Canada).
Ontario now produces impressively low-carbon electricity.
0% 10% 20% 30% 40% 50% 60% 70% 80% 90% 100%Yukon
BCNWT
AltaSask
NunavutMan
Ont
QueNBNSPEINL
Share of electricity generation
Hydro Wind Solar Nuclear Fossil fuel/other
16 Making Connections: Straight Talk About Electricity in Ontario
Q1

What lessons can we learn from Ontario’s electricity transition to date?
The low-carbon transition has created dramatic changes for the system that provides Ontario’s electricity, for all of us who depend on that system, for the economy and for our natural environment. What lessons can we learn from Ontario’s electricity transition to date? This report, the first volume of the ECO’s 2018 Annual Energy Conservation Progress Report, examines the impacts of this transition, positive and negative. Volume Two (to be released in summer 2018) will focus on the progress of conservation programs in 2016.
This report looks both backwards and forwards.
Backwards, to examine the impacts of key electricity policies since the mid-2000s. We use 2005 as an approximate starting point for the low-carbon transition, as it coincides with the first coal plant closure (Lakeview), the launch of provincial conservation
programs, and procurements of cleaner electricity sources to replace coal.
Forwards, using these lessons learned to assess Ontario’s electricity future, particularly in light of the province’s greenhouse gas (GHG) reduction obligations. Electricity is the smallest and greenest of Ontario’s major energy sources, providing only 20% of Ontario’s energy in 2015 (Figure 1.2). Because the other 80% (natural gas and petroleum products for heating, transportation and industry) come from fossil fuels, electricity is the key to our energy future.
Figure 1.2. Share of overall energy use in Ontario, by fuel type, including demand reduced by utility-run conservation programs - fossil-based fuel sources also highlighted (2015).
Note: Conservation savings are only from utility-funded conservation programs, and do not include savings from codes and standards.
Source: Environmental Commissioner of Ontario. Every Joule Counts: Ontario’s Energy Use and Conservation Year in Review (Toronto: ECO, August 2017) at 7.
Natural Gas Conservation Programs
Natural Gas
Transportation Fuel
Other Fuels*
Propane
Oil
Fossil-Based Fuels**
Electricity
Electricity Conservation Programs
1%(21 PJ)
1%(33 PJ)
1%(31 PJ)
2%(54 PJ)
37%(904 PJ)
39%(933 PJ)
20%(494 PJ)
2%(36 PJ)
Electricity
Transportation Fuel
Natural Gas
17Environmental Commissioner of Ontario 2018 Energy Conservation Progress Report, Volume One
What’s this report about? Q1
Context and scopeLast year, we examined the use, conservation opportunities and potential sources of energy in a specific sector, municipal water and wastewater systems. This year, we look instead at some key elements of the big picture – how Ontario’s electricity system has changed in the last 13 years, and where it needs to go in the next 13.
This is a huge topic. In the space available, this report does not (and could not) explore all aspects of Ontario’s very complicated history of electricity policy. The Environmental Commissioner of Ontario’s primary interest is the interaction between Ontario’s electricity policy and climate change, the natural environment and their impacts on Ontarians.
Fortunately, there are many resources available that explore other important questions. For example, the Financial Accountability Officer and the Auditor General of Ontario have both published analyses of some financial aspects of electricity policy. For those interested in the political history of Ontario electricity policy, Prof. Mark Winfield wrote an excellent summary of the last three decades of politicization and policy instability, which have led to high public distrust and low legitimacy in electricity policymaking in Ontario (Winfield, M., and B.MacWhirter, “Competing paradigms, Policy Windows and the Search for Sustainability in Ontario Electricity Policy,” in G.Albo and R.McDermid, eds., “Divided Province: Ontario in the Age of Neo-Liberalism”, Queens-McGill University Press - in press).
One area that we would have liked time to explore in more detail is the impact of energy-related air pollution on human health and Ontario’s economy.
Q12 looks briefly at the impact of the coal plant closures on cleaning up Ontario‘s air. A growing body of research documents the importance of clean air to
human welfare. The Lancet Commission on pollution and health reported that pollution is the largest environmental cause of disease and death in the world today, responsible for an estimated 16% of all deaths. A major study for the Regional Greenhouse Gas Initiative concluded that cleaner air, due to reduced coal use in electricity generation in nine U.S. states, created $3 billion to $8.3 billion US in health benefits, including an estimated 300 to 830 lives saved; 8,200 to 9,900 asthma attacks prevented; 39,000 to 47,000 avoided lost days of work; and 240,000 to 280,000 fewer restricted activity days due to poor air quality.
These kinds of benefits have important economic consequences. For example, employers can expect better productivity when employees are at work an extra 39,000 to 47,000 days, instead of struggling to breathe at home or rushing their children to medical care. Tourism, agriculture and outdoor recreation businesses can expect more customers and healthier workers when there are fewer days when bad air quality restricts outdoor activities.
Aside from the direct impacts of fossil fuel pollution on human health and on physical infrastructure, air pollution has an astonishing array of other impacts. For example, areas with higher levels of air pollution have higher levels of criminal activity and unethical behavior, both violent and nonviolent, as well as higher levels of depression and suicide. We will therefore return to this issue in future reports.
18 Making Connections: Straight Talk About Electricity in Ontario
What’s this report about?Q1

Timeline of key events in Ontario’s electricity transition
2001
Coal Government commitment to close Lakeview coal station
2003
Coal Government commitment to phasing out coal-fired generation entirely
2004
Renewables First renewable energy procurement
Conservation Introduction of conservation programs by local electric utilities
Conservation Commitment to smart metering and time-of-use pricing for all residential electricity customers (essentially complete by 2010)
Energy Policy/Planning Ontario Power Authority established, and given mandate for long-term energy planning
2005
Coal Closure of Lakeview coal station
Nuclear Agreement signed with Bruce Power for refurbishment of Bruce 1 and 2 reactors
Conservation Ontario Power Authority initiates province-wide conservation programs
2006
Energy Policy/Planning Supply Mix directive includes commitment to coal phase-out, and targets for conservation and renewables
Renewables First large wind projects come into service
Renewables “Standard offer program” launched for smaller renewable projects, including solar
Conservation Provincial conservation targets established
19Environmental Commissioner of Ontario 2018 Energy Conservation Progress Report, Volume One
What’s this report about? Q1

2007
Energy Policy/Planning Integrated Power System Plan filed (never approved)
2008
Natural Gas First gas plants developed as part of coal replacement come into service
2009
Nuclear Ontario suspends plans for new nuclear station at Darlington
Energy Policy/Planning Green Energy Act passed to facilitate renewable energy and conservation
Renewables Launch of feed-in tariff program, and related Green Energy Act initiatives to remove barriers to renewables
2010
Conservation Conservation programs extended through 2014, with new budget and framework with larger role for utilities
Natural Gas Decision to relocate planned Oakville gas plant
Energy Policy/Planning Long-Term Energy Plan released
2011
Natural Gas Decision to relocate planned Mississauga gas plant
2012
Nuclear Bruce reactors 1 and 2 complete refurbishments and return to service
2013
Coal Large coal stations at Nanticoke and Lambton closed
Energy Policy/Planning Long-Term Energy Plan released
20 Making Connections: Straight Talk About Electricity in Ontario
What’s this report about?Q1

2014
Coal Coal phase-out completed with closure of Atikokan station
Renewables Return to price-competitive procurements for large renewable projects
Conservation Conservation framework revised and extended to 2020
2015
Coal Former coal plants at Thunder Bay and Atikokan reopen using biomass as fuel
Nuclear Ontario contracts with Bruce Power for refurbishments for up to 6 more reactors
Natural Gas Direction to not pursue contract extensions for existing natural gas units (non-utility generators)
2016
Nuclear Ontario makes initial commitment to Darlington refurbishment (up to 4 reactors) and Pickering life extension
Nuclear Darlington refurbishment begins
Energy Policy/Planning Amendments to the Electricity Act return energy planning authority to Ministry of Energy
Energy Policy/Planning Climate Change Mitigation and Low-carbon Economy Act sets authority for carbon pricing through cap-and-trade system
2017
Renewables End of feed-in tariff program, enhancement of net metering
Conservation Launch of Green Ontario Fund with complementary programs targeting greenhouse gas emissions reductions
Energy Policy/Planning Long-Term Energy Plan released
Energy Policy/Planning Fair Hydro Plan introduced to reduce near-term electricity bills for customers
21Environmental Commissioner of Ontario 2018 Energy Conservation Progress Report, Volume One
What’s this report about? Q1

2005
O N TA R I O ’ S T R A N S I T I O N TO A LO W - C A R B O N E L E C T R I C I T Y SYS T E M
Q U ES T I O N 2
How does Ontario make decisions about its sources of electricity?
The Ministry of Energy has determined what sources of electricity (gas, renewables, nuclear, conservation) Ontario has developed, and how much of each.
Electricity planning in Ontario has been “top-down” with limited public input. The Ministry of Energy develops a Long-Term Energy Plan to guide decision-making, that tries to balance many goals, including cost-effectiveness, reliability, economic benefits, and environmental impact. This planning process has given little attention to energy sources other than electricity. The Independent Electricity System Operator then implements the Ministry’s decisions about electricity.
Ontario’s high electricity demand on hot summer days has been the most important driver for decisions to build new generation and invest in conservation. The outcome of electricity planning has been long-term contracts for nuclear, renewable and gas-fired generation and ongoing funding for conservation. Once generation is built, how often it runs is determined in part by these contracts, and in part by the wholesale electricity market.

Contents
THE DETAILS . . . . . . . . . . . . . . . . . . . . . . . . . . . . . . . . . . . . . . . . . . . . . . . . . . . . . . . . . . . . . . . . . . . 24
The wholesale market does not produce new electricity supply . . . . . . . . . . . . . . . . . . . . . . . . . . 24
New supply has depended on financial guarantees . . . . . . . . . . . . . . . . . . . . . . . . . . . . . . . . . . . . . . 25
Long-term planning. . . . . . . . . . . . . . . . . . . . . . . . . . . . . . . . . . . . . . . . . . . . . . . . . . . . . . . . . . . . . . 26
Will long-term planning play a smaller role in meeting future electricity needs? . . . . . . . . . . . . . 28
Endnotes . . . . . . . . . . . . . . . . . . . . . . . . . . . . . . . . . . . . . . . . . . . . . . . . . . . . . . . . . . . . . . . . . . . . . . 29
23Environmental Commissioner of Ontario 2018 Energy Conservation Progress Report, Volume One
How does Ontario make decisions about its sources of electricity? Q2

The details…
The wholesale market does not produce new electricity supplySince May 2002, Ontario has had a wholesale electricity market operated by the Independent Electricity System Operator (IESO).1 Electricity is bought and sold at fluctuating prices which are determined in real-time by supply and demand. The initial theory was that this market, and its real-time price signal, would be enough to balance supply and demand, while keeping electricity rates to a minimum. If supply was low, prices would rise, and new suppliers would enter the market; and vice versa.
This has not worked. Ontario’s electricity market influences how frequently different resources run to generate electricity (resources with lower marginal operating costs, such as renewables and nuclear, tend to run more often than resources with higher marginal operating costs such as gas-fired generation).2
However, the market has not been effective in ensuring that new electricity generation is built, as and when it is needed. Some reasons are specific to Ontario’s history; others apply to electricity markets everywhere. Like Ontario, most jurisdictions have needed additional tools to ensure sufficient new electricity supply.3
As Q4 describes, Ontario has successfully obtained a massive amount of new electricity supply since 2002, as well as replacing the 20% of the province’s electricity supply that used to come from coal. But it did not happen through the wholesale electricity market. Almost all of the new renewable, nuclear, and natural
gas projects have required some form of financial guarantee or long-term contract under direction from the Ministry of Energy (see textbox “New supply depends on financial guarantees”).4 Conservation programs usually do not require long-term guarantees, but include financial incentives covering part of the cost ( Q19).
Despite its name, the IESO has not been permitted much practical independence on determining the locations and types of new electricity supply.5 Directly and indirectly, the Ministry has controlled Ontario’s electricity supply choices–what type of new resources we invest in (gas, renewables, nuclear, conservation), when, and how much. As the sole shareholder of Ontario Power Generation (OPG), the government and not the IESO shut down the coal plants before their commercial end of life.
The market has not been effective in ensuring that new electricity generation is built.
24 Making Connections: Straight Talk About Electricity in Ontario
Q2

New supply has depended on financial guarantees
Before 1999, Ontario Hydro used loans that were backed by the province to build Ontario’s electricity supply. One of the purposes of breaking up Ontario Hydro was to encourage financing from private sources to take over much of this role.
Private investment requires a reasonable return on investment. Almost no electricity generation would have been built in Ontario without some guarantee to the project developers that they would recoup the cost of the project, plus earn profit.
Since 2002, privately-funded generation has been guaranteed through long-term contracts between the generator and the IESO. Typically, the contract will guarantee the generator either or both:
• a specified payment for each unit of electricity produced, and/or
• a minimum monthly payment.6
The cost of these contracts is paid by customers through their electricity rates.
Typically, the Ministry has set a target for how much new generation (and of what type) it wants, and the Independent Electricity System Operator (IESO) has then awarded contracts for that quantity of generation. The IESO has used different procurement
methods to obtain the specified supply, including competitive procurements, one-on-one negotiations, and “standard offer” programs such as the Feed-in Tariff for renewable electricity ( Q9).
The government guarantees the cost-risk borne by Ontario Power Generation (OPG), which owns and operates the former Ontario Hydro’s nuclear and hydro generating stations, in a different way. Once the Ministry of Energy confirms that a project (e.g., nuclear refurbishment) is in the government’s interest, OPG is allowed to charge a long-term rate for per unit of electricity generated that has been set by the Ontario Energy Board (which is then recovered from customers by the IESO).7 The Board’s role is usually limited to determining whether the costs claimed by OPG are reasonable to deliver the projects.8
The complex interaction between the hourly wholesale electricity market and these cost guarantees result in most of the widely-misunderstood Global Adjustment, which makes up part of electricity rates ( Q8). Electricity conservation programs delivered by the IESO and local electric utilities are also funded through the Global Adjustment. Conservation makes up a small amount (about 4%) of the total Global Adjustment cost. To date, conservation remains the most cost-effective form of generation in the province ( Q19).
25Environmental Commissioner of Ontario 2018 Energy Conservation Progress Report, Volume One
How does Ontario make decisions about its sources of electricity? Q2

Long-term planning Electricity generation facilities typically take years to build (nuclear plants take decades) and even longer to pay for. Decisions on electricity supply choices should therefore be part of a long-term plan to ensure reliable access to electricity, while achieving other public priorities.
Some form of long-term electricity system planning, using a 20-year planning horizon to drive decisions on investments in electricity infrastructure, has existed since 2004. The process has changed over the years, and the Ministry of Energy has reclaimed the lead responsibility. Earlier plans to leave this role to the IESO were abandoned.
Currently, official long-term electricity planning is supposed to be completed every three years by the Ministry of Energy and released in the Long-Term Energy Plan (LTEP). The LTEP usually highlights the current state of the electricity system and establishes projections of electricity demand for the next 20 years. Then it identifies how those demand projections will be met, with the current sources of supply, and the generation facilities that will need to be built. It may also propose some enabling policy changes that support the Plan’s vision. While it is a 20-year plan, the focus is on decisions that need to be made in the next three years. At all stages, the process has had many flaws. For example, the Minister is required by law to:
at least once during each [three year] period… issue a long-term energy plan setting out and balancing the Government of Ontario’s goals and objectives respecting energy for the period specified by the plan.9
Figure 2.1. Covers of the 2010, 2013 and 2017 Long-Term Energy Plans.
Source: Ontario Ministry of Energy.
ONTARIO’S LONG-TERM
ENERGY PLAN 2017
Delivering Fairnessand Choice
Achieving Balance
Ontario’s Long-Term Energy Plan
Ontario’s Long-Term Energy Plan
Building Our Clean Energy Future
26
How does Ontario make decisions about its sources of electricity?
Making Connections: Straight Talk About Electricity in Ontario
Q2

However, current and past plans have always focused on electricity, largely ignoring Ontario’s larger energy (and greenhouse gas) sources such as natural gas and petroleum products. The ECO has repeatedly recommended that the LTEP needs to include all major forms of energy sources.10 Second, the Ministry does not usually explain decisions on the supply mix nor explain how these decisions align with overall LTEP, energy or climate policy goals. Third, the Ministry has not provided opportunities for effective public consultation on these very important public policy discussions.
In addition, some of the biggest electricity planning decisions were made by the Ministry of Energy outside of the Long-Term Energy Plan (although these policy decisions were then incorporated into subsequent Plans). Examples include the 2009 decisions not to build new nuclear plants, to introduce the Green Energy Act and to launch the Feed-in Tariff program for renewable electricity; and the 2016 decision to cancel a procurement in mid-stream for large renewable energy projects.
The LTEP itself is not usually the final word on specific electricity projects. The IESO is responsible for implementing many of the decisions in the LTEP.11 A follow-up directive from the Ministry usually provides specific instructions and authority to the IESO to procure electricity generation (e.g., a specific amount of renewable electricity). The results of some of those Ministry decisions, such as renewable energy and conservation targets, are discussed in Q4. The Ontario Energy Board may also receive directions to implement the LTEP.
Figure 2.2. How supply mix decisions in the Long-Term Energy Plans have been implemented.
For example, the 2013 LTEP made the following commitments:12
• new conservation and demand response targets,supported by program activity
• refurbishment of existing nuclear reactors
• a slow-down in the rate of adding new renewableenergy projects, and
Current and past plans have always focused on electricity, largely ignoring Ontario’s larger energy (and greenhouse gas) sources.
Ministry of Energy releases Long-Term Energy Plan
Sets high-level targets for new electricity resources (e.g., renewables, conservation, natural gas)
Ministry of Energy issues directives to Independent Electricity System Operator (IESO)
- Specifies the amount of a specific electricity resource to be procured (e.g. 100 megawatts of large solar) and often the time frame
- Includes additional policy direction and procurement considerations
- Provides IESO with legal authority to enter contracts and recover funds from electricity ratepayers
IESO procures electricity resources
Using various mechanisms (e.g. competitive procurement, bilateral negotiation, feed-in tariff),
IESO contracts for new resources
Proponents develop projects and bring them into service
New generation added on by the IESO either as baseload or as peaking generation, depending on type of resource
and contract details
27Environmental Commissioner of Ontario 2018 Energy Conservation Progress Report, Volume One
How does Ontario make decisions about its sources of electricity? Q2

• new procurement targets for energy storage and combined heat and power projects.
The latest LTEP was released in October 2017, following two technical reports called the Ontario Planning Outlook and the Fuels Technical Report.13 The ECO commented on this process through a special report, Developing the 2017 Long-Term Energy Plan. The final 2017 LTEP is unusual because it made no commitments to procure new electricity resources.
Q13 discusses the opportunities and shortcomings of the latest LTEP.
What criteria does the Ministry use to make planning decisions?A long-term energy plan may include goals and objectives that consider the following: • the cost-effectiveness of energy supply and capacity,
transmission and distribution
• the reliability of energy supply and capacity, transmission and distribution, including resiliency to the effects of climate change
• the prioritization of measures related to the conservation of energy or the management of energy demand
• the use of cleaner energy sources and innovative and emerging technologies
• air emissions from the energy sector, taking into account any projections respecting the emission of greenhouse gases developed with the assistance of the IESO
• consultation with aboriginal peoples and their participation in the energy sector, and the engagement of interested persons, groups and communities in the energy sector, and
• other matters determined by the Minister.
For electricity, the Ministry’s first responsibility is to make sure Ontario will have sufficient, reliable power at all times of the day and year, for the next 20 years. The need to meet future peak electricity demand (usually on the hottest days of the year) has often driven decisions on electricity generation or conservation. Peak demand is usually the most difficult and the costliest to meet.
However, ability to meet peak demand is not the only factor. The planned supply mix must also provide power for electricity use all year, while considering financial and environmental costs. For example, a natural gas generation plant might be good to meet a limited amount of peak demand, but would not be a wise choice to provide baseload electricity, since its fuel cost is high and the greenhouse gas impact even higher.
The LTEP should also be consistent with other government economic and environmental priorities and obligations, including the Climate Change Mitigation and Low-carbon Economy Act, 2016. The 2017 LTEP is not ( Q15).
Will long-term planning play a smaller role in meeting future electricity needs?Top-down planning by the Ministry and long-term contracts may become less important in deciding the future supply mix. The IESO is looking to supplement the real-time electricity market with a new market, known as a capacity market, that might be able to procure some types of new resources to be without long-term contracts. This is part of the IESO’s Market Renewal initiative ( Q17).
The LTEP should be consistent with the Climate Act.
28
How does Ontario make decisions about its sources of electricity?
Making Connections: Straight Talk About Electricity in Ontario
Q2

Endnotes
1 Prior to that time, Ontario Hydro provided most of Ontario’s electricity. (Independent Electricity System Operator, Overview of the IESO-administered Markets (Toronto: IESO, July 2017) at 5.)
2 However, this can be influenced by contract design. Older gas-fired generators had contracts that encouraged them to run at all hours, regardless of the market price, as they were fully compensated through out-of-market payments.
3 Some reasons include: • the risk of legacy generation or new generation procured
“out-of-market” dampening the market price • policy uncertainty as to whether governments will allow real-time
electricity prices to rise to the high levels that might be needed to balance supply and demand, and
• the long lead time and regulatory uncertainty in developing new electricity projects.
Alberta, one of the few jurisdictions that used its wholesale electricity market as the only income source for electricity generators, is now supplementing this with other tools, in order to ensure future reliability and meet additional policy goals, such as a cleaner supply mix. (Alberta Electric System Operator, Alberta’s Wholesale Electricity Market Transition Recommendation (Alberta: Calgary, October 2016) at 2.)
4 A minor exception is small-scale “behind-the meter” generation where a home or business may build generation to reduce their cost of purchasing electricity from the grid. Examples include combined heat and power at some industrial facilities, and net metered solar projects, discussed in Q18.
5 Environmental Commissioner of Ontario, Conservation Let’s Get Serious, Annual Energy Conservation Progress Report 2015/16 (Toronto: ECO, May 2016) at 23-24.
6 For example, newer contracts for gas-fired generation are structured to pay only for electricity produced during times of peak demand, since gas-fired electricity is only needed a minority of the time (17% of all hours in 2017). The minimum monthly payment helps ensure that gas-fired generators recover their capital costs, even if the plant is not called on to operate very frequently.
7 Ontario Energy Board Act, 1998, s 78.1.
8 The Board also regulates the rates for electricity distribution and transmission. For distributors in particular, there is often less top-down policy direction from the Ministry of Energy, and the Board must exercise its judgement in determining whether a proposed investment is in the public interest and should be approved for rate recovery.
9 Electricity Act, 1998, s 25.29.
10 Environmental Commissioner of Ontario, Developing the Long-Term Energy Plan, a Special Report to the Legislative Assembly of Ontario (Toronto: ECO, December 2016) at 13.
11 In addition to resource procurement, the IESO also oversees the daily real-time management of the electricity system and is responsible for managing the province’s electricity conservation programs. The IESO also does shorter-term planning, through a quarterly technical report called the 18-Month Outlook that reviews the immediate electricity needs and assesses if there are sufficient electricity resources to meet those needs.
12 Ontario Ministry of Energy, Achieving Balance, Ontario’s Long-Term Energy Plan (Toronto: Ministry of Energy, December 2013) at 4-6.
13 While the former provided a 10-year review and a 20-year outlook of various scenarios for Ontario’s electricity system, the latter focused on the demand and supply for all other fuels used extensively in the province. The reports present a wide range of possible demand outlooks that depend on economic and demographic factors, technology enhancements and other public policy implementations, and highlights several different options on how to meet the demand projections.
14 Electricity Act, 1998, s 25.29(2).
.
.
.
.
.
.
.
.
.
.
.
.
.
.
29Environmental Commissioner of Ontario 2018 Energy Conservation Progress Report, Volume One
How does Ontario make decisions about its sources of electricity? Q2

2005
Q U ES T I O N 3
How and why has Ontario’s electricity demand changed?
Ontario saw a sharp drop in both peak electricity demand and overall electricity use with the 2008/2009 recession. Since then, demand has largely held steady, despite population and economic growth. Conservation has played a key role in keeping peak demand and annual electricity use flat.
Electricity demand in Ontario follows several cyclical patterns: a daily cycle (higher during the day, particularly late afternoon/early evening), a weekly cycle (higher on weekdays), and a seasonal cycle (higher in winter and summer). The times of greatest electricity use during the year (peak demand) occur when these cycles coincide and are accompanied by extreme weather– hot summer weekday afternoons, or cold winter weekday evenings. Electricity use at times of peak demand can be more than double Ontario’s minimum electricity demand. These patterns of electricity demand shape how much electricity generation we need, and how often each type is used.
Without electricity conservation, including utility programs and energy codes and standards, the province’s annual electricity use would have been almost 9% higher and peak demand would have been 16% higher. Electricity use in the industrial sector has also fallen, due in part to structural changes.
O N TA R I O ’ S T R A N S I T I O N TO A LO W - C A R B O N E L E C T R I C I T Y SYS T E M

Contents
THE DETAILS . . . . . . . . . . . . . . . . . . . . . . . . . . . . . . . . . . . . . . . . . . . . . . . . . . . . . . . . . . . . . . . . . . . 32
Total electricity demand vs. peak demand . . . . . . . . . . . . . . . . . . . . . . . . . . . . . . . . . . . . . . . . . . . 32
Annual electricity demand . . . . . . . . . . . . . . . . . . . . . . . . . . . . . . . . . . . . . . . . . . . . . . . . . . . . . . . . 32
Patterns of electricity use. . . . . . . . . . . . . . . . . . . . . . . . . . . . . . . . . . . . . . . . . . . . . . . . . . . . . . . . . 33
Ontario’s peak demand . . . . . . . . . . . . . . . . . . . . . . . . . . . . . . . . . . . . . . . . . . . . . . . . . . . . . . . . . . . 35
Trends in electricity demand by sector . . . . . . . . . . . . . . . . . . . . . . . . . . . . . . . . . . . . . . . . . . . . . . 36
Electricity conservation’s impact on annual electricity demand . . . . . . . . . . . . . . . . . . . . . . . . . . 38
IESO/LDC conservation programs . . . . . . . . . . . . . . . . . . . . . . . . . . . . . . . . . . . . . . . . . . . . . . . . . . 39
Codes and standards . . . . . . . . . . . . . . . . . . . . . . . . . . . . . . . . . . . . . . . . . . . . . . . . . . . . . . . . . . . . 39
“Other influenced” conservation initiatives . . . . . . . . . . . . . . . . . . . . . . . . . . . . . . . . . . . . . . . . . . . . . 40
Electricity conservation’s impact on peak electricity demand . . . . . . . . . . . . . . . . . . . . . . . . . . . . 40
The Industrial Conservation Initiative . . . . . . . . . . . . . . . . . . . . . . . . . . . . . . . . . . . . . . . . . . . . . . . . . 41
Demand response programs. . . . . . . . . . . . . . . . . . . . . . . . . . . . . . . . . . . . . . . . . . . . . . . . . . . . . . . 41
Time of use rates . . . . . . . . . . . . . . . . . . . . . . . . . . . . . . . . . . . . . . . . . . . . . . . . . . . . . . . . . . . . . . . 42
Endnotes . . . . . . . . . . . . . . . . . . . . . . . . . . . . . . . . . . . . . . . . . . . . . . . . . . . . . . . . . . . . . . . . . . . . . . 43
31Environmental Commissioner of Ontario 2018 Energy Conservation Progress Report, Volume One
How and why has Ontario’s electricity demand changed? Q3

The details…
Total electricity demand vs. peak demandThis chapter details changes to the demand for electricity in Ontario and some of the factors that led to those changes.
Two types of demand are particularly important in determining how much electricity generation Ontario needs to have, and of what type (see Q4 for more details):
• Total electricity demand (measured in terawatt-hours,TWh), i.e., the total amount of electricity that isrequired to be supplied to Ontarians over the courseof a day, month or year. It is the sum of all electricityloads in the province.
• Peak demand for electricity (measured in megawatts,MW), which is the highest Ontario demand forelectricity at any point in time. It typically occurs for afew hours on a few days of the year.
A good analogy to explain the difference between overall demand and peak demand is the numbers that
show up on your vehicle’s dashboard. The odometer reads the total distance you’ve travelled, i.e., the overall demand, while the speedometer registers the instantaneous speed you reach while driving, with the highest speed reached on the speedometer being analogous to the peak demand.
The province must plan for both the total electricity demand of the system and for the highest peak the grid will experience so that it can provide power at all hours of the day and year, including the times when the most electricity is needed.
Annual electricity demandFigure 3.1 presents the province’s annual electricity demand between 2005 and 2016.
Figure 3.1. Ontario annual electricity demand (grid + embedded), 2005-2016.
Note: Ontario demand includes demand that was met by embedded generation (electricity generators connected to the local distribution grid, including many smaller solar and wind projects) which is not always counted in Ontario electricity statistics (embedded generation has grown to meet about 4% of Ontario demand by 2015, from only 1% in 2005, if its contribution is excluded, Ontario’s demand appears to be lower than it actually is).
Source: Independent Electricity System Operator, information provided in response to ECO inquiry (31 January 2018).
The province must plan for both the total electricity demand and for the highest peak.
156.8
151152.2
148.6
139.4
143.2 144 144145.5 145.3
143.2 142.9
130
135
140
145
150
155
160
2005 2006 2007 2008 2009 2010 2011 2012 2013 2014 2015 2016
Ont
ario
ann
ual e
lect
ricity
dem
and
(grid
+em
bedd
ed) (
TWh)
Year
32 Making Connections: Straight Talk About Electricity in Ontario
Q3

Electricity demand has been almost flat.
Ontario, similar to other jurisdictions, saw a substantial dip in its electricity demand during the 2008/09 recession. Since 2010, electricity demand has been almost flat, despite economic and population growth. The electricity demand shown in Figure 3.1 is actual demand after the effect of conservation - otherwise demand would be higher, as discussed later in the chapter.
Patterns of electricity useElectricity use varies throughout the course of a day, a week and also seasonally during a year. Figure 3.2 shows how electricity use varies throughout the course of a week at three different times of the year: January (winter), April (spring) and July-August (summer) of 2017.
Figure 3.2. Hourly electricity demand patterns over a week in January, April and July-August of 2017.
Note: Actual hourly demand is slightly higher than shown here, particularly during the daytime in summer hours, because some demand is served by embedded generation (primarily solar) connected to local distribution systems. See Q5 to read more about the impact of solar generation in reducing peak demand.
Source: “Data Directory: Hourly Data 2002-2017” online: Independent Electricity System Operator <www.ieso.ca/-/media/files/ieso/power-data/data-directory/hourlydemands_2002-2017.csv?la=en>. [Accessed 6 March 2018]
10,000
12,000
14,000
16,000
18,000
20,000
Sun
12 a
mSu
n 6
amSu
n 12
pm
Sun
6 pm
Mon
12
amM
on 6
am
Mon
12
pmM
on 6
pm
Tues
12
amTu
es 6
am
Tues
12
pmTu
es 6
pm
Wed
12
amW
ed 6
am
Wed
12
pmW
ed 6
pm
Thur
s 12
amTh
urs 6
am
Thur
s 12
pmTh
urs 6
pm
Fri 1
2 am
Fri 6
am
Fri 1
2 pm
Fri 6
pm
Sat 1
2 am
Sat 6
am
Sat 1
2 pm
Sat 6
pm
Sun
12 a
m
Elec
trici
ty D
eman
d (M
W)
Hours of the week
Jan-17 Apr-17 July-Aug 17
33Environmental Commissioner of Ontario 2018 Energy Conservation Progress Report, Volume One
How and why has Ontario’s electricity demand changed? Q3

Figure 3.2 shows that electricity demand varies throughout the year, with summer and winter typically seeing higher electricity use than shoulder months of spring and fall, due to weather-related demand for heating or cooling. The hotter or colder it is, the more these patterns are exaggerated. Typically, Ontario’s summer peaks are higher than the winter ones, since air-conditioning relies on electricity while a majority of Ontario’s heating sources are natural gas-based.
During the week, electricity use is much lower during the weekend than on weekdays. A weekday usually sees two spikes in demand, once in the mornings when residents are getting ready to head into work and the second during the evenings when people come home from work.
Daily patterns vary depending on the season. Though January and July-August are both typically months of high electricity use, there is a slight variation in the daily timing and duration of peak demand. In winter, there is a sharp spike in the early evening (around 6 p.m.) as people return home from work and turn on lights and appliances (e.g., the oven) and may be heating up their
homes (even in homes heated with gas, the furnace fan is a large electricity user). The high summer peaks are mostly attributable to air conditioning (both business and residential), which explains why the peak often plateaus for a good portion of the afternoon as air conditioning is on when it’s hottest outside. With April being a shoulder month when the weather is usually mild, demand does not rise nearly as high, but there is still a significant spike when people come home from work and turn on lights and appliances.
In all seasons, there is a major trough in demand overnight. When demand is low and falls below the amount of baseload generation, Ontario has surplus electricity ( Q7). Figure 3.3 shows how the minimum demand on the grid has fallen since 2005. At these hours, industrial electricity use is responsible for much of the demand.
Figure 3.3. Ontario’s minimum grid demand, 2005-2015.
Source: Independent Electricity System Operator, “Module 1: State of the Electricity System, 10-Year Review” (presentation, August 2016) slide 8.
When demand is low, Ontario has surplus electricity.
9,500
10,000
10,500
11,000
11,500
12,000
12,500
2005 2006 2007 2008 2009 2010 2011 2012 2013 2014 2015
Min
imum
grid
dem
and
(MW
)
Year
34
How and why has Ontario’s electricity demand changed?
Making Connections: Straight Talk About Electricity in Ontario
Q3

Ontario’s peak demandThe very highest hours of Ontario’s electricity use over the course of a year are known as periods of peak demand. As Figure 3.4 shows, these hours of peak demand can be more than double the province’s minimum demand. Ontario must have
enough electricity on hand to meet these peak hours and maintain reliability ( Q5), and this often drives planning decisions to build new generation or invest in conservation ( Q2).
Figure 3.4. The range of electricity demand in Ontario (2016) (i.e., the load duration curve).
Source: “Data Directory: 2016 Generator Output and Capability reports”, online: Independent Electricity System Operator <www.ieso.ca/-/media/files/ieso/power-data/data-directory/goc-2016.xlsx?la=en&hash=3C6E47A28856ADB539CD293C6816DA0873808EA1>. [Accessed 6 March 2018].
As with overall electricity use, peak demand is not as high as it was in the early to mid 2000s. Figure 3.5 shows the highest summer and winter peak demand for each year since 2005. The province’s highest peak demand on record happened in 2006 at 27,005 MW. Of the top 20 record peak demand days recorded since 2002, only one day in the last eight years makes that list (25,450 MW in 2011).1 Peak demand usually occurs
in the summer, with the exception of 2014, when the polar vortex brought unusually cold conditions to Ontario and there was a mild summer.
Peak demand usually occurs in the summer.
0
5000
10000
15000
20000
25000
025
050
075
010
0012
5015
0017
5020
0022
5025
0027
5030
0032
5035
0037
5040
0042
5045
0047
5050
0052
5055
0057
5060
0062
5065
0067
5070
0072
5075
0077
5080
0082
5085
0087
50
Syst
em e
lect
ricity
dem
and
(MW
)
Hours
2016
35Environmental Commissioner of Ontario 2018 Energy Conservation Progress Report, Volume One
How and why has Ontario’s electricity demand changed? Q3
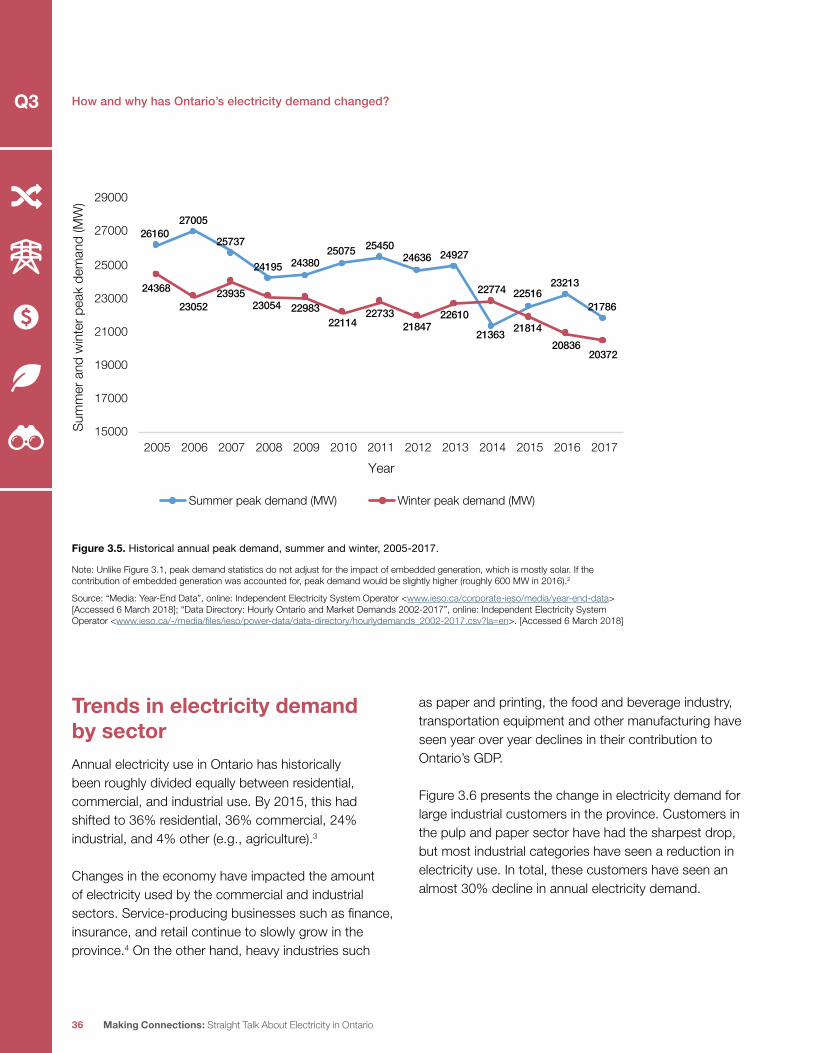
Figure 3.5. Historical annual peak demand, summer and winter, 2005-2017.
Note: Unlike Figure 3.1, peak demand statistics do not adjust for the impact of embedded generation, which is mostly solar. If the contribution of embedded generation was accounted for, peak demand would be slightly higher (roughly 600 MW in 2016).2
Source: “Media: Year-End Data”, online: Independent Electricity System Operator <www.ieso.ca/corporate-ieso/media/year-end-data>[Accessed 6 March 2018]; “Data Directory: Hourly Ontario and Market Demands 2002-2017”, online: Independent Electricity System Operator <www.ieso.ca/-/media/files/ieso/power-data/data-directory/hourlydemands_2002-2017.csv?la=en>. [Accessed 6 March 2018]
Trends in electricity demand by sectorAnnual electricity use in Ontario has historically been roughly divided equally between residential, commercial, and industrial use. By 2015, this had shifted to 36% residential, 36% commercial, 24% industrial, and 4% other (e.g., agriculture).3
Changes in the economy have impacted the amount of electricity used by the commercial and industrial sectors. Service-producing businesses such as finance, insurance, and retail continue to slowly grow in the province.4 On the other hand, heavy industries such
as paper and printing, the food and beverage industry, transportation equipment and other manufacturing have seen year over year declines in their contribution to Ontario’s GDP.
Figure 3.6 presents the change in electricity demand for large industrial customers in the province. Customers in the pulp and paper sector have had the sharpest drop, but most industrial categories have seen a reduction in electricity use. In total, these customers have seen an almost 30% decline in annual electricity demand.
2616027005
25737
24195 2438025075 25450
24636 24927
21363
2251623213
21786
24368
2305223935
23054 2298322114
2273321847
22610
22774
2181420836
20372
15000
17000
19000
21000
23000
25000
27000
29000
2005 2006 2007 2008 2009 2010 2011 2012 2013 2014 2015 2016 2017
Sum
mer
and
win
ter p
eak
dem
and
(MW
)
Year
Summer peak demand (MW) Winter peak demand (MW)
36
How and why has Ontario’s electricity demand changed?
Making Connections: Straight Talk About Electricity in Ontario
Q3

Figure 3.6. Annual electricity demand by large industrial customers: 2005 and 2015 (Ontario).
Source: Independent Electricity System Operator, “Module 1: State of the Electricity System, 10-Year Review” (presentation, August 2016) slide 10.
An increase in service industries has increased demand for commercial space for offices, institutions and retail stores. However, increasingly stringent building standards and codes and availability of conservation programs have made commercial buildings more energy-efficient. Businesses are also making more efficient use of workspaces and allowing more flexibility for employees to work remotely. Therefore, while the service industry has been expanding, its demand for electricity has not increased at the same rate.5
Average residential household consumption has also decreased, as seen in Figure 3.7. In 2016, the Ontario Energy Board (OEB) undertook a review of local distribution company (LDC) electricity data, analyzing monthly consumptions of the average electricity
customer, and concluded that the average customer used roughly 50 kWh less a month in 2014 than in 2010.6 The declining consumption was observed across the province, including Hydro One’s rural customers.7 This led the OEB to redefine the monthly electricity use of the “average electricity consumer” down from 800 kWh to 750 kWh for the purpose of calculating bill impacts on customers.8 Customers who have electrically heated homes and/or own medical equipment will use more electricity than this average.
0
5
10
15
20
25
Annu
al e
lect
ricity
con
sum
ptio
n (T
Wh)
Ontario's large industrial customers
Annual electricity demand (TWh) 2005 Annual electricity demand (TWh) 2015
Metal OreMining
Pulp andPaper
Refineries Chemicals Iron andSteel
MotorVehicle
Manufacturing
Miscellaneous Total
Average residential household consumption has also decreased.
37Environmental Commissioner of Ontario 2018 Energy Conservation Progress Report, Volume One
How and why has Ontario’s electricity demand changed? Q3

Figure 3.7. Average monthly electricity usage by residential customers, 2006-2015 (Ontario).
Note: Prior to late 2009, the OEB standard for the average household consumption was 1000 kWh a month. However, Figure 3.7 indicates that actual use since 2006 has been lower than 1000 kWh.
Source: Independent Electricity System Operator, “Module 1: State of the Electricity System, 10-Year Review” (presentation, August 2016) slide 9.
Electricity conservation programs and Time of Use prices (detailed later in this chapter) were noted by the Board as two key factors affecting residential electricity use. Indeed, conservation efforts in all sectors have made major contributions in reducing both annual electricity use and peak demand, as discussed next.
Electricity conservation’s impact on annual electricity demandOntario has committed to electricity conservation in the form of energy efficiency ( Q19) and demand response programs ( Q17), improvements in building codes and efficiency enhancements in equipment and appliances, and pricing policies that aim to reduce electricity use at peak times. The specifics of conservation efforts are detailed in other ECO annual energy conservation reports, most recently Every Joule Counts.
Figure 3.8 shows the amount of annual electricity demand avoided by conservation. Without electricity conservation actions, including utility programs and energy codes and standards, the province’s annual electricity demand would have been almost 9% higher (12 TWh) than what was actually recorded in 2016. Conservation programs account for 58% of the savings (7.1 TWh) and energy codes and standards account for 42% (5.2 TWh).9
In the 2017 Long-Term Energy Plan, the government reiterated its commitment to its 2032 electricity conservation goal of increasing conservation savings to 30 TWh by 2032. The ongoing importance of conservation is analyzed in Q19 of this report.
700
720
740
760
780
800
820
840
2006 2007 2008 2009 2010 2011 2012 2013 2014 2015
Mon
thly
KWh
usag
e by
resid
entia
l cu
stom
ers
Year
Without electricity conservation, electricity demand would have been almost 9% higher.
38
How and why has Ontario’s electricity demand changed?
Making Connections: Straight Talk About Electricity in Ontario
Q3

Figure 3.8. Electricity savings from conservation, 2006-2016 (Ontario).
Note: Does not include estimated savings from activities other than IESO/LDC conservation programs or codes and standards, referred to as “other influenced” conservation by the IESO. With these savings included, total annual electricity savings in 2016 would be 14.53 TWh.10
Source: Independent Electricity System Operator, Information provided in response to ECO inquiry (14 March 2018).
IESO/LDC conservation programs
Conservation programs are offered to all sectors by the LDCs and/or the IESO. These programs, which include incentives to encourage participation to reduce electricity consumption, are funded by electricity ratepayers. For example, residential electricity conservation programs offer energy efficient products such as LED lightbulbs, motion sensors, advanced powerbars, and high-efficiency furnaces and air conditioners which are expected to reduce consumption of electricity by the customers.11 Business customers have access to programs that upgrade
their lighting systems and refrigeration units, incent overall retrofits of their business facilities and also offer incentives for making new construction more energy efficient.12
Codes and standards
The Ontario Building Code, regulated by the Ontario Ministry of Municipal Affairs, includes energy efficiency standards for new buildings that have been raised over time at each update cycle for the Code, resulting in an average 13% reduction in predicted energy use per cycle. The Ministry of Energy also sets energy
0
2
4
6
8
10
12
14
2006 2007 2008 2009 2010 2011 2012 2013 2014 2015 2016
Pers
isten
t net
ene
rgy
savin
gs (T
Wh)
Year
Codes and standards Conservation Programs
39Environmental Commissioner of Ontario 2018 Energy Conservation Progress Report, Volume One
How and why has Ontario’s electricity demand changed? Q3

efficiency standards for products and appliances under a regulation (O. Reg. 404/12) under the Green Energy Act, which is also updated regularly (adding standards for new products, and strengthening efficiency standards for products already regulated).
“Other influenced” conservation initiatives
In its estimates of total electricity conservation savings, the IESO includes significant electricity savings from actions other than codes and standards and IESO/LDC conservation programs, which the IESO calls “other influenced conservation”.13 The IESO estimated over 2.25 TWh of electricity savings in 2016 from these initiatives, which include other federal or provincial programs, electricity savings achieved as a side benefit from gas conservation programs and from pre-2007 electricity conservation programs that were delivered directly by the IESO. As most of these savings are estimated and unverified, and the role of Ontario government policy in contributing to these savings is uncertain, they are not included in the totals here. With these savings included, total annual electricity savings in 2016 could be over 14.5 TWh.
Electricity conservation’s impact on peak electricity demandElectricity conservation has also helped reduce peak electricity demand. In fact, reducing peak was originally the primary goal of Ontario’s conservation efforts, and remains of strong interest. Without conservation, peak demand would have been 16% (3,602 MW) higher in 2016 than it actually was. An additional 620 MW of conservation could have been activated if needed, for a potential peak demand reduction of 4,222 MW.14
Electricity conservation programs also help reduce GHG emissions.
The conservation programs and codes and standards described in the previous section usually help reduce peak demand, but there are also special conservation efforts that are specifically targeted at peak demand, described in more detail below. These initiatives (Industrial Conservation Initiative, demand response, time-of-use rates) are grouped as “pricing policies” and account for 28% of peak demand reduction capacity in 2016. Figure 3.9 shows the contribution of each category of conservation to reducing peak demand in Ontario.
Without conservation, peak demand would have been 16% higher than it actually was.
40
How and why has Ontario’s electricity demand changed?
Making Connections: Straight Talk About Electricity in Ontario
Q3

Figure 3.9. Net persisting peak demand savings, 2006-2016 (Ontario).
Note: “Pricing Policies” include the Industrial Conservation Initiative (detailed in this chapter) that has had the highest impact in reducing peak demand in 2016 as the program has been expanded widely. Graph includes 620 MW of demand response which was not activated in 2016 to reduce peak, but was available if needed. It does not include estimated savings from activities other than IESO/LDC conservation programs or codes and standards, referred to as “other influenced” conservation by the IESO. With these savings included, peak demand savings in 2016 would be 4,750 MW.
Source: Independent Electricity System Operator, Information provided in response to ECO inquiry (14 March 2018).
The Industrial Conservation Initiative
The Industrial Conservation Initiative (ICI) is an IESO-run conservation initiative that allows large customers (now all customers with peak demand over 1 MW and certain classes of customers between 500 kW and 1 MW) to reduce their electricity bills, if they can reduce electricity use during the five hours of highest demand over the course of the year. The IESO has calculated that the ICI reduced peak demand by 1,300 MW in 2016.15 This initiative therefore has helped moderate spikes in peak demand during hours when the provincial demand is the highest. Depending on the amount of electricity a customer is able to shift, savings can range from under $5,000 to close to $50,000 on a monthly basis.16
Demand response programs
Demand response (DR) is the name for a category of conservation measures that are activated by customers under instructions from the IESO in real time to reduce electricity use when strain on the grid is high. This can be done in a number of ways – e.g., shutting down industrial processes, dimming lighting, cycling air conditioning down. DR programs cause mild inconvenience for participating customers, so they are compensated for participating in these programs.
Demand response was initially delivered by LDCs and the IESO. LDCs delivered the peaksaver PLUS program to residential customers and Demand Response 2 and 3 to large commercial and industrial customers.
0
500
1000
1500
2000
2500
3000
3500
4000
2006 2007 2008 2009 2010 2011 2012 2013 2014 2015 2016
Net
per
siste
nt p
eak
dem
and
savin
gs (M
W)
Year
Codes and Standards Pricing Policies Conservation Programs
41Environmental Commissioner of Ontario 2018 Energy Conservation Progress Report, Volume One
How and why has Ontario’s electricity demand changed? Q3

The peaksaver PLUS program, which allowed LDCs to remotely control and cycle down residential air conditioners during peak demand hours on hot summer days, enrolled roughly 300,000 customers. The IESO had 526.2 MW of demand response capacity under contract in 2015.17
Demand response is now solely the responsibility of the IESO. Interested businesses and industrial customers participate in an auction by offering the price that they will require, in order to be on call to reduce their electricity use. LDCs can also aggregate DR resources such as the peaksaver PLUS thermostats to participate in the DR auction and compete against other DR providers.18 Under this new process, the IESO has been able to lower the cost of demand response and increase the number of participants from 6 to 21 (as of 2016). In the auction that the IESO held in December 2017, the province received a summer commitment of 570 MW of DR reduction and a winter commitment of 712 MW of DR reduction.19
Despite the success in contracting DR participation, these resources are hardly called upon since the associated payments for reducing electricity use are quite high compared to the cost of supplying power even at peak. As this auction process moves to part of the IESO’s Market Renewal Initiative where DR providers will compete with generators to balance the provincial grid, these DR resources may be called upon more frequently. The Initiative is explained further in Q17.
Activation of demand response (i.e., the times when participating customers are actually called on to reduce their electricity use) is also being integrated into the real-time electricity market, with activations triggered through the wholesale market price signal. The IESO can also activate demand response for
reliability reasons. Unlike the other initiatives listed above, demand response has not necessarily reduced actual peak demand to date because it has been rarely activated. But it is an option the province can call upon to reduce demand and ensure reliability is maintained and to avoid building new sources of supply ( Q5).
Time of use rates
Time of Use (TOU) rates have been in place in Ontario since 2005, and are used now for almost all residential customers.20 A 2013 report commissioned by the OEB indicated that TOU rates have reduced summer on-peak consumption (when electricity demand is highest) by residential customers by 3.3%.21 The report also highlighted that Ontario’s electricity system load shape has evolved in response to TOU pricing, with on peak now being a prolonged plateau and not a short spike in the afternoon anymore.
There are also now a material number of system peak hours after 7 p.m. as more customer have switched to off-peak consumption.22 The report also concluded that TOU rates have led to an average demand reduction of 179 MW during the summer on-peak period, but had no impact in reducing overall electricity use.23 The effectiveness of TOU in reducing peak demand have been less than expected, in part because the price differential between peak and off-peak hours has not been very high. The OEB is piloting different pricing plans that may be more effective in reducing peak demand ( Q16).
TOU rates have reduced summer on-peak consumption by 3.3%.
42
How and why has Ontario’s electricity demand changed?
Making Connections: Straight Talk About Electricity in Ontario
Q3

Endnotes
1 “Demand Overview”, online: Independent Electricity System Operator <www.ieso.ca/en/power-data/demand-overview/historical-demand>. [Accessed 26 February 2018]
2 “Settlements”, online: Independent Electricity System Operator <www.ieso.ca/sector-participants/settlements/global-adjustment-and-peak-demand-factor>. [Accessed 26 February 2018]
3 Independent Electricity System Operator, “Module 2: Demand Outlook” (Toronto: IESO, August 2016) at 9.
4 “Ontario Economic Accounts” online: Ontario Ministry of Finance <www.fin.gov.on.ca/en/economy/ecaccts/>. [Accessed 26 February 2018]
5 Independent Electricity System Operator, “Module 1: State of the Electricity System: 10-year Review” (Toronto: IESO, August 2016) at 9.
6 Ontario Energy Board, Defining Ontario’s Typical Electricity Customer, EB-2016-0153 (Toronto: OEB, April 2016) at 4.
7 Ibid at 5. (Many of Hydro One’s customers have electrical heating, which increases their average electricity consumption when looked at on an annual basis.)
8 Ibid at 6.
9 Based on 2016 demand of 142.9 TWh (grid + embedded) (Independent Electricity System Operator, information provided in response to ECO inquiry, 31 January 2018).
10 Detailed information about 2016 CDM savings is available at: “Conservation Reports”, online: Independent Electricity System Operator <www.ieso.ca/power-data/conservation-overview/conservation-reports>. [Accessed 22 March 2018]
11 “Home Energy Savings and Consumer Programs” online: SaveONenergy <www.saveonenergy.ca/Consumer.aspx>. [Accessed 26 February 2018]
12 “Save on Energy Business Incentive Programs”, online: SaveONenergy <www.saveonenergy.ca/Business.aspx>. [Accessed 26 February 2018]
13 For example, the estimate of conservation savings achieved towards the Long-Term Energy Plan’s overall conservation target, as reported in the IESO’s 2016 Conservation Results Report includes these savings from “other influenced” conservation (Independent Electricity System Operator, 2016 Conservation Results Report (Toronto: IESO, February 2018) at 13).
14 A 2016 peak reduction of 3,602 MW, divided by the actual 2016 grid peak of 23,213 MW. In addition, 620 MW from demand response initiatives (capacity-based demand response and residential demand response) were available if needed to reduce 2016 peak demand, but were not activated. These numbers exclude 529 MW of peak demand reduction from “other influenced conservation” (excluded because it could not be verified). Including both of these categories, would have increased peak demand reduction to 4,750 MW.
15 Independent Electricity System Operator, Industrial Conservation Initiative Backgrounder (Toronto: IESO, September 2017).
16 Ibid, at 6. (These calculations assume a customer with peak demand of 20 MW.)
17 Environmental Commissioner of Ontario, Every Joule Counts, Ontario’s Energy Use and Conservation Year in Review (Toronto: ECO, August 2017) at 100.
18 Residential demand response will not see a 1 MW to 1 MW transition due to the more demanding requirements of the DR auction process. Toronto Hydro has also confirmed on Feb 12, 2018 that Peaksaver PLUS will be used for DR auctions (Environmental Commissioner of Ontario, Every Joule Counts, Ontario’s Energy Use and Conservation Year in Review (Toronto: ECO, August 2017) at 101); Toronto Hydro, information provided to the ECO in response to ECO inquiry (21 February 2018).
19 “Demand Response Auction: Post-Auction Summary Report” online: Independent Electricity System Operator <reports.ieso.ca/public/DR-PostAuctionSummary/PUB_DR-PostAuctionSummary_2018.xml>. [Accessed 26 February 2018]
20 Hydro One has received an exception from the OEB to not bill certain remote customers under TOU because of technical issues which has meant that Hydro One is unable to receive real time meter data from those properties (Kelly Egan, “Astonishing: Hydro One pulling plug on 36,000 rural smart meters after years of complaints”, National Post (13 January 2016), online: <nationalpost.com/news/canada/astonishing-hydro-one-pulling-plug-on-36000-rural-smart-meters-after-years-of-complaints>).
21 Ontario Energy Board, Regulated Price Plan Roadmap, EB-2014-0319 (Toronto: OEB, November 2016) at 8-9.
22 Ibid at 15.
23 Ibid at 9.
.
.
.
.
.
.
.
.
.
.
.
.
.
.
.
.
.
.
.
.
.
.
.
43Environmental Commissioner of Ontario 2018 Energy Conservation Progress Report, Volume One
How and why has Ontario’s electricity demand changed? Q3
1

2005
O N TA R I O ’ S T R A N S I T I O N TO A LO W - C A R B O N E L E C T R I C I T Y SYS T E M
Q U ES T I O N 4
Where does our electricity come from and how has the supply mix changed?
In 2005, Ontario’s electricity came from nuclear (51%), hydro (22%), coal (19%) and natural gas (8%). In 2016, it came from nuclear (59%), hydro (23%), non-hydro renewables (10%) and natural gas (8%). Without conservation programs and standards, electricity use in 2016 would have been 9% higher.
Wind and solar have grown from almost nothing in 2005 to supplying 9% of our electricity in 2016. Refurbishments at Bruce Power have allowed nuclear energy to provide 8% more of Ontario’s electricity. Without a decade of conservation programs and improvements to energy codes and standards, electricity use in 2016 would have been 9% higher. Natural gas provides about as much electricity over the course of the year as it did in 2005, but serves a much more important role now as new plants help meet peak electricity demand on hot summer days and cold winter evenings.

Contents
THE DETAILS . . . . . . . . . . . . . . . . . . . . . . . . . . . . . . . . . . . . . . . . . . . . . . . . . . . . . . . . . . . . . . . . . . . 46
Where our electricity came from in 2005 . . . . . . . . . . . . . . . . . . . . . . . . . . . . . . . . . . . . . . . . . . . . . 46
What has changed since 2005? . . . . . . . . . . . . . . . . . . . . . . . . . . . . . . . . . . . . . . . . . . . . . . . . . . . . 47
Share of electricity production. . . . . . . . . . . . . . . . . . . . . . . . . . . . . . . . . . . . . . . . . . . . . . . . . . . . . . 48
Capacity . . . . . . . . . . . . . . . . . . . . . . . . . . . . . . . . . . . . . . . . . . . . . . . . . . . . . . . . . . . . . . . . . . . . . 49
New electricity supply by resource type . . . . . . . . . . . . . . . . . . . . . . . . . . . . . . . . . . . . . . . . . . . . . 51
Nuclear . . . . . . . . . . . . . . . . . . . . . . . . . . . . . . . . . . . . . . . . . . . . . . . . . . . . . . . . . . . . . . . . . . . . . . 51
Natural gas . . . . . . . . . . . . . . . . . . . . . . . . . . . . . . . . . . . . . . . . . . . . . . . . . . . . . . . . . . . . . . . . . . . 52
Renewables . . . . . . . . . . . . . . . . . . . . . . . . . . . . . . . . . . . . . . . . . . . . . . . . . . . . . . . . . . . . . . . . . . . . 53
Renewable targets and procurements . . . . . . . . . . . . . . . . . . . . . . . . . . . . . . . . . . . . . . . . . . . . . . . . 53
Procurement results . . . . . . . . . . . . . . . . . . . . . . . . . . . . . . . . . . . . . . . . . . . . . . . . . . . . . . . . . . . . . 57
Hydro . . . . . . . . . . . . . . . . . . . . . . . . . . . . . . . . . . . . . . . . . . . . . . . . . . . . . . . . . . . . . . . . . . . . . . . 58
Wind and solar . . . . . . . . . . . . . . . . . . . . . . . . . . . . . . . . . . . . . . . . . . . . . . . . . . . . . . . . . . . . . . . . . 59
Embedded generation . . . . . . . . . . . . . . . . . . . . . . . . . . . . . . . . . . . . . . . . . . . . . . . . . . . . . . . . . . . 60
Bioenergy . . . . . . . . . . . . . . . . . . . . . . . . . . . . . . . . . . . . . . . . . . . . . . . . . . . . . . . . . . . . . . . . . . . . 62
Endnotes . . . . . . . . . . . . . . . . . . . . . . . . . . . . . . . . . . . . . . . . . . . . . . . . . . . . . . . . . . . . . . . . . . . . . . 63
45Environmental Commissioner of Ontario 2018 Energy Conservation Progress Report, Volume One
Where does our electricity come from and how has the supply mix changed? Q4

The details…
Where our electricity came from in 2005In 2005, Ontario’s electricity came almost entirely from four sources: nuclear, hydro (waterpower), coal, and natural gas/oil. Each of these resources played a different role in matching the swinging patterns of electricity demand described in Q3. Ontario Power Generation operated most of these generating stations (Pickering and Darlington nuclear, most of the hydro plants, all coal plants and the Lennox gas/oil plant).
Nuclear (51% of 2005 production): After the Darlington nuclear station came online in the early 1990s, Ontario had three major nuclear stations (Bruce, Darlington, and Pickering), with a total of 20 reactors. Between 1995 and 1998, the four Bruce A units and the four Pickering A units were shut down, leading to a rapid rise in coal-fired generation (see below and Q12). By 2005, four of these eight reactors had been restarted (Pickering A1 and A4, and Bruce A3 and A4 units), but four remained down pending a decision whether or not to refurbish them. That left 16 operating reactors. Nuclear stations are generally designed and operated to provide baseload power delivering the same amount of electricity 24 hours per day.
Hydro (22% of 2005 production): Most accessible Ontario waterpower sites were developed long ago, and provide Ontario’s cheapest electricity.
Development of Niagara Falls was Ontario’s initial foray into large-scale electricity production, with the opening of the Sir Adam Beck plant in 1922 (still operating today). Hydropower has played a major role ever since. Ontario’s two largest hydro stations are the Beck plant at Niagara Falls and the R.H. Saunders plant on the St. Lawrence river. These plants mainly supply baseload, around-the clock power, although the Niagara Falls complex includes a reservoir and pumped storage
facility for some flexibility in the timing of electricity production.
Ontario also has many additional smaller hydro plants (Ontario Power Generation operates the majority – currently 66 plants)1 across the province. Many provide some short-term storage of water behind dams, which can help match electricity supply with daily demand peaks. The amount of electricity produced from hydro facilities varies by season, due to water levels, and may also be constrained by other water use requirements (e.g., requirements to maintain a certain volume of flow for ecological purposes). More water is generally available in the spring and fall, when Ontario’s demand is usually low; less water is generally available in the summer, when Ontario’s demand usually peaks.
Coal (19% of 2005 production): In 2005, Ontario had two large coal-fired plants at Lambton and Nanticoke in southern Ontario, and two smaller plants at Thunder Bay and Atikokan (plus the Lakeview plant in Mississauga, which closed in 2005). Because coal is easily stored and can produce electricity quickly when needed, coal plants were used to ramp up and down production to meet hourly changes in customer demand. Coal-generated electricity production more than doubled between the mid-1990s and its peak year (2000) to offset the nuclear closures. Coal production had declined again by 2005, when four of the idled nuclear units were again operating. The coal phase-out is described in more detail in Q12.
In 2005, Ontario’s electricity came almost entirely from nuclear, hydro, coal, and natural gas/oil.
46 Making Connections: Straight Talk About Electricity in Ontario
Q4

Gas/Oil (8% of 2005 production): A number of smaller gas-fired generators were brought into service in the 1990s, under private ownership and with private funding. (They were known as non-utility generators (NUGs), to distinguish them from Ontario Hydro (later OPG)’s publicly owned and funded generation facilities). Many of these plants were originally combined heat and power plants, supplying heat to an industrial facility and electricity to the grid, although some became single purpose power generators after the closure of the industrial facility. This category also includes the large Lennox Generating Station, a peaking plant (which only runs when electricity demand is very high) that can run on natural gas or oil.
What has changed since 2005?Ontario's Electricity by the Numbers
Since 2005, the resources that meet Ontario’s electricity needs have changed in five major ways:1. conservation programs have reduced our need for
electricity
2. all coal-fired generating stations have closed orbeen converted to biomass
3. a large amount of wind and solar generation hasbeen installed, starting from a base of almostzero (a smaller amount of additional hydro andbioenergy has also been installed)
4. eleven large new natural gas-fired generatingstations have been brought on-line, and someolder units have been retired, and
5. nuclear generation has increased, due to therefurbishment and return to service of two units atthe Bruce Nuclear station. (This increase was partlyoffset by the closure, in October 2016, of one unitat Darlington, which is now being refurbished. Theremaining reactors at Bruce and Darlington willgradually be refurbished between now and 2033.)
Without conservation,2 Ontario’s annual electricity use in 2016 would have been 9% higher, and peak demand would have been 16% higher, than it actually was. The impact of conservation is described in Q3. Without conservation efforts since 2005, Ontario would have needed to build and run even more new generation.
Without conservation, Ontario’s annual electricity use would have been 9% higher, and peak demand would have been 16% higher.
Ontario’sElectricity
by theNumbers
27,961solar projects
210waterpower
facilities
18nuclearreactors
66bioenergyprojects
0coal plants
16,000+home and business
retrofits (2016)
29natural gas
plants
2,465wind turbines
47Environmental Commissioner of Ontario 2018 Energy Conservation Progress Report, Volume One
Where does our electricity come from and how has the supply mix changed? Q4

Ontario’s mix of electricity resources can be described using the share of annual electricity production from each resource (usually reported in terawatt-hours, TWh), or by each resource’s installed capacity, which is the rate of electricity production the resource can provide if running at full power (usually reported in megawatts, MW). We look at both below.
Share of electricity production
Coal provided 29 TWh of electricity (19% of overall production) in 2005 (down from its peak of 25% in 2000). The replacement of these 29 TWh of electricity has come from many sources, as shown in Table 4.1. Electricity production from nuclear has grown by 13 TWh. Natural gas production and waterpower
production are slightly higher than in 2005, while wind and solar have grown rapidly and now provide slightly more electricity (14 TWh) than natural gas (13 TWh).
At the same time, conservation reduced Ontario’s overall electricity demand by 12 TWh in 2016, from what it would otherwise have been ( Q3). This amount includes savings from programs and codes and standards, but excludes unverified savings resulting from what the IESO calls “other influenced conservation savings”. Because of population and economic growth, and a large increase in exports ( Q7), Ontario actually generates almost the same amount of electricity as it did in 2005.
Table 4.1. Share of Ontario electricity generation by resource type, 2005 and 2016.
Electricity Resource 2005 Annual Electricity Generation, TWh
(% of All Generation)
2016 Annual Electricity Generation, TWh
(% of All Generation)
Change, 2005-2016, TWh
Nuclear 78.9 (50.6%) 91.7 (58.5%) +12.8
Hydro 33.7 (21.6%) 36.5 (23.3%) +2.8
Coal 29.3 (18.8%) 0 (0%) -29.8
Gas/Oil 11.9 (7.6%) 12.9 (8.2%) +1.0
Wind 0 (0%) 10.7 (6.8%) +10.7
Solar 0 (0%) 3.5 (2.2%) +3.5
Bioenergy/Other 2.2 (1.4%) 1.4 (0.9%) -0.8
Total Generation 156.0 156.7
Conservation 0 (0%) 12.3 (8.6% of Ontario demand)3
+12.3
Note: Includes production from embedded generators (with solar being the majority) connected to the distribution system.
Source: IESO, Information Provided in Response to ECO Information Request (30 January 2018).
48
Where does our electricity come from and how has the supply mix changed?
Making Connections: Straight Talk About Electricity in Ontario
Q4

Year-by-year details of the changes in electricity production are shown in Figure 4.1.
Figure 4.1. Electricity production and conservation by resource, 2005-2016.
Source: Independent Electricity System Operator, Information provided in response to ECO inquiry (31 January 2018, and 15 March 2018).
Together, the increase in electricity production from renewables, including hydro, and the decrease in consumption due to conservation, total about the same amount of electricity that came from coal in 2005.
Coal provided 29.3 TWh ofelectricity in Ontario in 2005.
In 2016, conservation, wind, solar and additional hydro
provided about the same amount.
Capacity
Figure 4.1 showed changes in total electricity production. The resource mix looks slightly different if we look at changes in installed capacity (the maximum amount of electricity each resource can produce), as shown in Figure 4.2. Nuclear makes up a larger share of actual electricity production than capacity, because it is most economic for nuclear plants to run 24/7. This is because nuclear plants generally run at full power or not at all, cannot be left unattended, and cost about the same to operate whether they are producing power or not.
Natural gas and non-hydro renewables make up a smaller share of electricity production than capacity, as these resources do not operate as frequently:
0
20
40
60
80
100
120
140
160
180
2005 2006 2007 2008 2009 2010 2011 2012 2013 2014 2015 2016
TWh
Nuclear Waterpower Natural Gas/Oil Bioenergy/otherCoal Solar Wind Conservation
74%
2005 2017
Ontario’s electricity system went from 74%low-carbon generation in 2005 to 96%
low-carbon generation in 2017
96%
Coal (29.3 TWh)
2005
Solar(3.5 TWh)
Wind(10.7 TWh)
29.3 TWh
2016
Conservation(12.3 TWh)
Additionalhydro (2.8 TWh)
49Environmental Commissioner of Ontario 2018 Energy Conservation Progress Report, Volume One
Where does our electricity come from and how has the supply mix changed? Q4
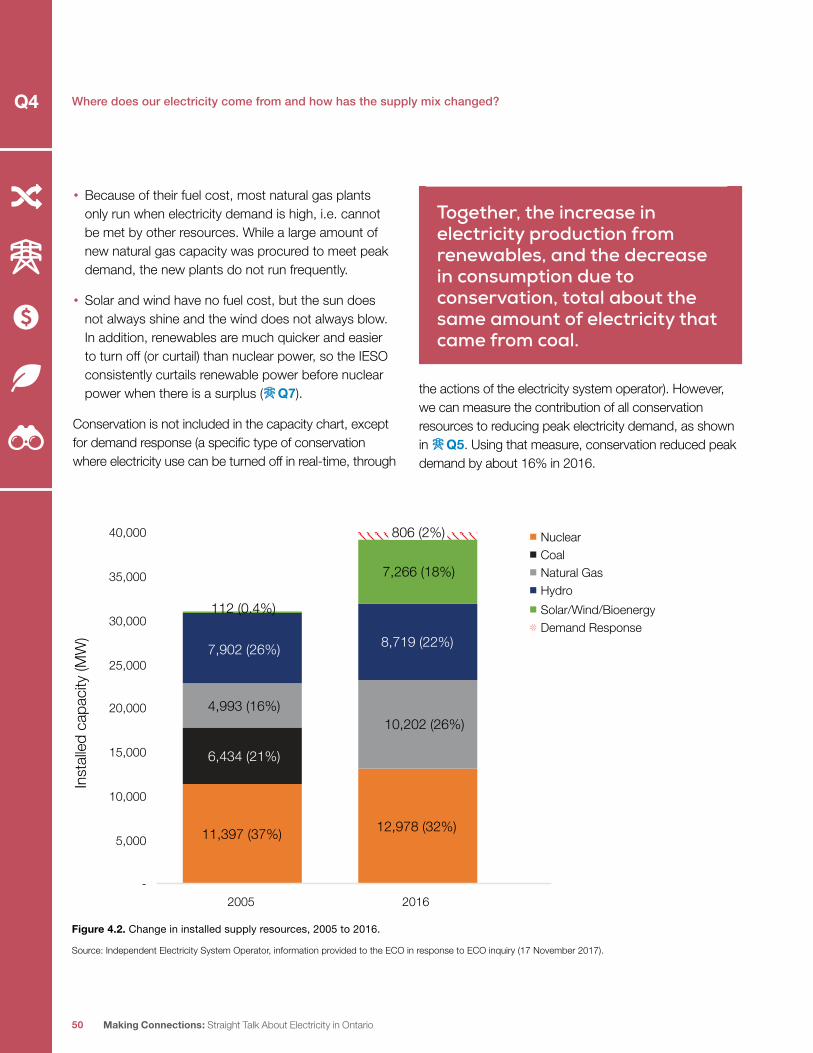
• Because of their fuel cost, most natural gas plantsonly run when electricity demand is high, i.e. cannotbe met by other resources. While a large amount ofnew natural gas capacity was procured to meet peakdemand, the new plants do not run frequently.
• Solar and wind have no fuel cost, but the sun doesnot always shine and the wind does not always blow.In addition, renewables are much quicker and easierto turn off (or curtail) than nuclear power, so the IESOconsistently curtails renewable power before nuclearpower when there is a surplus ( Q7).
Conservation is not included in the capacity chart, except for demand response (a specific type of conservation where electricity use can be turned off in real-time, through
the actions of the electricity system operator). However, we can measure the contribution of all conservation resources to reducing peak electricity demand, as shown in Q5. Using that measure, conservation reduced peak demand by about 16% in 2016.
Figure 4.2. Change in installed supply resources, 2005 to 2016.
Source: Independent Electricity System Operator, information provided to the ECO in response to ECO inquiry (17 November 2017).
11,397 (37%) 12,978 (32%)
6,434 (21%)
10,202 (26%)4,993 (16%)
7,902 (26%) 8,719 (22%)
112 (0.4%)
7,266 (18%)
-
5,000
10,000
15,000
20,000
25,000
30,000
35,000
40,000
2005 2016
Inst
alle
d ca
paci
ty (M
W)
NuclearCoalNatural GasHydroSolar/Wind/BioenergyDemand Response
806 (2%)
Together, the increase in electricity production from renewables, and the decrease in consumption due to conservation, total about the same amount of electricity that came from coal.
50
Where does our electricity come from and how has the supply mix changed?
Making Connections: Straight Talk About Electricity in Ontario
Q4

A year-by-year look at changes in installed capacity is shown in Figure 4.3. For resources other than coal, only the net change in resources (new capacity minus retired capacity) is shown:
Figure 4.3. Net change in Ontario’s installed capacity (grid connected and embedded), by generation type, 2005-2016.
Source: Independent Electricity System Operator, information provided to the ECO in response to ECO inquiry (31 January 2018).
New electricity supply by resource typeWe now look in more detail at the new capacity additions of specific supply resources. Conservation and demand response are reviewed in Q3.
Nuclear
Electricity production from nuclear power has increased since 2005 due to the refurbishment of two units at the Bruce nuclear station (in contrast, the two reactors at Pickering that were down in 2005 were put into safe storage and will not return to service). Instead of funding this refurbishment from the public purse, Ontario contracted with privately-owned Bruce Power in 2005, which funded the work with private capital
which it will recover, plus profit, over the working life of the reactors. The two reactors returned to service in 2012, returning more than 1,500 MW of capacity that had been lost in the late 1990s. These two reactors alone supply roughly 8% of Ontario’s current electricity demand.
Ontario therefore had 18 operating nuclear units between 2013 and 2016, providing almost 60% of Ontario’s overall electricity supply. However, 10 of these units (at Bruce and Darlington) will require refurbishment in the coming years, while 6 (at Pickering) will be shut
0
2000
4000
6000
8000
10000
12000
14000
16000
18000
2005 2006 2007 2008 2009 2010 2011 2012 2013 2014 2015 2016
Cha
nge
in in
stal
led
capa
city
(MW
)
Year
Nuclear Natural Gas Energy-from-WasteHydro Bioenergy WindSolar Demand Response Coal
Electricity production from nuclear power has increased.
51Environmental Commissioner of Ontario 2018 Energy Conservation Progress Report, Volume One
Where does our electricity come from and how has the supply mix changed? Q4

down entirely by 2022/2024. The first of the Darlington units began refurbishment in October 2016.
Ontario has decided not to build new nuclear plants. Ontario’s decisions on the future of nuclear power are reviewed in Q14.
Natural gas
To replace part of the coal capacity, especially its ability to ramp up or down quickly on demand, Ontario contracted with eleven larger privately-funded natural gas plants, seven of which came into service between 2008 and 2010 (about 4,000 MW of new capacity).4 Natural gas is a fossil fuel that causes air and greenhouse gas pollution; its upstream methane emissions are potent greenhouse gases ( Q11).
Ontario’s big bet on natural gas was a significant financial risk, which has largely been forgotten as
gas prices declined in recent years. Unlike nuclear or renewable generation, the cost of natural gas generation is very sensitive to fuel prices. Fuel costs comprise 60-70% of the overall cost of combined cycle gas-fired generation.5 Importing the gas drains money out of Ontario. The price of electricity from gas-fired generation is not fixed over its lifetime, but will vary greatly due to price fluctuations in the commodity cost of natural gas, which is set in North American markets outside Ontario’s control (see Figure 4.4). At the beginning of 2006, natural gas commodity prices were roughly triple what they are today.6
Figure 4.4. Henry Hub natural gas price (US $2018 real dollars, 1997 - 2018).
Note: The Henry Hub natural gas price generally sets the price for natural gas on the North American market. 1 MMBtu = 28.327 cubic metres of natural gas, which is the common measurement used in Canada.
Source: “Natural Gas Prices”, online: Macrotrends <www.macrotrends.net/2478/natural-gas-prices-historical-chart >. [Accessed 13 March 2018]
0
2
4
6
8
10
12
14
16
18
20
1-1-
1997
11-1
-199
79-
1-19
987-
1-19
995-
1-20
003-
1-20
011-
1-20
0211
-1-2
002
9-1-
2003
7-1-
2004
5-1-
2005
3-1-
2006
1-1-
2007
11-1
-200
79-
1-20
087-
1-20
095-
1-20
103-
1-20
111-
1-20
1211
-1-2
012
9-1-
2013
7-1-
2014
5-1-
2015
3-1-
2016
1-1-
2017
11-1
-201
7
US d
olla
rs p
er m
illion
s of
Brit
ishth
erm
al u
nits
($ 2
018)
Ontario’s big bet on natural gas was a significant financial risk, which has largely been forgotten.
52
Where does our electricity come from and how has the supply mix changed?
Making Connections: Straight Talk About Electricity in Ontario
Q4

In 2016, natural gas prices were the lowest in 20 years (between USD $1.75-$3.75/MMBtu). The U.S. Energy Information Administration expects that long-term prices will increase to about USD $5.00/MMBtu by 2022 and remain near that level.7
Natural gas use rose to as high as about 15% of overall electricity supply in 2011 and 2012, but declined after the two Bruce nuclear units returned to service and as more renewables have come online. The last two contracted gas plants that will reach commercial operation are those relocated from Mississauga and Oakville, to Sarnia and Napanee. The first of these opened in 2017 and the second is expected to open in 2018. Ontario also conducted several procurements for smaller-scale combined heat and power projects, which generate both electricity for the grid, and heat for a local industrial or business use.
The older fleet of gas-fired “non-utility” generators from the 1990s were at or nearing the end of their contracts by 2015. The Ministry of Energy directed the IESO not to enter into new contracts with these facilities, as their cost was high and their supply was not immediately needed.8 Some of these plants have or are likely to go out of service, although they can compete in the market auction for new supply in the coming years ( Q17).
RenewablesRenewable targets and procurements
Ontario has seen strong growth in renewable electricity since 2005, particularly for wind and solar, which started from a base of almost zero. Ontario’s growth in renewable electricity has been achieved by procuring thousands of individual projects of different sizes and
energy sources, through targeted renewable energy procurements. Before the 2017 Long-Term Energy Plan (in which no targets were set), the process typically worked as follows ( Q2):9
1. The government set high-level targets for renewables in long-term energy plans.
2. The Ministry of Energy issued directives to the IESO, giving them authority to conduct procurements. Minister’s directives often spelled out more detailed instructions and/or numerical targets for specific program procurements.
3. The IESO conducted procurements according to the Minister’s direction.
Table 4.2 shows renewable energy procured to date, and Table 4.3 shows how this compares to targets. Much of the hydro capacity (7,902 MW) but very little of the non-hydro renewables capacity (112 MW, mostly biomass) was already in-service in 2005.
Table 4.2. Renewable electricity capacity, in-service and procured.
Non-Hydro Renewables
Hydro
Actual Current Installed Capacity (end of 2016)10
7,266 MW 8,719 MW
Capacity Procured But Not Yet In Service (end of 2016)11
1,752.6 MW 198.1 MW
Additional Contract Offers (2017)
200 MW (150 MW FIT + 50 MW microFIT)
Potential Renewable Electricity Capacity if All Projects Reach Commercial Operation
9,218.6 MW 8,917.1 MW
Note: Current installed capacity includes grid connected and embedded capacity. Non-Hydro renewables includes biomass, wind and solar sources.
Source: Independent Electricity System Operator, information provided to the ECO in response to ECO inquiry (17 November 2017).
Ontario has seen strong growth in renewable electricity.
53Environmental Commissioner of Ontario 2018 Energy Conservation Progress Report, Volume One
Where does our electricity come from and how has the supply mix changed? Q4

Table 4.3. Renewable electricity targets in Ontario energy plans.
Power System Plan Non-Hydro Renewables Targets(s) and Policy Changes
Hydro Targets
Integrated Power System Plan 2007 (never received final approval)
- Increase the amount of new renewables by 2,700 MW by 2010 (relative to 2003 base). (Target achievement uncertain as 2003 data not available: 1,861 MW increase in renewable capacity between 2005 and 2010)
- Double the overall amount of renewable supply (to 15,700 MW by 2025) – hydro and non-hydro. (Target exceeded: 2016 hydro and non-hydro installed capacity of 15,985 MW)
Long-Term Energy Plan 201012 - 10,700 MW of non-hydro renewables online by 2018
- Continuation of FIT/microFIT procurement models announced through the Green Energy Act (GEA). (Target will not be achieved: maximum potential of 9,218.6 MW)
9,000 MW of hydro online by 2018. (Target will almost be achieved: 8,719 MW in service at end of 2016, with 198.1 MW under development)
Long-Term Energy Plan 201313 - 10,700 MW of non-hydro renewables online by 2021 (including specific near-term procurement program, e.g., an annual procurement target of 150 MW for FIT and a 50 MW target for microFIT).(Target unlikely to be achieved: maximum potential of 9,218.6 MW from current contracts; additional capacity would require new procurements or high uptake of net metering)
- Return to competitive procurement model for large renewable projects (>500 kW).
9,300 MW of hydro online by 2025 (Target achievement uncertain: 8,719 MW in service at end of 2016, with 198.1 MW under development. Additional capacity would require new procurements)
Long-Term Energy Plan 2017 No explicit targets
Note: The Ministry of Energy indicates that the 2010 and 2013 targets have been superceded by the 2017 Long Term Energy Plan, and the decision to suspend the second round of Large Renewable Procurements in the 2016 direction to the IESO, and should not be considered active targets.
As Table 4.3 shows, Ontario greatly expanded its targets for non-hydro renewables in the 2010 Long-Term Energy Plan, but scaled back these ambitions in the 2013 and 2017 Plans. It will have roughly 9,000 MW of non-hydro renewables in service by 2018, not 10,700 MW; whether it will reach these levels in the years to come will depend on future renewable policies.
In procuring renewable energy, Ontario has oscillated between procurement models that have been competitive on price versus procurements with set prices, and has also negotiated some bilateral contracts ( Q9). The procurements under which
renewable electricity was procured in Ontario are shown in Table 4.4.
The last of these procurements (FIT and microFIT) concluded at the end of 2017–currently there are no active renewable energy procurements ( Q18).
While renewable energy development is often associated with the Green Energy Act (GEA), Table 4.4 shows that several renewable energy procurements (including a standard offer program with some similarities to the GEA’s Feed-in Tariff model) took place before the GEA.
54
Where does our electricity come from and how has the supply mix changed?
Making Connections: Straight Talk About Electricity in Ontario
Q4

Table 4.4. Major Ontario renewable energy procurements.
Year Procurement Launched
Procurement Name Description Procured Energy Sources
Capacity in Commercial
Operation (MW, 2017)
Pre-Green Energy Act
2004 Renewable Energy Supply (RES) Contract
Price-competitive procurement process for renewable projects. Target was set at 1350 MW by 2007.14 Three rounds of RES procurement offered by Ministerial directive.
Wind, hydro, solar, bioenergy. More than 90% of procured project capacity was for wind projects, with a very small amount of bioenergy and hydro, and no solar.
1549.7
2006 Renewable Energy Standard Offer Program (RESOP)
Launched in November 2006, intended to make it easier to sell renewable power into the grid by setting a fixed price for small generation projects that use renewable energy. Contract was for 20 years. Size limit up to 10 MW.15 Open to anyone except Ontario Power Generation (OPG). Support the general government target of 2,700 MW by 2020.
Procured a mixture of energy resources, with solar accounting for the largest share of procured capacity, wind close behind, and small amounts of hydro and bioenergy.
826.5
2007 Hydroelectric Energy Supply Agreement (HESA)
Bilateral contracts with OPG for new hydro projects, including the large Lower Mattagami project.
Hydro 1038.7
2009 Hydroelectric Contract Initiative (HCI)
Contracts for existing waterpower facilities that were previously not under contract, also allowed for some expansion of facilities.
Hydro 1100.4
Post-Green Energy Act
2009 (post-GEA), suspended in 2011
Feed in Tariff Program (FIT)
A successor to RESOP, but for larger projects as well. Set prices, usually for 20-year contract. For projects > 10 kW, with no maximum size. Specific conditions applied to be successful, including availability of connection capacity on the electricity grid.16
Large amounts of solar and wind procured, with much smaller amounts of hydro and bioenergy.
3631.1 (also includes results from revised FIT program launched in 2013)
2009 Micro - feed in Tariff Program (microFIT)
As above for the FIT program, with fixed prices, but limited to small projects < 10 kW – usually for projects aimed at residential homeowners and farmers. Non-competitive procurement with fixed prices. Seven rounds of procurement have been offered to December 2017.
Almost exclusively solar. 229.3
55Environmental Commissioner of Ontario 2018 Energy Conservation Progress Report, Volume One
Where does our electricity come from and how has the supply mix changed? Q4

2010 Atikokan Biomass Energy Supply Agreement (ABESA)
Bilateral contract with OPG to convert the Atikokan station from coal to biomass. Used as a peaking plant and operates about 10% of the time.
Bioenergy 205.0
2011 Green Energy Investment Agreement Power Purchase (GEIA)
Specific negotiated contracts entered into with Samsung C & T and Korea Electric Power for large-scale projects – mandated by Ministerial directive on April 1, 2010 for development of 2,500 MW of wind and solar in 5 phases.17 Amended in 2013 to reduce procurement to 1,370 MW. Three phases completed with 1,370 MW offered.
Large wind and solar projects.
1,268.4
2013 Hydroelectric Standard Offer Program (HESOP)
Customized standard offer program for waterpower. Targeted new projects under municipal ownership, or expansion projects for existing facilities.
Hydro 7.7
2013 Revised Feed-in Tariff Program (FIT)
Limited to projects in 10-500 kW range, unlike previous FIT procurements. Programs offered were FIT 1, FIT 2, FIT 3, Extended FIT 3, FIT Unconstructed Rooftop, FIT 4, FIT 5, all resulting from Ministerial Directives. Semi-competitive on price – fixed prices were set, but in some rounds, bidders could propose lower prices to improve their chances of obtaining contract.
Unlike previous FIT program, almost all contracts awarded in the new FIT program were for solar.
Included in FIT results above
2014 Thunder Bay Biomass Energy Supply Agreement (TBESA)
Bilateral contract with OPG to convert the Thunder Bay station from coal to biomass. Operates as a peaking plant roughly 2% of the time. As of September 2017 was using imported pellets.18
Bioenergy 135.0
2014 Large Renewable Procurement Program (LRP)
A price-competitive procurement for projects larger than 500 kW, managed by the IESO. Contracts awarded in April 2016. A second phase was planned, but was cancelled before any contracts were awarded.
Large wind and solar and a small amount of hydro
None yet(454.9 MW of contract offers)19
Sources: see various endnotes in the table.
Year Procurement Launched
Procurement Name Description Procured Energy Sources
Capacity in Commercial
Operation (MW, 2017)
56
Where does our electricity come from and how has the supply mix changed?
Making Connections: Straight Talk About Electricity in Ontario
Q4

Procurement resultsThe renewable energy capacity added into service by year is shown in Figure 4.5, and the cumulative installed capacity for each renewable source is shown in Figure 4.6.
There is typically a delay of several years between a procurement and projects coming into service (solar typically has the shortest lead time, and hydro the longest), in part due to the environmental approvals process ( Q10). The vast majority of FIT capacity was contracted in 2010 and 2011; almost all of this capacity came into service between 2013 and 2016.20
Figure 4.5. Renewable electricity capacity added into service by year.
Source: Independent Electricity System Operator, information provided to the ECO in response to ECO inquiry (31 January 2018).
Figure 4.6. Total renewable electricity capacity in service by energy source.
Source: Independent Electricity System Operator, information provided to the ECO in response to ECO inquiry (31 January 2018).
-
200
400
600
800
1,000
1,200
1,400
1,600
1,800
2,000
2006 2007 2008 2009 2010 2011 2012 2013 2014 2015 2016
MW
BiomassHydroSolarWind
-
1,000
2,000
3,000
4,000
5,000
6,000
7,000
8,000
9,000
10,000
2005 2006 2007 2008 2009 2010 2011 2012 2013 2014 2015 2016
MW
Hydro
BiomassWindSolar
57Environmental Commissioner of Ontario 2018 Energy Conservation Progress Report, Volume One
Where does our electricity come from and how has the supply mix changed? Q4

Hydro
Hydropower can be generated by large or small projects. In terms of large projects, Ontario Power Generation completed two large upgrades at existing sites. OPG upgraded four generating stations as part of the Lower Mattagami project, which added more than 400 MW of capacity and came into service in 2014. The other hydro megaproject was the Niagara Tunnel, which allows OPG’s Beck complex at Niagara Falls to utilize and store more water, potentially increasing electricity production by about 1.6 TWh per year (roughly 1% of Ontario’s total electricity demand).21 The Tunnel opened in 2013; however, actual electricity production at the Beck station has not increased, as Beck is usually the first hydro plant where water is spilled at times of surplus electricity ( Q7).22
The first round of the FIT program offered many contracts for smaller new waterpower projects, but only 9 of 57 projects have reached commercial operation as of mid-2017 (18 have been abandoned and 30 remain listed as “under development”).23 This is due in part to the longer time frame of hydro development and in part to environmental concerns ( Q10). Subsequent procurements focused on expansions to existing facilities, and new municipally-owned facilities, and added only a small amount of capacity. Hydro capacity that has been added into service since 2005 is shown in Figure 4.7.
The 2017 LTEP mentions additional opportunities to get more from existing waterpower assets.24 Waterpower storage (including pumped storage) may also play an important role ( Q16).
While Ontario has significant technical potential for large new hydro projects, most of this is in the far north at remote locations. Both these sites and the long
transmission lines to serve them would have long lead times, could have high cost and environmental impacts, and might not be acceptable to affected First Nations. Dams can cause serious ecosystem disruptions, and reservoirs created by dams can emit substantial greenhouse gases. Ontario has a weak approval process for waterpower with no public hearings, despite the damage that dams often cause ( Q10). Thus, while existing waterpower assets play a very important role in Ontario’s electricity system, and further upgrades of existing sites are possible, waterpower development at new sites is likely to play a smaller role.
Figure 4.7. Hydroelectric capacity added into service by contract type (MW).
Note: Includes projects in commercial operation and under development. Much of the capacity procured through the HCI (Hydroelectric Contract Initiative) is not new generation, but represents new contracts for projects already in operation.
FIT Feed-in Tariff HCI Hydroelectric contract initiative HESA Hydroelectric energy supply agreement HESOP Hydroelectric standard offer program RES Renewable energy supply contract RESOP Renewable energy standard offer program
Source: Independent Electricity System Operator, information provided to the ECO in response to ECO inquiry (31 January 2018).
63.9/3%
1,100.4/48%1,038.7/46%
7.7/0.3%
31.0/1.4% 28.2/1.2%
FIT HCI HESA HESOP RES RESOP
58
Where does our electricity come from and how has the supply mix changed?
Making Connections: Straight Talk About Electricity in Ontario
Q4

Wind and solar
Wind and solar do not cause air pollution or greenhouse gas emissions and are the world’s fastest growing sources of electricity. Costs started high, but have dropped and renewables are increasingly cost-competitive with fossil fuels and nuclear power.
Wind and solar have been the primary contributors to renewable electricity growth in Ontario. Other than nuclear and hydro, solar and wind electricity are Ontario’s primary options for growing electricity supply without air or climate pollution. Solar and wind can provide both utility scale and distributed power, smaller projects that can be built close to where the power is needed, reducing line losses and potentially increasing resilience. Solar, in particular, can also be built quickly, with minimal environmental impacts ( Q10).
The first (pre-Green Energy Act) RES round of competitive renewable procurements primarily produced large wind projects; solar began to grow after the RESOP program. Many more projects were initiated following the Green Energy Act and the introduction of the Feed-in Tariff program. As shown in Figures 4.8 and 4.9, pre-GEA procurements account for about 37% of current wind capacity and 20% of solar capacity.
Figure 4.8. Wind capacity added into service by contract type (MW).
Note: Includes projects in commercial operation and under development.
FIT Feed-in Tariff GEIA Green energy investment agreement RES Renewable energy supply contract RESOP Renewable energy standard offer program
Source: Independent Electricity System Operator, information provided to the ECO in response to ECO inquiry (31 January 2018).
Figure 4.9. Solar capacity added into service by contract type (MW).
Note: Includes projects in commercial operation and under development.
Source: Independent Electricity System Operator, information provided to the ECO in response to ECO inquiry (31 January 2018).
Wind and solar do not cause air pollution or greenhouse gas emissions and are the world’s fastest growing sources of electricity.
2127/44%
968.4/20%
1,509.4/31%
284.9/6%
FIT GEIA RES RESOP
1,393.2/58%
300.0/12%
229.3/10%
473.7/20%
FIT GEIA microFIT RESOP
59Environmental Commissioner of Ontario 2018 Energy Conservation Progress Report, Volume One
Where does our electricity come from and how has the supply mix changed? Q4

Wind projects have been almost exclusively large-scale, while solar has been procured in different sizes under different procurement streams. The microFIT program was for projects less than 10 kW in size, such as the roof of an individual home or business; the FIT program was initially for all sizes, but later restricted to 10kW-500 kW; and the Large Renewable Procurement was for large projects >500kW.
Under the FIT and microFIT programs, Ontario procured 217 MW of solar projects less than 10 kW in size
(microFIT), 419 MW of solar projects between 10 kW and 500 kW, and 917 MW of solar projects larger than 500 kW (0.5 MW) in size, in service at the end of 2016.25 The 217 MW from microFIT comes from almost 25,000 different projects.
Unlike most types of generation, solar projects have been mostly connected to the distribution system and are known as “embedded generation” (see Textbox: “Embedded generation”).
Embedded generation
Unlike central power plants like nuclear and coal fired generating stations, renewable energy technologies can often be linked to the distribution level of the grid. For example, a typical residential rooftop solar system is usually connected to the local power line that runs along the road in front of the house. This type of electrical generation is called “embedded”
because it is connected to the distribution system of the local electrical utility, not to the high-voltage transmission system that delivers bulk power as directed by the IESO. 87% of Ontario solar (by 2016, 1,926 MW) and 12% of wind (534 MW) is “embedded” generation. The solar and wind generation that is embedded in the distribution system is shown in Figure 4.10.
Figure 4.10. Ontario’s embedded installed capacity at year end.
Note: “Other” includes combined heat and power, waterpower, and bioenergy. Demand response is also considered an embedded resource by the IESO but is not shown included in this figure.
Source: Independent Electricity System Operator, information provided to the ECO in response to ECO inquiry (17 November 2017).
-
500
1,000
1,500
2,000
2,500
3,000
3,500
2005 2006 2007 2008 2009 2010 2011 2012 2013 2014 2015 2016
Embe
dded
inst
alle
d ca
paci
ty (M
W)
Year
solar wind other
60
Where does our electricity come from and how has the supply mix changed?
Making Connections: Straight Talk About Electricity in Ontario
Q4

Connection to the distribution system can bring complications, as this level of the grid was originally designed to serve consumers of power, not producers. Distribution infrastructure may need to be upgraded to accommodate renewables. Much of the electricity production from embedded generation is not visible to the grid operator (the Independent Electricity System Operator (IESO)) in real-time, which can cause difficulties as the IESO balances supply and demand, as discussed in Q6.
It also means that the contributions of solar and wind are systematically underrepresented in some public reports. For example, the 87% of solar power and 12% of wind power that are embedded are not listed in the IESO’s real-time energy reporting on the “Power Data” website, www.ieso.ca/en/power-data, which is also the data source for many third-party apps. This means that the IESO data under-reports the contributions of wind and solar to meeting our electricity needs.
The hidden role of renewables
The contributions of solar and wind are systematically underrepresented.
Small-scale renewable electricity is not included in the IESO’s real-time online energy reporting (Power Data) or apps that use this data.
not included in real-time reporting.
not included in real-time reporting.
87% of SOLAR
12% of WIND
61Environmental Commissioner of Ontario 2018 Energy Conservation Progress Report, Volume One
Where does our electricity come from and how has the supply mix changed? Q4

Bioenergy
Bioenergy can be a valuable source of renewable electricity because the fuel can be easily stored, and power can be produced on demand. Opportunities rely on the availability of a suitable supply of fuel, and on whether enough energy can be recovered from the fuel to offset the financial and energy cost of obtaining, processing and transporting it. The largest additions of bioenergy to Ontario’s electricity supply have come from conversion of the Atikokan and Thunder Bay coal-fired facilities to run on biomass. The biomass fuel for Atikokan comes from northwestern Ontario, whereas the pellets for the Thunder Bay plant are currently imported from Norway.26 These conversions were based, in part, on considerations of economic and regional policy, not on how to obtain the cheapest electricity.
In addition, a large (40 MW) combined heat and power project has been brought online at a Thunder Bay pulp and paper plant, using wood waste as the fuel source.27
Aside from woody biomass, several smaller-scale projects use fuel from anaerobic digestion of methane from organic sources, including landfill gas, sewage, on-farm waste, and food waste. The amount of bioenergy that has been added into service by contract type since 2005 is shown in Figure 4.11. These projects add value in generating energy from resources that would otherwise be wasted, and in reducing greenhouse gas emissions from methane, but their overall contribution to Ontario’s electricity supply is small.
Figure 4.11. Bioenergy capacity added into service by contract type (MW).
Note: Includes projects in commercial operation and under development.
ABESA Atikokan biomass energy supply agreement CHP Combined heat and power FIT Feed-in tariff NUG Non utility generation RES Renewable energy supply contract RESOP Renewable energy standard offer program TBESA Thunder Bay biomass energy supply agreement
Source: Independent Electricity System Operator, information provided to the ECO in response to ECO inquiry (31 January 2018).
205.0/42%
48.0/10%47/10%
5.0/1%9.3/2%
39.7/8%
135.0/28%
ABESA CHP FIT NUG RES RESOP TBESA
62
Where does our electricity come from and how has the supply mix changed?
Making Connections: Straight Talk About Electricity in Ontario
Q4

Endnotes
1 “Hydroelectric Power”, online: Ontario Power Generation <www.opg.com/generating-power/hydro/Pages/hydro.aspx>. [Accessed 13 March 2018]
2 Including conservation programs, codes and standards, and conservation pricing policies.
3 Ontario demand of 142.9 TWh in 2017.
4 The seven natural gas plants that came into service between 2008 and 2010 are: Greenfield Energy Centre (1,153 MW), Portlands Energy Centre (394 MW + 246 MW), St. Claire Energy Centre (646 MW), Goreway (942 MW), East Windsor Cogeneration (100 MW), Halton Hills (705 MW), Thorold (287 MW). The other four are: Greater Toronto Airport Authority (117 MW, online in 2006), York Energy Centre (438 MW, online in 2012), Greenfield South (334 MW, online in 2017), and Napanee (985 MW, expected online in 2018). (“New and Retired Generation Since the IESO Market Opened in May 2002”, online: IESO <www.ieso.ca/power-data/supply-overview/transmission-connected-generation>. [Accessed 13 March 2018])
5 Financial Accountability Office of Ontario, Nuclear Refurbishment: An Assessment of the Financial Risks of the Nuclear Refurbishment Plan (Toronto: FAO, Fall 2017) at 58.
6 “Historical natural gas rates”, online: Ontario Energy Board <www.oeb.ca/rates-and-your-bill/natural-gas-rates/historical-natural-gas-rates>. [Accessed 13 March 2018]
7 Financial Accountability Office of Ontario, Nuclear Refurbishment: An Assessment of the Financial Risks of the Nuclear Refurbishment Plan (Toronto: FAO, Fall 2017) at 58.
8 Directive from Ontario Minister of Energy to the Independent Electricity System Operator, Re: Non-Utility Generator Projects, Combined Heat and Power Standard Offer Program 2.0, Chaudière Falls Hydroelectric Generation and Whitesand First Nation Biomass Cogeneration (14 December 2015).
9 This description is only partially accurate, as some directives and policy changes were made between versions of the long-term energy plans, and thus were independent of these long-term plans.
10 Independent Electricity System Operator, information provided to the ECO in response to ECO inquiry (17 November 2017).
11 Independent Electricity System Operator, A Progress Report on Contracted Electricity Supply – Second Quarter 2017 (Toronto: IESO, 2017) at 11.
12 Ontario Ministry of Energy, Ontario’s Long-Term Energy Plan: Building Our Clean Energy Future (Toronto: Ministry of Energy, 2010) at 30.
13 Ontario Ministry of Energy, Achieving Balance - Ontario’s Long Term Energy Plan (Toronto, Ontario Ministry of Energy, 2013) at 33.
14 Ontario Ministry of Energy, News Release, “McGuinty Government Sparks Interest in Green Electricity” (24 June 2004).
15 Office of the Premier of Ontario, News Release, “Ontario’s Standard Offer Program” (21 March 2006).
16 “Ontario’s Feed-In Tariff Program Backgrounder”, online: Independent Electricity System Operator <www.ieso.ca/-/media/files/ieso/document-library/fit/archive/newsroom-archive-2009-feed-in-tariff-program.pdf?la=en>. [Accessed 14 March 2018]
17 Letter from the Minister of Energy and Infrastructure to the Ontario Power Authority (1 April 2010), online: <ieso.ca/-/media/files/ieso/document-library/ministerial-directives/2010/20100401-re-green-energy-investment-agreement-with-government-of-ontario-and-korean-consortium.pdf>.
18 Jon Thompson, “Why aren’t northwestern Ontario’s state-of-the-art energy facilities producing any energy?”, TVO.org (6 September 2017), online: <tvo.org/article/current-affairs/the-next-ontario/why-arent-northwestern-ontarios-state-of-the-art-energy-facilities-producing-any-energy>.
19 “Large Renewable Procurement”, online: Independent Electricity System Operator <www.ieso.ca/sector-participants/energy-procurement-programs-and-contracts/large-renewable-procurement>. [Accessed 14 March 2018]
20 Independent Electricity System Operator, A Progress Report on Contracted Electricity Supply – Second Quarter 2017 (Toronto: IESO, 2017) at 22 and 26.
21 “Niagara Tunnel Project Technical Facts”, online: Ontario Power Generation<www.niagarafrontier.com/tunneltechnical.html>. [Accessed 13 March 2018]
22 Ontario Power Generation, information provided to the ECO in response to ECO inquiry (6 February 2018).
23 Independent Electricity System Operator, information provided to the ECO in response to ECO inquiry (17 November 2017).
24 Ontario Ministry of Energy, Delivering Fairness and Choice: Ontario’s Long-Term Energy Plan 2017 (Toronto: Ministry of Energy, 2017) at 44.
25 Independent Electricity System Operator, A Progress Report on Contracted Electricity Supply – Fourth Quarter 2016 (Toronto: IESO, 2016) at 21 and 23.
26 Andrew Macklin, “Advanced energy: OPG Thunder Bay”, Canadian Biomass (1 December 2015), online: <www.canadianbiomassmagazine.ca/pellets/advanced-energy-5410>.
27 Resolute Forest Products, News Release, “Resolute throws power island switch” (14 May 2013).
.
.
.
.
.
.
.
.
.
.
.
.
.
.
.
.
.
.
.
.
.
.
.
.
.
.
.
63Environmental Commissioner of Ontario 2018 Energy Conservation Progress Report, Volume One
Where does our electricity come from and how has the supply mix changed? Q4

2005
I M PAC T O N T H E E L E C T R I C I T Y SYS T E M
Q U ES T I O N 5
Has Ontario’s electricity system become more reliable and able to meet peak demand?
Yes. Ontario now has adequate, but not excessive, resources to meet its peak demand, without brownouts or other emergency measures.
This is a great improvement from the early to mid 2000s, when the province strained to meet demand on hot days, requiring occasional brownouts and public appeals to reduce electricity use. Investments in new electricity supply and conservation have significantly improved reliability and eliminated brownouts.
While the bulk grid has adequate supply to provide system-wide reliability, customers will always face a risk of power outages caused by disruptions to portions of the transmission or distribution network.

Contents
THE DETAILS . . . . . . . . . . . . . . . . . . . . . . . . . . . . . . . . . . . . . . . . . . . . . . . . . . . . . . . . . . . . . . . . . . . 66
A reliable electricity system must be able to meet Ontario demand at all times . . . . . . . . . . . . . 66
Reliability in electricity distribution . . . . . . . . . . . . . . . . . . . . . . . . . . . . . . . . . . . . . . . . . . . . . . . . . . . 66
Reliability in the early 2000s . . . . . . . . . . . . . . . . . . . . . . . . . . . . . . . . . . . . . . . . . . . . . . . . . . . . . . . 68
What can the system operator do when there isn’t enough electricity?. . . . . . . . . . . . . . . . . . . . . . . . 68
The gap between installed capacity and actual peak demand. . . . . . . . . . . . . . . . . . . . . . . . . . . . 69
The ability of different electricity resources to meet peak demand . . . . . . . . . . . . . . . . . . . . . . . . 70
Maintaining a reserve margin . . . . . . . . . . . . . . . . . . . . . . . . . . . . . . . . . . . . . . . . . . . . . . . . . . . . . . 73
Did Ontario build more than was needed to meet peak demand? . . . . . . . . . . . . . . . . . . . . . . . . . 74
Ontario’s 18-Month Outlook . . . . . . . . . . . . . . . . . . . . . . . . . . . . . . . . . . . . . . . . . . . . . . . . . . . . . . . 76
Conclusion. . . . . . . . . . . . . . . . . . . . . . . . . . . . . . . . . . . . . . . . . . . . . . . . . . . . . . . . . . . . . . . . . . . . . 77
Endnotes . . . . . . . . . . . . . . . . . . . . . . . . . . . . . . . . . . . . . . . . . . . . . . . . . . . . . . . . . . . . . . . . . . . . . . 78
65Environmental Commissioner of Ontario 2018 Energy Conservation Progress Report, Volume One
Has Ontario’s electricity system become more reliable and able to meet peak demand? Q5

The details…
The August 2003 blackout brought home the importance of a reliable supply of power to our modern economy and way of life. During this event, the northeast North American bulk power system experienced a mass blackout where over 50 million people lost power. Northeastern North America, including Ontario, lost an estimated $6.5 billion from the blackout; Ontario lost 18.9 million work hours.1 The 2003 blackout was not caused by events in Ontario or because of grid issues in the province. However, the reliability of Ontario’s electricity system, and its ability to provide enough electricity at times of peak demand, was a concern during the early 2000s. This chapter explores the current reliability of Ontario’s electricity, and how it has changed since 2003.
A reliable electricity system must be able to meet Ontario demand at all timesReliability of the electricity system depends on all the links in the electricity system – generating power, and transmitting and distributing the power to customers. Although local incidents involving the delivery wires cause most customer outages (see textbox “Reliability in electricity distribution”), delivery systems can only deliver as much power as generators supply to them. This chapter therefore focuses on the ability of Ontario electricity generators to generate enough electricity to meet customer demand. In some cases, transmission constraints may limit how much power can actually be moved from one place to another.2
Reliability in electricity distribution
Most power outages are due to issues on the local distribution network. Roughly 70 local electricity distribution companies (LDCs) distribute electricity to customers in most urban areas of Ontario; Hydro One (in addition to providing long distance and high voltage transmission of bulk power) distributes electricity to most rural and remote customers. For example, 40% of Toronto Hydro customer outages are caused by aging equipment, 18% by contact with foreign objects, 15% by environment/weather, and only 8% because of loss of supply of bulk power. 3% of the outages are scheduled by the LDC for maintenance.3
Reliability is an important performance measure for the LDCs as part of the Ontario Energy Board (OEB) scorecard. LDCs must report to the OEB both the average number of customer outages (time customers were without power), and the overall duration of outages.4 Major weather-related events, such as ice storms, can increase outages dramatically but do not affect these statistics.5 The OEB compares each LDC’s performance on these reliability indicators to its previous performance (using a 5-year rolling average). For example, Toronto Hydro’s 2016 OEB scorecard shows that the average number of outages customers experienced per year was 1.28 (again beating its target of 1.36), and the average time customers were without power (from all outages combined) was 55 minutes (lower than the OEB-set target of 1.11 hours).6 For LDCs as a group, reliability performance has been relatively stable in recent years.7
The August 2003 blackout brought home the importance of a reliable supply of power.
Most power outages are due to issues on the local distribution network.
66 Making Connections: Straight Talk About Electricity in Ontario
Q5

Those few hours of peak demand drive many of the costs of Ontario’s electricity system.
The OEB must approve the rates that support an LDC’s capital investment plans. Smart grid investments by LDCs could reduce the number and duration of outages, using technology to identify equipment failures and outages as they occur, and in some cases to automatically re-route power flows; see the ECO’s report Smart from Sunrise to Sunset.8 Smart grid investments could also help LDCs accommodate distributed renewable power generation. It is up to each LDC to upgrade its distribution network, and to make a persuasive investment case to the OEB for its capital investment plan.
In its Long-Term Energy Plan Implementation Plan released February 21, 2018, the OEB has set a goal to improve utility accountability and availability of information to customers regarding the LDCs’ provision of service, including reliability and power quality.9
In particular, the province must have enough electrical supply to meet peak demand, which usually occurs for only a few hours each year. Peak demand can be more than double minimum demand (some 13,000 MW higher, see Figure 5.1) and the province must have adequate electricity supply to meet the highest of these peak demands. Those few hours of peak demand are disproportionately expensive to supply, and drive many of the costs of Ontario’s electricity system (see Q9).
Figure 5.1. The range of electricity demand by hour, or ‘load duration curve’, for 2016 (Ontario).
Source: “Data Directory: 2016 Generator Output and Capability reports”, online: Independent Electricity System Operator <www.ieso.ca/-/media/files/ieso/power-data/data-directory/goc-2016.xlsx?la=en&hash=3C6E47A28856ADB539CD293C6816DA0873808EA1>. [Accessed 6 March 2018]
0
5000
10000
15000
20000
25000
025
050
075
010
0012
5015
0017
5020
0022
5025
0027
5030
0032
5035
0037
5040
0042
5045
0047
5050
0052
5055
0057
5060
0062
5065
0067
5070
0072
5075
0077
5080
0082
5085
0087
50
Syst
em e
lect
ricity
dem
and
(MW
)
Hours
2016
67Environmental Commissioner of Ontario 2018 Energy Conservation Progress Report, Volume One
Has Ontario’s electricity system become more reliable and able to meet peak demand? Q5

Reliability in the early 2000s Even before the coal closures began, Ontario’s electricity supply was not keeping up with its growth in demand. Between 1996 and 2003, the province’s generation capacity fell by 6% while demand grew by 8.5%. There was modest investment to build new supply; investments to maintain and upgrade transmission and distribution lines were less than half of current levels. By the early 2000s, the threat of inadequate supply of electricity loomed over Ontario whenever an extended heat wave settled in. The coal closures removed another 7,600 MW of power capacity by 2014.10
What can the system operator do when there isn’t enough electricity?
When Ontario’s ability to supply enough electricity becomes doubtful, the IESO must do what it can to prevent the problem from affecting grid stability and causing a complete loss of power (a blackout). The IESO’s actions may include: refusing (cancelling) planned shutdowns by generators, using demand response programs to reduce participating customers’ electricity use, and importing more/ exporting less electricity.11
If those actions are not enough, the IESO can make public appeals to conserve electricity, and can reduce the voltage of the power delivered by about 3-5% (i.e., create brownouts). Brownouts are visible as a slight dimming of lighting, and can have performance impacts on motors, electronics, and other equipment that is sensitive to changes in voltage. The IESO runs voltage reduction tests on occasion to identify any issues and stay prepared in case there is the need to schedule an actual brownout to maintain reliability.
By the early to mid-2000s, rolling brownouts and public appeals to conserve were not uncommon during the hottest days of the year.12 This was one of the major drivers for Ontario’s investments in both new generation and electricity conservation programs, discussed in Q4.
Since then, driving down peak demand coupled with increasing supply have led to a higher level of reliability in Ontario’s bulk electricity supply. The IESO has only issued one public appeal for emergency conservation measures since 2007. This was a 2013 appeal that was limited to the Toronto area and caused by severe flooding that knocked several major transformer stations out of service.13 This bottleneck prevented electricity moving from the transmission system to serve Toronto customers, and required Toronto Hydro to impose rotating blackouts.
Later in this chapter, we examine other metrics to provide a more complete picture of Ontario’s ability to reliably meet electricity demand.
Rolling brownouts and public appeals to conserve were not uncommon.
68
Has Ontario’s electricity system become more reliable and able to meet peak demand?
Making Connections: Straight Talk About Electricity in Ontario
Q5

Toronto flooding after the July 8, 2013 summer storm.
Source: Toronto Hydro.
The gap between installed capacity and actual peak demandWhile Ontario’s improved ability to reliably meet peak demand is unquestionably a good thing, concerns have been raised that the government has overinvested in both supply and conservation, far in excess of what is needed to meet peak demand.
Since the 2008/09 global recession, Ontario has seen a flat and slightly declining annual peak demand, the causes of which are explained in Q3 of this report. Meanwhile, installed capacity has grown. As presented in Figure 5.2, this created a widening gap between peak demand and installed capacity.
69Environmental Commissioner of Ontario 2018 Energy Conservation Progress Report, Volume One
Has Ontario’s electricity system become more reliable and able to meet peak demand? Q5

Figure 5.2. Actual peak demand vs. installed capacity for Ontario, 2009-2017.
Source: “Media: Year End Data”, online: Independent Electricity System Operator <www.ieso.ca/corporate-ieso/media/year-end-data> [Accessed 6 March 2018]; Independent Electricity System Operator, 18-Month Outlook, An Assessment of the Reliability and Operability of the Ontario Electricity System, from January 2018 to June 2019 (Toronto: IESO, December 2017) at 21.
This gap has sometimes been mistakenly criticized as wasteful. However, most of this gap is necessary, because:
• Not all electricity resources are fully available at thetime of peak demand; and
• Ontario must maintain a large reserve margin, abovethe actual peak, in case of unexpected events.
The ability of different electricity resources to meet peak demandTotal system “installed capacity” is considerably greater than actual electricity production capability at peak. Installed capacity measures the maximum electricity production a generator can ever deliver. No electricity resource can be counted on to produce maximum power at all time – nuclear plants need maintenance shutdowns, natural gas plants lose efficiency in hot conditions, hydro plants may have less water available in the summer etc.
“Capacity contribution” tells us how much electricity (as a percentage of installed capacity) a resource
0
5000
10000
15000
20000
25000
30000
35000
40000
45000
2009 2010 2011 2012 2013 2014 2015 2016 2017
Actu
al p
eak
dem
and
and
inst
alle
d ca
paci
ty (M
W)
Year
Actual peak demand (MW) Ontario installed capacity (MW)
Most of the gap between peak demand and installed capacity is necessary.
70
Has Ontario’s electricity system become more reliable and able to meet peak demand?
Making Connections: Straight Talk About Electricity in Ontario
Q5

is expected to produce, specifically at the time of day and year when the system is at peak demand.14
Historically, peak electricity demand hours have been between 4 to 6 p.m. on hot summer weekdays or cold winter weekdays, with some exceptions, mainly due to the weather. One key factor to note is that demand patterns between summer and winter are quite different (see Figure 3.2 in Q3). Ontario has moved away from a traditional winter peaking pattern to a summer peaking pattern in recent years. Winter peaks are shorter, usually around dinner time, while in the summer high demand is sustained throughout the afternoon into the evening because of air conditioning load. Many of Ontario’s hydroelectric stations were built to meet the
traditional winter peaking loads, but are insufficient to meet summer demand. This requires other resources, such as solar power and peaking gas generation plants, to make up the gap.15
Capacity contributions for different resources are presented in Figure 5.3. Nuclear, natural gas, and bioenergy can deliver close to 100% of installed capacity at summer peaks (although gas-fired production drops slightly in hot weather). The contribution of hydropower is slightly lower (likely due to water availability), while the capacity contribution of demand response depends on how reliable participants are in reducing their electricity use.
Figure 5.3. Peak demand capacity contribution (summer vs. winter, Ontario).
Note: Solar contribution to the grid’s summer peak is shown at less than 40% of capacity, because solar capacity drops late in the afternoon (see Figure 5.4), which is when the grid peak currently occurs. The 87% of solar power that is embedded (not connected directly to the bulk grid) meets more of customer demand earlier in the day, which is part of why the grid (net of embedded solar) experiences its summer peak demand later in the afternoon.
Source: Independent Electricity System Operator, “Module 4: Supply Outlook” (presentation, August 2016) slide 39.
Cap
acity
Con
tribu
tion
(as
a %
of i
nsta
lled
capa
city
)
100%
Nuclear Natural Gas Bioenergy DemandResponse
Water
At Summer PeakAt Winter Peak
Solar Wind
90%
80%
70%
60%
50%
40%
30%
20%
10%
0%
71Environmental Commissioner of Ontario 2018 Energy Conservation Progress Report, Volume One
Has Ontario’s electricity system become more reliable and able to meet peak demand? Q5

The capacity contributions of wind and solar look very low, but this is in part because installed capacity is simply not a good measure of the average amount of electricity that wind and solar projects produce. Wind and solar generators are sized to make use of nearly the maximum amount of sun or wind energy that will be available, but in most hours, electricity production will be lower than this maximum. Averaged over all 8,760 hours of the year, electricity production from Ontario wind projects has been about 25-30% of installed capacity, and about 15% for solar (because no solar power is generated after the sun sets).
A better way to assess how well wind and solar contribute to meeting peak demand is to compare their production at time of peak to their average production
levels. Wind delivers slightly more energy than average at the winter peak, though much less at the summer peak. Solar on the other hand delivers much more energy than average at the summer peak, and almost none at the winter peak. The capacity contribution of solar is very specific to the time of day. This change in solar capacity throughout a summer day is presented in Figure 5.4. The 87% of the province’s solar power that is embedded (connected directly to the customer) reduces the summer peak that the grid must serve, i.e., that the IESO reports, and delays the grid peak until later in the afternoon.It is also worth noting that this embedded power is not shown as a source of supply in the IESO’s on-line supply mix report, Power Data.This means that 87% of Ontario’s solar power, and about 12% of its wind power, is effectively invisible in these reports.
Figure 5.4. Average variation in solar electricity output over the day for July and August 2017.
Note: This is a summary of all grid connected solar farms: Grand, Kingston, Northland, Southgate, and Windsor Airport.
Source: “Data Directory: Generator Output and Capability”, online: Independent Electricity System Operator <www.ieso.ca/en/power-data/data-directory>.[Accessed 9 March 2018]
As Ontario has increased its supply of wind and solar generation, “installed capacity” has become an increasingly inaccurate way to measure the province’s ability to meet peak demand, as shown in Table 5.1.
“Installed capacity” has become an increasingly inaccurate way to measure the province’s ability to meet peak demand.
0%
10%
20%
30%
40%
50%
60%
70%
80%
1 2 3 4 5 6 7 8 9 10 11 12 13 14 15 16 17 18 19 20 21 22 23 24
Aver
age
sola
r out
put a
s %
of a
vaila
ble
capa
bility
for
July
and
Augu
st 2
017
Hours of the Day
72
Has Ontario’s electricity system become more reliable and able to meet peak demand?
Making Connections: Straight Talk About Electricity in Ontario
Q5

Ontario now has an increased obligation to prepare for the unexpected.
Table 5.1. Estimated contribution of newly installed resources available to meet peak demand, by generation source.
Resource Change in installed supply resources, 2005-2015 (MW)
Estimated contribution to
summer peak (MW)
Estimated contribution to winter peak (MW)
Nuclear 1,617 1,600.83 1,455.3
Natural Gas 4,876 4,339.64 4,632.2
Bioenergy 575* 511.75 511.75
Demand Response 690 572.7 455.4
Waterpower 858 609.18 643.5
Solar 2,119* 699.27 105.95
Wind 4,334* 476.74 1,213.52
*Calculated using the capacity contributions at time of peak demand. The renewable generation figures include 134 MW of renewable energy that was available to the province in 2005 and also in 2015.
Note: Conservation programs (except for demand response) are not part of this table as they are not considered supply resources by the IESO. However, conservation initiatives, along with saving electricity overall, also help reduce peak demand. Under the 2011-2014 Conservation and Demand Management Framework, conservation and demand management initiatives reduced peak demand by 928 MW. In each of the two reported years of the 2015-2020 Conservation First Framework, the province saw additional peak demand reductions of 187 MW in 2015 and 167 MW in 2016.19
Source: Independent Electricity System Operator, “Module 4: Supply Outlook” (presentation, August 2016) slide 40; Independent Electricity System Operator, “Module 1: State of the Electricity System: 10-Year Review” (presentation, August 2016) slide 16.
Maintaining a reserve marginA second key reason for the apparent gap between theoretical capacity and peak demand is Ontario’s increased obligation, since 2007, to prepare for the unexpected.
Ontario’s electricity system is interconnected with a larger network of transmission systems across North America. Because instability in one system can have a ripple effect through the interconnections (as demonstrated in the 2003 blackout), the ability of Ontario to meet demand at all times also affects interconnected jurisdictions. Therefore, the IESO has to meet cross-jurisdictional standards that it shares with the interconnected electricity systems. The North
American standards authorities, namely the North American Electric Reliability Corporation (NERC) and the Northeast Power Coordinating Council (NPCC), define the reliability requirements for the planning and operations of the interconnected North American bulk electricity system that Ontario is a part of.20 These requirements have been in place in Ontario since the 2002 market opening as part of the province’s market rules. Requirements and standards were further strengthened after the August 2003 blackout across all of NERC and NPCC’s members.21
73Environmental Commissioner of Ontario 2018 Energy Conservation Progress Report, Volume One
Has Ontario’s electricity system become more reliable and able to meet peak demand? Q5

One of the core elements of these reliability standards is reserve margin requirements. The IESO is mandated by the transboundary Northeast Power Coordinating Council to maintain a certain level of generation sufficiency at all times, not only to meet peak demand requirements within the Province but also to maintain and enhance the reliability and adequacy of the northeastern interconnected bulk electricity system.22 The council’s resource adequacy design criteria require Ontario to have sufficient capacity to meet all its own demand at all times, except (at most) 0.1 day every year. Imports cannot be counted towards this requirement, unless they are firm, i.e., unless Ontario has first call on the electricity, ahead of the producing jurisdiction.
This requirement is assessed using a probabilistic model to simulate various uncertainties – e.g., what if summer is hotter than usual?; what if a large generating station goes out of service unexpectedly?; what if renewable energy production is less than expected at time of peak?23
The bottom line is that Ontario must now have significant generation capacity above its projected annual peak demand, to be able to respond to unexpected events.
Table 5.2 is the latest reserve margin requirement projections from the IESO. It shows that the province has to oversize its electricity system by about 18% specifically to meet this reliability requirement. This is
the reserve margin requirement, i.e., the resources Ontario must have in excess of its highest peak demand to be part of the interconnected North American grid.24
Table 5.2. Ontario reserve margin requirements by year.
Year 2018 2019 2020 2021 2022
Reserve Margin (%) 18.2 17.7 17.4 17.4 17.9
Source: Independent Electricity System Operator, Ontario Reserve Margin Requirements 2018-2022 (Toronto: IESO, December 2017) at 5.
Did Ontario build more than was needed to meet peak demand?Considering these two factors, did Ontario overbuild and over-invest in our system?
Figure 5.5 uses data from the IESO’s 18-Month Outlook reports (see sidebar “Ontario’s 18-Month Outlook”) to compare projected peak demand and actual peak demand with both the capacity Ontario was required to have on hand (Required Resources), and how much it actually had (Available Resources).
74
Has Ontario’s electricity system become more reliable and able to meet peak demand?
Making Connections: Straight Talk About Electricity in Ontario
Q5

Figure 5.5. Comparison of Ontario’s projected vs. actual peak demand with available resources, 2006-2016.
Note: The projected peak demand for each year is the highest demand week for each year predicted in the 18 Month Outlooks from 2005-2016, assuming “normal weather” conditions. The data for “Available Resources” and “Required Resources” is based on the “Planned” scenario in the 18 Month Outlook, which assumes all resources scheduled to come into service within the given time frame will be available.25
Source: “Planning and Forecasting: 18-Month Outlook”, online: Independent Electricity System Operator <www.ieso.ca/sector-participants/planning-and-forecasting/18-month-outlook> [Accessed 6 March 2018]; “Data Director: Hourly Ontario and Market Demands, 2002-2017”, online: Independent Electricity System Operator <www.ieso.ca/-/media/files/ieso/power-data/data-directory/hourlydemands_2002-2017.csv?la=en&hash=E7C85714534E2B897C210BC30EBC9647A2824620> [Accessed 6 March 2018].
The projected maximum annual peak demand is shown. As explained earlier, the IESO must maintain a reserve margin over and above its annual peak demand projections, which in Figure 5.5 is shaded and shown as the Required Reserve (the area bordered by the Projected Peak Demand and the Required Resources). Actual peak demand in each year is also shown. Note that peak demand in 2011 was much higher than projected – a reminder of why reserve margins are needed.
The Reserve Above Requirement (RAR) shows the difference between Available Resources and Required Resources. Only this portion of Ontario’s electricity supply can be considered to be in excess of what Ontario needs to have on hand. We can see
that between 2006 and 2008 the province actually experienced periods of negative RAR, which means that there weren’t sufficient resources to meet any unforeseen issues. Figure 5.5 shows that Ontario temporarily had a large excess of unneeded generation between 2010 and 2013, but this dropped abruptly when the Lambton and Nanticoke coal plants closed, removing some 3,000 MW from service.26 Ontario had to build new gas plants and refurbish Bruce nuclear units before closing the coal plants and had to wait for a certain period to ensure that the new technology to
0
5
10
15
20
25
30
35
2006 2007 2008 2009 2010 2011Year
2012 2013 2014 2015 2016
Elec
trici
ty R
esou
rces
(GW
)
Reserve Above Requirement
Required Reserve
Actual Peak demand
Available Resources
Required ResourcesProjected peak demand
Between 2006 and 2008 there weren’t sufficient resources.
75Environmental Commissioner of Ontario 2018 Energy Conservation Progress Report, Volume One
Has Ontario’s electricity system become more reliable and able to meet peak demand? Q5

be running reliably to meet electricity demands. During this transition between coal to other cleaner generation, the province experienced the higher reserve margins that we see in Figure 5.5.
Since 2015, Ontario has not had a significant excess of supply at times of peak demand. In fact, some days have been quite challenging. Once in each of the last three years, IESO has had to issue an energy emergency alert to the North American Electric Reliability Corporation, indicating that all electricity resources within Ontario were fully committed.27
Conditions will continue to be rather tight during the period of nuclear refurbishment, even though the Napanee gas-fired generating station will come on-line in 2018, adding almost 1,000 MW of new capacity.28
Additional evidence that the electricity system does not have significant excess capacity comes from the IESO’s 18-month outlooks (see sidebar “Ontario’s 18-Month Outlook”).
Ontario’s 18-Month Outlook
The IESO’s 18-Month Outlook reports quarterly on the province’s electricity reliability, to meet provincial and inter-jurisdictional requirements.29
The report looks at the forecast electricity demand for each week over the next 18 months.30 On the supply side, the report reviews if the province has enough generation to meet the projected demand in each week, taking into account near-term changes such as generators scheduled to come in or out of service, and scheduled maintenance outages.31 The Outlook also considers the adequacy of the transmission system, including any scheduled outages and new additions to the system.32 And finally, the outlook looks at any upcoming operability issues, which includes managing the province’s surplus baseload generation, discussed in Q7.
Figure 5.6 shows that Ontario’s electricity generation reliability is much higher now than it was in 2005. However, since the closure of the coal plants, there have been multiple weeks each year where the 18-month outlook predicted that resources could fall below requirements, if extreme hot or cold weather occurred. Under negative Reserve Above Requirement (RAR) conditions, the province would not have sufficient Available Resources to meet its mandated reliability requirements. Because this is an advance projection, it should be interpreted as a directional indicator of how tight supply conditions may be, not an accurate indicator of real-time conditions. Closer to real time, the IESO takes actions to prevent a shortfall (e.g., rescheduling planned generator outages). This also gives generators and transmitters the opportunity to move any restrictive outages to surplus periods.
Since 2015, Ontario has not had a significant excess of supply at times of peak demand.
76
Has Ontario’s electricity system become more reliable and able to meet peak demand?
Making Connections: Straight Talk About Electricity in Ontario
Q5

Figure 5.6. Number of weeks with negative Reserve Above Requirement (RAR) under planned scenarios by year.
Source: Independent Electricity System Operator, information provided in response to ECO inquiry (31 January 2018).
ConclusionOntario now has adequate, but not excessive, electricity supply to meet its peak demand. Although the province has surplus electricity at times of low demand, there is no surplus capacity at times of peak demand and adverse weather. The apparent gap between peak demand and installed capacity is due to mandatory reserve margins and the fact that not all installed capacity produces power at the same time.
Ontario now has adequate, but not excessive, electricity supply to meet its peak demand.
0
5
10
15
20
25
30
35
40
45
2005 2006 2007 2008 2009 2010 2011 2012 2013 2014 2015 2016 2017
Num
ber o
f wee
ks/y
ear
Year
Planned normal Planned extreme
77Environmental Commissioner of Ontario 2018 Energy Conservation Progress Report, Volume One
Has Ontario’s electricity system become more reliable and able to meet peak demand? Q5

Endnotes
1 Electricity Consumers Resource Council, The Economic Impacts of the August 2003 Blackout (Toronto: ELCON, February 2004) at 1; U.S.-Canada Power System Outage Task Force, Final Report on the August 14, 2003 Blackout in the United States and Canada: Causes and Recommendations (Ottawa: U.S.-Canada Task Force. April 2004) at 1.
2 Some examples where transmission constraints can be a limiting factor include: Ontario’s ability to import or export power through interties with other jurisdictions; transmission connections between northwestern Ontario and the rest of the province (currently being addressed through the construction of a new transmission line), and long-standing concerns that a third transmission line may be required in central Toronto to bring enough power into the city centre to meet demand.
3 “What Causes Power Outages”, online: Toronto Hydro <www.torontohydro.com/sites/electricsystem/PowerOutages/Pages/aboutoutages.aspx>. [Accessed 2 March 2018]
4 As part of the regulator’s performance benchmarking mechanism under its Renewed Regulatory Framework. SAIDI (System Average Interruption Duration Index - the average number of hours that power to a customer is interrupted) and SAIFI (System Average Interruption Frequency Index - the average number of times that power to a customer is interrupted) are reported under System Reliability (Ontario Energy Board, 2016 Sector-Wide Consolidated Scorecards of Electricity Distributors (Toronto: OEB, 2013) at 5).
5 Ontario Energy Board, Electricity Distribution System Reliability: Major Events, Reporting on Major Events and Customer Specific Measures (Toronto: OEB, December 2015) at 13-14.
6 Toronto Hydro, Scorecard- Toronto Hydro Electric System Limited (Toronto: Toronto Hydro, September 2017) at 6.
7 Ontario Energy Board, information provided to the ECO in response to ECO inquiry (2 March 2018).
8 Environmental Commissioner of Ontario, Smart: From Sunrise to Sunset (Toronto: ECO, October 2014) at 33-35.
9 Ontario Energy Board, LTEP Implementation Plan (Toronto: OEB, February 2018) at 8-9.
10 “The End of Coal”, online: Government of Ontario <www.ontario.ca/page/end-coal>. [Accessed 2 March 2018]
11 A more comprehensive list includes: • Rejecting outage applications, and cancelling and recalling
approved outages • Using the IESO’s 159 MW of contracted Capacity Based Demand
Response to temper some of the peak requirements • Issuing general or public appeal to conserve electricity if the system
requires additional flexibility • Reconfiguring the transmission system to avoid declaring
an emergency • Curtailing scheduled exports for which the IESO may have to
offer compensation • Reducing voltage by 3- 5% to use as 10- minute operating reserves • Requesting and purchasing emergency energy from the rest of
interconnected grid • Requesting market participants to implement all approved
environmental variances • Curtailing non-dispatchable loads through emergency blocks or
rotational load shedding (brownouts)
While there is an anticipated order of actions that the IESO is expected to take based on the seriousness of the event, the IESO can initiate any of the controls depending on the circumstances (Market Manual at 55). The IESO will not generally take any actions that don’t have a net benefit on the system. So exports could continue even while load is being curtailed in another part of the province. (Independent Electricity System Operator, Part 7.1: IESO-Controlled Grid Operating Procedures (Toronto: IESO, December 2017) at 55-65).
12 “Media: About Public Appeals”, online: Independent Electricity System Operator<www.ieso.ca/en/corporate-ieso/media/about-public-appeals>. [Accessed 2 March 2018]
13 IESO, information provided in response to ECO inquiry (31 January 2018).
14 North American Electric Reliability Corporation, Methods to Model and Calculate Capacity Contributions of Variable Generation for Resource Adequacy Planning (New Jersey: NERC, March 2011) at 4.
15 Independent Electricity System Operator, information provided in response to ECO inquiry (25 February 2018).
16 With solar generation at its highest in the middle of the day, this has reduced some pressure on the grid during early afternoon hours. Peak hours now occur between 4 to 6 pm in the summer, when solar generation is slightly less able to contribute towards moderating those peaks as its capacity contribution falls later in the day. (“Top Ten Ontario Demand Peaks, 2002-2017” online: Independent Electricity System Operator<www.ieso.ca/-/media/files/ieso/settlements/top-ten-ontario-demand-peaks-archive.xlsx?la=en>. [Accessed 2 March 2018]; “Peak Tracker for Global Adjustment Class A”, online: Independent Electricity System Operator <www.ieso.ca/en/sector-participants/settlements/global-adjustment-for-class-a>. [Accessed 2 March 2018])
17 “Power Data”, online: Independent Electricity System Operator <www.ieso.ca/power-data>. [Accessed 2 March 2018]
18 Letter from the Ontario Energy Board to all Licensed Electricity Distributors and All Other Interested Parties (23 December 2015), online <www.rds.oeb.ca/HPECMWebDrawer/Record/511001/File/document>
19 Environmental Commissioner of Ontario, Every Joule Counts, Ontario’s Energy Use and Conservation Year in Review (Toronto: ECO, August 2017) at 87.
20 The current reliability standards for Ontario’s bulk electricity system has been designed and implemented according to mutual understandings set out in memorandums of understanding (MOUs) between the IESO, the OEB, NERC and NPCC. The IESO is required to regularly submit seasonal assessment reports and its 18-month outlook to both the NPCC and NERC to assist with maintaining the reliability of the interconnected markets.
21 Independent Electricity System Operator, information provided in response to ECO inquiry (25 February 2018).
22 The Northeast Power Coordinating Council (NPCC) is a not-for-profit corporation responsible for promoting and enhancing the reliability and the adequacy of the international, interconnected electricity grid systems in Northeast North America.
23 Independent Electricity System Operator, Ontario Reserve Margin Requirements 2018-2022 (Toronto: IESO, December 2017) at 3; Independent Electricity System Operator, Methodology to Perform Long Term Assessments (Toronto: IESO March 2017) at 13.
78
Has Ontario’s electricity system become more reliable and able to meet peak demand?
Making Connections: Straight Talk About Electricity in Ontario
Q5
.
.
.
.
.
.
.
.
.
.
.
.
.
.
.
.
.
.
.
.
.
.
.

24 This planning reserve calculation reflects the internal supply mix and their availabilities or capacity factors, forecast demand levels and related uncertainties, transmission limitations and both scheduled and unscheduled resource outages.
25 Independent Electricity System Operator, 18 Month Outlook from January 2018 to June 2019 (Toronto: IESO, December 2017) at 20.
26 “Supply Overview: New and Retired Generation since the IESO Market Opened in 2002”, online: Independent Electricity System Operator <www.ieso.ca/power-data/supply-overview/transmission-connected-generation>. [Accessed 2 March 2018]
27 IESO, information provided in response to ECO Inquiry (31 January 2018).
28 “Supply Overview: New and Retired Generation since the IESO Market Opened in 2002”, online: Independent Electricity System Operator <www.ieso.ca/power-data/supply-overview/transmission-connected-generation>. [Accessed 2 March 2018]
29 The IESO is mandated to file this report every quarter with the Ontario Energy Board (OEB), the Northeast Power Coordinating Council (NPCC) and the North American Electricity Reliability Corporation (NERC).
30 Short-term demand is mainly influenced by population changes, economic circumstances, electricity initiatives such as conservation and renewable generation, weather events and electricity prices.
31 The IESO also has to establish a Reserve Above Requirement which is the difference between Available Resources and Required Resources in the electricity grid. Difference between Available Resources (Available generation + demand management measures) and Required Resources (demand forecast+ required reserve). (Independent Electricity System Operator, Ontario Reserve Margin Requirements 2018-2022 (Toronto: IESO, December 2017) at 12-13.)
32 Transmission projects that are planned for completion within the 18-Month Outlook period, major modifications to existing transmission assets and transmission outages for facilities with voltage levels of 115 kV or over and with a duration longer than five days are included in this assessment. The planned transmission outages are reviewed parallel to any planned generation outages to ensure that the system’s overall reliability is maintained. Transmitters and generators are expected to coordinate these outage activities, especially when there is a forecast deficiency in the system.
.
.
.
.
.
.
.
.
.
79Environmental Commissioner of Ontario 2018 Energy Conservation Progress Report, Volume One
Has Ontario’s electricity system become more reliable and able to meet peak demand? Q5

2005
Q U ES T I O N 6
How does Ontario deal with the variability of wind and solar electricity output?
All forms of electricity generation are variable at different time scales. Ontario’s grid operator has tools to balance variability in real-time and has integrated wind and solar to date without causing operational problems, while making use of most renewable electricity that is produced. New tools will help integrate more renewable generation.
Electricity production from wind and solar can vary greatly, on very short time scales, day to day and hour to hour, bringing new challenges to the grid operator’s role of balancing supply and demand. The Independent Electricity System Operator has been able to utilize most renewable electricity production, and balance the grid, by using better forecasting of renewable electricity production, real-time visibility of power production, and the ability to curtail renewable electricity output.
As electricity production from renewables grows, Ontario will need better tools for real-time balancing that go beyond curtailment and gas-fired generation backup to a much broader range of flexibility options. International best practices can show the way. Many jurisdictions use much more wind and solar electricity than Ontario does; however, the high share of inflexible nuclear and baseload hydro in Ontario can make variable renewables integration more challenging.
I M PAC T O N T H E E L E C T R I C I T Y SYS T E M

Contents
THE DETAILS . . . . . . . . . . . . . . . . . . . . . . . . . . . . . . . . . . . . . . . . . . . . . . . . . . . . . . . . . . . . . . . . . . . 82
All resources are variable . . . . . . . . . . . . . . . . . . . . . . . . . . . . . . . . . . . . . . . . . . . . . . . . . . . . . . . . . 82
The variability of wind and solar. . . . . . . . . . . . . . . . . . . . . . . . . . . . . . . . . . . . . . . . . . . . . . . . . . . . 82
How does Ontario compare? . . . . . . . . . . . . . . . . . . . . . . . . . . . . . . . . . . . . . . . . . . . . . . . . . . . . . . 85
Managing variability . . . . . . . . . . . . . . . . . . . . . . . . . . . . . . . . . . . . . . . . . . . . . . . . . . . . . . . . . . . . . 85
Geographic dispersion . . . . . . . . . . . . . . . . . . . . . . . . . . . . . . . . . . . . . . . . . . . . . . . . . . . . . . . . . . . 85
Storage . . . . . . . . . . . . . . . . . . . . . . . . . . . . . . . . . . . . . . . . . . . . . . . . . . . . . . . . . . . . . . . . . . . . . . 87
Integrating renewables in real-time operations. . . . . . . . . . . . . . . . . . . . . . . . . . . . . . . . . . . . . . . . 87
Managing the electricity system during a solar eclipse . . . . . . . . . . . . . . . . . . . . . . . . . . . . . . . . . . . . 89
Adding flexibility tools. . . . . . . . . . . . . . . . . . . . . . . . . . . . . . . . . . . . . . . . . . . . . . . . . . . . . . . . . . . . 90
International best practices . . . . . . . . . . . . . . . . . . . . . . . . . . . . . . . . . . . . . . . . . . . . . . . . . . . . . . . 90
Endnotes . . . . . . . . . . . . . . . . . . . . . . . . . . . . . . . . . . . . . . . . . . . . . . . . . . . . . . . . . . . . . . . . . . . . . . 92
81Environmental Commissioner of Ontario 2018 Energy Conservation Progress Report, Volume One
How does Ontario deal with the variability of wind and solar electricity output? Q6

The details…
All resources are variable The Independent Electricity System Operator (IESO) has a core responsibility to balance supply with demand in real time, so as to avoid grid instability and frequency fluctuations. It is a significant feat that it does so, so reliably.
All power sources are variable on different time scales. Because of water availability, hydroelectric production goes up in the spring and fall, when electricity demand is low, and then down in the summer when demand typically peaks; it can drop even further during a drought. Generators of all types go out of service at some point for maintenance and/or refurbishment, sometimes briefly, sometimes for months or even years. Transmission systems that delivers power to load centres also require maintenance and may force generators out of service during their downtime.
The causes are different, but the end result is the same. No source of power is available all the time. When one source is not available, the rest of the electrical grid must take up the slack. In Ontario, the IESO must approve all intentional generation and transmission outages to help minimize impacts.
On shorter timescales, many factors force the grid operator to make adjustments to balance supply with demand in real time. Customer demand varies, both predictably and unpredictably, and weather, mechanical problems and accidents may interrupt any source of
power and/or its transmission lines at any time. Wind and solar generation add to this challenge because their power production can vary rapidly on short time scales.
The IESO continually makes near real-time forecasts of expected demand and available generation. These forecasts use historical information and take into account weather patterns and other factors that influence demand (e.g.,weekend versus weekdays), expected generator outages, and other relevant factors.1 These forecasts are never perfect, and the unexpected can occur (e.g., a mechanical problem knocks a generator out of production). When it does, the IESO’s control room operators have additional tools to balance the grid in real time. For example, they can send out instructions to generators every five minutes to adjust their power production, and call on “operating reserve” – stand-by power or demand reduction that can respond at short notice.2 These are standard elements that ensure a well-functioning, reliable electricity system. Thus integrating the variable electrical output from wind and solar generation is not a new problem, though it is an additional element for the IESO to manage.
The variability of wind and solarWind and solar power production varies substantially, hour by hour and day by day. Some of the variation is predictable, and some is not. Wind power production depends on wind speed; solar production depends on the angle of the sun and the degree of cloud cover. Of the two, solar has a more predictable hour-by-hour pattern. Averaged over many days, solar production shows a predictable pattern tied to the height of the sun in the sky, as shown in Figure 6.1. Solar electricity matches well with Ontario’s demand, generally providing the most power near times of peak summer demand.
The IESO has a core responsibility to balance supply with demand in real time.
No source of power is available all the time.
Wind and solar power production varies substantially, hour by hour and day by day.
82 Making Connections: Straight Talk About Electricity in Ontario
Q6

Figure 6.1. Average variation in solar electricity output over the day for July and August 2017.
Note: This is a summary of all grid connected solar farms: Grand, Kingston, Northland, Southgate, and Windsor Airport.
Source: “Data Directory: Generator Output and Capability”, online: Independent Electricity System Operator <www.ieso.ca/en/power-data/data-directory>.[Accessed 9 March 2018]
However, on a day-to-day basis, solar power production varies with cloud cover. Figure 6.2 is taken from the Princeton University Solar Field.
Figure 6.2. Variability of solar output depends on local weather conditions – an example from the Princeton University Solar Field April 11-16, 2013.
Source: ”Article 5: Storage for grid reliability under variability and uncertainty”, online: Andlinger Center for Energy and the Environment, <acee.princeton.edu/wp-content/uploads/2014/06/Andlinger-Energy-Tech-Distillate-Storage-Article-5.pdf>. [Accessed 9 March 2018]
Wind generation is even more variable. Figure 6.3 shows the variation in daily electricity production from transmission-connected Ontario wind generators in 2016. Some patterns are predictable. On average, wind produces more electricity in the winter months, when demands increase. However, there are large daily variations – while the maximum daily wind production was 84,094 MWh on December 20th, 2016, power production on more than half of the days in the year was less than 30% of this (Figure 6.4).
0%
10%
20%
30%
40%
50%
60%
70%
80%
1 2 3 4 5 6 7 8 9 10 11 12 13 14 15 16 17 18 19 20 21 22 23 24
Aver
age
sola
r out
put a
s %
of a
vaila
ble
capa
bility
for
July
and
Augu
st 2
017
Hours of the Day
83Environmental Commissioner of Ontario 2018 Energy Conservation Progress Report, Volume One
How does Ontario deal with the variability of wind and solar electricity output? Q6

Figure 6.3. Variation in daily Ontario wind production throughout 2016.
Source: “Data Directory: Generator Output and Capability”, online: Independent Electricity System Operator <www.ieso.ca/en/power-data/data-directory>. [Accessed 9 March 2018]
Figure 6.4. Daily wind production in Ontario (2016), as a percentage of maximum daily production.
Note: Maximum daily production was reached on 20 December 2016 at 84,094 MWh.
Source: “Data Directory: Generator Output and Capability”, online: Independent Electricity System Operator, <www.ieso.ca/en/power-data/data-directory>. [Accessed 9 March 2018]
-
10,000
20,000
30,000
40,000
50,000
60,000
70,000
80,000
90,000
31-Jan-1621-Mar-16
10-May-1629-Jun-16
18-Aug-167-Oct-16
26-Nov-16
Daily
ele
ctric
ity p
rodu
ctio
n (M
Wh)
Date
Maximum daily wind production - 84,094 MWh.
0
10
20
30
40
50
60
70
80
90
100
0-10% 11-20% 21-30% 31-40% 41-50% 51-60% 61-70% 71-80% 81-90% 91-100%
Num
ber o
f day
s in
yea
r
Daily wind production, as a percentage of maximum daily production
84
How does Ontario deal with the variability of wind and solar electricity output?
Making Connections: Straight Talk About Electricity in Ontario
Q6

How does Ontario compare?Like other jurisdictions, Ontario is learning to integrate growing levels of variable renewable electricity into its grid. Some jurisdictions with higher wind and solar shares on their electric grid than Ontario are given in Table 6.1. However, Ontario’s high share of inflexible nuclear and baseload hydro can make renewables integration more challenging. Some countries with high levels of renewable electricity make more use of fossil-fuelled generation (which can more easily ramp power production up and down) than Ontario does. For example, Denmark, the world leader in integrating renewable electricity, balances its high share of wind power with interconnections to other countries and fossil fuel back-ups.3
Table 6.1. Share of annual electricity generation in 2016 for selected countries compared with Ontario.
Solar (%) Wind (%) Solar + Wind (%)
Denmark 2 42 44
Ireland 0 20 20
Spain 3 20 23
Germany 6 12 18
United Kingdom 3 11 14
Italy 8 6 14
Ontario* 2 7 9
Australia 3 5 8
United States 1 5 6
China 1 4 5
India 1 3 4
Brazil 0 6 6
Japan 4 1 5
Note: Includes embedded generation.
Sources: “System integration becomes increasingly important”, online: International Energy Agency <www.iea.org/publications/renewables2017/>.[Accessed 9 March 2018]; Independent Electricity System Operator, information provided in response to ECO inquiry (17 November 2017).
In many countries, the share of renewable electricity was even higher in 2017 than shown in Table 6.1. For example, the share of German power production from renewables (including biomass, hydro, wind and solar) grew from 29% in 2016 to 33% in 2017.4 Northern Ireland wind output now contributes as much as 22% of its electricity.5
As renewable electricity grows quickly around the world,6 its growth is being matched by pledges from many companies and governments to move to 100% renewable electricity. These include:
• the government of Canada, for its own operations, by 20257
• at least 190 U.S. cities8, and
• more than 100 global corporations with a total electricity demand of more than 159 TWh/year.9
In other words, many organisations and governments have pledged to use much higher levels of renewable electricity than is currently available from the grid.
Managing variability There are many ways to reduce the variability of renewable electricity provided to the grid, and for the grid to better cope with that variability.
Geographic dispersion
One option is to disperse wind and solar facilities across Ontario.10 The wind may blow and the sun may shine in one part of the province, even if another area is
Ontario’s high share of inflexible nuclear and baseload hydro can make renewables integration more challenging.
85Environmental Commissioner of Ontario 2018 Energy Conservation Progress Report, Volume One
How does Ontario deal with the variability of wind and solar electricity output? Q6

calmer or cloudier. Since solar and wind require different weather conditions, solar and wind can help balance each other. Using a combination of wind and solar resources in multiple locations reduces variability; so the more locations used, the more variability is reduced.11
Geographic dispersion works best when it occurs on a very large scale. Ontario is better placed to take advantage of geographic dispersion than smaller jurisdictions, provided suitable transmission capacity
is available. For example, Ireland experience periods where no wind power is produced, even though 20% of its electricity comes from wind farms dispersed throughout the country. But Ireland is only 275 km wide (east to west), while Ontario is more than 1,560 km wide (east to west), and is connected by land to all its neighbours.
Figure 6.5 shows that most grid-connected wind farms currently operating in the province are located in southwestern Ontario close to the shores of the Great Lakes, where good wind conditions are found.
Building future wind farms in different parts of the province might even out the variability of wind power provided to the grid, possibly with the trade-off of lower electricity production at some locations and a higher cost for transmission to integrate the new wind resources into the system.
Figure 6.5. Location of grid connected wind farms in Ontario, 2018.
Source: “Wind Power in Ontario”, online: Independent Electricity System Operator <www.ieso.ca/localContent/map/default.htm>. [Accessed 9 March 2018]
There are many ways to reduce the variability of renewable electricity provided to the grid, and for the grid to better cope with that variability.
86
How does Ontario deal with the variability of wind and solar electricity output?
Making Connections: Straight Talk About Electricity in Ontario
Q6

Sharing electricity across boundaries is an obvious tool for improving geographic dispersion. Denmark’s ability to make use of the large amount of wind electricity it produces (see Table 6.1) is aided by its ability to exchange electricity with Norway, Germany and Sweden.
The European Union is exploring the concept of a continent wide supergrid,12 to strengthen the current integrated system. Ten year network development plans are currently in progress, and envision up to 60% renewable electricity being incorporated into the grid.13 In this supergrid option, electrical current would be transmitted in ultra high voltage direct current cables, not in alternating current as used in Ontario. This would enable very large amounts of electricity to flow with low losses, so that one country would be able to draw power from wind or sun from another country.
Ontario could similarly pursue greater integration with its neighbours – Quebec, Manitoba, New York and Michigan. Ontario already has a electricity trade agreement with Quebec that allows the IESO to send electricity to Quebec at times of low demand, and then withdraw power at later times when it is needed to displace gas-fired generation.14 Ontario also has significant connections to other external markets such as the Midcontinent Independent System Operator, and the New York Independent System Operator in the U.S. Improvements to optimize the scheduling of energy exports and imports to and from these jurisdictions in the real-time energy market are being considered through the IESO’s Market Renewal initiative.15 This could enable electricity to move more efficiently across borders.
Storage
Wind and solar electricity production can also be combined with storage and/or with flexible renewable sources that can provide power when wind and solar are unable to do so. These include bioenergy or waterpower (with a dam and significant reservoir).
On-site integration of batteries with wind can allow electricity to be stored on a short timescale. This helps to smooth the amount of wind electricity delivered to the grid. Spain has an experimental hybrid wind/storage plant with two batteries–one for fast response, which can output 1 MW of power for 20 minutes and another for a slower response, which can output 0.7 MW for 1 hour.16
For longer periods of storage, pumped storage using water reservoirs is the most common and most cost-effective technology globally, and could be used more in Ontario. Most other solutions to store electricity for longer periods have not been cost effective at the penetration scale needed. However, battery costs are dropping quickly. Italy uses about 56 MW of battery storage to store increased renewable electricity.17 South Australia recently built 100 MW of battery storage, a giant set of lithium-ion Tesla batteries, to store electricity from a nearby wind farm; it can provide power for 30,000 homes.18 An even larger battery (about 50% bigger) is being built in South Korea. Ireland is also conducting research on electricity storage.19 For more details on electricity storage, see Q16.
Integrating renewables in real-time operations As the share of renewable generation increases, the IESO needs to do more to manage short-term variability. The IESO has successfully integrated variable generation by actively planning for it. Under the Renewable Integration SE-91 initiative, the IESO
As the share of renewable generation increases, the IESO needs to do more to manage short-term variability.
87Environmental Commissioner of Ontario 2018 Energy Conservation Progress Report, Volume One
How does Ontario deal with the variability of wind and solar electricity output? Q6

developed design principles to support the anticipated increase in variable generation. This resulted in key changes being made to visibility, forecasting, and dispatch requirements for renewable generators:
• Visibility. It is important for the IESO to know howthe variable generation operations are performing.Renewable electricity facilities therefore submitreal-time, site-specific data. For example, data forwind includes the turbine location, type of turbine,manufacturer’s power curve and cut out temperatureas well as operating conditions such as wind speedand direction and available power.20 Similar operationaldata is provided by solar facilities. Both sets of dataare reported to the IESO every 30 seconds. Theserequirements apply to all wind and solar facilities thatare connected to the transmission grid, as well aslarger embedded generation facilities (those with aninstalled capacity >5 MW).21
• Forecasting. The IESO uses the visibility informationto make a centralized forecast of variable electricityproduction22 and to ensure that additional resourcesare available if needed. The IESO releases the forecast48 hours in advance (including in map format)23 andcontinually updates this forecast closer to the realtime.24
Visibility data and centralized forecasting haveimproved forecasting accuracy (see Figure 6.6 for the forecast error ranges after centralized forecasting was introduced). Average system-wide error for day-ahead predictions has been halved from 15.2% to 7.4%. Hour-ahead predictions are even more accurate, with average error dropping from 5.9% to 3.6%.25 Forecasting accuracy improves dramatically by the time when final instructions from the grid operator can be given to generators (five minutes before real time).
Figure 6.6. IESO forecast error of grid connected wind and solar generation.
Source: Independent Electricity System Operator, “Operating a Power System with Significant Quantities of Renewable Generation” (presentation, 19 September 2017) slide 12, online: <www.ieso.ca/-/media/files/ieso/document-library/media/lkula-20170919-alberta-power-symposium.pdf?la=en>.
-
88
How does Ontario deal with the variability of wind and solar electricity output?
Making Connections: Straight Talk About Electricity in Ontario
Q6

• Dispatchability. A final key change was a requirement that variable generation connected to the transmission grid must respond to control (or dispatch) instructions from the IESO. Of course, wind and solar generators cannot produce more power than is available from the wind or sun. The IESO can however use control instructions to reduce power
production from renewables when more electricity is being produced than is needed ( Q7), and then bring power production back up to maximum when demand rises. Solar and wind are able to ramp up or down power production very quickly compared to other types of generation.
Managing the electricity system during a solar eclipse
The partial solar eclipse on August 21, 2017 was a good test of how the IESO manages major fluctuations in variable energy output. The effect of the eclipse on solar energy production is shown in Figure 6.7. The total reduction in solar generation output over 90 minutes was about 1,200 MW, or about 67% of pre-eclipse output.
The IESO prepared for this unique event (the first solar eclipse in Ontario since the installation of a large amount of solar generation) by actively monitoring demand forecasts, variable generation forecasts and weather predictions.26 There were no power system reliability issues.
Figure 6.7. Change in solar generation output on 21 August 2017.
Source: “2017 Solar Eclipse”, online: Independent Electricity System Operator <www.ieso.ca/en/corporate-ieso/media/also-of-interest/2017-solar-eclipse>. [Accessed 9 March 2018]
89Environmental Commissioner of Ontario 2018 Energy Conservation Progress Report, Volume One
How does Ontario deal with the variability of wind and solar electricity output? Q6

Adding flexibility toolsWhat happens if the IESO gets its renewable forecasts wrong and less electricity is generated from wind and solar than predicted? To date, the IESO has relied on the flexibility of other existing grid resources, such as natural gas and hydro, to adjust power production to compensate for changes in power production from wind and solar. Ontario has not yet needed new grid services specifically to compensate for the variability of renewable electricity, but new tools will be needed soon. A 2016 Operability Assessment study by the IESO considered the changes expected through 2020,27 including the additional variable generation that has been procured and will be coming on-line. It identified several challenges and some tools needed to meet them.28
As Ontario brings on more variable generation, it becomes crucial to be able to rapidly adjust supply, or demand, or both. To date, Ontario has relied little on reducing demand, and instead has adjusted supply, primarily with gas-fired generation. Existing gas plants can ramp up and down as needed over one-hour and four-hour periods, if advance predictions are accurate enough.29
Even though forecasting has improved, it is still not perfect. If actual production from renewables turns out to be lower than the one-hour ahead forecast, other resources need to respond quickly to meet demand.30
This can be a problem if Ontario relies on gas-fired generators but none of them are running, as only a few Ontario gas-fired resources can start up quickly.31 The other gas-fired plants require a few hours to start up. If demand outstrips supply too quickly in an unexpected fashion, it could be difficult or impossible to meet, without reducing demand.
To deal with this uncertainty, IESO operators have been keeping non-quick-start gas-fired generation on-line. This brings its own problems, as it leads to the IESO overcommitting to higher-cost (and higher-emission) gas resources when they are not needed.
To provide better tools, the IESO intends to procure an additional 50 MW of frequency regulation service and 740 MW of flexibility (resources that can come online within 30 minutes). This flexibility could come from better use of existing resources, grid energy storage, increased demand response capabilities, and/or new peaking plants.32 Demand response and storage appear well-suited to provide these services. The IESO proposes to secure these flexible resources through a competitive bid process Removing barriers to effective use of pumped storage at Niagara may also help.
International best practicesThe IESO’s planned flexibility procurement reflects one of the lessons learned around the world as expertise builds up on renewable electricity. Experience in other jurisdictions has developed a thorough set of best practices for how electricity markets, like Ontario’s, can cost-effectively support high shares of variable renewable and distributed power generation.33 Contrary to Ontario’s practice to date, gas-fired power plants are not the only flexibility tool for integrating high levels of renewable power into a grid. Ontario can, and should, learn from this international experience.
As Ontario brings on more variable generation, it becomes crucial to be able to rapidly adjust supply, or demand, or both.
90
How does Ontario deal with the variability of wind and solar electricity output?
Making Connections: Straight Talk About Electricity in Ontario
Q6

Contrary to Ontario’s practice to date, gas-fired power plants are not the only flexibility tool for integrating high levels of renewable power.
Effectively incorporating high levels of variable power requires a thorough rethink of electricity markets and power regulation, but can also bring advantages.
[E]mbracing and supporting the energy transition will bring a wide range of economy-wide benefits, in addition to positive impacts on the environment and energy security.34
91Environmental Commissioner of Ontario 2018 Energy Conservation Progress Report, Volume One
How does Ontario deal with the variability of wind and solar electricity output? Q6

Endnotes
1 “Ontario’s Power System Planning and Forecasting”, online: Independent Electricity System Operator<www.ieso.ca/en/learn/ontario-power-system/planning-and-forecasting>. [Accessed 24 January 2018]
2 “Markets and Related Programs – Operating Reserve Markets”, online: Independent Electricity System Operator<www.ieso.ca/sector-participants/market-operations/markets-and-related-programs/operating-reserve-markets>. [Accessed 22 January 2018]
3 “Denmark is moving convincingly on decarbonisation”, online: International Energy Agency <www.iea.org/newsroom/news/2017/november/denmark-is-moving-convincingly-on-decarbonisation----.html?utm_content=buffer44c49&utm_medium=social&utm_source=twitter.com&utm_campaign=buffer>. [Accessed 12 February 2018]
4 “Renewable power hits record high in Germany in 2017 – forecast”, online: Clean Energy Wire <www.cleanenergywire.org/news/renewable-power-hits-record-high-germany-2017-forecast>. [Accessed 28 February 2018]
5 Jillian Ambrose, “Northern Ireland’s onshore wind share surges past UK average”, The Telegraph (26 June 2017), online: <www.telegraph.co.uk/business/2017/06/26/northern-irelands-onshore-wind-share-surges-past-uk-average/>.
6 International Renewable Energy Agency, Turning to Renewables: Climate-Safe Energy Solutions (Abu Dhabi: IRENA, 2017) at 8.
7 “All Federal government buildings to run on green power by 2025: environment minister”, CBC News (2 November 2016), online: <www.cbc.ca/news/canada/calgary/mckenna-federal-government-green-power-2025-calgary-announcement-1.3833392>.
8 “Mayors For 100% Clean Energy”, online:Sierra Club <www.sierraclub.org/ready-for-100/mayors-for-clean-energy>. [Accessed 7 February 2018]
9 “The world’s most influential companies committed to 100% renewable power”, online: RE100 <there100.org/>. [Accessed 7 February 2018]
10 Ian H. Rowlands et al., “Managing solar-PV variability with geographical dispersion: An Ontario (Canada) case-study” (2014) 68 Renewable Energy 171.
11 Christina Hoicka & Ian Rowlands, “Solar and wind resource complementarity: Advancing options for renewable electricity integration in Ontario Canada” (2011) 36:1 Renewable Energy 97.
12 “Continental power: operating the Super Grid”, online: Power Technology <www.power-technology.com/features/featurecontinental-power-operating-the-super-grid-4512977/>. [Accessed 25 January 2018]
13 “The Ten-Year Network Development Plan”, online: European network of transmission system operators for electricity <www.entsoe.eu/major-projects/ten-year-network-development-plan/general/Pages/default.aspx>. [Accessed 28 February 2018]
14 Independent Electricity System Operator, “Overview of Electricity Trade Agreement between Québec and Ontario” (presentation, 10 May 2017) slide 5, online: <www.ieso.ca/-/media/files/ieso/document-library/sac/2017/sac-20170510-ontario-hydro-quebec-agreement.pdf?la=en>.
15 Independent Electricity System Operator, The Future of Ontario’s Electricity Market: A Benefits Case Assessment of the Market Renewal Project, by The Brattle Group (Toronto: IESO, 20 April 2017) at 50.
16 “Spain gets its first hybrid wind power battery storage plant”, online: Engerati <www.engerati.com/article/spain-gets-its-first-hybrid-wind-power-battery-storage-plant>. [Accessed 25 January 2018]
17 “Your Guide to Stationary Energy Storage in Europe Part 2: UK and Italy”, online: Apricum <www.apricum-group.com/your-guide-to-stationary-energy-storage-in-europe-part-2-uk-and-italy/>. [Accessed 28 February 2018]
18 “Tesla mega-battery in Australia activated”, BBC News (1 December 2017), online: <www.bbc.com/news/world-australia-42190358>.
19 “All-Ireland project to stress-test renewable electricity storage for smart grids”, online: SiliconRepublic<www.siliconrepublic.com/machines/impress-renewable-storage-project>. [Accessed 25 January 2018]
20 “IESO approves new data obligations for renewable facilities” online: Stikeman Elliott <www.stikeman.com/en-ca/kh/canadian-energy-law/ieso-approves-new-data-obligations-for-renewable-facilities>. [Accessed 24 January 2018]
21 These requirements do not apply to smaller generators, such as the approximately 25,000 solar microFIT embedded contracts. As these smaller generators are “invisible” to the IESO, energy produced by these sources shows up as a drop in demand at the transmission level (similar to a conservation program).
22 Previously, larger generators submitted their own forecasts of production.
23 “Wind output map and wind forecast for next 48 hours”, online: Independent Electricity System Operator <www.ieso.ca/localContent/map/default.htm>. [Accessed 24 January 2018]
24 See an example of a Variable Generation Forecast Summary Report for solar and wind generation (“Variable Generation Forecast Summary Report”, online: Independent Electricity System Operator <reports.ieso.ca/public/VGForecastSummary/PUB_VGForecastSummary.xml>.)
25 Independent Electricity System Operator, “Centralized Forecasting Accuracy” (presentation, 22 May 2013) slide 6.
26 “2017 Solar Eclipse”, online: Independent Electricity System Operator <www.ieso.ca/en/corporate-ieso/media/also-of-interest/2017-solar-eclipse>. [Accessed 9 March 2018]
27 Independent Electricity System Operator, 2016 IESO Operability Assessment-Summary: Review of the Operability of the IESO-Controlled Grid to 2020 (Toronto: IESO, June 2016).
28 Ibid. (In addition to the need for flexibility and frequency regulation services to compensate for forecast errors in variable generation that are discussed in this section, the IESO study noted concerns with voltage regulation on the transmission grid, due in part to growth in distributed generation.)
29 Ibid, at 10.
30 Ibid, at 3.
.
.
.
.
.
.
.
.
.
.
.
.
.
.
.
.
.
.
.
.
.
.
.
.
.
.
.
.
.
.
92
How does Ontario deal with the variability of wind and solar electricity output?
Making Connections: Straight Talk About Electricity in Ontario
Q6

31 The York Energy Centre gas plant, as well as the East Windsor and Kirkland Generating Stations.
32 Independent Electricity System Operator, 2016 IESO Operability Assessment – Summary: Review of the Operability of the IESO-Controlled Grid to 2020 (Toronto: IESO, June 2016) at 7.
33 International Renewable Energy Agency, Adapting Market Design to High Shares of Variable Renewable Energy (Abu Dhabi: IRENA, 2017) at 67.
34 Ibid, at 31..
.
.
.
93Environmental Commissioner of Ontario 2018 Energy Conservation Progress Report, Volume One
How does Ontario deal with the variability of wind and solar electricity output? Q6

2005
Q U ES T I O N 7
Why does Ontario export and curtail so much electricity?
At times of low demand, Ontario has surplus low-carbon electricity that cannot currently be stored, and must be used or lost. The province saves money by selling part of the surplus.
Ontario’s nuclear plants usually produce electricity 24 hours a day, because they cost about the same to operate whether they are producing power or not. And for many of our renewable resources, if electricity is not generated when the wind, sun, or water is available, that potential power is lost forever. Most of the time, these “baseload” resources are used productively to make low-emission electricity for Ontarians. However, Ontario power demand has huge swings, and some industries that used to require round-the-clock electricity no longer do. At times of peak demand, the province may have barely enough power. At times of low demand, Ontario has surplus electricity.
To get these resources built, Ontario accepted legal obligations to pay for the surplus electricity, even when it’s not needed. What should the province do with the surplus power? Because current electrical storage capacity is limited, there have been only two choices: sell what we can to neighbouring jurisdictions at the market price, or “curtail” production (waste the power that could have been produced). It makes financial sense to sell power where possible, as long as exports recover more than their marginal costs. Curtailment doesn’t save the system money, and nuclear plants (which supply most of Ontario’s baseload power) are difficult to curtail. Selling clean power to upwind American states lowers their use of fossil fuels, reducing the air pollution that blows back into Ontario.
The electricity Ontario curtails (5% of potential production in 2016) or exports (8%) is a resource that Ontario could make better use of. For better options to use surplus power in Ontario, see Q16.
I M PAC T O N T H E E L E C T R I C I T Y SYS T E M

Contents
THE DETAILS . . . . . . . . . . . . . . . . . . . . . . . . . . . . . . . . . . . . . . . . . . . . . . . . . . . . . . . . . . . . . . . . . . . 96
Introduction . . . . . . . . . . . . . . . . . . . . . . . . . . . . . . . . . . . . . . . . . . . . . . . . . . . . . . . . . . . . . . . . . . . . 96
What is surplus baseload generation? . . . . . . . . . . . . . . . . . . . . . . . . . . . . . . . . . . . . . . . . . . . . . . . 96
Why does Ontario have surplus baseload generation?. . . . . . . . . . . . . . . . . . . . . . . . . . . . . . . . . . 98
How much surplus electricity does Ontario have and what is done with it? . . . . . . . . . . . . . . . . . 99
Ontario is a net exporter of electricity . . . . . . . . . . . . . . . . . . . . . . . . . . . . . . . . . . . . . . . . . . . . . . 101
Does Ontario make money or lose money exporting electricity?. . . . . . . . . . . . . . . . . . . . . . . . . 102
Do we sell surplus power at a loss? No, we don’t . . . . . . . . . . . . . . . . . . . . . . . . . . . . . . . . . . . . . . 102
Why doesn’t the export price of electricity include the Global Adjustment?. . . . . . . . . . . . . . . . . . . . 104
Curtailment or “waste” of electricity . . . . . . . . . . . . . . . . . . . . . . . . . . . . . . . . . . . . . . . . . . . . . . . 104
What does the future hold for surplus power? . . . . . . . . . . . . . . . . . . . . . . . . . . . . . . . . . . . . . . . 106
Endnotes . . . . . . . . . . . . . . . . . . . . . . . . . . . . . . . . . . . . . . . . . . . . . . . . . . . . . . . . . . . . . . . . . . . . . 108
95Environmental Commissioner of Ontario 2018 Energy Conservation Progress Report, Volume One
Why does Ontario export and curtail so much electricity? Q7
The details…
IntroductionQ2 of this report discusses the “top down” central
approach that the province has taken since 2004 to plan Ontario’s electricity system. To ensure that we have enough power for peak needs, this process has committed Ontario to paying for more power than we need when demand is low. In this chapter, the ECO analyzes how much surplus (unwanted) electricity the province is paying for and what it does with it.
What is surplus baseload generation?• Baseload generation is the amount of electricity
available at any given time from resources where the electricity production must be used or lost – primarily nuclear, hydro (in excess of dam storage capacity), and intermittent renewables such as wind and solar.1
• Surplus baseload generation (SBG) occurs when electricity production from baseload facilities is greater than the province’s demand.2 The excess electricity must be exported or curtailed (wasted).
The amount of surplus baseload generation has increased in recent years, and is tracked by the Independent Electricity System Operator (IESO). Figure 7.1 shows conceptually how the amount of surplus baseload generation in the province varies depending on the time of day and year, by comparing a mild spring week (when there is a large surplus) and a hot summer week (when there is very little surplus).
Surplus occurs when electricity production from baseload facilities is greater than the province’s demand.
96 Making Connections: Straight Talk About Electricity in Ontario
Q7

Figure 7.1. Surplus baseload generation, April 2017 and July-August 2017 (Ontario).
Note: The baseload generation line is an average estimated based on the IESO’s latest 18-Month Outlook and does not represent actual baseload generation during the times represented in the graph.
Source: “Hourly Market and Actual Demand Data 2002-2017” online: Independent Electricity System Operator <www.ieso.ca/-/media/files/ieso/power-data/data-directory/hourlydemands_2002-2017.csv?la=en> [Accessed 6 March 2018].
1000011000120001300014000150001600017000
Sun 12
am
Sun 6
am
Sun 12
pm
Sun 6
pm
Mon 12
am
Mon 6
am
Mon 12
pm
Mon 6
pm
Tues
12 am
Tues
6 am
Tues
12 pm
Tues
6 pm
Wed 12
am
Wed 6
am
Wed 12
pm
Wed 6
pm
Thurs
12 am
Thurs
6 am
Thurs
12 pm
Thurs
6 pm
Fri 12
am
Fri 6
am
Fri 12
pm
Frida
y 6 pm
Sat 12
am
Sat 6 a
m
Sat 12
pm
Sat 6 p
m
Sun 12
am
Ont
ario
ele
ctric
ity d
eman
d (M
W)
Apr-17
10000
12000
14000
16000
18000
20000
22000
Sun 12
am
Sun 6
am
Sun 12
pm
Sun 6
pm
Mon 12
am
Mon 6
am
Mon 12
pm
Mon 6
pm
Tues
12 am
Tues
6 am
Tues
12 pm
Tues
6 pm
Wed 12
am
Wed 6
am
Wed 12
pm
Wed 6
pm
Thurs
12 am
Thurs
6 am
Thurs
12 pm
Thurs
6 pm
Fri 12
am
Fri 6
am
Fri 12
pm
Frida
y 6 pm
Sat 12
am
Sat 6 a
m
Sat 12
pm
Sat 6 p
m
Sun 12
am
Ont
ario
ele
ctric
ity d
eman
d (M
W)
Hours of the week
Surplus baseload generation
July-Aug 17
Baseload generation
97Environmental Commissioner of Ontario 2018 Energy Conservation Progress Report, Volume One
Why does Ontario export and curtail so much electricity? Q7

Why does Ontario have surplus baseload generation?Two factors contribute to surplus baseload generation – the amount of baseload generation, and Ontario’s minimum demand.
Baseload generation has increased in recent years. This is primarily due to the return to service of two nuclear units at Bruce in 2012 that added roughly 1,500 MW of baseload generation in most hours. As well, more wind and solar facilities were brought into service, which add a varying amount of generation that can be high, depending on wind and sun conditions. At times, new generation was required to be in service before scheduled nuclear refurbishments to ensure the reliability of the grid.
Just as important is Ontario’s minimum demand for electricity. Surplus baseload generation usually occurs on weekends or overnight hours when Ontario’s need for electricity is low, particularly in the spring and fall. Ontario electricity use at these times can be less than half of electricity use in peak hours. Ontario’s minimum demand has dropped by about 1,500 MW since 2005.3
The drop in industrial electricity use, which provides a steady demand for around-the-clock power, is a key reason. The province did not anticipate the loss in industrial demand.Conservation and efficiency programs have also played a contributing role, as some conservation programs will reduce electricity demand in all hours. Changes in demand patterns are discussed in more detail in Q3.
Surplus baseload generation is to a large extent a growing pain associated with the transition to a low-carbon electricity system. With a few exceptions, Ontario’s low-carbon electricity resources do not have a lot of ability to adjust the timing of their electricity production. Shutting down and powering up a nuclear generation plant is cumbersome and expensive. Wind and solar generation is intermittent in nature – it is easy to turn power production down if the energy is not needed, but the power that could have been produced at that moment is then lost forever. The same applies to hydro generation that is spilled.
Some renewable resources do offer flexibility, particularly waterpower where there are dams, and the pumped storage facility at Niagara. The Niagara Beck Pump Generating Station is capable of pumping 680,000 liters of water per second. It can fill a 300 hectare reservoir in about 8 hours, that can then be used for power production.4 In addition, biomass used at the Thunder Bay and Atikokan generating stations in Ontario that previously ran on coal, can provide flexibility, but at a high cost.
The gap between Ontario’s minimum and peak demand can be up to 12,000 MW. The bulk of this gap used to be filled by coal and gas. These resources were flexible in meeting demand changes, but at the cost of high greenhouse gas emissions and air pollution. Eliminating coal and minimizing the use of gas will require increasing the flexibility of our electricity system, and solutions are explored in Q16. There is no instant solution. Now let’s take a look at what Ontario currently does with this surplus electricity.
Baseload generation has increased primarily due to two nuclear units.
Ontario’s minimum demand has dropped.
98
Why does Ontario export and curtail so much electricity?
Making Connections: Straight Talk About Electricity in Ontario
Q7

How much surplus electricity does Ontario have and what is done with it?13.2% of Ontario’s power production was surplus (exported or curtailed) in 2016 (see Figure 7.4). The number will probably be higher in 2017.
Figure 7.2 presents the number of hours in which some of the electricity generated was surplus to Ontario
requirements, year by year since 2011. Note that the number of hours in which surplus baseload generation exists (more than 50% of hours in 4 of the past 5 years) does not represent the amount of surplus electricity, as most of the electricity produced in these hours is still used productively in Ontario
Figure 7.2. Number of surplus baseload generation hours, 2011-2017 (Ontario).
Source: Independent Electricity System Operator, information provided in response to ECO inquiry (5 March 2018).
13.2% of Ontario’s power production was surplus (exported or curtailed) in 2016.
36204232
62795819 5735
4029
7187
0
1000
2000
3000
4000
5000
6000
7000
8000
2011 2012 2013 2014 2015 2016 2017
Num
ber o
f sur
plus
bas
eloa
d ge
nera
tion
hour
s
Year
99Environmental Commissioner of Ontario 2018 Energy Conservation Progress Report, Volume One
Why does Ontario export and curtail so much electricity? Q7

At times of surplus, the average hourly Ontario electricity price (HOEP) will be low, zero or even negative. This leads to two possible consequences, which often occur in combination:
1. electricity exports to other jurisdictions willincrease, when the Ontario price falls lower thanthe price of supply in these other locations; and /or
2. generators in Ontario will be required to shut down(curtail) production.
Figure 7.3 shows that more of the surplus electricity is exported, less is curtailed.
Figure 7.3. Ontario electricity export (net) and curtailment trends 2011-2016.
Note: Complete data only available until end of 2016.
Source: Independent Electricity System Operator, information provided in response to ECO inquiry (31 January 2018); Ontario Power Generation, information provided in response to ECO inquiry (6 February 2018).
Figure 7.4 shows the amount of electricity that was exported and curtailed in proportion to total electricity production.
Figure 7.4. Electricity export and curtailment proportionate to total production in 2016.
Source: Independent Electricity System Operator, information provided in response to ECO inquiry (31 January 2018); Ontario Power Generation, information provided in response to ECO inquiry (6 February 2018).
0
5
10
15
20
25
2011 2012 2013 2014 2015 2016
Elec
trici
ty “w
aste
” (TW
h)
Year
Curtailment (TWh)Net exports (TWh)Curtailment and exports (TWh)
Electricity exported (net): 13.9 TWh or 8.4%
Potential electricityproduction curtailed: 7.75 TWh or 4.8%
Electricity produced and used in Ontario:142.9 TWh or 86.8%
100
Why does Ontario export and curtail so much electricity?
Making Connections: Straight Talk About Electricity in Ontario
Q7

Ontario is a net exporter of electricityThe province has been a net exporter of electricity since 2005.5 The gap between exports and imports have widened in recent years, as presented in Figure 7.5, largely due to increased exports at times of surplus baseload generation.6 Exports increase when the province has surplus low marginal cost, low-carbon
electricity compared to interconnected systems such as New York and Michigan, whose gas generation burns fuel and therefore typically has a higher marginal cost than Ontario’s nuclear/ renewables.7 The province sometimes also exports natural gas generated electricity when Ontario has power to spare and prices are higher in other jurisdictions.8
Figure 7.5. Import and export trends in Ontario 1997-2016.
Source: “Imports and Exports”, online: Independent Electricity System Operator <www.ieso.ca/power-data/supply-overview/imports-and-exports>. [Accessed 6 March 2018]
0
5
10
15
20
25
1997
1998
1999
2000
2001
2002
2003
2004
2005
2006
2007
2008
2009
2010
2011
2012
2013
2014
2015
2016
Elec
trici
ty im
prot
s an
d ex
ports
(TW
h)
Year
Imports (TWh) Exports (TWh)
101Environmental Commissioner of Ontario 2018 Energy Conservation Progress Report, Volume One
Why does Ontario export and curtail so much electricity? Q7

Does Ontario make money or lose money exporting electricity?Ontario sells its surplus power to other jurisdictions for more than it costs to make that power. So why do people sometimes say that Ontario sells surplus power at a loss? Because of confusion between the cost to have something available and the cost to use it on a particular occasion. Economists call this the difference between average and marginal costs.
Do we sell surplus power at a loss? No, we don’t
To understand the difference between average and marginal costs, consider a family car. The Canadian Automotive Association estimates that the annual cost of driving a compact car in Ontario is about $7,500. This is based on 20,000 km of driving per year, and keeping the car for five years. The $7,500 includes your monthly car payments, insurance, maintenance, and license and registration, which are relatively fixed costs that don’t change if the car is driven a little more or less. The average cost of driving works out to be $38 per 100 kilometres.9
About $8 of that is for fuel.
Now imagine that your friend (a very good driver) asks to borrow your car for occasional errands, at night when you are not using it. The friend offers to pay you $20 to drive your car for each 100 km trip. Do you lose money by letting your friend use your car?
It is a good deal for your friend, but it’s a good deal for you too. The $20 that your friend is offering is less
than $38, which is your average cost to drive 100 km. But the extra (or marginal) cost to you if your car is driven an extra 100 km is only about $8, so you would make an extra $12 per trip.
That is essentially what Ontario does when we export surplus power. If you average the cost of the entire power system over every kWh generated in a year, it might look as if Ontario is exporting power at a loss. But this is misleading. Ontario has to pay all the fixed costs of our electricity system anyway, just to have power available for ourselves when we want it. The surplus power that we export costs us little or nothing extra on top of the fixed costs, because:
• Our renewable power has extremely low operating costs; and
• Our nuclear plants cost virtually the same whether they are making power or not.
So, because importing jurisdictions pay us more than the very small amount it costs to make the specific surplus power that we export, both importer and exporter end up ahead.
Ontario sells its surplus power for more than it costs to make that power.
102
Why does Ontario export and curtail so much electricity?
Making Connections: Straight Talk About Electricity in Ontario
Q7

To calculate the “average unit cost” of Ontario electricity, one divides the total costs of Ontario’s electricity system by total Ontario electricity demand. As Figure 7.6 shows, surplus power is exported for
less than this average annual cost.10 As in the case of the family car, this makes financial sense because the surplus power is exported for more than the marginal cost to us of producing it.
Figure 7.6. Unit cost comparison of average unit cost of producing electricity vs. average export price.
Source: Independent Electricity System Operator, information provided in response to ECO inquiry (12 January 2018).
In other words, Ontario exports electricity at a lower price than Ontario customers usually pay, because Ontario must cover the total costs of its electricity system, while exports need only make more than the marginal costs of the surplus power.
The way this works in the electricity market is that surplus power is exported without the Global Adjustment. The generation component of the electricity price paid by Ontario residential and business customers includes two elements- the Hourly Ontario Electricity Price (HOEP) and the Global Adjustment (GA). The Global Adjustment’s share of the generation cost has risen in recent years, to about 85% in 2016, because Ontario has so much generation (nuclear and renewables) with very low marginal costs.11 The HOEP, the wholesale price of electricity, is determined by the
real-time market demand and supply of electricity in the market. When the market has surplus generation with low marginal costs, supply far exceeds demand and the HOEP decreases and can even become zero or negative. When the HOEP is lower than the marginal cost of generation in other jurisdictions, Ontario can sell surplus electricity to its neighbours. Ontario’s neighbours pay only the HOEP and are not charged the Global Adjustment.12 See Q9 for more details on electricity price changes.
Ontario must cover the total costs of its electricity system, while exports need only make more than the marginal costs.
0
20
40
60
80
100
120
2005 2006 2007 2008 2009 2010 2011 2012 2013 2014 2015 2016
Aver
age
unit
cost
of O
ntar
io p
rodu
ctio
n ($
/MW
h)
Year
Export ($/MWh)Imports ($/MWh)
Average unit cost ($/MWh)
103Environmental Commissioner of Ontario 2018 Energy Conservation Progress Report, Volume One
Why does Ontario export and curtail so much electricity? Q7

Why doesn’t the export price of electricity include the Global Adjustment?
Why aren’t export customers charged the Global Adjustment (GA), which is included in all Ontarians’ electricity rates? The GA makes up the difference between the price that generators with long-term contracts or regulated rates must be paid, and the (lower) energy market price (see Q9 for more details). These costs were incurred to build the electricity infrastructure for Ontario’s needs (e.g., to meet the province’s capacity needs and to ensure its reliability, and to support Ontario’s environmental and economic development objectives). Ontario has first call on its electricity–when required, electricity exports are interrupted to meet provincial needs.13 Since exports are not backed by firm capacity, export prices do not include the Global Adjustment.14
Charging the Global Adjustment on exports would not reduce costs for Ontarians anyway. Export levels are highly sensitive to price changes since transactions occur at the marginal price.15 An increase of export prices (either changing the Export Transmission Service tariff or adding all or a portion of the GA) would likely dramatically cut export levels, although the IESO has not done a recent analysis specific to Ontario’s current circumstances.16 This would mean that Ontario would not earn the export revenue it does today which offsets that would otherwise be added to the GA. In addition, the province may have to find more expensive alternatives to reduce its electricity surplus, such as shutting down nuclear units for several days at a time.
As long as Ontario sells surplus electricity for more than its marginal cost, exporting power is a financial benefit for the province. Since 2005, net revenue from exports have totalled close to $8 billion.17 Without exports, much of this amount would have been added to Ontario electricity costs.
Very occasionally, the HOEP is negative and other jurisdictions are paid to briefly take Ontario’s electricity, in order to avoid larger curtailment costs. Such negative HOEP payments are very small–about $3 million in 2016, in comparison to net export revenue during the same year of $576 million.18 In total, exports contributed $236 million in 2016 towards reducing Ontario’s electricity system costs, i.e., towards reducing the GA.19
Globally, there are environmental benefits from exporting surplus electricity instead of curtailing Ontario production, as it will often be displacing fossil-fuelled generation in Michigan and New York, the primary destinations for Ontario exports.
Curtailment or “waste” of electricityDispatching electricity generation facilities down or off, known as curtailment, results in spilling water at hydroelectric stations, bypassing steam around turbines at nuclear facilities (or shutting production down entirely), and turning down or off grid-connected renewable resources such as wind and solar. In these cases, potential electricity production with zero marginal cost goes unused or is “wasted”.20 A small amount of gas-fired generation from non-utility generators (NUGs) also used to be curtailed.21
Figure 7.7 details the amount of electricity curtailed by the province by generation source since 2011.
In total, exports contributed $236 million in 2016 towards reducing Ontario’s electricity system costs.
104
Why does Ontario export and curtail so much electricity?
Making Connections: Straight Talk About Electricity in Ontario
Q7

Figure 7.7. Electricity curtailment in Ontario by generation source, 2011-2017.
Note: All 2017 data except the hydro (provided by OPG) is until November 2017. Wind/solar curtailments began after 2013. NUGs are gas-fired non-utility generators.
Source: Independent Electricity System Operator, information provided in response to ECO inquiry (31 January 2018); Ontario Power Generation, information provided in response to ECO inquiry (6 February 2018).
Curtailment occurs in response to market price signals. Generators of all types are typically compensated for curtailed production, so the order of curtailment does
not greatly affect generators.22 Figure 7.8 represents the total amount of curtailment by year paid by the IESO to generators to date.
Figure 7.8. Curtailment payments to generators 2013-2017 (Ontario).
Note: IESO only provided the curtailment dollars in aggregate by year and did not break down by payments to specific generators.
Wind and solar curtailments began in 2013. Compensation for curtailments is specific to IESO-Administered Contracts, and is inclusive of Nuclear SBG, Hydro SBG, and Wind and Solar curtailments. These payments do not include adjustments for surplus generation for Ontario Power Generation assets regulated by the Ontario Energy Board. 2017 compensation values are only until September 2017.
Source: Independent Electricity System Operator, information provided in response to ECO inquiry (31 January 2018).
0
2
4
6
8
10
12
2011 2012 2013 2014 2015 2016 2017
Elec
trici
ty c
urta
iled
(TW
h)
Year
Nuclear reduction (TWh)Hydro reduction (TWh)
NUG reduction (TWh)Wind /solar reduction (TWh)Total (TWh)
$94.44 $106.38 $148.52
$341.27 $375.68
$1,066.29
$0
$200
$400
$600
$800
$1,000
$1,200
2013 2014 2015 2016 2017 Total
Cur
tailm
ent c
ompe
nsat
ion
in $
M
Year
105Environmental Commissioner of Ontario 2018 Energy Conservation Progress Report, Volume One
Why does Ontario export and curtail so much electricity? Q7

In the current market, when there is a surplus of electricity, hydro is typically shut down first, followed by wind/solar, and then nuclear.23 When the HOEP falls below the Gross Revenue Charge (tax), OPG, which owns and operates most of the province’s hydroelectric generation stations, spills some of the water instead of generating electricity. OPG’s ability to spill water depends on other factors, including water levels, public safety requirements, and other regulatory restrictions.24 As Figure 7.9 shows, there was a spike in hydro spill in 2016, in part because of higher water flows.25
Apart from spilling water, the IESO also has options to reduce renewable generation (mostly wind) and nuclear generation. For operating reasons, wind production is usually curtailed before nuclear.
Nuclear reductions can be achieved in two ways – bypassing the steam around the turbines in a closed loop, or completely shutting down a reactor. If a reactor needs to be shut down completely, it must remain offline for 48 to 96 hours.26 Bypassing steam is more flexible, but operating units can still only be reduced in large blocks of 300 MW at a time and not for sustained periods of time. This means that additional generation, from potentially more expensive and GHG-emitting gas-fired generation, could need to be called upon to make up the smaller differences.27
As renewables are more flexible (quicker to respond, i.e., dispatchable at 5-minute intervals; and able to adjust their power output in smaller increments), wind is dispatched down before the province considers ramping down nuclear generation.28 This has only been possible since 2013.29 Since then, wind curtailment has proven to be a flexible and effective measure to respond to surplus conditions, as well as for reliability
events on the system. With these changes, the IESO is not only able to minimize electricity waste, but also to avoid ramping up gas generation plants.30
The IESO’s ability to dispatch wind (and a subsequent rule change that prioritizes wind dispatch above steam bypass at nuclear units)31 is responsible for the differing curtailment trends for nuclear and wind in recent years, with nuclear curtailment falling slightly since 2014, and wind curtailment increasing dramatically, by more than 200% between 2015 and 2016.32
What does the future hold for surplus power?The IESO’s latest 18-Month Outlook predicts that the province’s current surplus will continue in the near to medium-term. The IESO expects that the magnitude and frequency of the surplus will be reduced, at least temporarily, by the nuclear refurbishment that began in 2016, which will remove a large amount of baseload generation from service.33 Longer-term, the amount of surplus will depend upon the choices we make for our energy system.
What is clear is that the current surplus means a lot of clean energy is going to waste. Figure 7.9 shows the curtailment of wind, nuclear and hydro generation in
The IESO’s preferential curtailment of wind power makes wind power look more expensive than it really is.
106
Why does Ontario export and curtail so much electricity?
Making Connections: Straight Talk About Electricity in Ontario
Q7

2016. The large curtailment of wind power (about 17% of potential production in 2016) has a noticeable effect on the reported cost of Ontario wind power, since curtailed power is excluded from IESO calculations of unit costs. In other words, the IESO’s preferential curtailment of wind power makes wind power look more expensive than it really is (See Q9).
Figure 7.9. Curtailment as a share of Ontario’s grid-connected production for wind, hydro and nuclear generation in 2016.
Source: “IESO year end data”, online: Independent Electricity System Operator <www.ieso.ca/corporate-ieso/media/year-end-data> [Accessed 5 March 2018];“Financial Reports”, online: Ontario Power Generation <www.opg.com/about/finance/pages/financial-reports.aspx> [Accessed 5 March 2018]; Ontario Power Generation, information provided in response to ECO inquiry (6 February 2018).
Are there better uses for this excess electricity, ones that Ontarians can take advantage of in the short and long run? In Q16, the ECO discusses some innovative measures to make use of surplus electricity, including storage, electric vehicles, innovative pricing policies, and power-to-gas technology.
10,200 or 83%
36,500 or 88.5%
91,701.7 or 99%
2,244.23 or 17%
4,700 or 11.5%
665.2 or 1%
0
10,000
20,000
30,000
40,000
50,000
60,000
70,000
80,000
90,000
100,000
Wind Hydro Nuclear
Gen
erat
ion
and
Cur
tailm
ent i
n 20
16 (G
Wh)
Generation sources
Generation Curtailment
107Environmental Commissioner of Ontario 2018 Energy Conservation Progress Report, Volume One
Why does Ontario export and curtail so much electricity? Q7

Endnotes
1 The IESO’s official definition of baseload generation comprises of available nuclear energy, must-run hydroelectric generation, self-scheduling, commissioning, intermittent and variable (including wind and solar) generators. “Self-scheduling” generators include some gas-fired facilities. (“Forecast Surplus Baseload Generation”, online: Independent Electricity System Operator <www.ieso.ca/weather/mkt4/sbg/SurplusBaseloadGen_h3.pdf> [Accessed 7 March 2018]).
2 Exports are not included in the Surplus Baseload Forecast. However, a separate assessment forecasts how much SBG can be addressed through exports.
3 Independent Electricity System Operator, “Module 1: State of the Electricity System: 10-Year Review” (presentation, August 2016) slide 8.
4 OPG did not provide the quantitative measure of reservoir capacities because the data is commercially sensitive. While Beck has a theoretical storage capacity, actual storage is based on market conditions and also on hydrological conditions at Beck (Ontario Power Generation, information in response to ECO inquiry (6 February 2018)).
5 Independent Electricity System Operator, “Module 1: State of the Electricity System: 10-Year Review” (presentation, August 2016) slide 24.
6 In its 2017 report, the Ontario Society of Professional Engineers presented a methodology to differentiate between total electricity exports and clean electricity exports. The OSPE analyzed electricity load over a 21-month period, and concluded that after considering 900 MW of daily generation as gas (for system flexibility) and the rest of the generation that was consumed in the province, the rest of the generation that was exported was clean generation. Any additional gas generation was also exported but of course did not fall in the category of clean exports. The OSPE used this analysis to argue that the majority of Ontario’s exports are clean generation which can be used more effectively within the province. (Ontario Society of Professional Engineers, Empower Ontario’s Engineers to Obtain Opportunity, An Analysis of Ontario’s Clean Electricity Exports (Toronto: OSPE, November 2017) at 7.)
7 Ibid, at 6.
8 Ibid.
9 “Driving Costs Calculator”, online: Canadian Auto Association <www.caa.ca/carcosts/compare>. [Accessed 5 March 2018]
10 The Province may also sell power generated by gas peaking plants during hours of peak demand.
11 “Global Adjustment”, online: Independent Electricity System Operator <www.ieso.ca/power-data/price-overview/global-adjustment>. [Accessed 5 March 2018]
12 Exports actually pay the Zonal Clearing Price, which can differ from the HOEP if an intertie is congested. (Independent Electricity System Operator, information provided in response to ECO inquiry (12 January 2018).)
13 Ontario Society of Professional Engineers, Empower Ontario’s Engineers to Obtain Opportunity, An Analysis of Ontario’s Clean Electricity Exports (Toronto: OSPE, November 2017) at 8.
14 An exception where firm rights exist regarding access to exports is the Ontario-Quebec agreement which grants Quebec a firm right to 500 MW of Ontario power in the winter.The IESO has also been investigating firm capacity exports of Ontario power to other jurisdictions on a short-term basis, in cases where the generation is not needed for Ontario’s reliability. As firm exports are more valuable to the importing jurisdiction, this could allow Ontario generators to earn extra revenue from the export market that would then not need to be recovered from Ontario customers. “Market Renewal – Capacity Exports”, online: Independent Electricity System Operator <www.ieso.ca/en/sector-participants/market-renewal/capacity-exports>.[Accessed 9 March 2018]
15 Independent Electricity System Operator, Export Transmission Service (ETS) Tariff Study by Charles River Associates (Toronto: IESO, May 2012) at 5.
16 Ibid, at 44; Independent Electricity System Operator, information provided in response to ECO inquiry (12 January 2018).
17 Independent Electricity System Operator, information provided in response to ECO inquiry (12 January 2018).
Year Export Revenue ($M)
2005 664
2006 557
2007 633
2008 1,296
2009 324
2010 629
2011 484
2012 441
2013 582
2014 721
2015 682
2016 576
2017 (Until October) 430
Total 8,019
18 Independent Electricity System Operator, information provided in response to ECO inquiry (12 January 2018).
19 Of that, exports in all hours paid approximately $19 million towards market uplifts and $40 million towards transmission charges. The balance of $177 million is from exports during off-peak. Independent Electricity System Operator, information provided in response to ECO inquiry (5 March 2018).
20 “Surplus Baseload Generation in Ontario”, online: Environmental Commissioner of Ontario <eco.on.ca/blog/surplus-baseload-electricity-generation-in-ontario/>. [Accessed 5 March 2018]
21 These generators are “self-scheduling” and cannot be dispatched by the IESO through the electricity market, so out-of market actions have been taken. Ideally, these would be the first generators curtailed in times of surplus, as their operations burn fuel and emit greenhouse gases. NUG curtailment has dropped to almost zero in recent years, presumably because NUGs are no longer contributing to SBG, as contracts have
.
.
.
.
.
.
.
.
.
.
.
.
.
.
.
.
.
.
.
.
.
108
Why does Ontario export and curtail so much electricity?
Making Connections: Straight Talk About Electricity in Ontario
Q7

.
.
.
.
.
.
.
.
.
.
.
.
expired or been renegotiated to make these generators dispatchable.(Independent Electricity System Operator, information provided in response to ECO inquiry (12 January 2018)).
22 Any financial losses accrued by OPG from these hydro spills is mitigated by the Hydroelectric Surplus Baseload Generation Variance Account that was authorized by the Ontario Energy Board (OEB) for all of OPG’s regulated hydroelectric generation stations in 2011 to capture the financial impacts of foregone production (Ontario Power Generation, 2015 Annual Report (Toronto: OPG, 2016) at 69). OPG’s latest financial statements (to date) state that the variance account currently has a positive balance of $210 million dollars, an increase of 85% from the same time the year before. The increase in the variance account includes interest and subtracts amortization as well (Ontario Power Generation, Consolidated Financial Statements (Toronto: OPG, 31 December 2016) at 26).
23 Ontario Power Generation, Management’s Discussion and Analysis (Toronto: OPG, 31 December 2016) at 8; Ontario Power Generation, information provided in response to ECO inquiry (6 February 2018).
24 Independent Electricity System Operator, Dispatch Order for Baseload Generation: A Discussion Paper for Stakeholder Engagement 91 (Renewable Integration) (IESO: Toronto, 2 November 2011) at 11.
25 The report also notes that in 2016, the province’s export options were limited due to transmission constraints in the state of New York. The same report (at 18) anticipates a declining trend in hydro spill in the coming years due to the reduced nuclear availability with the refurbishments at Darlington and Bruce and the shutdown at Pickering (Ontario Power Generation, 2015 Annual Report (Toronto: OPG, 2016) at 69.)
26 Independent Electricity System Operator, Dispatch Order for Baseload Generation: A Discussion Paper for Stakeholder Engagement 91 (Renewable Integration) (IESO: Toronto, 2 November 2011) at 9.
27 Independent Electricity System Operator, “Floor Price Review, Overview of Engagement” (Presentation, July 2015) slide 10.
28 This is achieved by an IESO rule setting different minimum offer prices for nuclear and wind generation. The minimum offer price for wind is higher than nuclear, which means that as the wholesale electricity price falls in times of surplus, it will fall below the wind offer price first, causing wind to be dispatched down.
29 Prior to this, the IESO did not have the ability to dispatch wind, as discussed in Q6. (“Year End Data”, online: Independent Electricity System Operator <www.ieso.ca/corporate-ieso/media/year-end-data>. [Accessed 5 March 2018])
30 “Surplus Baseload Generation in Ontario”, online: Environmental Commissioner of Ontario <eco.on.ca/blog/surplus-baseload-electricity-generation-in-ontario/>. [Accessed 5 March 2018]
31 This rule change set the minimum offer price for wind above the minimum offer price for steam bypassing at nuclear facilities, meaning that wind curtailment would occur prior to steam bypassing (“Floor Price Review”, online: Independent Electricity System Operator <www.ieso.ca/sector-participants/engagement-initiatives/engagements/completed/floor-price-review>. [Accessed 5 March 2018])
32 0.73 TWh of renewables were curtailed in 2015; in 2016 the amount was 2.24 TWh (“Year End Data”, online: Independent Electricity System Operator <www.ieso.ca/corporate-ieso/media/year-end-data>. [Accessed 5 March 2018])
33 The report states that the system will be balanced during SBG conditions using market mechanisms such as inter-tie scheduling, dispatching (curtailment) of hydroelectric and renewable generation, nuclear manoeuvering or shutdown, import cuts (which is rare) and curtailment of linked wheels as and when needed.(Independent Electricity System Operator, 18-Month Outlook: An Assessment of the Reliability and Operability of the Ontario Electricity System, From January 2018 to June 2019 (Toronto: IESO, December 2017) at 29-31.)
109Environmental Commissioner of Ontario 2018 Energy Conservation Progress Report, Volume One
Why does Ontario export and curtail so much electricity? Q7

2005
I M PAC T O N E L E C T R I C I T Y P R I C E S
Q U ES T I O N 8
How high are Ontario electricity prices?
From 2006 to 2016, average home electricity bills in Ontario increased 19%.
In 2016, before the Fair Hydro Plan, Ontarians had the highest electricity rates in Canada (though lower than some U.S. states and most of Europe). As of 2017, with the Fair Hydro Plan in place, Ontario residents began paying less than many Canadians in Atlantic Canada and in Saskatchewan. But only about 80% of the costs of operating the electricity system are being paid by today’s electricity customers; the remainder is funded through taxes or borrowed to be paid by future customers.
Overall Ontario home energy costs (including natural gas, and other fuels), are middle of the Canadian pack. This is because Ontarians rely less on electricity for water and space heating, and more on low-cost natural gas, than many other provinces. However, customers using electric resistance heating face high winter electricity costs.

Note to reader: To provide a comparison of apples to apples, all historical cost comparisons in this section are in real 2016 dollars. This means that costs have been adjusted to their 2016 value, which includes the impact of inflation. For example, something worth $1 in 2006, would be adjusted to $1.17, its value in 2016 real dollars.
Contents
THE DETAILS . . . . . . . . . . . . . . . . . . . . . . . . . . . . . . . . . . . . . . . . . . . . . . . . . . . . . . . . . . . . . . . . . . 112
Electricity costs had to rise, and did . . . . . . . . . . . . . . . . . . . . . . . . . . . . . . . . . . . . . . . . . . . . . . . 112
Not everyone is “average” . . . . . . . . . . . . . . . . . . . . . . . . . . . . . . . . . . . . . . . . . . . . . . . . . . . . . . . 114
Energy poverty . . . . . . . . . . . . . . . . . . . . . . . . . . . . . . . . . . . . . . . . . . . . . . . . . . . . . . . . . . . . . . . . 114
Where are we now? . . . . . . . . . . . . . . . . . . . . . . . . . . . . . . . . . . . . . . . . . . . . . . . . . . . . . . . . . . . . 115
Understanding your residential electricity bill . . . . . . . . . . . . . . . . . . . . . . . . . . . . . . . . . . . . . . . . . . 117
How does the global adjustment fit in? . . . . . . . . . . . . . . . . . . . . . . . . . . . . . . . . . . . . . . . . . . . . . . 118
Overall home energy bills . . . . . . . . . . . . . . . . . . . . . . . . . . . . . . . . . . . . . . . . . . . . . . . . . . . . . . . . 119
Businesses. . . . . . . . . . . . . . . . . . . . . . . . . . . . . . . . . . . . . . . . . . . . . . . . . . . . . . . . . . . . . . . . . . . . 120
Electricity bills do not pay the whole cost . . . . . . . . . . . . . . . . . . . . . . . . . . . . . . . . . . . . . . . . . . . 121
Conclusion. . . . . . . . . . . . . . . . . . . . . . . . . . . . . . . . . . . . . . . . . . . . . . . . . . . . . . . . . . . . . . . . . . . . 122
Endnotes . . . . . . . . . . . . . . . . . . . . . . . . . . . . . . . . . . . . . . . . . . . . . . . . . . . . . . . . . . . . . . . . . . . . . 123
111Environmental Commissioner of Ontario 2018 Energy Conservation Progress Report, Volume One
How high are Ontario electricity prices? Q8

The details…
Electricity costs had to rise, and did
As discussed in Q5, Ontario’s electricity supply was stretched to its limits by the mid-2000s. By 2006, Ontario began to make its electricity system cleaner and more reliable, by making significant investments in new generation of all forms and conservation. As a result, electricity prices began to rise. The causes of these increases are discussed in Q9.
From 2006 to 2016, Ontario’s average unit cost of electricity (per kilowatt-hour (kWh)) increased by 45% (see Figure 8.1), from about 10 to 15¢/kWh.1 This includes costs for:
• generation (building, operating and decommissioningpower generation facilities)
• transmission (building, operating and maintaininghigh-voltage power lines and associatedinfrastructure)
• distribution (building, operating and maintaininglow-voltage power lines and associated infrastructure)
• wholesale market charge (the cost to administerthe electricity market and maintain the reliability of thegrid)
• conservation (delivering electricity conservationprograms, including incentives to participants andadministration costs), and
• debt retirement (the cost of paying down the debtthat Ontario Hydro built up before 2006).
Figure 8.1. Average unit cost of Ontario’s electricity system (2006-2016, real $2016, ¢/kWh).
Note: Data represents true cost of service (total cost of electricity service divided by total Ontario electricity demand) and is not available prior to 2005. In 2005, unusual weather and tight supply conditions led to high demand and record market prices for electricity. Ontario demand peaked at 157 TWh, and Ontario was a net importer of electricity. By 2006, installed generation capacity had increased, and Ontario demand dropped by 6 TWh to 151 TWh. The cost of electricity declined and Ontario also returned to being a net exporter of electricity.
Source: Independent Electricity System Operator, information provided to the ECO in response to ECO inquiry (January 2018).
$0.08
$0.09
$0.10
$0.11
$0.12
$0.13
$0.14
$0.15
$0.16
2005 2006 2007 2008 2009 2010 2011 2012 2013 2014 2015 2016
Aver
age
unit
cost
of e
lect
ricity
se
rvic
e ¢/
kWh
(real
$20
16)
Average unit cost of electricity service
+45%(2006-2016)
112 Making Connections: Straight Talk About Electricity in Ontario
Q8

The rise in unit cost of electricity shown in Figure 8.1 (45% from 2006 to 2016) includes all costs of the system; however, residential bills have not increased at the same rate. Residential bills have declined both because of lower consumption (discussed below) and taxpayer subsidies (discussed later in the chapter). The bills paid by large businesses and industry are also different, and are discussed later in the chapter.
From 2006 to 2016 average Ontario home electricity bills increased by 19% (a rate of increase faster than the rest of Canada’s).2 As of 2017, primarily due to Ontario’s Fair Hydro Plan, average Ontario home electricity bills were 13% lower than they were in 2006 (see Figure 8.2).
From 2006 to 2016, the rise in electricity costs was partly offset by a drop in average household electricity
use,3 even though air conditioning use has grown.4
Conservation programs have helped, and buildings, equipment and appliances have become more energy efficient. Until 2009, the Ontario Energy Board defined the average Ontario household as using 1,000 kWh/month.5 In 2009, the board concluded that the average Ontario household used only 800 kWh/month. In 2016, the board decided that Ontario’s typical residential electricity consumer now uses only 750 kWh/month.6 (For more on Ontario’s changing electricity demand, see Q3.)
Figure 8.2. Changes in the average residential electricity bill (2006-2017, real $2016, Ontario).
Note: Values are adjusted for inflation by the ECO via the Bank of Canada inflation calculator. The average electricity bill is based on average residential rate class consumption and the average of all local distribution company rates.7
Source: Ontario Energy Board, information provided to the ECO in response to ECO inquiry (January 2018).
The rise in electricity costs was partly offset by a drop in average household electricity use.
$60.00 $70.00 $80.00 $90.00
$100.00 $110.00 $120.00 $130.00 $140.00 $150.00
2006
2007
2008
2009
2010
2011
2012
2013
2014
2015
2016
2017
(May
1)
2017
(July
1)Av
erag
e m
onth
ly re
side
ntia
l bill
(real
$20
16)
Average monthly electricity bills +19%(2006-2016)
-13%(2006-2017)
Fair HydroPlan
113Environmental Commissioner of Ontario 2018 Energy Conservation Progress Report, Volume One
How high are Ontario electricity prices? Q8

Not everyone is “average” Many consumers do not pay “average” bills, and many consumers do not have “average” electric consumption.
Different users may pay different rates. For example, distribution rates vary in different parts of the province. Many rural and on-reserve residents have historically paid higher than average delivery charges, but as of July 1, 2017, on-reserve First Nations customers receive a 100% credit to offset their delivery charges. As of July 1, 2017, many rural residents benefit from a lower maximum monthly base distribution charge.8
Some Ontario households use much more electricity than the “average” resident. For example, roughly 16% of homes rely on electric resistance heating, and some of those homes are in colder parts of the province where the need for heat is higher.9 Other residents may rely on electrically-powered medical equipment 24 hours a day.
Over the course of a year, a typical home heated by electric resistance (e.g., electric furnaces or baseboard heating) may use about three times more electricity than the same home using natural gas for space and water heating (see Figure 8.3).10 Since Ontario electricity is currently several times more expensive than natural gas for the equivalent amount of input energy (see
Q15, Figure 15.6), electric resistance heating systems result in higher-than-average home energy bills during the coldest months of the year.11 Electric heat pumps use only about half the electricity that electric resistance heating systems do, but still cost more for heating than natural gas at current prices.12
Figure 8.3. Sample average monthly electricity bills for two types of urban residential consumers: (1) natural gas heated and (2) electric baseboard heated.
Note: The Ontario Energy Board uses 750 kWh to represent the average monthly residential Ontario electricity usage, while 2,400 kWh is an estimated monthly usage for an average size residence relying on electric resistance space and water heating. These bills incorporate rate reductions resulting from Ontario’s Fair Hydro Plan. Toronto Hydro Rates are used to represent typical urban delivery rates. The delivery charge does not reduce at the same rate as other line items because it includes both fixed and variable costs.
Source: Ontario Energy Board, Rate Calculator, online: <www.oeb.ca/consumer-protection/energy-contracts/bill-calculator> [Accessed 26 March 2018].
Energy poverty
For some consumers, high electricity consumption and high resulting costs can cause real hardship. Energy, or fuel, poverty is defined as residents who must spend more than 10% of their income on home energy.13 This ratio of energy costs to income can result in individuals having to make difficult decisions between energy and other life necessities (e.g., food, rent, clothing). Based on Ontario’s median income in 2015, average electricity and natural gas bills represent almost 3.5% of income.14 For a home heated by electric resistance, that would go up to
Some Ontario households use much more electricity than the “average” resident.
750 kWh (Natural gas heated) 2,400 kWh (Electric resistance heated)
114
How high are Ontario electricity prices?
Making Connections: Straight Talk About Electricity in Ontario
Q8

about 5%. According to 2015 data, Canada’s National Energy Board found 7% of Ontarians to be energy poor, compared to 13% in Atlantic Canada and 10% in Saskatchewan, and a Canadian-wide average of 8%.15
Low-income households are at greatest risk of energy poverty,16 often because they cannot afford to (or do not have the right to, if they are tenants) make their homes more energy efficient. As a result, these households are a priority for subsidized energy conservation programs. For this reason, low-income electricity and natural gas conservation programs do not need to meet as strict a cost-benefit test as most other conservation programs in Ontario. One example of a low-income electricity conservation program available to Ontario residents is the Home Assistance Program, which offers free basic energy efficiency upgrades for low-income residents, with deeper upgrades (such as home insulation) offered free of charge for electrically-heated homes. Gas utilities also offer conservation programs at no cost to low-income customers.17
Recommendation: To help people who are unduly affected by electricity rates, low-income and Aboriginal financial support programs should be supplemented with enhanced conservation programs to make electrically heated homes more efficient.
The province also provides rate relief to vulnerable electricity consumers through the Ontario Electricity
Support Program. Eligible applicants can receive monthly on-bill credits ranging from $35 to $75/month. Households with greater electricity needs, such as electric heating, can receive an enhanced credit ranging from $52 to $113/month. This program was originally paid for through electricity rates, but is now being financed by taxpayers.18 For those residents that do not quite qualify for the Ontario Electricity Support Program, a $100M Affordability Fund for free efficiency upgrades was set up as part of the Fair Hydro Plan.19
Where are we now? (2016-2017)From 2015 to 2016, Ontario residents experienced a rate increase 2.5 times the national average.20 In 2016, Ontario residential and large consumer costs per kWh were the highest in Canada.21
In 2017, Ontario introduced the Fair Hydro Plan, which reduced average electricity bills for residential and small business customers by 25%. This reduction was achieved in two stages. In January 2017, all electricity bills saw a rebate of 8%. In May 2017 and again in July 2017, further reductions as result of the Ontario Fair Hydro Plan combined with the 8% rebate, resulted in 25% lower bills for typical residential customers. Many small businesses and farms also benefitted.22 As of November 2017, based on a comparison of select cities, Ontario residents were no longer paying Canada’s most expensive electricity bills; Charlottetown, Regina and Halifax paid higher bills (see Figure 8.4). The Fair Hydro Plan is discussed further in Q13.
Low-income households are at greatest risk of energy poverty.
115Environmental Commissioner of Ontario 2018 Energy Conservation Progress Report, Volume One
How high are Ontario electricity prices? Q8

Figure 8.4. 2017 estimated total monthly residential bills ($ before tax) in major North American cities (2017).
Note: The Ontario figures are based on electricity commodity prices (as of November 1, 2017) for the Regulated Price Plan, on time-of-use (TOU) rates, as well as the Ontario Energy Board rate database, while data for jurisdictions outside of Ontario is based on a 2017 Hydro-Quebec report. The Ontario figures in this chart assume a typical consumption pattern of 65% Off-Peak, 17% Mid-Peak and 18% On-Peak for each TOU period. 750 kWh is used as the monthly consumption of electricity in all selected jurisdictions.
Source: Electricity Rate Comparison”, online: Ontario Energy Board <cf.oeb.ca/html/_performance/rates_chart_US-CAN_totalbill.cfm>. [Accessed 26 Macrh 2018]
$229.90
$227.81
$215.56
$159.32
$129.27
$125.06
$123.80
$118.51
$117.87
$112.81
$109.43
$107.69
$106.78
$105.95
$103.03
$102.68
$101.78
$97.27
$95.25
$93.63
$93.54
$90.03
$87.60
$83.40
$83.33
$77.01
$67.30
$55.84
40 60 80 100 120 140 160 180 200 220 240
San Francisco
New York
Boston
Detroit
Charlottetown
Regina
Halifax
Chicago
Nashville
Portland
Hydro One -Low Density (R2)
Houston
Seattle
Toronto Hydro
Miami
Moncton
Hydro One - Urban (UR)
Median Ontario Utility (OEB Regulated)
Hydro Ottawa
Greater Sudbury Hydro
London Hydro
Thunder Bay Hydro
St. John's
Calgary
Edmonton
Vancouver
Winnipeg
Montreal
$ per month
Ontario
Canada, excluding Ontario
U.S.
116
How high are Ontario electricity prices?
Making Connections: Straight Talk About Electricity in Ontario
Q8

Understanding your residential electricity bill
Figure 8.5 provides an example of the current format of a typical residential electricity bill in Ontario, including recent changes arising from the Ontario Fair Hydro Plan Act, 2017.23 The bill calculation assumes monthly electricity use of 750 kWh and is for a customer on time-of-use (TOU) pricing.24 Bills for users on tiered electricity rates or on contract with electricity retailers will look slightly different, as will bills for larger commercial and industrial customers.25 Customers can visit the Ontario Energy Board’s bill calculator (www.oeb.ca/consumer-protection/energy-contracts/bill-calculator) to generate a custom estimate based on where they live and the amount of electricity they use.
Electricity
The charge for resources used to supply electricity.26 This charge is proportional to the amount of electricity used, and is the only part of the bill to which TOU pricing applies. TOU rates are regulated by the Ontario Energy Board and updated every 6 months on May 1 and November 1.27 There are currently three TOU periods (on-peak, mid-peak, and off-peak) with different rates to reflect the fact that the cost to supply our electricity is higher at times of day when demand is high. The time slots change for summer and winter since consumption patterns are different in each season. TOU rates were reduced in July 2017 when the Fair Hydro Plan was implemented.
Delivery
The charge for delivering electricity from the generating station through high voltage (transmission) and low voltage (distribution) power lines to a customer.28 Unlike electricity rates, which are identical across the province, delivery rates vary across local distribution companies depending on the age of a company’s infrastructure, its service area’s density and geography, and the ratio of residential to other customer classes.
Figure 8.5. Sample monthly residential electricity bill (Ontario, 2017).
Regulatory Charges
Regulatory charges include the cost of Ontario’s Independent Electricity System Operator to administer Ontario’s electricity system, and other minor charges.29
Debt Retirement Charge
The Debt Retirement Charge was charged to residential electricity consumers to help service and pay down the liabilities of the old Ontario Hydro.30 As of December 2015, this charge has been removed from residential bills.31 The province has committed to remove it for all other electricity consumers by April 1, 2018.
Harmonized Sales Tax and the 8% Provincial Rebate
Electricity is subject to the Harmonized Sales Tax (HST). As of January 1 2017, the Ontario government provides an 8% rebate, equal to the provincial portion of this tax, on electricity bills.32 This is part of the current government’s Fair Hydro Plan.
SAMPLE MONTHLY BILL STATEMENTToronto Hydro-Electric System Limited - Main
Account Number: 000 000 000 0000Meter Number: 0000000
Your Electricity Charges
ElectricityOff-Peak @ 6.5 ¢/kWh 31.69Mid-Peak @ 9.5 ¢/kWh 12.11On-Peak @ 13.2 ¢/kWh 17.82Delivery 50.26Regulatory Charges 3.28Debt Retirement Charge 0.00Total Electricity Charges $115.16HST 14.978% Provincial Rebate* (-$9.21)Total Amount $120.92
117Environmental Commissioner of Ontario 2018 Energy Conservation Progress Report, Volume One
How high are Ontario electricity prices? Q8

How does the global adjustment fit in?
When electricity prices are discussed, the global adjustment (GA) is often referenced, usually in contrast to the wholesale electricity price or hourly Ontario energy price (HOEP). The GA is a widely misunderstood term that shows up as a line item on large electricity consumer bills, but not on residential bills (where it is included within the category: electricity.)
Together, the wholesale electricity price (i.e., the HOEP) and the GA add up to the true cost of our electricity generation (but not transmission, distribution or regulatory charges), see Figure 8.6. The distinction between them is a confusing result of the interaction between the spot (short-term) market for electricity, and the long-term contracts (and regulatory rate approvals) that get electrical supplies built. In other words, the GA is a non-intuitive way of slicing and dicing, then paying, what our electricity system costs.
When wholesale electricity prices are low, the GA automatically rises to make up the difference, and vice versa.
Figure 8.6. Share of electricity generation costs in Ontario (December 2017).
Source: “Global Adjustment”, online: Independent Electricity System Operator <www.ieso.ca/power-data/price-overview/global-adjustment>. [Accessed 7 March 2018]
The wholesale electricity price is determined by the highest marginal cost generator accepted into the market. The GA includes whatever generation costs must be paid but are not covered by the wholesale electricity price. These generation costs cover all aspects of electricity generation, including operations and maintenance, construction, and administration. Today, wholesale electricity prices are often low because nuclear, wind, and solar have very low marginal costs of production; gas plants can also bid into the spot market at little more than their fuel price. This means that the GA now recovers the majority of generation costs.
A small portion of the GA also funds conservation programs; this portion of the cost does not fluctuate according to the commodity price (see Figure 8.7).
For the sake of clarity and simplicity the term GA is avoided as much as possible throughout this report. For a more detailed explanation of the term, see section 2.7.4.2 of our 2014 Energy Conservation Report.
Figure 8.7. Elements of the global adjustment (December 2017).
Source: “Global Adjustment”, online: Independent Electricity System Operator <www.ieso.ca/power-data/price-overview/global-adjustment>. [Accessed 7 March 2018]
4%
96%
Conservation
Contracted andregulated pricesfor generation
18%
82%
CommoditypriceGA
118
How high are Ontario electricity prices?
Making Connections: Straight Talk About Electricity in Ontario
Q8

Overall home energy billsAlthough Ontarians pay more for electricity than most of the rest of the country, average home energy bills (including electricity, natural gas, and other fuels) tell a somewhat different story. As the Financial Accountability Office of Ontario commented in 2016, “looking at how much households actually spend on energy in the home, rather than at prices alone, provides a clearer picture of how energy costs affect the cost of living of Ontarians.”33
As of 2015, average Ontario home energy costs were in the middle of other Canadian provinces and territories (see Figure 8.8).34 This is partly due to the fact that Ontarians rely less on electricity for home heating and more on lower-cost natural gas than the Canadian average (see Figure 8.9).
In Q15 we discuss the relative price differential between electricity and natural gas, and how this affects fuel switching away from electricity and Ontario’s climate change goals.
Figure 8.8. Provincial average annual home energy costs, by energy source (2015).
Note: Does not account for regional differences in after-tax income, or normalize for weather. Natural gas spending data for Newfoundland and Labrador, Prince Edward Island, and Nova Scotia was considered too unreliable to be published by Statistics Canada.
Source: Statistics Canada, Survey of Household Spending, Table 203-0021.
Average Ontario home energy costs were in the middle of other Canadian provinces and territories.
$3,012 $3,146
$2,885 $2,798
$1,854 $2,229
$1,941 $2,488
$2,216 $1,671
$- $500 $1,000 $1,500 $2,000 $2,500 $3,000 $3,500
Nfld and LabPrince Edward Island
Nova ScotiaNew Brunswick
QuebecOntario
ManitobaSaskatchewan
AlbertaBritish Columbia Electricity
Natural gasOther fuel
119Environmental Commissioner of Ontario 2018 Energy Conservation Progress Report, Volume One
How high are Ontario electricity prices? Q8

Figure 8.9. Share of space heating energy use supplied by natural gas, electricity and other fuels (including propane, oil and wood), Ontario vs. Canada, 2015.
Note: Canadian average does not exclude Ontario. Data does not normalize for weather.
Source: Natural Resources Canada, Comprehensive Energy Use Database, Residential Sector, Table 5: Space Heating Secondary Energy Use and GHG Emissions by Energy Source.
BusinessesLarge power consumers are generally charged less for electricity than residential customers35 (see Figure 8.10), and this is also true in Ontario. In some jurisdictions, industrial consumers have lower base electricity rates; in Ontario, they have preferential access to peak demand reduction and conservation programs that reduce their share of supply costs.36
For those businesses that cannot benefit from the Industrial Conservation Initiative (ICI) program (the government estimates bill savings from this program to be about 33%37), Ontario’s large-power consumers38 pay more than their counterparts in any other Canadian
province. However, for those who participate in the ICI, Ontario industrial electricity rates are competitive.39 By this metric, as of September 2017, Ontario’s northern industrial electricity rates were lower than in four other provinces, and Ontario’s southern industrial electricity rates were lower than in two provinces.40
Several American states (e.g., Massachusetts and California) have higher prices per kWh for both residential and large customers (see Figure 8.10).41
25%electric
Ontario Canada
58%natural gas
17%other fuels
23%other fuels
35%electric
42%natural gas
120
How high are Ontario electricity prices?
Making Connections: Straight Talk About Electricity in Ontario
Q8
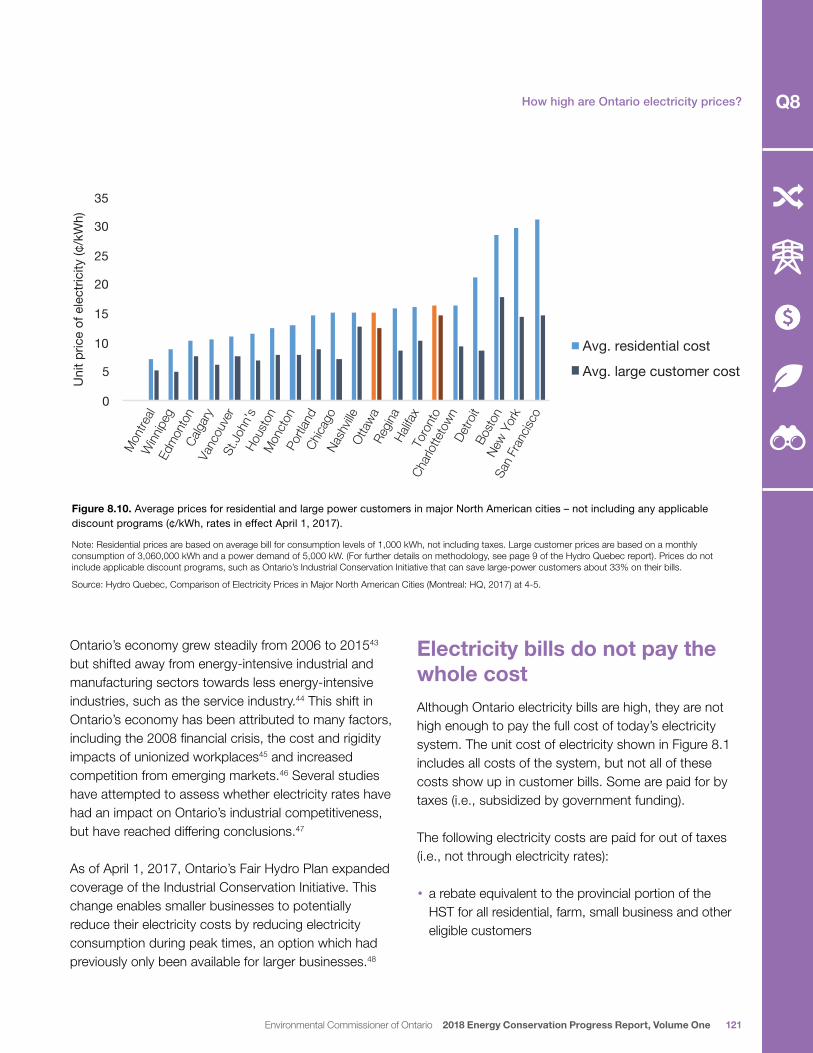
Figure 8.10. Average prices for residential and large power customers in major North American cities – not including any applicable discount programs (¢/kWh, rates in effect April 1, 2017).
Note: Residential prices are based on average bill for consumption levels of 1,000 kWh, not including taxes. Large customer prices are based on a monthly consumption of 3,060,000 kWh and a power demand of 5,000 kW. (For further details on methodology, see page 9 of the Hydro Quebec report). Prices do not include applicable discount programs, such as Ontario’s Industrial Conservation Initiative that can save large-power customers about 33% on their bills.
Source: Hydro Quebec, Comparison of Electricity Prices in Major North American Cities (Montreal: HQ, 2017) at 4-5.
Ontario’s economy grew steadily from 2006 to 201543 but shifted away from energy-intensive industrial and manufacturing sectors towards less energy-intensive industries, such as the service industry.44 This shift in Ontario’s economy has been attributed to many factors, including the 2008 financial crisis, the cost and rigidity impacts of unionized workplaces45 and increased competition from emerging markets.46 Several studies have attempted to assess whether electricity rates have had an impact on Ontario’s industrial competitiveness, but have reached differing conclusions.47
As of April 1, 2017, Ontario’s Fair Hydro Plan expanded coverage of the Industrial Conservation Initiative. This change enables smaller businesses to potentially reduce their electricity costs by reducing electricity consumption during peak times, an option which had previously only been available for larger businesses.48
Electricity bills do not pay the whole costAlthough Ontario electricity bills are high, they are not high enough to pay the full cost of today’s electricity system. The unit cost of electricity shown in Figure 8.1 includes all costs of the system, but not all of these costs show up in customer bills. Some are paid for by taxes (i.e., subsidized by government funding).
The following electricity costs are paid for out of taxes (i.e., not through electricity rates):
• a rebate equivalent to the provincial portion of theHST for all residential, farm, small business and othereligible customers
0
5
10
15
20
25
30
35
Mon
treal
Winn
ipeg
Edm
onto
nCa
lgary
Vanc
ouve
rSt
.John
'sHo
usto
nM
onct
onPo
rtland
Chica
goNa
shvil
leOt
tawa
Regin
aHa
lifax
Toro
nto
Char
lotte
town
Detro
itBo
ston
New
York
San
Fran
cisco
Uni
t pric
e of
ele
ctric
ity (¢
/kW
h)
Avg. residential cost
Avg. large customer cost
121Environmental Commissioner of Ontario 2018 Energy Conservation Progress Report, Volume One
How high are Ontario electricity prices? Q8

• subsidies for distribution rates for about 800,000 customers in rural and remote areas
• the Ontario Electricity Support program which provides rate relief to vulnerable customers
• an Affordability Fund for conservation measures for customers who are slightly above the low-income threshold, and
• the Northern Industrial Electricity Rate Program which reduces electricity rates for large industrial customers in northern Ontario.
Ontario’s 2017 budget includes an estimate of $1.438 billion in 2017-18 spending on “electricity cost relief programs” (i.e., the first four items above), as well as $120 million for the Northern Industrial Electricity Rate Program.49
In addition, the province is borrowing an average of $2.5 billion per year (to 2027) to reduce current electricity bills, to be repaid in future years.50 Over the full period of the Fair Hydro Plan (through 2045), this borrowing will add roughly $21 billion in extra interest charges to the cost of Ontario electricity ( Q13).51
Putting these numbers together, we can estimate that almost 20% ($4 billion out of $21 billion) of the current cost of electricity service is not paid by today’s electricity customers through their electricity rates.
ConclusionOntario’s electricity rates have risen sharply since 2005. They dropped again following the introduction of the Fair Hydro Plan, partly because some electricity system costs are paid for through taxes, and some have been deferred until later. Rates are higher than in many Canadian and U.S. jurisdictions, but below several higher-cost North American locations, and most of Europe.
Average Ontario home energy costs are middle of the pack. This is due to higher than average use of low-cost natural gas for home heating; a trend that has steadily increased since 2006. It is important to note an important exception to this average: Ontarians dependent on electric resistance for home heating.
High electricity costs provide an incentive to reduce the use of electricity (especially during peak hours). But, such reductions may not be possible for the most vulnerable members of the population without government assistance. High electricity costs can also drive a switch to less expensive (but more carbon intensive) natural gas, where possible.
The next question will attempt to explain what has driven up electricity costs.
Almost 20% of the current cost of electricity service is not paid by today’s electricity customers.
122
How high are Ontario electricity prices?
Making Connections: Straight Talk About Electricity in Ontario
Q8

Endnotes
1 Values adjust for inflation (i.e., they are in 2016 real dollars). Were the year 2005 selected as a starting point rather than 2006, the increase would have been much smaller (only about 25%). Part of the reason for this unusual drop in electricity service cost between 2005 and 2006, is due to the fact that “unusual weather and tight supply conditions led to very high demand and record market prices for power, adding about $3B to the cost of electricity.” (Independent Electricity System Operator, “Module 1: State of the Electricity System: 10-Year Review” (presentation, August 2016) slide 40.)
2 Ontario’s CPI for residential electricity bills increased at a similar rate to the rest of Canada between 2000 and 2009, after which it accelerated so that by 2016 it was 45% higher. As a general rule, Ontario and the rest of Canada experience similar increases in their CPI for a representative basket of goods and services, of which electricity is only one of several dozen items. (Statistics Canada, Consumer Price Index, Table 326-0020; Statistics Canada, Gross Domestic Product, Expenditure-Based, Provincial and Territorial, Table 384-0038.)
3 Independent Electricity System Operator, “Module 1: State of the Electricity System: 10-Year Review” (presentation, August 2016) slide 9.
4 Ontario Power Authority, “Ontario Electricity Demand 2012 Annual Long Term Outlook” (presentation, 2012) slides 14-15, 21, 22, online: <cms.powerauthority.on.ca/sites/default/files/news/Q2-2012LoadForecast.pdf>.
5 Ontario Energy Board, Defining Ontario’s Typical Electricity Consumer, EB-2016-0153 (Toronto: OEB, 14 April 2016) at 2.
6 Ibid, at 1.
7 As set at the beginning of the rate year (Jan 1 or May 1, depending on each distribution company’s rate year). The percentage of consumption during time-of-use periods is assumed to be as follows:
2012-2016 2017 off peak 64% 65% mid peak 18% 17% on peak 18% 18%
8 Ontario Energy Board, News Release, “The Fair Hydro Act, 2017” (15 June 2017), online: <www.oeb.ca/newsroom/2017/fair-hydro-act-2017>.
9 Across Canada 38% of households are heated by electricity, and 43% by natural gas, compared to Ontario where 16% of households are heated by electricity and 66% by natural gas (Natural Resources Canada, Survey of Household Energy Use 2011 (Ottawa: NRCAN, 2014) at Table 6.1); The general trend of this survey data is supported by more current data which states that in 2015, residential sector space heating in Ontario was provided by 25.5% electricity and 58.1% natural
gas, and in Canada was 35% electricity and 42% natural gas (Natural Resources Canada, Comprehensive Energy Use Database, Residential sector: Ontario, Table 5: Space Heating Secondary Energy Use and GHG Emissions by Energy Source); The Toronto Atmospheric Fund estimates that almost 24% of multi-unit residential buildings (MURBS) in Ontario are heated with electricity, and that MURBs have the highest portion of electric heating of the residential sector. (Toronto Atmospheric Fund, Pumping Energy Savings: Ontario EMURB Market Characterization Study (Toronto: TAF, February 2016) at ii).
10 The Ontario Energy Board uses 750 kWh to represent the average monthly residential Ontario electricity usage for all homes. Enbridge reports that a typical residential customer uses about 2,400 cubic metres of natural gas a year for home and water heating. Assuming gas space and water heating efficiency of about 80%, it would take about 1,650 kWh/month to heat the same typical home using electric heat. By adding this heating load to the average OEB monthly electricity usage, this results in a total electricity bill of approximately 2,400 kWh. This is about 3.2 times as much electricity as the OEB average. (Enbridge, “Your Energy Dollars Go Further with Natural Gas”, online: <www.enbridgegas.com/homes/accounts-billing/residential-gas-rates/natural-gas-provides-great-value.aspx>.)
11 A customer heating with natural gas would use roughly 200 m3 of natural gas and 750 kWh of electricity per month, averaged over the year. According to the OEB’s rate calculator, this customer’s average Enbridge natural gas bill would be $89.78, and their average Toronto Hydro electricity bill would be $123.71 (as of 28 March 2018), for a total of $213.49. A customer heating with electric resistance heating would use roughly 2,400 kWh of electricity per month, averaged over the year, which would cost $317.94 (49% more than the combined energy bill for the customer heating with natural gas). Of course, this extra cost would not be spread evenly over the course of the year, but would be concentrated in the winter months.
12 Ontario Energy Board, Marginal Abatement Cost Curve for Assessment of Natural Gas Utilities’ Cap and Trade Activities by ICF (EB 2016-0359) (Toronto: OEB, 20 July 2017) at A-3.
13 Government of Canada, National Energy Board, Market Snapshot: Fuel poverty across Canada – lower energy efficiency in lower income households (30 August 2017), online: <www.neb-one.gc.ca/nrg/ntgrtd/mrkt/snpsht/2017/08-05flpvrt-eng.html?=undefined&wbdisable=true>; Contra, the Fraser Institute, which uses 10% of total expenditures as its definition for energy poverty, on the basis that total expenditure is more accurately reported than income (Energy Costs and Canadian Households (Fraser Institute, 2016) at 13, online: <www.fraserinstitute.org/sites/default/files/energy-costs-and-canadian-households.pdf>).
14 Statistics Canada, 2016 Census of Population. Statistics Canada. 2017. Various geographies. Census Profile. 2016 Census. Statistics Canada Catalogue no. 98-316-X2016001. Ottawa. Released September 13, 2017.
Ontario median annual income
Ontario median monthly income
Avg. monthly residential electricity bill(750 kWh, Toronto Hydro)
Avg. monthly residential natural gas bill(200 m3, Enbridge)
Avg. monthly electricity & natural gas bill
$74,287 $6,191 $123.71 $89.78 $213.49
(per Stats Can, 2015) (per OEB Bill Calculator, March 2018) 3.5% of $6,191
123Environmental Commissioner of Ontario 2018 Energy Conservation Progress Report, Volume One
.
.
.
.
.
.
.
.
.
.
.
.
.
.
How high are Ontario electricity prices? Q8

15 Government of Canada, National Energy Board, Market Snapshot: Fuel poverty across Canada – lower energy efficiency in lower income households (30 August 2017), online: <www.neb-one.gc.ca/nrg/ntgrtd/mrkt/snpsht/2017/08-05flpvrt-eng.html?=undefined&wbdisable=true>.
16 Ibid; Energy Costs and Canadian Households (Fraser Institute, 2016) at 19, online: <www.fraserinstitute.org/sites/default/files/energy-costs-and-canadian-households.pdf>.
17 The Ministry of Energy has recently directed the Independent Electricity System Operator to improve access to low-income electricity conservation programs across the province. (Directive from Ontario Minister of Energy to the Independent Electricity System Operator, Re: 2015-2020 Conservation First Framework (4 August 2017), online: <www.ieso.ca/-/media/files/ieso/document-library/ministerial-directives/2017/directive-cff-partnering-green-ontario-fund-cdm-programs-20170804.pdf?la=en>.)
18 Ontario Energy Board, Ontario Electricity Support Program, Questions and Answers, online: <ontarioelectricitysupport.ca/FAQ?lang=en>. [Accessed 22 November 2017]
19 Ontario government, News Release, “Ontario Launches New Program to Help Reduce Electricity Costs” (24 October 2017), online: <news.ontario.ca/mei/en/2017/10/ontario-launches-new-program-to-help-reduce-electricity-costs.html>.
20 Fraser Institute, Evaluating Electricity Price Growth in Ontario (Toronto: Fraser Institute, 2017) at 3.
21 Hydro Quebec, Comparison of Electricity Prices in Major North American Cities, Rates in effect April 1, 2016 (Montreal: HQ, 2016) at 4 (average price for residential customers assuming a monthly consumption of 1,000 kWh), at 5 (large-power customers are those that have a power demand of 5,000 kW or more, and are assumed to consumer 3,060,000 kWh/month).
22 Ontario Energy Board, News Release, “The Fair Hydro Act, 2017” (15 June 2017), online: <www.oeb.ca/newsroom/2017/fair-hydro-act-2017>.
23 The format of Ontario electricity bills is specified by regulation (Information on Invoices to Low-Volume Consumers of Electricity, O Reg 275/04). This regulation sets up the different headings that appear on an electricity bill and explains what charges/costs will be included under those headings.
24 Roughly 91% of eligible customers. (Ontario Energy Board, Monitoring Report: Smart Meter Deployment and TOU Pricing – August 2012 (Toronto: OEB, 17 October 2012), online: <www.oeb.ca/oeb/_Documents/SMdeployment/Monthly_Monitoring_Report_August2012.pdf>.)
25 Instead of the three different electricity rates based on time-of-use periods (“off-peak”, “mid-peak”, “on-peak”), the small number of customers on tiered rates will see two rates, one for electricity use below a threshold (600 kWh in the summer, 1000 kWh in the winter), and a second (higher) rate for electricity use above this threshold. Customers on retail contracts will see the “Electricity” portion of their bill split into two items - the electricity rate set as per their contract, plus a line for “Global Adjustment” costs that account for many of the costs.
All customers pay the Global Adjustment, but for residential and small business customers on tiered or time-of-use rates, the Global Adjustment is already embedded in these rates and not displayed separately. Medium and large customers such as commercial,
institutional and industrial facilities will also see the Global Adjustment as a separate line item on the bill.These costs now account for the majority of the “Electricity” portion of the bill.
26 This charge also includes the cost of conservation programs, which make up a very small share of the charge.
27 Tiered rates are also regulated. Retailer rates, on the other hand, are not regulated by the OEB and are set out in the energy contract signed between the customer and the retailer, although the OEB provides consumer protection oversight.
28 The delivery charge includes: • a customer service charge from LDCs to operate meter readings
and customer service • transmission charges from Hydro One to operate and maintain their
transmission lines, and • a line loss charge to account for the electricity lost during
transmission and distribution.
All these charges require OEB approval.
29 The regulatory charge also covers renewable connection costs from LDCs and the Standard Supply Service Charge which is an administrative charge approved by the OEB for customers that buy electricity directly from LDCs. As of June 1, 2017, some of the Rural and Remote Electricity Rate Protection (RRRP) and all of the Ontario Electricity Support (OESP) charges were removed from this line item and moved to the tax base.
30 As of March 31, 2017, total debt and liabilities that still have to be repaid were $21.1 billion. However, unfunded liabilities were only $3.2 billion. The Ontario Electricity Financial Corporation will use other revenue sources to pay down the remaining debt once the Debt Retirement Charge is removed from all electricity bills. (Ontario Electricity Financial Corporation, Debt Management, online: <www.oefc.on.ca/debtmanage.html>.)
31 Ontario Ministry of Finance, Debt Retirement Charge – General Information, online:<www.fin.gov.on.ca/en/guides/drc/101.html>.
32 Ontario Government, News Release, “Ontario Passes Legislation to Reduce Electricity Costs for Families and Businesses” (19 October 2016) online: <news.ontario.ca/mei/en/2016/10/ontario-passes-legislation-to-reduce-electricity-costs-for-families-and-businesses.html>.
33 Financial Accountability Office of Ontario, Home Energy Costs (Toronto: FAO, 25 August 2016) at 1, online: <www.fao-on.org/en/Blog/Publications/home_energy>.
34 Although the results of this survey are only indicative of actual costs due to methodological limitations (i.e., sample size and accuracy of responses), the results do reflect the home space heating profiles of average Ontarians.
35 Most jurisdictions are strongly motivated to attract and keep large businesses for employment and tax reasons, and they can be proportionately less expensive to serve than households.
36 Specifically, their share of the “global adjustment”, a portion of electricity costs which covers the costs for contracted generating resources that are not recovered from the commodity price alone, as well as a very small amount for conservation programs.
.
.
.
.
.
.
.
.
.
.
.
.
.
.
.
.
.
.
.
.
.
.
124
How high are Ontario electricity prices?
Making Connections: Straight Talk About Electricity in Ontario
Q8

37 Ministry of Energy, News Release, “Backgrounder: Ontario’s Industrial Conservation Initiative (ICI)” (15 September 2016) online: <news.ontario.ca/mei/en/2016/09/ontarios-industrial-conservation-initiative-ici.html>.
38 Here ‘large power consumers’ is a term borrowed from the referenced Hydro Quebec report, where it is defined as consumption over of 3,060,000 kWh and a power demand of 5,000 kW. In Ontario, residential customers are those with a peak demand of less that 50 kW, any peak demand above that is considered to be a Class B customer, and any commercial or institutional customer with a peak demand above 1,000 kW, or industrial customer with a peak demand of 5,000 kW or greater is eligible to register as a class A consumer under the Industrial Conservation Initiative (ICI).
39 Ministry of Energy, Ontario Energy Report, Q3 2017 at 15, online: www.ontarioenergyreport.ca/pdfs/6188_IESO_Q3OER2017_Electricity_EN.pdf.
40 Ontario Energy Report, Q3 2017 (Toronto: IESO, 2017) at 15, online: <www.ontarioenergyreport.ca/pdfs/6188_IESO_Q3OER2017_Electricity_EN.pdf>.
41 Hydro Quebec, Comparison of Electricity Prices in Major North American Cities (rates in effect April 2017) (Montreal: HQ, 2017) at 4, 26.
42 Many large-power customers in Ontario participate in the Industrial Conservation Initiative (ICI) conservation program, which substantially lowers their electricity bills. These cost reductions (and any cost reductions from optional programs) are not reflected in the chart.
43 As evidenced by total expenditure based GDP:
Provincial and Territorial Gross Domestic Product by Income and by Expenditure Accounts – 1902 (Final consumption expenditure)
ONTARIO Chained (2007) dollars
2006 2007 2008 2009 2010 2011 2012 2013 2014 2015
$438,080 $450,039 $464,401 $466,543 $482,061 $489,514 $495,041 $501,462 $513,272 $526,388
(Statistics Canada: Table 384-0038 Gross domestic product, expenditure-based).
44 Ontario’s service industry went from represent 74% of the province’s GDP in 2007 to 77% of the GDP in 2015, whereas Ontario’s industrial sector went from 20% to 15%, the manufacturing sector went from 16% to 12%, and its goods producing sector went from 26% to 22.5%. (Statistics Canada, CANSIM table 379-0028: Gross Domestic Product (GDP) at basic prices, by North American Industry Classification System (NAICS).)
45 Ontario Ministry of Finance, Ontario’s Long-Term Report on the Economy (Toronto: Ministry of Finance, 2017) at 103-105.
46 Emily Capeluck, Explanations of the Decline in Manufacturing Employment in Canada (Centre for the Study of Living Standards, October 2015) at 31, online: <www.csls.ca/reports/csls2015-17.pdf>.
47 A 2017 Fraser Institute study argued that high electricity prices may be to blame (at least in the electricity-intensive steel and paper manufacturing sectors) for the fact that manufacturing jobs in Ontario did not recover after the 2008 recession at the same pace as neighbouring jurisdictions. The study’s findings are based on two key assumptions: (1) applicable industrial electricity rates, and (2) applicability of findings from a 2013 American study (regarding the elasticity of employment in certain U.S. industries to energy prices). The latter does not account for Ontario-
specific and more recent socio-political trends that may have affected job losses in these sectors. It is also unclear whether the assumption made about applicable industrial electricity rates is appropriate for Ontario’s steel and paper industries. The study assumes an average between class A and class B industrial rates. However, companies in these industries are likely to fall primarily in class A, which has lower rates. (Ross McKitrick and Elmira Aliakbari, Rising Electricity Costs and Declining Employment in Ontario’s Manufacturing Sector (Toronto: Fraser Institute, October 2017) at 25-27); Another report published in 2017 by McMaster University’s Automotive Policy Research Centre concluded that Ontario’s automotive industry has not seen its competitiveness with North America’s top 10 leading car-manufacturing jurisdictions impacted by the rising cost of electricity. (Greig Mordeu and Kelly White, Electricity Pricing in Ontario and its Effect on Competitiveness: an Automotive Manufacturing Case Study (Hamilton: Automotive Policy Research Centre, March 2017) at 14).
48 The ICI was extended to consumers with a peak demand of 1 MW to 500 kW in targeted manufacturing and industrial sectors (including greenhouses). (Independent Electricity System Operator, Conservation E-Blasts: Industrial Conservation Initiative (3 May 2017) online: <www.ieso.ca/sector-participants/conservation-delivery-and-tools/conservation-e-blasts/2017/05/industrial-conservation-initiative-update>.)
49 Ministry of Finance, 2017 Ontario Budget: Budget Papers (Toronto: Ministry of Finance, 2017) at 23, 240, online: <www.fin.gov.on.ca/en/budget/ontariobudgets/2017/budget2017.pdf>.
50 Financial Accountability Office of Ontario, An Assessment of the Fiscal Impact of the Province’s Fair Hydro Plan (Toronto: FAO, Spring 2017) at 4, online: <www.fao-on.org/web/default/files/publications/Fair%20Hydro/Fair%20Hydro%20Plan.pdf>.
51 Ibid, at 1.
125Environmental Commissioner of Ontario 2018 Energy Conservation Progress Report, Volume One
How high are Ontario electricity prices? Q8
.
.
.
.
.
.
.
.
.
.
.
.
.
.
.

2005
Q U ES T I O N 9
What do higher electricity costs pay for?
Almost all of the 37% increase in electricity system costs from 2006 to 2016 has come from higher generation costs, not conservation, transmission or distribution. New generation was needed to improve reliability and to replace coal plants, and every new source of generation has been more expensive than previous sources.
Nuclear has contributed the most to system cost increases, followed by wind and solar. Solar and bioenergy have the highest cost per unit of electricity generated, followed by natural gas, wind, nuclear and hydro (water). There are good reasons for including each source in Ontario’s electricity system.
The cost of nuclear power will rise for the next decade, then decline. The cost of natural gas power will slightly increase to reflect gas plant relocations, and is susceptible to changes in the market price of gas. Solar has seen sharp cost declines, but system costs include contracts signed when prices were higher. After current contracts expire, solar and wind may keep on providing power at much lower cost ( Q17).
Conservation is substantially cheaper than any form of additional generation, and currently avoids the need for about 12 TWh of additional supply. Transmission, including Hydro One, has not increased system costs.
Note: System costs are not the same as customer bills.
I M PAC T O N E L E C T R I C I T Y P R I C E S

Note to reader: Historic electricity system cost comparisons are in real 2016 dollars, but individiual generation resource cost comparisons (e.g., wind, solar, nuclear, etc.,) have not been adjusted (i.e., are in nominal dollars). This means that electricity system costs have been adjusted to their 2016 value, which includes the impact of inflation. For example, something worth $1 in 2006, would be adjusted to $1.17, its value in 2016 real dollars.1
Contents
THE DETAILS . . . . . . . . . . . . . . . . . . . . . . . . . . . . . . . . . . . . . . . . . . . . . . . . . . . . . . . . . . . . . . . . . . 128
Overview . . . . . . . . . . . . . . . . . . . . . . . . . . . . . . . . . . . . . . . . . . . . . . . . . . . . . . . . . . . . . . . . . . . . . 128
Conservation . . . . . . . . . . . . . . . . . . . . . . . . . . . . . . . . . . . . . . . . . . . . . . . . . . . . . . . . . . . . . . . . . 129
Distribution . . . . . . . . . . . . . . . . . . . . . . . . . . . . . . . . . . . . . . . . . . . . . . . . . . . . . . . . . . . . . . . . . . 129
Transmission/Hydro One. . . . . . . . . . . . . . . . . . . . . . . . . . . . . . . . . . . . . . . . . . . . . . . . . . . . . . . . . 129
Generation costs . . . . . . . . . . . . . . . . . . . . . . . . . . . . . . . . . . . . . . . . . . . . . . . . . . . . . . . . . . . . . . . 129
Comparing the cost of conservation . . . . . . . . . . . . . . . . . . . . . . . . . . . . . . . . . . . . . . . . . . . . . . . . 132
The devil is in the accounting details . . . . . . . . . . . . . . . . . . . . . . . . . . . . . . . . . . . . . . . . . . . . . . . . 134
Procurement choices and renewables. . . . . . . . . . . . . . . . . . . . . . . . . . . . . . . . . . . . . . . . . . . . . . 135
The cost of generation going forward . . . . . . . . . . . . . . . . . . . . . . . . . . . . . . . . . . . . . . . . . . . . . . 137
Unit cost is not all that matters . . . . . . . . . . . . . . . . . . . . . . . . . . . . . . . . . . . . . . . . . . . . . . . . . . . 139
Factors influencing costs for nuclear, solar and wind . . . . . . . . . . . . . . . . . . . . . . . . . . . . . . . . . 139
Endnotes . . . . . . . . . . . . . . . . . . . . . . . . . . . . . . . . . . . . . . . . . . . . . . . . . . . . . . . . . . . . . . . . . . . . . 145
127Environmental Commissioner of Ontario 2018 Energy Conservation Progress Report, Volume One
What do higher electricity costs pay for? Q9
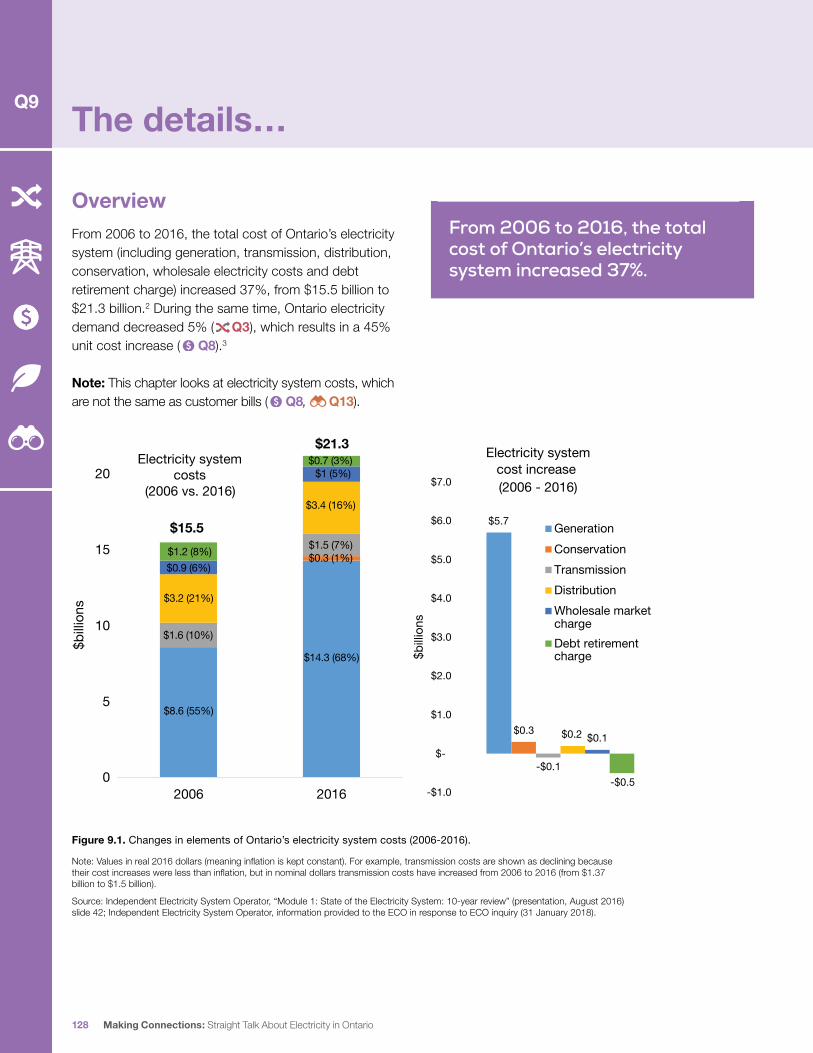
The details…
OverviewFrom 2006 to 2016, the total cost of Ontario’s electricity system (including generation, transmission, distribution, conservation, wholesale electricity costs and debt retirement charge) increased 37%, from $15.5 billion to $21.3 billion.2 During the same time, Ontario electricity demand decreased 5% ( Q3), which results in a 45% unit cost increase ( Q8).3
Note: This chapter looks at electricity system costs, which are not the same as customer bills ( Q8, Q13).
Figure 9.1. Changes in elements of Ontario’s electricity system costs (2006-2016).
Note: Values in real 2016 dollars (meaning inflation is kept constant). For example, transmission costs are shown as declining because their cost increases were less than inflation, but in nominal dollars transmission costs have increased from 2006 to 2016 (from $1.37 billion to $1.5 billion).
Source: Independent Electricity System Operator, “Module 1: State of the Electricity System: 10-year review” (presentation, August 2016) slide 42; Independent Electricity System Operator, information provided to the ECO in response to ECO inquiry (31 January 2018).
From 2006 to 2016, the total cost of Ontario’s electricity system increased 37%.
0
5
10
15 $1.2 (8%)
$1 (5%)
$3.4 (16%)
$1.5 (7%)$0.3 (1%)
$14.3 (68%)
$0.7 (3%)
$0.9 (6%)
$3.2 (21%)
$8.6 (55%)
$1.6 (10%)
$15.5
$21.3
20
2006 2016
$billi
ons
Electricity systemcosts
(2006 vs. 2016)
$5.7
$0.3
-$0.1
$0.2 $0.1
-$0.5 -$1.0
$-
$1.0
$2.0
$3.0
$4.0
$5.0
$6.0
$7.0
$billi
ons
Electricity systemcost increase (2006 - 2016)
GenerationConservationTransmissionDistributionWholesale marketchargeDebt retirementcharge
128 Making Connections: Straight Talk About Electricity in Ontario
Q9

Increased generation costs were responsible for 98% of this rise in costs. Conservation, then distribution added small amounts, at 5% and 3% respectively. These increases were partly offset by decreases in transmission charges and the debt retirement charge.4
Conservation
Conservation costs increased, because they started from a baseline of near-zero spending in 2006. Conservation has been less expensive than the 12+ TWh of generation that would otherwise have been required. Of this, conservation programs funded by electricity customers avoided increased electricity demand in 2016 of roughly 7 TWh (5%).5 Energy codes and standards avoided increased electricity demand in 2016 of roughly 5 TWh (4%) ( Q3).6 The IESO estimates that 2011-2014 utility conservation programs alone saved roughly $400 million (primarily from avoided electricity costs and less need for new generation capacity).7 The average Ontario household uses 13% less electricity today than it did in 2006.8 This has helped to buffer the impact of higher electricity rates ( Q8).
As of 2016, per unit of electricity (produced or saved), conservation programs are still lower cost than any generating resource (see Table 9.2 and the textbox “Comparing the cost of conservation”).9 Q19 addresses the costs of conservation to date and going forward, and whether it is still a worthwhile investment in a period when Ontario sometimes has surplus electricity.
Distribution
Distribution system costs vary throughout the province, depending on the needs of a region’s local distribution company. According to the Ontario Energy Board, which reviews distributors’ and transmitters’ rate applications, the overall provincial increase in distribution costs is due to a combination of:
• the need to replace ageing infrastructure, and
• costs associated with smart meter installations.
Transmission/Hydro One
Hydro One owns about 98% of Ontario’s transmission infrastructure, as well as local distribution in many rural areas. Transmission costs have declined slightly since 2006, and represent a small portion (7%) of overall electricity costs. While capital spending has risen in recent years (and is projected to rise further through 2022) this has not resulted in a significant change in rates to date.11 Hydro One’s spending through 2018 has been approved, and the Ontario Energy Board’s decision (the first since Hydro One was privatized), will see transmission rates rise by only about 0.2% in 2018 (significantly less than the increase in inflation).12
Because conservation, distribution and transmission added so little to system cost increases from 2006 to 2016, the ECO does not analyse them in detail in this chapter of the report.
Generation costsIt is not surprising that the increase in Ontario’s electricity system costs from 2006 to 2016 was overwhelmingly to procure more electricity supply. Even before Ontario committed to phase-out coal (21% of capacity and 18% of supply in 2005), it was clear that the province would be facing a serious generation shortfall, due to inadequate capacity ( Q5), aging supply resources, and forecasted increase in demand.13 Coal had been ruled out for health and environmental reasons, and accessible hydro resources had already been mostly exploited in the province. New electricity supply would inevitably cost more, partly because
Conservation, distribution and transmission added little to system cost increases from 2006 to 2016.
129Environmental Commissioner of Ontario 2018 Energy Conservation Progress Report, Volume One
What do higher electricity costs pay for? Q9

of inflation and increasingly stringent environmental standards.
A substantial amount of new capacity was procured between 2005 and 2015: 14,975 MW or a 61% increase in overall capacity (net of coal replacement). About 60% of the new capacity is available to meet winter and summer peaks ( Q5).14
All of this supply has been more expensive than the average cost of power in 2005, and much of it has been privately funded. Financing electricity infrastructure with private capital costs more than financing it with publicly guaranteed debt, as Ontario Hydro used to do. This may have had an impact on the costs of new supplies.
There are two ways to describe which resource is responsible for the largest share of the increase: on an overall cost basis, or on a per unit of electricity provided basis. Neither tells the whole story. Figure 9.2 shows how much each electricity generating resource has contributed in terms of new electricity production, and in increased generation costs from 2006 to 2016.
Figure 9.2. Increase/decrease of Ontario electricity production (in TWh) and generation costs ($millions) from 2006 to 2016.
Note: Costs are in nominal dollars. “Other” and net exports are not included. “Other” includes the Industrial Electricity Incentive program, electricity via storage production, funds, interest, liquidated damages, contingency support payments, etc.15
Source: Independent Electricity System Operator, information provided in response to ECO inquiry (31 January 2018).
New electricity supply would inevitably cost more.
$1,658
$2,186
$1,694
$1,093
$652
$232
-$1,296
10.3 7.5
3.5 2.5 2.2
-0.3
-25.0 -25
-20
-15
-10
-5
0
5
10
15
20
25
-$2,500
-$2,000
-$1,500
-$1,000
-$500
$-
$500
$1,000
$1,500
$2,000
$2,500
Wind Nuclear Solar Gas/Oil Hydro Bioenergy Coal
Elec
trici
ty p
rodu
ctio
n (T
Wh)
Cos
t ($m
illion
s)
Increase/decrease from 2006-2016
Cost ($millions)Electricity production (TWh)
130
What do higher electricity costs pay for?
Making Connections: Straight Talk About Electricity in Ontario
Q9

Nuclear and hydro produce a higher share of electricity supply than their respective shares of generation costs.
Nuclear power accounted for the largest share of electricity generation costs in 2016 (45%) and of generation cost increases since 2006 (35%). Solar and wind follow close behind, at 27% and 26%, respectively, of generation cost increases. (Some of the factors behind the cost increases for these three resources are discussed later in the chapter, in Table 9.3.) Natural gas was the next biggest contributor to generation cost increases at 17%.
Figure 9.3 shows the difference between a generation source’s overall cost to the electricity system and its share of electricity generation as a snapshot in time in 2016. As this Figure shows, nuclear and hydro produce a higher share of total electricity supply than their
respective shares of total generation costs. One major reason is that generation costs in 2016 represent the average costs of investments made at many different points in time. Most hydro costs, and some nuclear ones, represent investments made long ago and are partly or fully depreciated. These historical costs are much lower than the cost of procuring new generating capacity today.
Figure 9.3. Electricity source as a share of generation costs, and share of generation (Ontario, 2016).
Note: Electricity supply data includes embedded electricity, as well as electricity that was exported in 2016, but excludes electricity production that was curtailed by the IESO (mostly wind and hydro).
Source: Independent Electricity System Operator, information provided in response to ECO inquiry (31 January 2018).
Nuclear, 45%Nuclear, 58%
Hydro, 15%
Hydro, 23%Gas/Oil, 15%
Gas/Oil, 8%Wind, 12%
Wind, 7%Solar, 12%Solar, 2%Bioenergy, 2%
Bioenergy, 0.4%
Other, 0.5% Other, 0.4%
0%
10%
20%
30%
40%
50%
60%
70%
80%
90%
100%
Electricity source as % of generation costs (2016) Electricity source as % of generation (2016)
131Environmental Commissioner of Ontario 2018 Energy Conservation Progress Report, Volume One
What do higher electricity costs pay for? Q9
Comparing the cost of conservation
Every government dollar spent on electricity conservation programs in Ontario reduces the demand for electricity, and as a result, the need for new electricity generation. This is why the ECO, and the province, refer to conservation as part of Ontario’s electricity supply mix.16 Nonetheless, it is difficult to fairly compare historic conservation programs savings on a per unit basis (¢/kWh) to other electricity generating resources.
This is the case because electricity saved in any given year by conservation programs is the result of historic spending, over multiple years, which was expensed in advance (see the textbox “The devil is in the accounting details”), whereas the electricity generated by other resources in any given year is better matched to the spending in that year. As a result, the only fair way to compare the cost of electricity conservation programs to other generating resources is to compare the unit cost of electricity conservation savings (over the conservation measure’s lifetime) to the unit cost of electricity from new supply over its lifetime (that is
the Levelized Unit Energy Costs or LUECs, see Table 9.2). By this measure, conservation is much cheaper for the electricity system as a whole than any form of new supply.
One caveat is that this LUEC for conservation only includes costs paid by all ratepayers, and does not include ‘participant costs’, that is the money spent by the individual to participate in the conservation program (e.g., the residual cost to buy an energy efficient light bulb after using a conservation program coupon). The ECO estimated participant costs for 2014 were about 50% in addition to the conservation costs paid by ratepayers.17 Even if an additional 50% were added to the cost of conservation program savings, they would still be the least expensive source of new electricity supply (see Table 9.2).
Per unit of electricity produced, solar and bioenergy had the highest costs in 2016 (at 48 and 41¢/kWh respectively), followed distantly by wind and natural gas (both at 16¢/kWh). Hydropower (largely from low-cost stations built many years ago) was Ontario’s cheapest source of generation at 6¢/kWh, followed closely by nuclear at 7¢/kWh. Figure 9.4 shows the average cost
per unit of electricity for each generation resource in 2016, and how this changed from 2006. The difference between each resource’s cost and generation output is also shown in Figure 9.3.
Note 1: the overall cost of these resources includes payments for curtailed production, but neither the unit costs or the share of generation shown in Figures 9.3 and 9.4 account for electricity production that has been curtailed ( Q7). The average unit cost would be lower if all of the potential electricity could have been used. This affects the unit cost of hydro and wind the most. In 2016, roughly 17% of wind production was curtailed by
Conservation is much cheaper for the electricity system as a whole than any form of new supply.
Per unit of electricity produced, solar and bioenergy had the highest costs.
132
What do higher electricity costs pay for?
Making Connections: Straight Talk About Electricity in Ontario
Q9

the IESO (2.2 TWh curtailed, vs. 10.7 TWh produced), which increased the unit cost of wind by an equivalent proportion.18 Preliminary data for 2017 suggests that the IESO curtailed 25% of wind production in 2017, which will further inflate the apparent cost of wind to the electricity system.
Note 2: Unit costs are strongly affected by how often a source of generation is called on to produce power. In 2016, natural gas represented 15% of costs, but only 8% of supply. Preliminary data suggests that natural gas provided even less, only 4% of supply, in 2017. In addition, from 2017 onwards, gas fired generators must purchase greenhouse gas emission allowances under Ontario’s cap and trade system. This will increase the unit cost of gas-fired generation.
Figure 9.4. Average cost per unit of electricity produced by resource type (2006 vs. 2016).
Note: Costs are in nominal dollars. Had nuclear, hydro and wind not been curtailed at times in 2016 due to surplus electricity conditions, their price per unit would have been respectively: 6.9¢/kWh (i.e., essentially unchanged), 5¢/kWh instead of 6¢/kWh, and 13¢/kWh instead of 16¢/kWh. The 2016 value for bioenergy appears unusually high because of the Thunder Bay and Atikokan biomass plants, which are used as peaking resources that operate very infrequently, and thus have a very high cost per unit of electricity produced.
Source: Independent Electricity System Operator, information provided in response to ECO inquiry (31 January 2018).
5 4 510
8
0
77 60
16 16
48
41
0
10
20
30
40
50
60
Nuclear Hydro
Without curtailment:
5¢/kWh
Coal Gas/Oil Wind Solar Bioenergy
¢/kW
h
Electricity generation source
2006 2016
Without curtailment:
13¢/kWh
133Environmental Commissioner of Ontario 2018 Energy Conservation Progress Report, Volume One
What do higher electricity costs pay for? Q9

The devil is in the accounting details
Another reason for the difference in costs between different types of generating resources is differing accounting treatments, in particular, for how the capital costs (i.e., construction, equipment and land acquisition) of different resources are recovered. For example, some capital costs are recovered from electricity customers:
1. over the expected life of the asset, in gradually smaller amounts, according to the asset’s depreciating value (like how cars and homes are treated for tax purposes in Ontario).
- This is the case for publicly funded Ontario Power Generation (OPG) assets regulated by the Ontario Energy Board. These include Pickering and Darlington, and most of OPG’s hydro facilities. This approach usually produces high initial costs that decline over time, and produce very low reported costs, e.g., for older hydro assets. This practice is why nuclear costs will rise for the next decade and then decline.
- Sometimes these costs are smoothed out, in whole or in part, over a period of time as in OPG’s recent rate case.19 This will slow the impact of nuclear cost increases on total system costs.
- Note that OPG cost overruns not funded through rates become the responsibility of the province, OPG’s sole shareholder.
2. recovered at a fixed price over the term of the asset’s contract.
- This is the case for most generators under contract with the IESO (i.e., almost all natural gas and renewable generators, the Bruce nuclear plant and most other generators, except the
OPG assets mentioned above. These are mostly privately funded generation assets, meaning they have higher financing costs than publicly funded generation assets).
- This approach fixes the costs, in advance, for the length of the contract and puts the responsibility for unexpected operating costs (other than fuel costs) on the operator of the generation facility.
- If the asset continues to be able to produce power at the end of the initial contract, but after payment of initial capital costs, the operator may subsequently be willing to sell power at a substantially lower cost per unit of electricity, especially for solar and wind which have no fuel costs.
- Ontario’s LTEP expects to lower future electricity costs by capitalizing on these post-initial-contract generating sources for future low cost generation ( Q17).
3. are front-loaded when the resource is first introduced to the supply mix.
This is the case for conservation programs. Essentially all of the capital costs of conservation show up on bills as soon as the conservation project is completed, which is very different from generation.20 As conservation measures can produce benefits for 10-15 years, or more, in the near term their per unit cost appears to be higher than it actually is.21
These different accounting treatments mean that at different points in time, consumers can pay different amounts for the same amount of electricity, sometimes from the very same resource.
-
134
What do higher electricity costs pay for?
Making Connections: Straight Talk About Electricity in Ontario
Q9

Procurement choices and renewablesElectricity resources can be procured in different manners, including bilateral negotiations (e.g., Bruce nuclear refurbishment), competitive procurements where price is used as one of the deciding factors, and non-competitive procurements, where a set price is offered for a certain type of electricity. Each style of procurement helps achieve different policy aims. Ontario’s procurement for renewable electricity has oscillated between competitive and non-competitive models.22
The initial renewables procurement was done through the Renewable Energy Supply (RES) procurement and was competitive on price. Launched in 2004, it procured renewables at relatively low prices (averaging 9.5¢/kWh).23 These projects, which began to come online in 2006, were almost exclusively large wind projects, and took advantage of some of the best sites.
In 2006, the Renewable Energy Standard Offer Program (RESOP) set fixed contract prices (higher than RES) that differed by resource. This opened the door to more sizes and types of renewable energy projects (including solar, and more bioenergy), for groups that would not be able to foot the upfront costs to participate in a competitive procurement or would not be price-competitive with large-scale wind.
In 2009, under the Green Energy Act, the Feed-in Tariff (FIT) program (and microFIT for smaller projects) expanded on the RESOP model, by providing for higher prices than RESOP. It opened the door to even more sizes and types of renewable electricity projects. It was specifically intended to dramatically expand renewable electricity in Ontario, develop a local renewable energy industry, create jobs in a recession, and incent adoption of small scale (individual, community level, and indigenous-run) projects.24 The ECO does not know
whether these objectives could have been obtained at RESOP prices.
Ontario’s initial Feed-in Tariff rates were set after public consultation, and were reviewed two years later. Renewable energy procurement programs intentionally pay more than the cheapest going rate for electricity, in order to obtain public goods that the free market would not provide. In setting FIT rates, the government had multiple public policy goals, including encouraging small-scale and community power, economic development and environmental protection. Ontario’s climate makes wind and solar more expensive here than in many other places. The Green Energy Act also added new costs and delays, including an elaborate process of environmental approvals, a unique third-party right of appeal to the Environmental Review Tribunal ( Q10) and domestic content requirements.
At the time, FITs were the most widely used and successful policy in the world for accelerating renewable electricity deployment.25 FITs were also important tools for encouraging diversity of technologies, locations and participants, instead of a system that consisted almost exclusively of large wind projects owned by large corporations.26
Renewable energy procurement programs intentionally pay more than the cheapest going rate for electricity, in order to obtain public goods that the free market would not provide.
135Environmental Commissioner of Ontario 2018 Energy Conservation Progress Report, Volume One
What do higher electricity costs pay for? Q9

FIT encouraged community and indigenous participation by providing specific price adders to the base FIT price (see Table 9.1) and, in later versions, set aside a portion of overall capacity targets for indigenous
and community participation.27 Approximately 519 MW of projects (in operation or under development) have qualified for the indigenous participation price adder, and 83 MW of projects have qualified for the community participation adder.28
Table 9.1. FIT price adders (as of January 2017).
Indigenous Participation Project Community Participation Project Municipal or Public Sector
Participation Level (Economic Interest)
> 50% ≥ 15% ≤ 50% > 50% ≥ 15% ≤ 50% > 50% ≥ 15% ≤ 50%
Price Adder (¢/kWh) 1.5 0.75 1 0.5 1 0.5
The FIT program is a contributor to the per unit price for wind, solar and bioenergy (see Figure 9.4), but that is not the whole story. Bioenergy unit costs are also inflated by the fact that the Atikokan and Thunder Bay biomass plants are primarily used to meet peak demand. Similarly, wind costs per unit of electricity would have been lower if turbines were not turned off at periods of low electricity system demand. The potential to benefit from Ontario’s surplus low-GHG electricity generation capacity to lower overall costs and help meet Ontario’s climate targets is discussed at Q16.
The intentionally higher costs of FIT programs always require control. Several mechanisms can contain the cost to ratepayers of FIT payments. Ontario used several of these mechanisms, but some not until the 2012 cost review, after the initial FIT program had been in place for several years. These mechanisms included caps on the total capacity procured through FIT contracts, caps on the sizes of individual projects, and regular detailed revisions to the FIT tariff as technology costs dropped.29 Ontario adjusted its rules frequently, making more than 15 changes to FIT rules and tariffs by 2016.30 However, Ontario did not use a fully transparent mechanism to set its FIT tariffs,31 and it did not bring down the tariff as quickly or as frequently as some other jurisdictions did, such as Spain.32 As a result, tariffs
were occasionally out of synch with market realities, i.e., payments were sometimes too high compared to the actual cost of the technology. For example, Ontario and other jurisdictions did not anticipate how rapidly solar PV prices would decline, nor how quickly developers could scale up. (It should be noted however that the costs for solar and wind generation in Ontario is not comparable to solar and wind generation in sunnier or windier climates.)
In 2013, the process for contracts for larger renewables went back to a competitive procurement (the Large Renewables Procurement) based on price (but with different targets for different types of renewables, so solar was not competing with wind).33 This procurement was successful in contracting projects at much lower prices.
Ontario abandoned its FIT programs in 2016 and the planned second phase of the Large Renewable Procurement,34 as well as its goals of accelerating
The intentionally higher costs of FIT programs always require control.
136
What do higher electricity costs pay for?
Making Connections: Straight Talk About Electricity in Ontario
Q9

renewable electricity deployment and building an Ontario renewable electricity industry. Now that the infant solar and wind industries have matured, large corporate projects can be procured at lower costs through competitive procurement. Going forward, any renewable procurement in Ontario will be undertaken via the market renewal program (for larger projects, see Q17). Smaller projects will likely only proceed through the net metering program ( Q18).
The cost of generation going forwardThere is a time lag between when a project is contracted and the price impact on customers is felt. For example, the cost of solar and wind generation projects that have been contracted but are not yet in service are not included in current costs. As these projects come into service, solar and wind unit costs will decline. On the other hand, the cost of natural gas and nuclear is set to increase as gas plant cancellations35 and nuclear refurbishment costs (see Table 9.3) begin to be recovered through electricity bills (once the projects are completed and in-service), just as the cost of the wind and solar costs impacted customers. The Auditor General of Ontario estimates that the gas plant cancellations will cost ratepayers about $720-$860 million, spread over the 20-year contracts of the plants (i.e., about $36-$43 million/year).36 This will add about 0.2% to the total cost of electricity service. The projected impact of these and other costs on future electricity rates is included in the overall bill projections shown in Q13 (see Q14 for further discussion of refurbishment costs).
Average generation costs going forward will still be a blend of new and existing resources – they should not be confused with the price of procuring new generation. Table 9.2 provides a comparison of the cost of new generation (Levelized Unit Energy Costs or LUECs) and the current average cost for generating resources
in Ontario. The table shows how procurements for large scale wind and solar will decrease to reflect lower capital costs. New large-scale renewable costs would likely be as low or probably lower than the results from Ontario’s 2016 Large Renewables Procurement (8.6¢/kWh on average for wind, 15.7¢/kWh for solar). Table 9.2 also includes estimates on how Ontario’s carbon price will impact the cost of gas-fired generation. The variability is partly due to the uncertain cost of natural gas.
Most notably, the cost of new conservation in 2016 is lower than any other resource, and has negligible (if any) negative environmental impacts. As noted in Table 9.2, the LUEC for conservation does not account for about an additional 50% of capital costs which are borne by participants. Even accounting for these additional costs, conservation programs are still the most affordable resource.
Finally, for many types of generation, there is the potential for cost savings if existing facilities can be kept on-line after the end of their current contracts, at a lower cost, as their capital costs will have been paid off ( Q17). This seems particularly promising for renewables, given their very low operating costs.
The cost of new conservation in 2016 is lower than any other resource, and has negligible (if any) negative environmental impacts.
137Environmental Commissioner of Ontario 2018 Energy Conservation Progress Report, Volume One
What do higher electricity costs pay for? Q9

Table 9.2. Estimated cost of new generation, compared to average cost for in-service generation in 2016 (¢/kWh).
Technology Range Estimated cost of new generation (¢/kWh)
Avg. cost for in-service generation in 2016 (¢/kWh)
Nuclear refurbishment Avg 87
New nuclear min 12
max 29
Wind Onshore wind (min) 7 16
Offshore wind (max) 21
Solar PV Utility-scale solar PV (min) 14 48
Consumer-based solar PV (max) 29
Bioenergy Min 16 41
Max 26
Hydro Min 12 6
Max 24
Combined heat and power Min 8 n/a
Max 24
Natural gas (including carbon costs)
Min 8 16
Max 29
Conservation Avg 2 n/a
Note: All LUEC estimates from IESO’s 2016 Ontario Planning Outlook (Table 2), other than nuclear refurbishment (per FAO), natural gas (per IESO 2018 information request) and conservation (per IESO 2016 Verified Results report). It is not possible to calculate an average cost of conservation in Ontario for 2016 (at least in a way that is comparable to other resources) because of the unique accounting rules that apply to conservation programs (see Textbox: The devil is in the accounting details). The LUEC for conservation does not include participant costs, which may represent an additional 50% (see Textbox: Comparing the cost of conservation).
Source: Independent Electricity System Operator, information provided in response to ECO inquiry (31 January 2018); Independent Electricity System Operator, Ontario Planning Outlook (Toronto: IESO, 1 September 2016); Independent Electricity System Operator, “Module 4: Supply Outlook” (presentation: IESO, August 2016); Financial Accountability Officer, Nuclear Refurbishment (Toronto: FAO, 21 November 2017) at 1; Independent Electricity System Operator, Final Verified 2016 Annual LDC CDM Program Results Report (Toronto: IESO, 28 June 2017).
138
What do higher electricity costs pay for?
Making Connections: Straight Talk About Electricity in Ontario
Q9

Unit cost is not all that mattersTo judge the value Ontarians receive for different generating resources, it is not sufficient to compare the direct, short-term financial cost of each resource. Each type of electricity generation resources provides its own advantages and disadvantages to society and to the grid, including environmental impacts ( Q10), greenhouse gas emissions ( Q11) and air pollution and human health impacts ( Q12). Some also have important economic, employment and regional development benefits, including energy independence, supporting local communities and businesses, and reducing vulnerability to unpredictable fossil fuel markets ( Q4). Renewables such as solar, wind and biomass are also scalable (i.e., can be added in small amounts to match system needs), can be built close to where they are most needed, and may be able to build system resilience to extreme events.
Ontario has had many legitimate public policy reasons for its supply mix choices, and it can take years to realize all the benefits that specific policies (such as the coal shutdown) will produce.
Factors influencing costs for nuclear, solar and windTable 9.3 summarizes the major reasons for cost increases for nuclear, solar and wind – the top 3 sources of generation cost increases between 2006 and 2016.
Table 9.3. Major reasons for cost increases from 2006 to 2016 (costs in nominal dollars).
Nuclear
Generating resource
Avg. price in 2006: 5¢/kWh in 2016: 7¢/kWh
2017 and beyond: ↑
Major reasons for cost increases
2016 Cost: $6,432 million (↑$2,186 million from 2006)
2006 2016 Delta2006→2016
Capacity 11,419 MW 12,978 MW + 1,559 MW
Capacity factor: 85-95%
Supply 84.2 TWh 91.7 TWh + 7.5 TWh
Refurbishments: Ontario’s nuclear plants are the biggest source (35%) of Ontario’s increased generation costs from 2006-2016. Cost increases to date have been driven by a contracted price to purchase power from refurbished units at Bruce Power. The Bruce A refurbishment of Units 1 and 2 (1,500 MW brought online in 2012 for an expected 30 years)40 was expected to cost $2.75 billion, but ended up costing over $4.8 billion dollars.41 Costs to electricity customers were contained because the vast majority of the Bruce refurbishment cost overruns (about $2 billion) were borne solely by Bruce Power owing to protections built into the contract.42
Ontario has had many legitimate public policy reasons for its supply mix choices.
139Environmental Commissioner of Ontario 2018 Energy Conservation Progress Report, Volume One
What do higher electricity costs pay for? Q9

The province is planning to refurbish 10 of 12 nuclear reactors at Bruce and Darlington between 2016 to 2033, and extend the life of the 6 operating Pickering reactors, some to 2022 and some to 2024. Proposed capital refurbishment costs are not yet reflected in rates. This long-term nuclear refurbishment project is forecast to increase nuclear generation costs to about 8.07¢/kWh (on average, in 2017 dollars) to 2064.43 These projects are expected to cost $25 billion dollars in total.44 However, as the Financial Accountability Officer noted in its 2017 report on nuclear refurbishments:
The scale and complexity of the Nuclear Refurbishment Plan combined with the history of nuclear project cost overruns suggests that there is significant risk to achieving the base case financial projections.45
Reliable and inflexible baseload: In 2016 nuclear provided a large percentage (64%) of Ontario’s electricity supply at a relatively low price to consumers. Nuclear power reactors have the ability to operate continuously for multiple years between maintenance outages making them highly reliable for baseload/round-the-clock power generation purposes. On the other hand, nuclear is inflexible. Only the Bruce nuclear station has the ability to be powered down in 300 MW chunks, and only with sufficient notice. As a result, nuclear is usually the last power source to be powered down (i.e., curtailed) in times of surplus.
Decommissioning and used fuel management: OPG is responsible for all nuclear decommissioning and used fuel management costs.46 OPG estimated that the decommissioning and used fuel management funds into which it pays would be valued at $18.198 billion dollars on January 1, 2018.47 Contributions to the fund are incorporated into the cost of generation.48
140
What do higher electricity costs pay for?
Making Connections: Straight Talk About Electricity in Ontario
Q9

Solar (PV)
Generating resource
Avg. price in 2006: n/a in 2016: 48¢/kWh
2017 and beyond: ↓
Major reasons for cost increases
2016 Cost: $1,694 million (↑$1.694 million from 2006)
2006 2016 Delta2006→2016
Capacity 0 MW 2,206 MW (1,926 MW embedded)
+ 2,206 MW
Overall capacity factor: 15% (summer peak: 30%, winter peak: 5%)
Supply 0 TWh 3.5 TWh + 3.5 TWh
SOLAR (PV) was the second biggest increase (27%) to Ontario’s generation costs between 2006 and 2016. Average prices remain high but have dropped over time as the solar industry has grown and matured.
Solar can provide small scale (e.g., rooftop) power close to where it is needed (a.k.a., ‘embedded’ or ‘distributed power’). Solar energy also helps reduce summer peak demand. Finally, it provides energy with limited environmental impacts compared to other generating sources.
Solar procurement: Starting in 2007 through 2014, Ontario’s first 473.7 MW of solar was procured by the province at 42¢/kWh via the non-competitive, long-term contracts offered under the Renewable Energy Standard Offer Program.49 In 2009 through 2017, Ontario procured solar primarily via its Feed-in-Tariff (FIT) (1,393.2 MW) and MicroFIT (229.3 MW) programs, with prices dropping over time (prices and project sizes listed in endnote).50 The largest share of solar capacity contracted in Ontario was within the 40-50¢/kWh range. Only 4% of solar capacity was contracted in the +80¢/kWh range, and about 25% of procured solar was below the 30¢/kWh range (see Figure 9.8).51 In 2016, the province also procured larger solar projects (>500 kW) via the competitive Large Renewable Procurement process. The average price for the 139.885 MW of solar procured was 15.67¢/kWh.52 Prices today for large-scale solar would likely be lower.
The changing prices of solar procurement in Ontario are outlined in Figure 9.9. Average prices are higher than these tariffs, due to inflation and adders for municipal/community/indigenous participation.
Contribution to embedded (i.e., local, small-scale) generation: Solar energy provides the most small-scale (e.g., rooftop), local electricity generation of any resource in Ontario. 87% of it is connected directly to the low-voltage distribution system ( Q18).53 This avoids line losses incurred from transmitting electricity over long distances.
141Environmental Commissioner of Ontario 2018 Energy Conservation Progress Report, Volume One
What do higher electricity costs pay for? Q9

Figure 9.8. Solar capacity procured under different price bins (Ontario, as of January 2018).
Source: Independent Electricity System Operator, information provided in response to ECO inquiry (31 January 2018).
Contribution to Summer Peaks: Embedded solar generation has reduced demand on the electricity grid during the hottest summer days.54 For each MW of solar procured, 30% is considered to reliably reduce summer grid peak demand,55 which now occurs later in the afternoon and is lower ( Q6).56
Figure 9.9. Changes in prices for selected Ontario solar procurement (2009-2017).
Note: Prices not adjusted for inflation. Only the largest and smallest category FIT projects, continuously offered from 2009-2017, are shown in this graph.
Source: Independent Electricity System Operator, 2017 FIT Price Review, Background Information (presentation, 31 August 2016) slide 22.
- 200 400 600 800
1,000 1,200 1,400 1,600 1,800
10+ - ≤
20
20+ - ≤
30
30+ - ≤
40
40+ - ≤
50
50+ - ≤
60
60+ - ≤
70
70+ - ≤
80
> 80+
Sola
r cap
acity
(MW
)
Price bin (¢/kWh)
0
10
20
30
40
50
60
70
80
90
FIT '09-'10 FIT '12 FIT '13 FIT '14 FIT '15 FIT '16/LRP FIT '17
(¢/k
Wh)
solar procurement program by year
Solar (rooftop, ≤6kW) Solar (non rooftop, >10 kW ≤500 kW) Solar (>500kW)
142
What do higher electricity costs pay for?
Making Connections: Straight Talk About Electricity in Ontario
Q9

Wind
Generating resource
Avg. price in 2006: 7.8¢/kWh in 2016: 15.8¢/kWh
2016 and beyond: ↓
Major reasons for cost increases
2016 Cost: $1,694 million (↑$1.694 million from 2006)
2006 2016 Delta2006→2016
Capacity 397 MW 4,457 MW (534
embedded)
4,060 MW
Overall capacity factor: 30% (winter peak 30%, summer peak 10%)
Supply 0.4 TWh 10.7 TWh 10.3 TWh
Wind was responsible for the third largest increase in generating costs between 2006 and 2016 at 26%. Like solar, it provides carbon-free electricity.
Procurement: From 2004 to 200857 Ontario procured wind energy via the competitive Renewable Energy Supply procurement (1,500 MW target).58 The average costs of the 1,509.4 MW of on-shore wind contracts signed under the program was 9.5¢/kWh.59 Following the Renewable Energy Supply program, the non-competitive Renewable Energy Standard Offer Program for projects under 10 MW, resulted in 284.9 MW of long-term wind contracts at 11¢/kWh.60 Starting in 2009, wind was procured through the FIT program at 13.5¢/kWh for on-shore wind, which in 2011 was reduced to 11.5 ¢/kWh.61 In 2013 the project sizes were capped at 500 kW and prices remained steady, but were later increased to 12.5¢/kWh (see endnote for further details).62 In total, 2,127 MW of wind was procured under FIT.63
In 2016, under the competitive Large Renewable Procurement program the province procured 299.5 MW of large wind projects (>500 kW) at an average cost of 8.59¢/kWh. The changing prices of wind procurement in Ontario are outlined in Figure 9.10. The amount of wind capacity procured under different price bins is shown in Figure 9.11. Average prices are higher than these tariffs, due to inflation, adders for municipal/community/indigenous participation, and the fact that some potential wind electricity is curtailed instead of being generated (for which generators are still compensated).
The average cost of wind (per unit of electricity produced) has risen over time, as more projects under the higher FIT prices have come into service, several years after the procurement.
143Environmental Commissioner of Ontario 2018 Energy Conservation Progress Report, Volume One
What do higher electricity costs pay for? Q9

Figure 9.10. Prices for Ontario wind procurements under RES, RESOP, FIT, and LRP (2004-2017).
Note: Prices not adjusted for inflation. Wind FIT prices to 2012 had no size limit, post 2012 had to be smaller than 500kW. RES projects had to be smaller than 10 MW. LRP projects had to be larger than 500kW.
Source: Independent Electricity System Operator, 2017 FIT Price Review, Background Information (presentation, 31 August 2016) slide 22; Auditor General, Electricity Sector-Renewable Energy Initiatives, 2011 Annual Report (Toronto: OAGO, 2011) at 103.
Figure 9.11. Wind capacity procured under different price bins (Ontario, as of January 2018).
Source: Independent Electricity System Operator, information provided in response to ECO inquiry (31 January 2018).
Winter peak: Of each MW of wind procured, 30% is considered by the IESO to reliably reduce winter peak demand.64
9.5
11
13.5
11.5 11.5 11.512.8 12.8 12.5
8.59
0
2
4
6
8
10
12
14
16
RES RESOP FIT'09-'10
FIT '12 FIT '13 FIT '14 FIT '15 FIT'16/LRP
FIT '17
(¢/k
Wh)
-
1,000
2,000
3,000
4,000
5,000
≤10 10+ - ≤20
Win
d ca
paci
ty (M
W)
Price bin (¢/kWh)
144
What do higher electricity costs pay for?
Making Connections: Straight Talk About Electricity in Ontario
Q9

Endnotes
1 According to the Bank of Canada’s “Inflation Calculator” online: <www.bankofcanada.ca/rates/related/inflation-calculator/>. [Accessed 13 March 2018]
2 Independent Electricity System Operator, “Module 1: State of the Electricity System, 10-Year Review” (presentation, August 2016) slide 40.
3 Net demand (including embedded generation, conservation savings, imports, minus exports) in 2006 was 151 TWh, net demand in 2016 was 142.9 TWh (-5.4%). (Independent Electricity System Operator, information provided in response to ECO inquiry (31 January 2018).)
4 The debt retirement charge was imposed to pay off stranded Ontario Hydro debt, due primarily to cost overruns in constructing nuclear plants. Paying off this debt added about seven tenths of a cent ($0.007) per kilowatt hour until March 31, 2018.
5 Provincial conservation program savings do not include the category “other influenced conservation” ( Q3) (Independent Electricity System Operator, information provided in response to ECO inquiry (January 2017, 31 January 2018, and 15 March 2018).
6 Ibid.
7 Independent Electricity System Operator, 2011-2014 Conservation Results Report (Toronto: IESO, 2015) at 10, online: <www.ieso.ca/-/media/files/ieso/document-library/conservation-reports/annual/conservation-results-report-2011-2014.pdf>.
8 Ontario Energy Board, Information provided in response to ECO Inquiry (17 January 2018).
9 However, participant cost to partake in conservation programs is not included in this assessment.
10 Ontario Energy Board, information provided in response to ECO inquiry (January 2018).
11 Ontario Energy Board, EB-2016-0160 Decision and Order (Toronto: OEB, 28 September 2017, revised 1 November 2017) at 26, online: <www.rds.oeb.ca/HPECMWebDrawer/Record/589028/File/document>.
12 Ontario Energy Board, EB-2016-0160 Decision (Toronto: OEB, 20 December 2017) at 1, online: <www.rds.oeb.ca/HPECMWebDrawer/Record/594507/File/document>; Canadian dollar inflation in 2017 was 1.83% (“Inflation calculator”, online: Bank of Canada <www.bankofcanada.ca/rates/related/inflation-calculator/>. [Accessed 13 March 2018].)
13 Electricity Conservation and Supply Task Force, Tough Choices: Addressing Ontario’s Power Needs, Final Report to the Minister (Toronto: Ministry of Energy, 9 January 2004) at 1; Independent Electricity System Operator, information provided in response to ECO inquiry (31 January 2018).
14 Total capacity in 2005: 30,838 MW (-6,434MW of coal = 24,404 MW). Total capacity in 2015: 38,887 MW. (Independent Electricity System Operator, information provided in response to ECO inquiry (31 January 2018)); Contributions of procured capacity to meeting winter and summer peak demand from Independent Electricity System Operator, “Module 4: Supply Outlook” (presentation: IESO, August 2016) slide 40 ( Q5).
15 “Other” spending increased by $26 million, and generation dropped from 0.9 to 0.7 TWh. Net exports increased by 8.7 TWh from 2006, costing the system an additional $68 million in lost potential revenue. (Independent Electricity System Operator, information provided in response to ECO inquiry (31 January 2018).)
16 “Ontario’s Electricity System–Frequently Asked Questions”, online: Ministry of Energy <www.energy.gov.on.ca/en/ontarios-electricity-system/ontarios-electricity-system-faqs/>. [Accessed 14 March 2018]
17 Environmental Commissioner of Ontario, Every Drop Counts, Annual Conservation Progress Report 2016/2017 (Volume One) (Toronto: ECO, May 2017) at Figure 6.2.
18 Independent Electricity System Operator, information provided in response to ECO inquiry (31 January 2018); There is also a certain small amount of wind curtailment required by turbine operators (at their own expense) as a result of the Renewable Energy Approvals Bat Guidelines, overnight, from July 15th to September 30th. This is not included in the adjusted cost of production. (Ministry of Environment and Climate Change, Wind Power and Bats: the Science and Policy Context in Ontario (presentation, 15 November 2017) at slide 12.)
19 Ontario Energy Board, Decision and Order EB-2016-0152, Ontario Power Generation Inc., Application for payment amounts for the period from January 1, 2017 to December 31, 2021 (Toronto: OEB, 28 December 2017) at 152-156.
20 About 50% of conservation program capital costs are covered by ratepayers, the remainder is covered by the participant (e.g., the business undertaking the conservation initiative). (see Textbox: Comparing the cost of conservation.)
21 In 2014 the Ministry of Energy discussed a proposal to change the treatment of conservation costs; however, it was not implemented. (Ministry of Energy, Conservation First, A Renewed Vision for Energy Conservation in Ontario (Toronto: Ministry of Energy, 2014) at 4.)
22 Mark Winfield & B MacWhirter, “Competing paradigms, Policy Windows and the Search for Sustainability in Ontario Electricity Policy” in G Albo and R McDermid, eds, Divided Province: Ontario in the Age of Neo-Liberalism (Toronto: University of Toronto Press, in peer review).
23 Independent Electricity System Operator, information provided in response to ECO inquiry (31 January 2018); Total procured from Office of the Office of the Auditor General of Ontario, 2011 Annual Report (Toronto: OAGO, Fall 2011) at 103.
24 Independent Electricity System Operator, News Release, “Ontario’s Feed-In Tariff Program Backgrounder” (16 December 2009); Ministry of Energy, Ontario’s Feed-in-Tariff Program, Two-Year Review Report (Toronto: Ministry of Energy, 19 March 2012) at 13 online: <www.energy.gov.on.ca/en/files/2011/10/FIT-Review-Report-en.pdf>.
25 Renewable Energy Policy Network for the 21st Century, Renewables Global Status Report: 2009 Update (Paris: REN21 Secretariat, 2009) at 18; Miguel Mendoca and David Jacobs, “Feed-in Tariffs Go Global: Policy in Practice” Renewable Energy World (17 September 2009), online: <www.renewableenergyworld.com/articles/print/volume-12/issue-4/solar-energy/feed-in-tariffs-go-global-policy-in-practice.html>.
26 Hans-Josef Fell, The shift from feed-in-tariffs to tenders is hindering the transformation of the global energy supply to renewable energies (Abu Dhabi: IRENA, July 2017) at 9-10, online: <energywatchgroup.org/wp-content/uploads/2018/01/2017-07-15-Policy_Paper_Feed-in_Tariff_Tenders.pdf>.
145Environmental Commissioner of Ontario 2018 Energy Conservation Progress Report, Volume One
What do higher electricity costs pay for? Q9
.
.
.
.
.
.
.
.
.
.
.
.
.
.
.
.
.
.
.
.
.
.
.
.
.
.

27 For example, the minister directed that 100 MW of the planned 200 MW to be awarded under FIT 2 be set aside for Aboriginal and community participation. (Renewable Energy Policy and Wind Generation in Ontario (Toronto: Ivey Business School, January 2017) at 4, online: <www.ivey.uwo.ca/cmsmedia/3775606/renewable-energy-policy-and-wind-generation-in-ontario.pdf>.)
28 Independent Electricity System Operator, fact check (March 2018).
29 Ministry of Energy, Ontario’s Feed-in-Tariff Program, Two-Year Review Report (Toronto: Ministry of Energy, 19 March 2012), online: <www.energy.gov.on.ca/en/files/2011/10/FIT-Review-Report-en.pdf>.
30 Renewable Energy Policy and Wind Generation in Ontario (Toronto: Ivey Business School, January 2017) at 3, online: <www.ivey.uwo.ca/cmsmedia/3775606/renewable-energy-policy-and-wind-generation-in-ontario.pdf>.
31 “The FIT laws in Vermont in the US and Nova Scotia in Canada, for example, required the FIT rates to be developed through highly transparent regulatory proceedings which relied heavily on public stakeholder participation in order to source model inputs. The models employed by Germany and Ontario to set their final FIT rates, by contrast, were not made available to the public.” (Wilson Rickerson et al., Feed-in Tariffs as a Policy Instrument for Promoting Renewable Energies and Green Economies in Developing Countries (Nairobi: UNEP, 2012) at 77); However, the Ontario Power Authority did conduct a two-month public consultation on the proposed initial FIT rates, and did revise them somewhat following that consultation.
32 Claire Kreycik et al., Innovative Feed-In Tariff Designs that Limit Policy Costs (Colorado: National Renewable Energy Laboratory, June 2011) at 18-19.
33 Directive from Ontario Ministry of Energy to Ontario Power Authority, Re: Renewable Energy Program (12 June 2013).
34 “Energy Procurement Programs and Contracts: Large Renewable Procurement”, online: IESO <www.ieso.ca/Sector%20Participants/Energy%20Procurement%20Programs%20and%20Contracts/Large%20Renewable%20Procurement>. [Accessed 14 March 2018]
35 The ratepayer costs from the relocated gas-fired plants in: •Sarnia (relocated from Mississauga) is $85 million, and •Napanee (relocated from Oakville) is $635-$775 million.
The Sarnia plant opened in 2017 and the Napanee plant is expected to open in 2018. (Auditor General of Ontario, Mississauga Power Plant Cancellation Costs (Toronto: OAGO, April 2013) at 7; Auditor General of Ontario, Oakville Power Plant Cancellation Costs (Toronto: OAGO, October 2013) at 7-8.
36 Ibid.
37 Given the maturity of the technology, the rate of cost decline is expected to be slower than it has been historically. (Independent Electricity System Operator, “Module 4: Supply Mix” (presentation, August 2016) slide 55.)
38 Solar PV costs are expected to continue to decrease, with industry projections suggesting an average annual price decline rate of 3%. By 2035, the LUEC for utility-scale solar in Ontario is expected to be 9-13¢/kWh. Smaller facilities may reach 15-23¢/kWh. (Independent Electricity System Operator, “Module 4: Supply Mix” (presentation, August 2016) slide 55.)
39 Includes the impact of Ontario’s carbon pricing system, based on the Settlement Price of Ontario’s last auction of 2017 (allowances at $17.38 /Tonne of CO2). (Independent Electricity System Operator, information provided in response to ECO inquiry (31 January 2018).)
40 John Cadham, The Canadian Nuclear Industry: Status and Prospects (Waterloo: Centre for International Governance, November 2009) at 6, Figure 2, online: <www.cigionline.org/sites/default/files/nuclear_energy_wp08.pdf>.
41 Financial Accountability Office of Ontario, Nuclear Refurbishment Report (Toronto: FAO, 21 November 2017) at 30.
42 Ministry of Energy, fact check (13 March 2018).
43 Financial Accountability Office of Ontario, Nuclear Refurbishment Report (Toronto: FAO, 21 November 2017) at 21.
44 Ibid.
45 Ibid, at 30.
46 “Assuring the Future”, online: Ontario Power Generation <www.opg.com/generating-power/nuclear/nuclear-waste-management/Pages/assuring-the-future.aspx>. [Accessed 10 March 2018]
47 Letter from Ontario Power Generation to Canadian Nuclear Safety Commission (4 August 2017) at 2.
48 Ontario Energy Board, In the matter of an application by Ontario Power Generation Inc., EB-2007-0905, Decision with reasons (Toronto: OEB, 3 November 2008) at 90-91.
49 Office of the Auditor General of Ontario, 2015 Annual Report: Electricity Power System, Planning (Toronto: OAGO, 2015) at 226; Prices from Glenn Zacher and Kurtis Reed, Renewable Energy Regimes in Canada (Association of Corporate Counsel, 8 December 2011) at 3, online: <www.acc.com/legalresources/quickcounsel/reric.cfm?makepdf=1>; Total procured from Independent Electricity System Operator, information provided in response to ECO inquiry (31 January 2018).
50 Independent Electricity System Operator, information provided in response to ECO inquiry (31 January 2018);
Feed-in-Tariff Program Pricing (¢/kWh)
Renewable Fuel Size tranches Sept 24, 2009 Aug 13, 2010 Apr 5, 2012 Aug 26, 2013 Jan 1, 2014 Sept 30, 2014/ Jan 1, 2016 Jan 1/ Jul 21, 2016 Jan 1, 2017
Solar PV
Rooftop
≤ 6 kW80.2 80.2 54.9 39.6 39.6 38.4
31.3 31.1
> 6kW ≤ 10 kW 29.4 28.8
> 10 ≤ 100 kW71.3 71.3
58.4 34.5 34.5 34.3 24.2 22.3
> 100 ≤ 250 kW53.9 32.9 32.9 31.6 22.5
20.7
> 250 ≤ 500 kW 63.5 63.5
> 500 kW 53.9 53.9 48.7 N/A N/A N/A N/A N/A
Solar PV
Non-Rooftop
≤ 10 kW 80.2 64.2 44.5 29.1 29.1 28.9 21.4 21.0
? 10 kW ≤ 500 kW
44.3 44.3
38.8 28.8 28.8 27.5 20.9 19.2
> 500 kw ≤ 5 MW 35.0N/A N/A N/A N/A N/A
> 5 MW 34.7
Source: Independent Electricity System Operator, “2017 FIT Price Review, Background Information” (presentation, 31 August 2016) slide 22.
What do higher electricity costs pay for?
Making Connections: Straight Talk About Electricity in Ontario
Q9
.
.
.
.
.
.
.
.
.
.
.
.
.
.
.
.
.
.
.
.
.
.
.
.
146

A further 300 MW of solar was procured under the Green Energy Investment Agreement. Based on Art.9.1(a) of the agreement it was likely procured between 29.5 ¢/kWh and the current FIT prices. (Amended and restated Green Energy Investment Agreement by and among Her Majesty the Queen in Right of Ontario as represented by the Minister of Energy and Korea Electric Power Corporation and Samsung C&T Corporation (20 June 2013), online: <www.ontla.on.ca/library/repository/mon/27006/323101.pdf>.
51. Independent Electricity System Operator, information provided in response to ECO inquiry (31 January 2018).
52. Independent Electricity System Operator, News Release, “IESO Announces Results of Competitive Bids for Large Renewable Projects” (10 March 2016), online <www.newswire.ca/news-releases/ieso-announces-results-of-competitive-bids-for-large-renewable-projects-571651871.html>.
53. Independent Electricity System Operator, “Module 1: State of the Electricity System, 10-Year Review” (presentation, August 2016) slide 8 and 19.
54. Independent Electricity System Operator, 18-month Outlook, from October 2017 to March 2019 (Toronto: IESO, 21 September 2017) at 11.
55. Independent Electricity System Operator, Ontario Planning Outlook (Toronto: IESO, 1 September 2016) at 12.
56. Independent Electricity System Operator, 18-month Outlook, from October 2017 to March 2019 (Toronto: IESO, 21 September 2017) at 11.
57. Ministry of Energy, Market Analysis of Ontario’s Renewable Energy Sector by Compass Renewable Energy Consulting Inc. (Toronto: Ministry of Energy, 30 June 2017) at 8, online: <www.ontarioenergyreport.ca/pdfs/COMPLETE%20FINAL_MOE%20Ontario%20Market%20Assessment_July%2020,%202017.pdf>.
58. Nic Rivers, Lessons Learned from a decade of promoting renewable energy in Ontario (Ottawa: Carleton University, 14 September 2015) at 1-2, online: <carleton.ca/ces/wp-content/uploads/ontario_renewables2.pdf>; Office of the Office of the Auditor General of Ontario, 2015 Annual Report (Toronto: OAGO, 2015) at 226.
59. Independent Electricity System Operator, information provided in response to ECO inquiry (31 January 2018); Total procured from Office of the Office of the Auditor General of Ontario, 2011 Annual Report (Toronto: OAGO, Fall 2011) at 103.
60. Ibid.
61. Independent Electricity System Operator, information provided in response to ECO inquiry (31 January 2018).
62.
Feed-in-Tariff Program Pricing (¢/kWh)
Renewable Fuel Size tranches Sept 24, 2009 Aug 13, 2010 Apr 5, 2012 Aug 26, 2013 Jan 1, 2014 Sept 30, 2014/ Jan 1, 2016 Jan 1/ Jul 21, 2016 Jan 1, 2017
Wind
On-shore ≤ 500 kW N/A N/A N/A 11.5 11.5 12.8 12.8 12.5
All sizes 13.5 11.5 N/A N/A N/A N/A N/A N/A
Source: Independent Electricity System Operator, “2017 FIT Price Review, Background Information” (presentation, 31 August 2016) slide 22.
63. Independent Electricity System Operator, information provided in response to ECO inquiry (31 January 2018); A further 968.4 MW of wind was procured under the Green Energy Investment Agreement. Based on Art.9.1(a) of the agreement it was likely procured between 10.5¢/kWh and the current FIT prices. (Amended and restated Green Energy Investment Agreement by and among Her Majesty the Queen in Right of Ontario as represented by the Minister of Energy and Korea Electric Power Corporation and Samsung C&T Corporation (20 June 2013), online: <www.ontla.on.ca/library/repository/mon/27006/323101.pdf>.)
64. Independent Electricity System Operator, Ontario Planning Outlook (Toronto: IESO, 1 September 2016) at 12.
What do higher electricity costs pay for? Q9
147Environmental Commissioner of Ontario 2018 Energy Conservation Progress Report, Volume One

2005
I M PAC T O N T H E E N V I R O N M E N T
Q U ES T I O N 10
What are the environmental impacts of Ontario’s electricity sources?
All electricity sources have some negative impacts, but low-carbon sources damage our natural environment less than global climate change. Only energy conservation is a benign method of meeting our energy needs.
Climate change is creating new ecological conditions, which will alter and reshuffle the world’s ecosystems and contribute to the continuing loss of much of Earth’s biodiversity. Ontario’s choice to minimize fossil fuels in its electricity system, and replace them with low-carbon electricity sources such as renewable electricity and nuclear power should, in the long-term, reduce damage to the environment.
Still, Ontario must assess and manage the negative environmental impacts of low-carbon sources of electricity, especially as the number of projects increases. Negative impacts on biodiversity can often be mitigated by smart operation and siting of electricity projects, away from areas of high value for natural heritage protection, including areas with species at risk. Specific concerns in Ontario include a weak approvals process for waterpower, no long-term depository for nuclear waste, the impact on some species from wind projects and their access roads, and the lack of consideration of the cumulative environmental impact of our electricity choices.

Contents
THE DETAILS . . . . . . . . . . . . . . . . . . . . . . . . . . . . . . . . . . . . . . . . . . . . . . . . . . . . . . . . . . . . . . . . . . 150
The consequences of climate change for our natural environment and the impact of fossil-fuelled generation . . . . . . . . . . . . . . . . . . . . . . . . . . . . . . . . . . . . . . . . . . . . . . . . . . . . . . . . . 150
How Ontario evaluates the environmental impact of electricity resources . . . . . . . . . . . . . . . . . 150
The Green Energy Act’s environmental review process for wind and solar projects . . . . . . . . . 151
Impacts of wind energy. . . . . . . . . . . . . . . . . . . . . . . . . . . . . . . . . . . . . . . . . . . . . . . . . . . . . . . . . . 153
Human health. . . . . . . . . . . . . . . . . . . . . . . . . . . . . . . . . . . . . . . . . . . . . . . . . . . . . . . . . . . . . . . . . 153
Birds and bats . . . . . . . . . . . . . . . . . . . . . . . . . . . . . . . . . . . . . . . . . . . . . . . . . . . . . . . . . . . . . . . . 153
Other environmental impacts . . . . . . . . . . . . . . . . . . . . . . . . . . . . . . . . . . . . . . . . . . . . . . . . . . . . . 154
Solar power . . . . . . . . . . . . . . . . . . . . . . . . . . . . . . . . . . . . . . . . . . . . . . . . . . . . . . . . . . . . . . . . . . . 155
Waterpower . . . . . . . . . . . . . . . . . . . . . . . . . . . . . . . . . . . . . . . . . . . . . . . . . . . . . . . . . . . . . . . . . . . 156
Recent Ontario hydropower development and the Class EA process . . . . . . . . . . . . . . . . . . . . . . . . 157
Conclusion. . . . . . . . . . . . . . . . . . . . . . . . . . . . . . . . . . . . . . . . . . . . . . . . . . . . . . . . . . . . . . . . . . . . 159
Endnotes . . . . . . . . . . . . . . . . . . . . . . . . . . . . . . . . . . . . . . . . . . . . . . . . . . . . . . . . . . . . . . . . . . . . . 160
149Environmental Commissioner of Ontario 2018 Energy Conservation Progress Report, Volume One
What are the environmental impacts of Ontario’s electricity sources? Q10

The details…
The consequences of climate change for our natural environment and the impact of fossil-fuelled generationThe long-term consequences of climate change will have a devastating impact not only on humans, but also on the natural environment. Changing patterns of temperature and rainfall may mean that the current geographic range of many species will no longer support them. Some species will be winners and see their ranges expand; others will be losers and at a higher risk of extinction. The ecosystems that exist today, such as Ontario’s temperate and boreal forests, will be reshuffled into new combinations of species. Increased extreme weather events, such as storms and drought, will bring ecosystem responses such as flooding and forest fires. These consequences will be felt both globally and within Ontario.
For these reasons, the ECO strongly believes that fossil-fuelled generation, including the gas-fired generation that operates in Ontario, is more harmful to the environment than other electricity sources. A sustainable electricity system can include fossil-fueled generation as at most a niche contributor, not a major source of electricity. In the long run, Ontario’s decarbonisation of the electricity system will reduce damage to the natural environment. The consequences of Ontario’s electricity supply choices in reducing greenhouse gas emissions are discussed in Q11.
However, climate change is not the only environmental consideration for our electricity mix. Even low-carbon electricity sources, including nuclear, wind, waterpower, and solar power, have their own environmental impacts, in materials procurement, in construction, in operations, and in the disposal of its wastes. In the transition to a low-carbon energy system, it is important to actively minimize these negative effects.
How Ontario evaluates the environmental impact of electricity resourcesOntario’s electricity planning framework does not explicitly compare the environmental trade-offs of different electricity resources, contrary to the ECO’s recommendations in our 2016 Long-Term Energy Plan report.1 Unwisely, there is no formal or public process to assess the cumulative environmental impact of Ontario’s electricity mix, or to guide that mix moving forward. In contrast, British Columbia’s electricity resource planning uses high-level metrics for impact to land (footprint of area affected by energy development), water (area of new reservoirs and length of river reaches affected by hydropower), and air (greenhouse gas emissions and criteria air contaminants), which can be compared across different possible combinations of electricity resources.2 Ontario only evaluates the environmental merits of individual projects on a site-specific basis, through the environmental review process specified for each technology (discussed further below).
Four low-carbon electricity sources (wind, solar, waterpower, and nuclear) play a major role in Ontario today. The environmental concerns with nuclear power are very different than with wind, solar, and waterpower. Most significant are the risk of a radioactive release from an operating plant, and dealing with the radioactive waste produced on an ongoing basis. Regulatory responsibility for managing the environmental impacts
In the long run, Ontario’s decarbonisation of the electricity system will reduce damage to the natural environment.
150 Making Connections: Straight Talk About Electricity in Ontario
Q10

The environmental concerns with nuclear power are very different than with wind, solar, and waterpower.
of nuclear power is primarily a federal responsibility. As nuclear refurbishment is currently a large component of Ontario’s planned electricity future, both the environmental and economic impacts of nuclear power are discussed in Q14.
Some of the key impacts of wind, solar, and waterpower are discussed briefly in this chapter, including Ontario-specific issues with approvals processes. Many relevant topics have been reviewed in more detail in previous ECO Environmental Protection Reports, including:
• the Renewable Energy Approval process for wind, solar, and bioenergy projects (2009/2010 report, sections 2.2 and 2.3; 2012/2013 report supplement, section 1.5)
• wind power rules to protect birds and bats (2011/2012 report, part 2, section 3.2), and
• impacts of waterpower on fish passage (2014/2015 report, section 4.6).
The Green Energy Act’s environmental review process for wind and solar projectsIn 2009, the Green Energy Act (GEA) established a new and distinct environmental approvals process for solar and wind (and also for bioenergy) renewable electricity technologies, known as the Renewable Energy Approval (REA). A single REA is issued by the Ministry of the Environment and Climate Change (MOECC), with input from other ministries as necessary. Projects that receive an REA are exempt from many other approval requirements, including the ability of municipalities to control the location of projects through the Planning Act.
191 renewable electricity projects have received REAs since 2011.3 (About half of the approximately 90 wind farms now operating in Ontario were approved under a different, earlier provincial approvals process).4
The REA process requires the proponent to submit extensive studies, including a natural heritage assessment to determine if natural features exist on or near the proposed project location, and if so, to evaluate their significance.5 Renewable energy projects are generally prohibited where natural heritage protection is a priority (e.g., near or within provincially significant wetlands, significant woodlands, significant wildlife habitat, areas of natural and scientific interest).6
Some of these prohibitions on development are absolute (e.g., development of a generation facility within a provincially significant southern wetland), but for others, development may be allowed if an
The MNRF and the MOECC have not comprehensively assessed how well these requirements have worked.
151Environmental Commissioner of Ontario 2018 Energy Conservation Progress Report, Volume One
What are the environmental impacts of Ontario’s electricity sources? Q10
environmental impact study is completed and the MOECC, with input from the Ministry of Natural Resources and Forestry (MNRF), determines that mitigation measures are sufficient.
The MNRF and the MOECC have not comprehensively assessed how well these requirements have worked in practice to safeguard natural heritage since the REA was introduced. The MNRF informs the ECO that it frequently recommends avoidance of natural heritage features during project planning and review of Natural Heritage Assessments. However, it does not track project modifications made in response to such advice, nor does it track how many REAs have eventually been granted at project locations where prohibitions on development would generally apply.7
Members of the public may appeal REAs to the Environmental Review Tribunal (ERT). Appeals can be launched on two grounds: that proceeding with the renewable energy project as approved, will result in:8
• serious harm to human health, and/or
• serious and irreversible harm to plant life, animal life or the natural environment.
This is the only environmental approval in Ontario that third parties (i.e., not just the approval holder) can appeal as of right, i.e., without the permission of the tribunal.9
The requirements of the REA process, including the right of appeal, have provided a forum to review the environmental impacts of specific renewable energy developments in a transparent manner. The ERT has required the MOECC to modify or cancel projects to prevent harm to the natural environment (as discussed below).
On the other hand, the very detailed REA process, plus the automatic right of appeal and related court proceedings, has meant that projects may face higher costs and longer timelines to bring a project into service, contrary to the original goal of the GEA, of streamlining the approvals process for renewable energy. This has particularly been an issue for wind projects, due to the high number of appeals.
Though some other jurisdictions have much higher levels of wind power than Ontario ( Q6), Ontario has been a hot spot of anti-wind litigation. Most Ontario wind project REAs have been appealed to the ERT and/or challenged in the courts, and most REA appeals to the ERT have been for wind projects, as shown in Figure 10.1.10 As of February 2018, there were 256 reported Canadian court and tribunal decisions on wind turbines, 170 of them in Ontario. This includes unsuccessful challenges to the Environmental Protection Act’s legal test for overturning REAs (s 142.1). The average development time for Ontario wind projects after receiving a contract rose from 29 months to 41 months, for projects contracted after the GEA came into force.11 The high costs and long delays also mean that most wind project proponents must have deep pockets, since costs must be paid upfront and no revenue is received until the project is in service and producing power.
Ontario has been a hot spot of anti-wind litigation.
152
What are the environmental impacts of Ontario’s electricity sources?
Making Connections: Straight Talk About Electricity in Ontario
Q10

The ERT has consistently dismissed appeals based on alleged harm to human health.
Wind turbines harm birds and bats.
Figure 10.1. Renewable Energy Approvals appealed to Environmental Review Tribunal, by technology.
Source: Ontario Ministry of the Environment and Climate Change, information provided to the ECO in response to ECO inquiry (27 December 2017); Environmental Review Tribunal, information provided to the ECO in response to ECO inquiry (20 February 2018).
Impacts of wind energyHuman health
Many reasons have been given for opposing wind farms, including a powerfully held belief that wind turbines are harmful to human health, often because of turbine noise. All of the 46 wind projects appealed to the ERT have used serious harm to human health as one of the grounds for appeal.12 After extensive expert evidence, and having considered numerous studies from around the globe, the ERT has consistently dismissed appeals based on alleged harm to human health. The sole exception was the Fairview wind project in Simcoe County, which was proposed to be located too close to the Collingwood airport, thus affecting aviation safety.
The noise impacts of wind on people are controlled through noise limits in the REAs, and through mandatory setbacks established by the Environmental Protection Act. Minimum setbacks for larger turbines are 550 metres from the nearest non-participating
“noise receptors” (dwellings that may be used as residences, or institutional buildings).13 Larger setbacks or additional noise study requirements apply in cases of turbines with higher sound levels or where multiple turbines are located close together.14
Birds and bats
Wind turbines harm birds and bats through collisions with turbines, and (in the case of bats), trauma caused by changes in air pressure near a turbine. To reduce these impacts, larger wind projects have special requirements in the REA process to identify and evaluate bird and bat habitat, and either relocate projects away from significant bird or bat habitat, or complete an environmental impact assessment that includes a mitigation plan to address negative impacts.
Projects are also required to conduct three years of post-construction monitoring for bird and bat mortality, with mitigation measures required if certain mortality thresholds are exceeded.15 Monitoring results are reported to MOECC and to the Wind Energy Bird & Bat Monitoring Database. The latest summary reports that each Ontario turbine, on average, is responsible for roughly 17 bat kills and 6 bird kills per year.16 With 2,465 turbines in operation at the end of 2016, this leads to a total estimate of roughly 42,000 bat kills and 15,000 bird kills annually by wind turbines. The ECO continues to recommend that wind turbines should not be permitted in Important Bird Areas.
62
115
14
46
7 1
Wind Solar Bioenergy
Number of Renewable Energy Approvals
Number of Appeals to Environmental Review Tribunal
153Environmental Commissioner of Ontario 2018 Energy Conservation Progress Report, Volume One
What are the environmental impacts of Ontario’s electricity sources? Q10

Wind turbines can harm birds or bats if sited or operated inappropriately.
Source: Government of Ontario.
The impact of wind turbines is of particular concern for bats. While there may be sites where turbine impacts on particular bird species are significant, in general, other causes of mortality (such as domestic cats and collisions with windows) are much higher than wind turbines for most birds.17 For bats, any additional mortality is cause for serious concern. Since the GEA was passed, bat populations have come under great threat from other factors, especially white-nose syndrome, which has caused significant population declines for hibernating bat species.18 The now endangered little brown bat accounts for about 9% of reported bat kills from wind turbines in Ontario.19
The MNRF reports that 17 Class 3 or 4 wind projects with an REA have detected bird or bat mortality levels that exceeded mortality thresholds. Twelve of
these wind projects have exceeded the bat mortality threshold (10 detected bat kills per turbine per year, averaged over all the turbines at a facility).20 These facilities are being “curtailed” from operating in conditions when bats are most active – when winds are 5.5 m/s or less, from sunset to sunrise from July 15th to September 30th. All of the nine projects that have completed at least one year of effectiveness monitoring after implementing curtailments saw the number of bat kills drop, with eight of the nine falling below the mortality threshold.21 The tradeoff is that this mitigation measure reduces wind projects’ ability to produce electricity at times when summer demand may be high. Nine projects are also investigating or taking steps to reduce their impact on birds.
More recent REAs have paid greater attention to impact on bats, with mitigation measures that are stricter than required by the MNRF’s Bats and Bat Habitats: Guidelines for Wind Power Projects. For the Amherst Island wind project, these measures include proactively turning off turbines at low wind speeds during times when bats are at most risk, and turning off turbines at higher speeds as well, if bat mortality is detected.
Substantial research is underway on ways to reduce bat and raptor mortality. This research could lead to further curtailments.
Other environmental impacts
Other environmental values can be damaged by the access roads to wind developments. In several cases, the ERT has amended or revoked REAs to avoid
For bats, any additional mortality is cause for serious concern.
154
What are the environmental impacts of Ontario’s electricity sources?
Making Connections: Straight Talk About Electricity in Ontario
Q10

Solar (photovoltaic) power is perhaps the most environmentally benign of our electricity generation options.
“serious and irreversible harm to plant life, animal life or the natural environment.” For example:
• the Settler’s Landing wind project in Kawartha Lakes was proposed for development in an area that would be (in part) on a significant woodland on the Oak Ridges Moraine. The ERT removed one turbine and an access road in order to limit damage to the woodland, and also required additional rehabilitation measures
• the Ostrander Point wind project in Prince Edward County had its REA revoked because its access road would have caused serious and irreversible harm to the local population of the threatened Blanding’s turtle, even though the MNRF had issued an “overall benefit” permit under the Endangered Species Act. This site was also in an Important Bird Area, and
• the White Pines wind project (also in Prince Edward County) had its REA amended (removing two-thirds of the turbines), also due to impact on Blanding’s turtle and the little brown bat.
Wind projects also use a large amount of concrete, and at end of life will require disposal of the large blades.
Solar powerSolar (photovoltaic) power is perhaps the most environmentally benign of our electricity generation options. Solar power has no direct emissions of pollutants to air or water, although it does use rare materials that may come from around the world. Noise is produced by the electrical inverters at solar farms, but is much less than from wind projects, and is generally not a major concern.22 Ground-mounted solar projects larger than 500 kilowatts are required to obtain a Renewable Energy Approval.23
Probably the greatest downside of solar farms is their relatively low energy density. The total amount of land that must be used to generate a unit of electricity (and may therefore be unavailable for other uses, such as wildlife habitat or food production) is larger for solar than for most other electricity resources. For example, the large solar farm in Kingston with a nameplate capacity of 100 megawatts (MW) will use 261 hectares (2.6 square kilometres) of land and 426,000 panels. To prevent solar farms from covering a large amount of good agricultural land, the Feed-in Tariff (FIT) program restricted development of ground-mounted solar projects on prime (soil class 1, 2, or 3) agricultural lands, and these prohibitions are proposed to continue under net metering.24
155Environmental Commissioner of Ontario 2018 Energy Conservation Progress Report, Volume One
What are the environmental impacts of Ontario’s electricity sources? Q10

Solar farms generate clean electricity but occupy a large land area (Enbridge solar farm in Sarnia).
Source: Enbridge.
Of course, solar facilities integrated with buildings and structures, such as rooftop projects, make complementary use of existing operations and do not require additional land; Ontario has recognized this as a benefit and has favoured rooftop solar in its renewable energy policies, through higher tariff rates and no requirement for an environmental approval.
WaterpowerIn contrast to wind and solar resources, waterpower usually depends on specific sites where large drops in river elevation allow for electricity production. There is little or no ability to mitigate negative environmental impacts by moving a project, so much of the environmental decision-making occurs at the site selection process.
Dams can be used to increase the height of a natural water drop and produce more electricity; if the water level behind the dam is allowed to rise and fall, then the dams can also serve as a form of electricity storage, producing power when it is needed the most. Unfortunately, the characteristics that make a development more valuable to the electricity system can make it more damaging from an ecological perspective. The higher a dam is, the farther upstream the aquatic environment is altered, and storage behind reservoirs leads to unnatural changes in water levels, flow rates, and river morphology (erosion and sedimentation).25 Hydroelectric stations and dams also pose a direct threat to fish and a barrier to fish migration, yet few Ontario waterpower facilities have fishways. Mitigation measures, such as maintaining minimum river flow levels, and using structures that reduce intake into turbines, can reduce environmental impacts.
156
What are the environmental impacts of Ontario’s electricity sources?
Making Connections: Straight Talk About Electricity in Ontario
Q10

Recent Ontario hydropower development and the Class EA process
The first round of the FIT program developed under the GEA awarded 57 contracts for small waterpower projects throughout the province, many on Crown land in northern Ontario. These projects did not include large new dams, however, they often were “run-of-river with modified peaking”26 – allowing for water storage (through headponds) on a shorter timescale (over the course of a day), and consequently altering water levels and flows. Hydro projects were designed this way because the FIT contracts provided higher prices for power delivered at peak time of day, to recognize the greater economic value of peaking power to the electricity system.
Unlike wind, solar, and biogas, the environmental approval process for most waterpower projects is a class Environmental Assessment (EA), led by the proponent.27 Class EAs are “intended for projects that are carried out routinely; and have predictable and mitigable effects to the environment.”28 The MOECC does not have a formal approval role in this process for individual projects, but does participate and review documentation submitted by the proponent to ensure that the requirements of the Class EA process have been completed.29 Class EAs do not provide an effective review of the site selection process.30
In the ECO’s opinion, this approach is not suitable for new waterpower projects, and the proponent-led model has been an inadequate form of environmental review. The most prominent example is Xeneca Power, a company that was initially awarded FIT contracts for 19 different sites. In an unusually scathing review of the completeness of Xeneca’s submission for one such project (“The Chute” on the Ivanhoe River), the MOECC raised many concerns, including: mid-stream changes to the project without adequate analysis of the environmental impacts and potential mitigation
measures, inadequate consultation, and lack of transparency.31 The MOECC concluded that the project was not planned in accordance with the requirements of the Class EA, and advised Xeneca to take additional actions, in effect, temporarily blocking the project from proceeding. Ultimately, Xeneca’s FIT contracts were terminated for all 19 proposed projects.
The Class EA also appears to have had limited success in meeting the objectives of developers in getting projects built on time and budget. Progress reports by the Ontario Waterpower Association have noted concerns with the high fixed costs of the environmental assessment process and the long timelines to move projects through the process.32 Despite these problems, the MOECC has indicated that it is not considering changes to the regulatory approval model for waterpower projects.33 In 2018, the Ontario Waterpower Association will be completing a five-year review of the Class EA, during which it will consider the efficiency and effectiveness of the Class EA planning process, assess new legislative requirements and evaluate best practices of direct relevance to waterpower projects.34
The environmental footprint of waterpower development is usually lower if it takes place at sites that have already been altered – for example, making use of dams that were built for other purposes (e.g., flood control, navigation), or sites where existing waterpower facilities exist, but opportunities exist to increase their electricity generation capacity (e.g., by upgrading to more efficient turbines). The largest hydro development in Ontario in recent years is Ontario Power Generation’s Lower Mattagami Project, which added 438 MW of new capacity through major upgrades at four existing waterpower stations.
157Environmental Commissioner of Ontario 2018 Energy Conservation Progress Report, Volume One
What are the environmental impacts of Ontario’s electricity sources? Q10

Multiple use of waterways for hydropower and navigation – Big Chute on the Trent-Severn Waterway.
Source: Ontario Power Generation.
Hydro procurements since the first round of the FIT program (the Hydroelectric Contract Incentive and the Hydroelectric Standard Offer Program) have focused on these opportunities to upgrade at sites of existing dams.35 This trend continued in the Large Renewable Procurement where all four hydro projects awarded contracts will be located on the Trent-Severn waterway, adjacent to already existing dams. The 2017 Long-Term Energy Plan mentions additional opportunities to get more from existing waterpower assets.
The environmental consequences of waterpower development are also a concern for imports from Quebec. The province of Quebec has engaged
in extensive landscape alteration through hydro development, building large dams that have turned free-flowing rivers into lakes and flooded thousands of kilometres of land. Hydro-Quebec continues to build dams on more remote rivers to produce hydroelectricity – the Romaine River on the north shore of the St. Lawrence being the most recent example. Hydro-Quebec’s current Strategic Plan indicates that it will determine its next major hydro project once the Romaine project is completed.36 This may occur regardless of Ontario’s actions, but it is also possible that an export contract to Ontario could help establish a business case for what might otherwise be an uneconomic project.
158
What are the environmental impacts of Ontario’s electricity sources?
Making Connections: Straight Talk About Electricity in Ontario
Q10

ConclusionOver the long term, Ontario’s shift to renewable electricity and nuclear power is an improvement over fossil fuelled-generation from an environmental perspective. However, given the scale of Ontario’s electricity use, even these low-carbon sources can cause harm, particularly if built in the wrong locations. For more on the environmental impacts of nuclear, see Q14. Energy conservation avoids the negative impacts of expanding our electricity infrastructure, and reduces the environmental footprint of Ontario’s electricity use, another reason that it should be given a high priority.
Even low-carbon sources can cause harm, particularly if built in the wrong locations.
159Environmental Commissioner of Ontario 2018 Energy Conservation Progress Report, Volume One
What are the environmental impacts of Ontario’s electricity sources? Q10

Endnotes
1 Environmental Commissioner of Ontario, Developing the 2017 Long-Term Energy Plan (Toronto: ECO, December 2016) at 15.
2 BC Hydro, Integrated Resource Plan (Vancouver: BC Hydro, 25 November 2013) at 6-65.
3 A complete up-to-date list of Renewable Energy Approvals can be found online: <www.ontario.ca/page/renewable-energy-projects-listing>. At the time of writing, two projects had been refused REAs while eight are currently marked as “application returned or withdrawn”.
4 The environmental screening process under O Reg 116/01 of the Environmental Assessment Act.
5 Specific requirements are described in: Ontario Ministry of Natural Resources, Natural Heritage Assessment Guide for Renewable Energy Projects, 2nd edition (Ontario: Queen’s Printer, 2012).
6 O Reg 359/09, s. 37-46.
7 Ontario Ministry of Natural Resources and Forestry, information provided to the ECO in response to ECO inquiry (12 January 2018).
8 Environmental Protection Act, s 142.1(3).
9 The Planning Act also has quite broad appeal provisions.
10 Environmental Review Tribunal, information provided to the ECO in response to ECO inquiry (20 February 2018).
11 Margaret Loudermilk, Renewable Energy Policy and Wind Generation in Ontario (Toronto: Ivey Foundation, January 2017) at 1. However, the report is not able to conclusively determine that the Renewable Energy Approval process is the reason for the longer development times.
12 Environmental Review Tribunal, information provided to the ECO in response to ECO inquiry (20 February 2018).
13 O Reg 359/09, s 54. Large turbines are those >50 kW, and with a sound level >102 dBA or height >70 metres. Further guidance is found in: Ontario Ministry of the Environment, Technical Guide to Renewable Energy Approvals (Ontario: Queen’s Printer, 2013) at 74.
14 O Reg 359/09, s 54-55. Ontario Ministry of the Environment, Technical Guide to Renewable Energy Approvals (Ontario: Queen’s Printer, 2013) at 77.
15 Ontario Ministry of Natural Resources, Bird and Bird Habitats: Guidelines for Wind Power Projects (Ontario: Queen’s Printer, 2011); Ontario Ministry of Natural Resources, Bats and Bat Habitats: Guidelines for Wind Power Projects (Ontario: Queen’s Printer, 2011); See Environmental Commissioner of Ontario, “New Wind Power Rules to Protect Birds and Bats” in Losing Our Touch, Annual Report 2011/2012 Part 2 (Toronto: ECO, October 2012) at 77 for a review of these documents.
16 Bird Studies Canada, Canadian Wind Energy Association, Environment Canada and Ontario Ministry of Natural Resources, Wind Energy Bird and Bat Monitoring Database Summary of the Findings from Post-construction Monitoring Reports (July 2017) at 37, online: <www.bsc-eoc.org/resources/wind/Jul2017_Wind_Database_Summary.pdf>.
17 “Save Bird Lives: Wind Turbines”, online: Nature Canada <naturecanada.ca/initiatives/save-bird-lives/wind-turbines/>. [Accessed 28 February 2018].
18 Environmental Commissioner of Ontario, “White-nose Syndrome: Tragedy of the Bats” in Small Steps Forward, Environmental Protection Report 2015/2016 Volume Two (Toronto: ECO, 2016).
19 Bird Studies Canada, Canadian Wind Energy Association, Environment Canada and Ontario Ministry of Natural Resources, Wind Energy Bird and Bat Monitoring Database Summary of the Findings from Post-construction Monitoring Reports (July 2017) at 18, online: <www.bsc-eoc.org/resources/wind/Jul2017_Wind_Database_Summary.pdf>.
20 The number detected will be less than the number actually killed. The Ontario-wide estimate of 17 bat kills per turbine per year is based on an upward correction of detected bat kills to account for this difference.
21 Ontario Ministry of Natural Resources and Forestry, information provided to the ECO in response to ECO inquiry (12 January 2018).
22 A noise study report is required for large (class 3) solar projects as part of the REA, but there are no mandatory setback distances as there are for large wind projects. Ontario Ministry of the Environment, Technical Guide to Renewable Energy Approvals (Ontario: Queen’s Printer, 2013) at 183.
23 Smaller ground-mounted solar projects between 10 kilowatts and 500 kilowatts are eligible for a streamlined approval through the Environmental Activity & Sector Registry. Roof-mounted projects of any size and ground-mounted solar projects <10 kilowatts do not require any form of environmental approval.
24 Environmental Registry Regulation Proposal #013-1916, Proposed New Regulation to be made under the Electricity Act, 1998 (28 November 2017).
25 The waterpower Class EA recognizes the importance of the water management regime (impact on water levels and flows) on aquatic ecology. Ontario Waterpower Association, Class Environmental Assessment for Waterpower Projects, 7th Edition (Ontario Waterpower Association: November 2017) at 21.
26 Ibid, at 83.
27 New facilities larger than 200 megawatts in capacity would need to undertake an individual Environmental Assessment.
28 Ontario Waterpower Association, Class Environmental Assessment for Waterpower Projects, 7th Edition (Ontario Waterpower Association, November 2017) at 11.
29 Ontario Ministry of the Environment and Climate Change, Ontario Waterpower Association, and Ontario Ministry of Natural Resources and Forestry, Roles and Responsibilities With Respect to the Class Environmental Assessment for Waterpower Projects Process (Toronto: MOECC, 2014) online: <www.owa.ca/wp-content/uploads/2017/01/Class-EA-Roles-Fact-Sheet-MOECC-OWA-MNRF.pdf>. The Ministry of the Environment and Climate Change is also required to consider “bump-up” requests (part II order requests) from the public as to whether a project should go through a more rigorous individual Environmental Assessment – however, the Ministry has never granted an part II order request for a waterpower project.
160
What are the environmental impacts of Ontario’s electricity sources?
Making Connections: Straight Talk About Electricity in Ontario
Q10
.
.
.
.
.
.
.
.
.
.
.
.
.
.
.
.
.
.
.
.
.
.
.
.
.
.
.
.
.

30 As the beds of most waterways are Crown land, the MNRF can influence the waterpower site selection process by determining whether to grant access to Crown land for potential waterpower development. Ontario Ministry of Natural Resources and Forestry, Renewable Energy on Crown Land Policy (10 February 2014), online: <dr6j45jk9xcmk.cloudfront.net/documents/2906/stdprod-095543.pdf>.
31 Letter from Ontario Ministry of the Environment and Climate Change to Xeneca Power Development (2 March 2012), online: <www.ontarioriversalliance.ca/wp-content/uploads/2014/07/MOEtoXeneca-TheChute-ER.pdf>.
32 Ontario Waterpower Association, Five Year Review, Class Environmental Assessment for Waterpower Projects (24 December 2013) at 2.
33 Ontario Ministry of the Environment and Climate Change, information provided to the ECO in response to ECO inquiry (27 December 2017).
34 Ontario Ministry of the Environment and Climate Change, information provided to the ECO in response to ECO inquiry (8 March 2017).
35 Subsequent rounds of FIT procurements open to all renewable energy sources have had only very minor participation from hydro projects (9 projects totalling 2.7 MW in FIT 4, 1 project of 60 kW in FIT 3, no waterpower projects in FIT 2 or FIT 5).
36 Hydro Quebec, Strategic Plan 2016-2020: Setting new sights with our clean energy (undated) at 10.
161Environmental Commissioner of Ontario 2018 Energy Conservation Progress Report, Volume One
What are the environmental impacts of Ontario’s electricity sources? Q10
.
.
.
.
.
.
.

2005
Q U ES T I O N 11
How much have the coal phase-out, renewable electricity, and conservation reduced greenhouse gas emissions?
From its highest emissions in 2000 until 2015, Ontario reduced electricity system greenhouse gas emissions by 85%.
This reduction took Ontario from 30% above Canada’s average electricity greenhouse gas (GHG) intensity per kilowatt hour (kWh) in 2000, to over 80% below it in 2015. Annual GHG emissions in Ontario’s electricity system were reduced by about 36 Mt CO2eq, the vast majority of Ontario and Canada’s economy-wide emissions reductions in these years.1
Around the world, decarbonizing the electricity supply is recognized as the essential first step in transitioning to a low-carbon economy. In this respect, Ontario is a North American leader.
I M PAC T O N T H E E N V I R O N M E N T
Contents
THE DETAILS . . . . . . . . . . . . . . . . . . . . . . . . . . . . . . . . . . . . . . . . . . . . . . . . . . . . . . . . . . . . . . . . . . 164
The decarbonisation of Ontario’s electricity supply . . . . . . . . . . . . . . . . . . . . . . . . . . . . . . . . . . . 164
Coal phase-out: not GHG emissions-free . . . . . . . . . . . . . . . . . . . . . . . . . . . . . . . . . . . . . . . . . . . 166
Life-cycle GHG emissions from Ontario’s electricity . . . . . . . . . . . . . . . . . . . . . . . . . . . . . . . . . . . . . 168
Alternative scenario: coal phase-out without conservation and renewables . . . . . . . . . . . . . . . . . . . 170
GHG emissions going forward . . . . . . . . . . . . . . . . . . . . . . . . . . . . . . . . . . . . . . . . . . . . . . . . . . . . 172
Endnotes . . . . . . . . . . . . . . . . . . . . . . . . . . . . . . . . . . . . . . . . . . . . . . . . . . . . . . . . . . . . . . . . . . . . . 174
163Environmental Commissioner of Ontario 2018 Energy Conservation Progress Report, Volume One
How much have the coal phase-out, renewable electricity,
and conservation reduced greenhouse gas emissions?Q11

The details…
The decarbonisation of Ontario’s electricity supplyBased on the most current official data (2015), greenhouse gas (GHG) emissions from Ontario’s electricity system have fallen by 80% since Ontario’s commitment to phase out coal (see Figures 11.1 and 11.2), and 85% since 2000 – the dirtiest year for Ontario’s electricity grid.2
GHG emissions from the electricity system made up only 4% of the province’s total emissions in 2015, compared to 16% in 2005.3 In 2017 natural gas, the only remaining fossil fuel in Ontario’s electricity system, made up less than 5% of Ontario’s electricity consumption, compared to about 15% in 2011 and 11% in 2015.4 Once the official emissions numbers for 2016 and 2017 are finalized, further reductions should be recorded due to the decline in natural gas-fired electricity generation.5 As a result, the sector is forecast to contribute only about 2% of Ontario’s GHG emissions in 2017.6
This downward trend in emissions can be attributed to:
• retiring all of Ontario’s coal-fired power plants (the firstplant closed in 2005, the last in 2014)7
• replacing coal-fired electricity generation with nuclear,renewables and natural gas
• reduced demand for electricity (due to conservationprograms and codes and standards, shifts in theeconomy, weather and price)8
• reducing Ontario’s reliance on natural gas for baseload(around-the clock) production in 2016 and 2017(discussed further below),9 and
• the declining gap between the highest and lowesthours of electricity demand in 2016 and 2017 (i.e.,more stable demand), resulting in less need to rampup production at natural gas-fired generation facilitiesto meet peak demand.10
Figure 11.1. Ontario’s greenhouse gas emissions by sector (2005-2015).
Note: Emissions data does not include lifecycle emissions. “Industrial processes” include emissions that are not related to energy.
Source: Environment and Climate Change Canada, National Inventory Report 1990-2015: Greenhouse Gas Sources and Sinks in Canada, Part 3 (Ottawa: ECCC, 2017) at Table A11-12.
Greenhouse gas emissions from Ontario’s electricity system have fallen by 85%.
Energy (transportation, buildings, industry, electricity)ElectricityIndustrial processesAgricultureWaste
2005
2015
164 Making Connections: Straight Talk About Electricity in Ontario
Q11

Figure 11.2. Ontario historical GHG emissions by economic sector relative to 1990 levels.
Source: Environment and Climate Change Canada, National Inventory Report 1990-2015: Greenhouse Gas Sources and Sinks in Canada, Part 3 (Ottawa: ECCC, 2017) Table A11-12, at 58.
The decarbonisation of Ontario’s electricity grid can also be measured by its emissions intensity – the amount of GHGs emitted per unit of electricity
produced. Using this metric, the emissions intensity of Ontario’s electricity has dropped by a factor of seven from 2000 to 2015, as shown in Figure 11.3.
Figure 11.3. Average annual carbon dioxide equivalent11 intensity of electricity generation (g CO2eq/kWh) in Ontario and the rest of Canada (2000, 2005, 2010 and 2015).
Note: The “Rest of Canada” estimates are calculated by the ECO based on a weighted (by electricity generation) average of provincial GHG emissions.
Source: Environment and Climate Change Canada, National Inventory Report 1990-2015: Greenhouse Gas Sources and Sinks in Canada, Part 3 (Ottawa: ECCC, 2017) Tables A13-1 through A13-14.
0%
50%
100%
150%
200%
1990 1995 2000 2005 2010 2015
Rela
tive
to 1
990
Transportation
Industry
Buildings
Agriculture
Waste
Electricity
0
50
100
150
200
250
300
350
2000
OntarioRest of Canada
2005 2010 2015
Emiss
ions
inte
nsity
of e
lect
ricity
gen
erat
ion
(g C
O2e
q/kW
h)
165Environmental Commissioner of Ontario 2018 Energy Conservation Progress Report, Volume One
How much have the coal phase-out, renewable electricity,
and conservation reduced greenhouse gas emissions?Q11

Coal phase-out: not GHG emissions-freeOntario’s coal plants were taken offline for public health as well as climate change reasons (see Q12). But, despite the Ontario government’s commitment to prioritize energy conservation and renewable electricity, the electricity supplied by coal-fired generation was not entirely replaced by these sources alone. As Q4 describes, nuclear and natural gas-fired generation made up a larger share of Ontario’s electricity supply mix in 2015 than they did a decade earlier (see Table 11.1 and Figures 11.4 and 11.5).
Figure 11.4. Ontario’s electricity generation, by resource (2005 vs. 2015).
Source: Independent Electricity System Operator, information provided to the ECO in response to ECO inquiry (31 January 2018).
Figure 11.5. Ontario’s electricity sector greenhouse gas emissions, by generating resource (2005 vs. 2015).
Note: Only operational GHG emissions are included in this graph, for lifecycle emissions see Table 11.4.
Source: Independent Electricity System Operator, information provided to the ECO in response to ECO inquiry (31 January 2018); Environment and Climate Change Canada, National Inventory Report 1990-2015: Greenhouse Gas Sources and Sinks in Canada, Part 3 (Ottawa: ECCC, 2017) at 99.
0
5
10
15
20
25
30
35
2005 2015
Mt C
O2e
q/ye
ar
Coal (~1.0 kg/kWh)Natural Gas (~0.4 kg/kWh)
Nuclear (~0 kg/kWh)
Hydro (~0 kg/kWh)Non-hydro renewables/Other (~0 kg/kWh)
0
20
40
60
80
100
120
140
160
2005 2015
TWh
Nuclear and natural gas-fired generation made up a larger share of Ontario’s electricity supply mix in 2015 than they did a decade earlier.
166
How much have the coal phase-out, renewable electricity,
and conservation reduced greenhouse gas emissions?
Making Connections: Straight Talk About Electricity in Ontario
Q11

Table 11.1. Changes in Ontario’s electricity generation and related greenhouse gas emissions (2005 vs. 2015).
ResourceOperational
GHG intensity* (g CO2eq/kWh)
2005 2015
Generation (TWh)
GHGs (Mt CO2eq)
Generation (TWh)
GHGs (Mt CO2eq)
Coal 965 29.3 28.2 0 0
Natural gas 425 11.9 5.1 15.5 6.6
Low-emitting Resources
(nuclear, hydro, wind, solar, bioenergy, other)
0** 114.8 0 144.7 0
Total 156 TWh 33.3 Mt 160.2 TWh 6.6 MT
* Based on an average GHG intensity of the most recent three years of plant operations in Ontario (2012-2014 for coal, and 2013-2015 fornatural gas), as reported in Canada’s National Inventory Report to the United Nations.
** These resources do not emit greenhouse gases during their operational life (with the exception of bioenergy, whose emissions are considered to be carbon-neutral), but have emissions at other stages of their life-cycle, as discussed in the textbox ”Life-cycle GHG emissions from Ontario’s electricity”.
Source: Independent Electricity System Operator, information provided to the ECO in response to ECO inquiry (31 January 2018); Environment and Climate Change Canada, National Inventory Report 1990-2015: Greenhouse Gas Sources and Sinks in Canada, Part 3 (Ottawa: ECCC, 2017) at 99.
From 2005 to 2015, Ontario’s natural gas-fired electricity generation capacity was doubled (although the actual amount of electricity produced from natural gas has risen much less), in part to replace coal generation when responding to short term peaks and valleys of electricity demand. This has also helped balance fluctuations in wind and solar electricity production.
Although natural gas is a fossil fuel, it emits less GHG emissions than coal while it is being burned for fuel. This is particularly true in Ontario, where natural gas electricity generation occurs primarily at combined cycle facilities, which are more efficient (in terms of energy use and GHG emissions) than simple cycle natural gas plants (see Figure 11.6).12
Figure 11.6. Average operational GHG emissions intensity of natural gas (combined cycle natural gas, CCNG, and simple cycle natural gas, SCNG) as well as coal plants.
Sources: Average GHG intensity of coal is the average of the final three years of plant operations in Ontario (2012-2014) (Environment and Climate Change Canada, National Inventory Report 1990-2015: Greenhouse Gas Sources and Sinks in Canada, Part 3 (Ottawa: ECCC, 2017) at 99); for natural gas plants, the averages are from: EDC Associates Ltd., Trends in GHG Emissions in the Alberta Electricity Market (Independent Power Producers Society of Alberta, 2 May 2013) at 8.13
Note: ( )
( )
0
200
400
600
800
1000
1200
Avg. GHG intensity
g C
O2e
q/kw
h
CCNG SCNG Coal
167Environmental Commissioner of Ontario 2018 Energy Conservation Progress Report, Volume One
How much have the coal phase-out, renewable electricity,
and conservation reduced greenhouse gas emissions?Q11

However, the entire life-cycle of natural gas-fired electricity may produce only slightly lower GHG emissions than coal if upstream leakage levels are high (see textbox “Life-cycle GHG emissions from Ontario’s electricity”). Ideally, the electricity grid will come to rely less and less on natural gas for peaking power, and more on alternative non-emitting sources, such as storage and demand response.14
Life-cycle GHG emissions from Ontario’s electricity
The federal government’s reporting of GHG emissions from the electricity sector only captures the direct operation of electricity generation facilities.15 The report leaves out the potentially significant GHGs associated with other stages of a facility’s life-cycle, such as the upstream emissions from fossil fuel extraction, or the downstream emissions for waste disposal.16
Taking the full life-cycle into account, all methods of generating electricity produce some amount of GHG emissions. For solar, wind, nuclear and hydro, the life-cycle emissions are negligible, but for natural gas-fired generation, the added emissions are substantial (see Table 11.2). Possible ranges of life-cycle emissions for natural gas-fired generation are described in more detail in Table 11.3.
Table 11.2. Life-cycle emissions of Ontario’s electricity-generating energy sources using a 100-year global warming potential.17
Source of electricity
Emissions (g CO2eq/kWh)
OperationLife-cycle(excl. operation) Life-cycle
Coal 965 102 1,067
Hydro 0 16 16
Nuclear 0 35 35
Solar PV 0 41 41
Wind 0 11 11
Natural Gas 425 ≈130 ≈550
Note: The emissions for all electrical sources use a 100-year global warming potential, which underestimates the impact of natural gas. For assumptions related to operational GHG intensity, see Table 11.1, for natural gas life-cycle emissions, see Figure 11.7.
Source: See endnote.18
Natural gas-fired electricity may produce only slightly lower GHG emissions than coal if upstream leakage levels are high.
168
How much have the coal phase-out, renewable electricity,
and conservation reduced greenhouse gas emissions?
Making Connections: Straight Talk About Electricity in Ontario
Q11

The natural gas figures displayed in Table 11.2 do not reflect the considerable uncertainty of emissions from this electricity source. Possible ranges of life-cycle emissions for natural gas are illustrated in Figure 11.7. Methane is the main component of natural gas and a particularly potent GHG. Thus, seemingly small leaks from natural gas wells, pipelines and other infrastructure can have major impacts on the GHG emissions of natural gas-fired generation, as discussed in Chapter 6 of the ECO’s 2017 Greenhouse Gas Progress Report. Leakage rates are also uncertain (many are not measured), and variable (from one well or pipeline to another).
The global warming potential (GWP) describes a GHG’s warming impact on the planet compared to the same amount of carbon dioxide, averaged over a certain period of years (often 100 years). Methane has a GWP of 34 (i.e., it is 34 times more potent that the same amount of carbon dioxide) when methane’s impact is averaged over 100 years. (This is called its 100-year GWP). As the ECO explained in Chapter 3 of the 2016 Greenhouse Gas Progress Report, methane’s potency over the short term is more important, as it is only in the atmosphere for 12.6 years, resulting in a much higher 20-year GWP of 86.19 The 100-year GWP used by Canada’s national emissions inventory (based on United Nations requirements) and by the provincial cap and trade program (based on Western Climate Initiative requirements) consistently underplay the importance of methane in the next 10 to 20 years.
In Figure 11.7 we compare (1) life-cycle emission estimates using a range of upstream leakage rates based on credible datasets, and (2) 20- and 100-year global warming potentials.
Although an upstream leakage rate of about 1.2% has been used as a default assumption for the natural gas supplied in Ontario,20 this rate is uncertain. A 2.65% leakage rate is a plausible global mean leakage rate from the natural gas supply chain.21 At the 2.65% level, using a 20-year GWP, the life-cycle impacts from natural gas power production are almost double the level of its operational emissions. Nevertheless, these life-cycle emissions are still less than the life-cycle emissions from coal. A 5.5% upstream leakage rate is at the upper boundary of the range considered plausible.22 An overall leakage rate of about 6% would be required for natural gas power production life-cycle emissions to exceed those of coal plants.
Figure 11.7. The effect of upstream natural gas leakage rates on the life-cycle emissions of natural gas-fired electricity generation plants relative to coal-fired power.
Note: Due to the substantial uncertainty associated with the leakage rates, these estimates may not be representative of Ontario conditions. The emissions estimates were generated using ECO models based on Ontario, U.S. and global data.23 The GWP for methane applied in the Intergovernmental Panel on Climate Change’s (IPCC’s) Fourth Assessment Report (i.e., 25 times CO2 over a 100-year time horizon) has been converted to the GWP applied in the IPCC Fifth Assessment Report (i.e., 86 times CO2 over a 20-year time horizon). See Table 11.1 for natural gas operational GHG intensity. Potential emissions from methane leakage at the natural gas power plant itself are not included.24
Source: See endnote.25
0
200
400
600
800
1000
1200
1400
Life
-cyc
le G
HG
em
issio
ns
(g C
O2e
q/kW
h)
100-yr GWP
20-yr GWP
Natural Gas(1.2% leakage rate)
Natural Gas(2.65% leakage rate)
Coal
169Environmental Commissioner of Ontario 2018 Energy Conservation Progress Report, Volume One
How much have the coal phase-out, renewable electricity,
and conservation reduced greenhouse gas emissions?Q11

Despite an almost 100% increase in natural gas-fired electricity generation capacity on Ontario’s electricity grid between 2005 and 2015, actual electricity production from natural gas (and, in turn, related operating GHG emissions) only increased by about 20%.26 This limited demand for available natural gas-fired electricity generation capacity is because significant amounts of other new resources (nuclear, renewables and conservation) had also been added to the grid over the same time period and electricity demand was lower than expected ( Q3).
From 2015 to 2017, electricity production from natural gas decreased by almost 70% (about 9.5 TWh).27 This reduction is due primarily to an overall reduction in electricity demand (about 9 TWh), as well as:
• the expiry of some contracts for older non-utility natural gas generators that encouraged 24-hour electricity production, and the renegotiation of others
with a focus instead on providing dispatchable power28
• flatter demand, and
• other cleaner resources (including conservation) displacing gas.29
The ECO’s analysis of IESO data suggests that a major contributor to the drop in natural gas generation from 2015 to 2017 is lower reliance on gas-fired generation during hours of low electricity demand. Gas-fired generation fell by 79% during the bottom 200 hours of system demand, but only by 44% in the top 200 hours of demand.30
Alternative scenario: coal phase-out without conservation and renewables
What would Ontario’s electricity sector GHG emissions have been in 2015 if Ontario had closed the coal plants but not invested in conservation programs and renewables?
The electricity Ontario produces from non-hydro renewable electricity sources and the reduced electricity demand that results from conservation initiatives would probably have come instead from natural gas-fired generation (the least expensive alternative at current natural gas prices).31
Figures 11.8 and 11.9 outline two alternative electricity generation scenarios and their related GHG impacts. Two options are shown to incorporate uncertainty about whether Ontario would continue exporting electricity (Ontario is currently a large net exporter of electricity ( Q7), mostly to Michigan and New York.32 The “2015 Alternative” scenario assumes that net exports are unchanged from their actual 2015 levels. We also include a scenario (far right bar) that assumes net exports would be zero, meaning much less natural gas-fired electricity generation would be needed overall. The real answer is likely somewhere in between.33
From 2015 to 2017, electricity production from natural gas decreased by almost 70%.
170
How much have the coal phase-out, renewable electricity,
and conservation reduced greenhouse gas emissions?
Making Connections: Straight Talk About Electricity in Ontario
Q11

Figure 11.8. Three Ontario 2015 electricity generation scenarios: (1) the actual mix; (2) natural gas displaces all conservation/renewables established post-2005, without any net exports; and (3) natural gas displaces all conservation/renewables, but with net export levels remaining at actual 2015 levels.
Note: Assumptions for alternative scenarios: - no conservation from provincially-funded programs or provincial codes and standards - no non-hydro renewables - net exports – no net exports at all (middle bar), or stay the same as in 2015 (16.8 TWh, right bar), and - production from nuclear and hydro/other stays constant across all scenarios.
Source: Independent Electricity System Operator, information provided to the ECO in response to ECO inquiry (31 January 2018, and in 2017).
Figure 11.9. GHGs from three Ontario 2015 electricity generation mix scenarios: (1) the actual mix; (2) natural gas displaces all conservation/renewables established post-2005, without any net exports; and (3) natural gas displaces all conservation/renewables, but with net export levels remaining at actual 2015 levels.
Note: See Table 11.1 for operational GHG intensity sources. Life-cycle emissions factors for natural gas are those illustrated in Figure 11.7 and use a 1.2% leakage assumption.
92.3 92.3 92.3
38.9 38.9 38.9
15.5 22.539.313.5
0
20
40
60
80
100
120
140
160
180
2015 actualgeneration
2015 alternative(no net exports)
2015 alternative(with exports)
Gen
erat
ion
(inc
l. ne
t exp
orts
, TW
h/yr
)
conservationnon-hydro renewablesnatural gashydro/othernuclear
10
0
5
10
15
20
25
30
35
2015 actualgeneration
Natural gas replacingrenewables and
conservation
Natural gas replacingrenewables and
conservation
GH
G e
miss
ions
(MT
CO
2eq)
Operational GHG emissions
Life-cycle GHG emissions (100-yr GWP)
Life-cycle GHG emissions(20-yr GWP)
Default
Continued net exports
No net exports
+100%
+130%
+150%+40%
+30%
+50%
171Environmental Commissioner of Ontario 2018 Energy Conservation Progress Report, Volume One
How much have the coal phase-out, renewable electricity,
and conservation reduced greenhouse gas emissions?Q11

The simplistic alternative 2015 generation scenarios presented above show that Ontario’s electricity sector emissions would have been lower than 2005 levels even without increased investments in conservation and non-hydro renewables. 2005 electricity operational GHG emissions were about 32 Mt, and in 2015 they were about 7 Mt. The natural gas only scenario would have resulted in about 10-17 Mt of operational GHG emissions in 2015, depending on the assumptions about exports.
Ontario’s use of conservation programs and renewable electricity generation sources saved the province an additional 3-10 Mt of GHG emissions during the operation of the facilities alone, as
compared to relying on natural gas alone. If entire life-cycles of electricity generation facilities are considered, then the emissions reductions are even greater, at 4 to 15 Mt (20-yr GWP) or 4 to 13 Mt (100-yr GWP).
What Figure 11.9 does not capture is that the GHG emissions and air pollution would rise in other jurisdictions if Ontario stopped exporting electricity. Both Michigan and New York’s electricity systems have much higher emissions intensities than Ontario due to the use of coal- or gas-fired electricity generating facilities. Ontario’s exports reduce the use of these fossil-fuelled generation plants.
GHG emissions going forwardBecause Ontario has already phased out coal plants and reduced its reliance on natural gas-fired electricity generation, opportunities to further reduce GHG emissions from the electricity system are hard to find. Going forward, the greater opportunity for GHG reductions in Ontario is fuel switching away from fossil fuel use outside the electricity system (i.e., the transportation, building and industrial sectors) to conservation or low-carbon electricity, as discussed in
Q15.
Electricity demand in Ontario continues to fluctuate due to daily and seasonal shifts, as a result a certain amount of flexible capacity is necessary to balance the grid, particularly during extremely hot and cold times of the year (high temperatures will be exacerbated by climate change). Figure 11.10 highlights how, on a hot summer day Ontario’s natural gas generators are turned on primarily to meet peak air conditioning demand.
Going forward, the greater opportunity for GHG reductions is fuel switching from transportation, building and industrial sectors to conservation or low-carbon electricity.
172
How much have the coal phase-out, renewable electricity,
and conservation reduced greenhouse gas emissions?
Making Connections: Straight Talk About Electricity in Ontario
Q11

Figure 11.10. Ontario’s hourly electricity demand and natural gas generation (4 August 2016).
Note: Natural gas generation captures most transmission-level natural gas generation in Ontario. Neither category captures embedded generation. Most embedded generation in Ontario is solar, which has reduced daily summer peaks.
Source: “Data Directory, Generator Output and Capability” (for natural gas generation) and “Data Directory, Ontario and Market Demand” (for Ontario demand), both online: Independent Electricity System Operator <www.ieso.ca/en/power-data/data-directory>.
Until sufficient amounts of other forms of low-emission peak management (i.e., resources that can reliably be turned on or off quickly to respond to shifts in electricity demand) are procured (e.g., grid-level battery storage, pumped storage hydroelectricity, ceramic brick heat storage, and/or electric vehicle storage), some emissions from natural gas peaking plants will be unavoidable.
However, natural gas emissions can be kept to a minimum, by both stabilizing and reducing electricity demand in the hours when natural gas generation is needed (roughly 17% of hours in 2017, see Q19).35
Natural gas emissions can also be lowered by reducing upstream methane leaks and by maximizing the amount of natural gas produced from renewable sources, including power-to-gas from renewable electricity.36 Future opportunities to better balance supply and demand with limited GHG emissions are explored in Q16.
0
5000
10000
15000
20000
25000
1 3 5 7 9 11 13 15 17 19 21 23
Elec
trici
ty d
eman
d (M
W)
4 August 2016 (hours)
Ontario demand
Natural gas generation
Natural gas emissions can be kept to a minimum.
173Environmental Commissioner of Ontario 2018 Energy Conservation Progress Report, Volume One
How much have the coal phase-out, renewable electricity,
and conservation reduced greenhouse gas emissions?Q11

Endnotes
1 Total provincial GHG emissions were 211 Mt in 2000 (Environment and Climate Change Canada, National Inventory Report 1990-2013: Greenhouse Gas Sources and Sinks in Canada, Part 3 (Ottawa: ECCC, 2015) Table A10-12). Ontario GHG emissions were 166 Mt in 2015, falling by 45 Mt since 2000. Canadian annual emissions fell by 16 Mt between 2005 and 2015, from 738 Mt to 722 Mt (Environment and Climate Change Canada, National Inventory Report 1990-2015: Greenhouse Gas Sources and Sinks in Canada, Part 1 (Ottawa: ECCC, 2017), Table 2.2 and Part 3, Table 11-12).
2 From 41.9 Mt in 2000, to 32.3 Mt in 2005, to 6.2 Mt in 2015. (Environment and Climate Change Canada, National Inventory Report 1990-2015: Greenhouse Gas Sources and Sinks in Canada, Part 3 (Ottawa: ECCC, 2017) Table A13-7.)
3 Environment and Climate Change Canada, National Inventory Report 1990-2015: Greenhouse Gas Sources and Sinks in Canada, Part 3 (Ottawa: ECCC, 2017) at Tables A11-12.
4 According to IESO, natural gas generation reduced from 15.5 TWh in 2015, to 12.9 TWh in 2016, to 5.9 TWh in 2017 (a 62% total reduction). (Independent Electricity System Operator, information provided to the ECO in response to ECO inquiry (February 2018).
5 Ibid.
6 Ministry of Energy, Ontario’s Long-Term Energy Plan 2017: Delivering Fairness and Choice (Toronto: Ministry of Energy, 26 October 2016) at 109.
7 Beginning in 2001 with a regulation requiring the Lakeview coal plant shutdown by 2005, and followed in 2007 with legislation requiring the 4 remaining coal plants to close by 2014.
8 From 147 TWh grid demand in 2000 to 137 TWh grid demand in 2016 (“Demand Overview: Historical Demand”, online: Independent Electricity System Operator <www.ieso.ca/power-data/demand-overview/historical-demand>); About 10 TWh of electricity demand was reduced by conservation efforts in Ontario in 2015, due to publicly funded conservation programs and codes and standards (Independent Electricity System Operator, information provided to the ECO in response to ECO inquiry (31 January 2018)).
9 As of December 2015, MENG has had a policy not to extend any expiring baseload natural gas contracts beyond their current term. (Directive from Ontario Ministry of Energy to the Independent Electricity System Operator, Re: Non-Utility Generation Projects […] (14 December 2015)). Several plants have or will soon come off-line as contracts have expired. In addition, in December 2016 the IESO renegotiated five natural gas plant contracts, which were contracted for baseload generation. The renegotiated contracts provide for “enhanced dispatchability” for the remainder of their contract term (Independent Electricity System Operator, information provided to the ECO in response to ECO inquiry (22 December 2017)). The fact that natural gas use has declined by about 79% in the bottom hours shows that it is being used less to supply baseload (see endnote 30). (“Data Directory: Generator Output and Capability reports (annual, 2015-2017)”, online: Independent Electricity System Operator <www.ieso.ca/power-data/data-directory>).
10 Independent Electricity System Operator, information provided to the ECO in response to ECO inquiry (22 December 2017); “Data Directory: Generator Output and Capability reports (annual, 2015-2017)”, online: Independent Electricity System Operator <www.ieso.ca/power-data/data-directory>.
11 “Carbon dioxide equivalent is a measure used to compare the emissions from various greenhouse gases based upon their global warming potential. For example, the global warming potential for methane over 100 years is 21. This means that emissions of one million metric tons of methane is equivalent to emissions of 21 million metric tons of carbon dioxide.” (Per the “Glossary of Statistical Terms”, online: Organisation for Economic Co-operation and Development <stats.oecd.org/glossary/detail.asp?ID=285>. Note that the estimated global warming potential of methane over 100 years has been revised to 34, according to the Intergovernmental Panel on Climate Change (IPCC) Working Group 1 report from 2013 (G. Myhre et al. Anthropogenic and Natural Radiative Forcing. In: Climate Change 2013: The Physical Science Basis. Contribution of Working Group I to the Fifth Assessment Report of the Intergovernmental Panel on Climate Change (Cambridge, United Kingdom and New York, NY, USA: Cambridge University Press 2013) at 714.)
12 Ontario Power Generation, Greenhouse Gas Emissions Associated with Various Methods of Power Generation in Ontario by Intrinsik (Toronto: OPG, October 2016) at Table 3-3, online: <www.opg.com/darlington-refurbishment/Documents/IntrinsikReport_GHG_OntarioPower.pdf>; However, combined cycle plants take longer to ramp up and down than simple cycle plants, and when operating at lower capacity levels, use more energy and produce more emissions per unit of energy generated than when operating at higher capacities. (M.A. Gonzales-Salazar et al., “Review of the Operational Flexibility and emissions of gas- and coal-fired power plants in a future with growing renewables” (2018) 8 Renewable and Sustainable Energy Reviews 1497 at 199, Table 2, Figures 8, 11 and 12.)
13 The figures from the Alberta report are supported by M.A. Gonzales-Salazar et al., “Review of the Operational Flexibility and emissions of gas- and coal-fired power plants in a future with growing renewables” (2018) 8 Renewable and Sustainable Energy Reviews 1497 at Figures 11 and 12.
14 California is already working towards replacing natural gas as a source of peaking power with batteries or other non-fossil fuel resources. (Mark Chediak, “California Regulators Direct PG&E to Prioritize Storage for Peak Demand” (12 January 2018) Renewable Energy World, online: <www.renewableenergyworld.com/articles/2018/01/california-regulators-direct-pg-e-to-prioritize-storage-for-peak-demand.html>.)
15 These other emissions, should they originate from Canada, would be reported elsewhere in the national GHG inventory.
16 The upstream stages include the production and transportation of infrastructure, equipment and fuels, as well as the construction and installation processes. The downstream stages include decommissioning and waste disposal. The ECO has recommended that life-cycle GHG emissions be incorporated into all government procurement decisions (see Environmental Commissioner of Ontario, “8. Low-Carbon Procurement” in Ontario’s Climate Act From Plan to Progress, Annual Greenhouse Gas Progress Report 2017 (Toronto: ECO, January 2018)). In its 2017 Long-Term Infrastructure Plan, the government recently took a positive step in this direction by mandating the consideration of life-cycle environmental impacts for all major infrastructure project procurement decisions by mid-2020. (Ontario Ministry of Infrastructure, Building Better Lives: Ontario’s Long-Term Infrastructure Plan 2017 (Toronto: Ministry of Infrastructure, 2017) at 26.)
.
.
.
.
.
.
.
.
.
.
.
.
.
.
.
.
174
How much have the coal phase-out, renewable electricity,
and conservation reduced greenhouse gas emissions?
Making Connections: Straight Talk About Electricity in Ontario
Q11
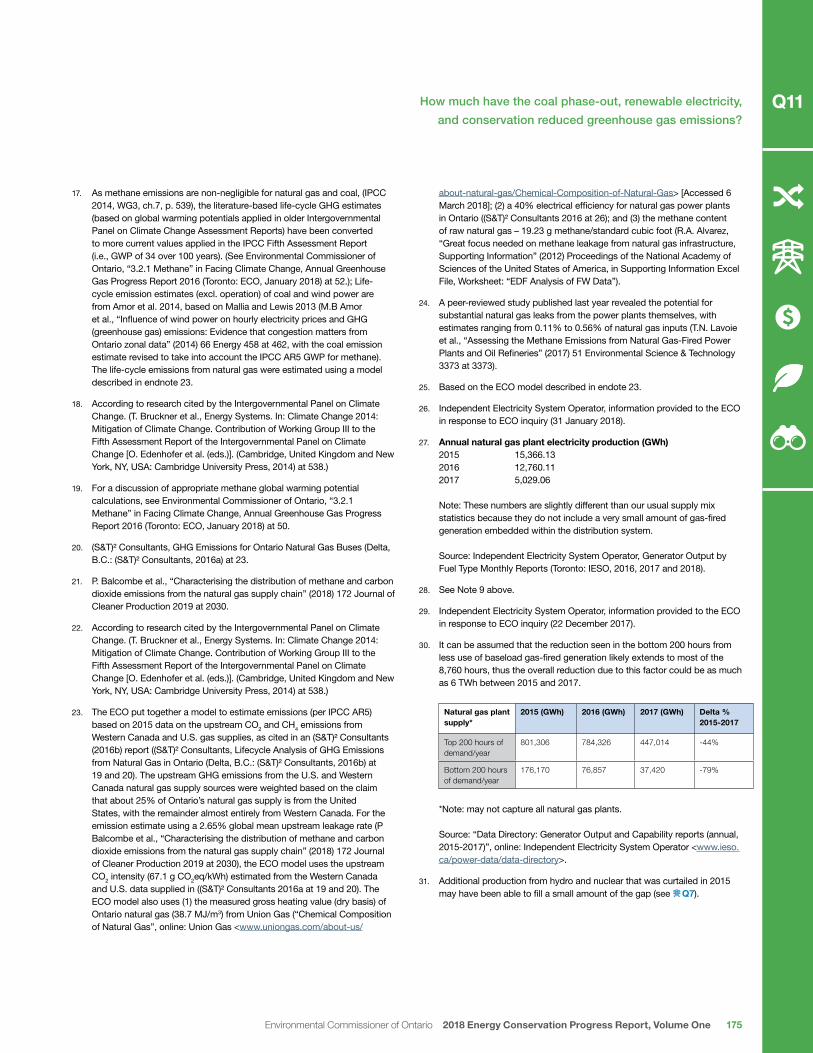
17 As methane emissions are non-negligible for natural gas and coal, (IPCC 2014, WG3, ch.7, p. 539), the literature-based life-cycle GHG estimates (based on global warming potentials applied in older Intergovernmental Panel on Climate Change Assessment Reports) have been converted to more current values applied in the IPCC Fifth Assessment Report (i.e., GWP of 34 over 100 years). (See Environmental Commissioner of Ontario, “3.2.1 Methane” in Facing Climate Change, Annual Greenhouse Gas Progress Report 2016 (Toronto: ECO, January 2018) at 52.); Life-cycle emission estimates (excl. operation) of coal and wind power are from Amor et al. 2014, based on Mallia and Lewis 2013 (M.B Amor et al., “Influence of wind power on hourly electricity prices and GHG (greenhouse gas) emissions: Evidence that congestion matters from Ontario zonal data” (2014) 66 Energy 458 at 462, with the coal emission estimate revised to take into account the IPCC AR5 GWP for methane). The life-cycle emissions from natural gas were estimated using a model described in endnote 23.
18 According to research cited by the Intergovernmental Panel on Climate Change. (T. Bruckner et al., Energy Systems. In: Climate Change 2014: Mitigation of Climate Change. Contribution of Working Group III to the Fifth Assessment Report of the Intergovernmental Panel on Climate Change [O. Edenhofer et al. (eds.)]. (Cambridge, United Kingdom and New York, NY, USA: Cambridge University Press, 2014) at 538.)
19 For a discussion of appropriate methane global warming potential calculations, see Environmental Commissioner of Ontario, “3.2.1 Methane” in Facing Climate Change, Annual Greenhouse Gas ProgressReport 2016 (Toronto: ECO, January 2018) at 50.
20 (S&T)² Consultants, GHG Emissions for Ontario Natural Gas Buses (Delta, B.C.: (S&T)² Consultants, 2016a) at 23.
21 P. Balcombe et al., “Characterising the distribution of methane and carbon dioxide emissions from the natural gas supply chain” (2018) 172 Journal ofCleaner Production 2019 at 2030.
22 According to research cited by the Intergovernmental Panel on Climate Change. (T. Bruckner et al., Energy Systems. In: Climate Change 2014: Mitigation of Climate Change. Contribution of Working Group III to the Fifth Assessment Report of the Intergovernmental Panel on Climate Change [O. Edenhofer et al. (eds.)]. (Cambridge, United Kingdom and New York, NY, USA: Cambridge University Press, 2014) at 538.)
23 The ECO put together a model to estimate emissions (per IPCC AR5) based on 2015 data on the upstream CO2 and CH4 emissions fromWestern Canada and U.S. gas supplies, as cited in an (S&T)² Consultants (2016b) report ((S&T)² Consultants, Lifecycle Analysis of GHG Emissions from Natural Gas in Ontario (Delta, B.C.: (S&T)² Consultants, 2016b) at 19 and 20). The upstream GHG emissions from the U.S. and Western Canada natural gas supply sources were weighted based on the claim that about 25% of Ontario’s natural gas supply is from the United States, with the remainder almost entirely from Western Canada. For theemission estimate using a 2.65% global mean upstream leakage rate (P Balcombe et al., “Characterising the distribution of methane and carbon dioxide emissions from the natural gas supply chain” (2018) 172 Journal of Cleaner Production 2019 at 2030), the ECO model uses the upstream CO2 intensity (67.1 g CO2eq/kWh) estimated from the Western Canadaand U.S. data supplied in ((S&T)² Consultants 2016a at 19 and 20). The ECO model also uses (1) the measured gross heating value (dry basis) of Ontario natural gas (38.7 MJ/m3) from Union Gas (“Chemical Composition of Natural Gas”, online: Union Gas <www.uniongas.com/about-us/
about-natural-gas/Chemical-Composition-of-Natural-Gas> [Accessed 6 March 2018]; (2) a 40% electrical efficiency for natural gas power plants in Ontario ((S&T)² Consultants 2016 at 26); and (3) the methane content of raw natural gas – 19.23 g methane/standard cubic foot (R.A. Alvarez, “Great focus needed on methane leakage from natural gas infrastructure, Supporting Information” (2012) Proceedings of the National Academy of Sciences of the United States of America, in Supporting Information Excel File, Worksheet: “EDF Analysis of FW Data”).
24 A peer-reviewed study published last year revealed the potential for substantial natural gas leaks from the power plants themselves, with estimates ranging from 0.11% to 0.56% of natural gas inputs (T.N. Lavoieet al., “Assessing the Methane Emissions from Natural Gas-Fired Power Plants and Oil Refineries” (2017) 51 Environmental Science & Technology 3373 at 3373).
25 Based on the ECO model described in endote 23.
26 Independent Electricity System Operator, information provided to the ECOin response to ECO inquiry (31 January 2018).
27. Annual natural gas plant electricity production (GWh) 2015 15,366.13 2016 12,760.11 2017 5,029.06
Note: These numbers are slightly different than our usual supply mix statistics because they do not include a very small amount of gas-fired generation embedded within the distribution system.
Source: Independent Electricity System Operator, Generator Output by Fuel Type Monthly Reports (Toronto: IESO, 2016, 2017 and 2018).
28 See Note 9 above.
29 Independent Electricity System Operator, information provided to the ECOin response to ECO inquiry (22 December 2017).
30 It can be assumed that the reduction seen in the bottom 200 hours from less use of baseload gas-fired generation likely extends to most of the 8,760 hours, thus the overall reduction due to this factor could be as muchas 6 TWh between 2015 and 2017.
Natural gas plant supply*
2015 (GWh) 2016 (GWh) 2017 (GWh) Delta % 2015-2017
Top 200 hours of demand/year
801,306 784,326 447,014 -44%
Bottom 200 hours of demand/year
176,170 76,857 37,420 -79%
*Note: may not capture all natural gas plants.
Source: “Data Directory: Generator Output and Capability reports (annual, 2015-2017)”, online: Independent Electricity System Operator <www.ieso.ca/power-data/data-directory>.
31 Additional production from hydro and nuclear that was curtailed in 2015may have been able to fill a small amount of the gap (see Q7).
Environmental Commissioner of Ontario 2018 Energy Conservation Progress Report, Volume One
How much have the coal phase-out, renewable electricity,
and conservation reduced greenhouse gas emissions?Q11
175
.
.
.
.
.
.
.
.
.
.
.
.
.
.

32 “Supply Overview: Imports and Exports”, online: Independent Electricity System Operator <www.ieso.ca/power-data/supply-overview/imports-and-exports>.
33 Generally, gas generators will only produce power if the hourly wholesale price is high enough to cover fuel costs. Much of Ontario’s current exports are during hours when price is low, as a large source of exports are renewables, which have very low “marginal operating costs” (i.e., fuel costs). Low export prices drive up demand. If natural gas was setting the wholesale price, the price would be higher, which would potentially drive down demand.
34 The Ministry of Energy has estimated greenhouse gas emissions factors for electricity production from these jurisdictions (NYISO for New York, and MISO for Michigan) and both are many times higher than Ontario, even in off-peak hours. (“Default Emissions Factors for 2018 for Ontario’s Cap & Trade Program”, online: Ontario Ministry of Energy <www.energy.gov.on.ca/en/ontarios-electricity-system/climate-change/default-emission-factors-for-2018-for-ontarios-cap-trade-program/>.)
35 Independent Electricity System Operator, information provided to the ECO in response to ECO inquiry (31 January 2018).
36 Environmental Commissioner of Ontario, “6.3 Shifting Freight Away from Fossil Fuels” in Ontario’s Climate Act from Plan to Progress, Annual Greenhouse Gas Progress Report 2017 (Toronto: ECO, January 2018) at 209-214.
.
.
.
.
.
176
How much have the coal phase-out, renewable electricity,
and conservation reduced greenhouse gas emissions?
Making Connections: Straight Talk About Electricity in Ontario
Q11

177Environmental Commissioner of Ontario 2018 Energy Conservation Progress Report, Volume One
How much have the coal phase-out, renewable electricity,
and conservation reduced greenhouse gas emissions?Q11
This page has been intentionally left blank.

2005
Q U ES T I O N 12
How much did the coal shutdown reduce pollution in Ontario?
The shutdown of coal-fired generation went a long way towards improving Ontario’s air and water quality.
For years, coal-fired emissions worsened acid rain and smog, which are harmful to human and environmental health. Due to the coal closures, emissions of air pollutants from the electricity sector fell sharply, by 82% for nitrogen oxides, 99% for sulphur dioxide, 86% for fine particulate matter, and 100% for mercury, between 2005 and 2015.
Ontario air quality has improved dramatically in the same time period. Ambient air concentrations of nitrogen dioxide, sulphur dioxide, and fine particulate matter have declined by 32%, 48%, and 25%, respectively. Smog days have dropped from 53 days per year in 2005 to zero in 2014.
The credit goes to Ontario’s coal shutdown, to the drop in coal-fired electricity and emissions from other industrial sources in upwind U.S. states, and to emission reductions from other sources in Ontario, due to improved environmental regulations.
I M PAC T O N T H E E N V I R O N M E N T

Contents
THE DETAILS . . . . . . . . . . . . . . . . . . . . . . . . . . . . . . . . . . . . . . . . . . . . . . . . . . . . . . . . . . . . . . . . . . 180
Why did Ontario shut down the coal plants? First, to protect human health. . . . . . . . . . . . . . . . 180
How emissions from coal worsened air quality and human health . . . . . . . . . . . . . . . . . . . . . . . 181
Other problems with coal: acid rain and mercury . . . . . . . . . . . . . . . . . . . . . . . . . . . . . . . . . . . . . . . 184
Ontario’s air emissions from coal. . . . . . . . . . . . . . . . . . . . . . . . . . . . . . . . . . . . . . . . . . . . . . . . . . 185
The end of coal and the reduction in air emissions. . . . . . . . . . . . . . . . . . . . . . . . . . . . . . . . . . . . 185
Could Ontario have cleaned up its coal plants? . . . . . . . . . . . . . . . . . . . . . . . . . . . . . . . . . . . . . . . . 189
How Ontario’s air quality has improved . . . . . . . . . . . . . . . . . . . . . . . . . . . . . . . . . . . . . . . . . . . . . 190
Reduced coal use in the United States has also improved Ontario’s air quality . . . . . . . . . . . . . 192
The economic and health benefits of cleaner air . . . . . . . . . . . . . . . . . . . . . . . . . . . . . . . . . . . . . 193
Electrification can reduce transportation-related air pollution . . . . . . . . . . . . . . . . . . . . . . . . . . . . . . 194
Conclusion. . . . . . . . . . . . . . . . . . . . . . . . . . . . . . . . . . . . . . . . . . . . . . . . . . . . . . . . . . . . . . . . . . . . 195
Endnotes . . . . . . . . . . . . . . . . . . . . . . . . . . . . . . . . . . . . . . . . . . . . . . . . . . . . . . . . . . . . . . . . . . . . . 196
179Environmental Commissioner of Ontario 2018 Energy Conservation Progress Report, Volume One
How much did the coal shutdown reduce pollution in Ontario? Q12

The details…
Bringing down the last two stacks at Nanticoke generating station (28 February 2018).
Source: Ontario Power Generation
Why did Ontario shut down the coal plants? First, to protect human healthCoal-fired generation is a hugely important source of greenhouse gas (GHG) emissions which contribute to climate change ( Q11), itself a key threat to human health. However, burning coal is also a major source of air pollutants that directly lead to near-term adverse health impacts. Growing awareness of this threat was a key factor leading to Ontario’s decision for the coal shutdown.1
As shown in Figure 12.1, coal-fired generation rose sharply in the late 1990s when eight nuclear reactors were taken out of service.
Burning coal is a major source of air pollutants.
180 Making Connections: Straight Talk About Electricity in Ontario
Q12

Figure 12.1. Electricity production from coal vs. nuclear-fired generating stations in Ontario 1990 - 2005.
Source: Environment and Climate Change Canada, National Inventory Report 1990-2005: Greenhouse Gas Sources and Sinks in Canada, Annex 9 Table A9 (Ottawa: ECCC, 2007) at 587.
At that time, the link between air quality and adverse human health impacts was becoming clearer and public health and health organizations began to focus on air pollution from coal plants. In 1998, the Ontario Medical Association documented the serious health effects of air pollutants in the Windsor-Quebec corridor, and called for reductions of air emissions from the coal plants.2 In 2000, to reduce the health impacts of air pollution, Toronto’s Medical Office of Health advocated for conversion of the Lakeview coal plant to natural gas and for tighter air emissions caps at Ontario’s other coal plants.3 Pressure came from across the border too. The New York State Attorney complained to the North American Free Trade Agreement Commission for Environmental Cooperation about the Nanticoke coal plant’s air emissions and their impact on New York’s air quality.
In November 2002, the Ontario Public Health Association was so alarmed by the health impacts from burning coal that they released a report
entitled: “Beyond Coal: Power, Public Health and the Environment”,4 which recommended that Ontario “eliminate its reliance on oil-and coal-fired power plants by 2015.” The Lung Association issued information about being “Smog Smart” and how to protect your breathing on smog days, particularly for asthma sufferers,5 and provided information about the health impacts from smog-related pollutants.
How emissions from coal worsened air quality and human healthCoal-fired generation was a major source of the three major pollutants in outdoor air that degrade air quality and pose a risk to human health: ground-level ozone, fine particulate matter, and nitrogen dioxide.
Since 2003, the Government of Ontario has used the Air Quality Index (AQI) to help Ontarians understand what air
- 10,000 20,000 30,000 40,000 50,000 60,000 70,000 80,000 90,000
100,000
1990 1991 1992 1993 1994 1995 1996 1997 1998 1999 2000 2001 2002 2003 2004 2005
Elec
trici
ty G
ener
atio
n (G
Wh)
Year
electricity amount from burning coal electricity amount from nuclear generation
181Environmental Commissioner of Ontario 2018 Energy Conservation Progress Report, Volume One
How much did the coal shutdown reduce pollution in Ontario? Q12

quality means for their health and enable them to make decisions to protect their health during periods of poor air quality. This index was replaced by the Air Quality Health Index (AQHI) in 2015,6 which is based on short-term relationships between air pollution and mortality in 12 Canadian cities. The AQHI is intended to present the immediate risk to human health due to air pollution, particularly for those most at risk, including seniors, and people with diabetes, heart and lung disease.7 The AQHI is based primarily on three common air pollutants known to result in adverse health impacts (these pollutants were also indicator pollutants in the AQI):
• Ground Level Ozone (sometimes called Tropospheric Ozone) (O3). At ground level where people inhale, ozone is harmful to human health, damaging lung tissues and exacerbating respiratory illnesses. It is also a GHG, which contributes to climate change. However, at high altitudes, ozone is beneficial to the planet as it protects us from the sun’s harmful UV radiation.
• Fine Particulate Matter (PM2.5). Very small particles (< 2.5 microns) that can be inhaled and spread throughout the whole body causing serious health problems such as cancer, heart disease and premature death. These particles are emitted from combustion processes as an aerosol and are also formed in the air post-combustion, by chemical transformation of other pollutants such as sulphur dioxide, nitrogen oxides and volatile organic compounds (VOCs).8
• Nitrogen Dioxide (NO2). Also formed from combustion processes, and causes respiratory problems.
Coal-fired generation in Ontario and in the U.S. was a major source of all three of these pollutants. Coal contains toxic substances that are released to air when burned, including: sulphur dioxide (SO2); nitrogen oxides (NOx) (a combination of nitrogen dioxide (NO2) and nitric oxide (NO)); mercury (Hg); and fine particulate matter. Nitrogen oxides in turn, reacts with volatile organic compounds in the presence of sunlight to produce ozone.9 Additional fine particulate matter is produced indirectly, when NOx and SO2 react with other elements in the atmosphere.10 From a health perspective, this secondary formation of particulate matter by chemical interactions in the atmosphere is one of the most significant sources of this pollutant. These secondary reactions can contribute more than half the total mass of particulates.
Air pollution harms humans primarily by contributing to cardiovascular and respiratory disease. The Great Smog of London in 1952, due to heavy use of coal, famously killed more than 4,000 people.11 Today, coal use causes choking, hazardous smogs in many countries, including China, India and Poland. Globally, ambient PM2.5 was the fifth-ranking factor causing death of about 4 million people in 2015. Ozone caused about an additional 4 million deaths. Ambient air pollution contributed substantially to the global burden of disease in 2015, which shows just how important these air pollutants are for the management of public health.12
Emissions of SO2 and NOx are linked to increases in respiratory ailments, chronic heart and lung diseases and premature deaths as well as cardiovascular ailments.13 The Ontario Medical Association estimated that air pollution contributed to about 1,900 premature deaths, 9,807 hospital admissions and about 45,000 emergency room visits in Ontario in 2000.14 Much of the impacts can be attributed to the particulate matter being inhaled.
Coal-fired generation was a major source of the three major pollutants in outdoor air.
Coal contains toxic substances.
182
How much did the coal shutdown reduce pollution in Ontario?
Making Connections: Straight Talk About Electricity in Ontario
Q12
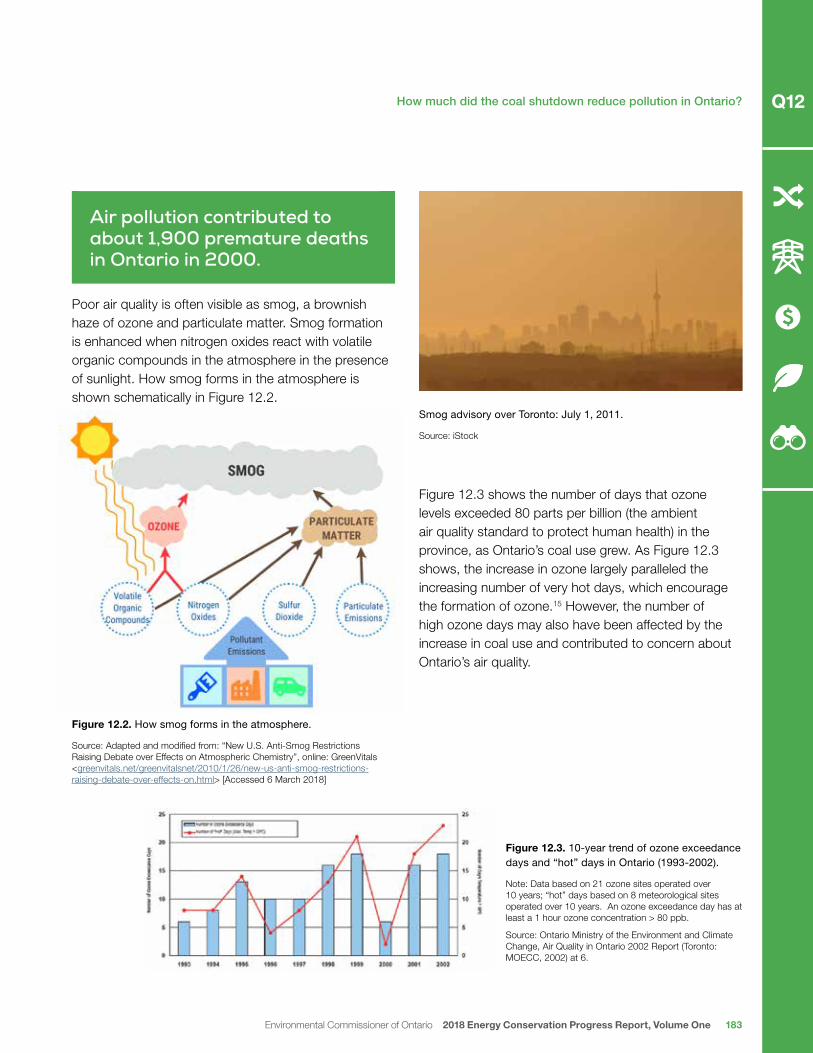
Air pollution contributed to about 1,900 premature deaths in Ontario in 2000.
Poor air quality is often visible as smog, a brownish haze of ozone and particulate matter. Smog formation is enhanced when nitrogen oxides react with volatile organic compounds in the atmosphere in the presence of sunlight. How smog forms in the atmosphere is shown schematically in Figure 12.2.
Figure 12.2. How smog forms in the atmosphere.
Source: Adapted and modified from: “New U.S. Anti-Smog Restrictions Raising Debate over Effects on Atmospheric Chemistry”, online: GreenVitals <greenvitals.net/greenvitalsnet/2010/1/26/new-us-anti-smog-restrictions-raising-debate-over-effects-on.html> [Accessed 6 March 2018]
Smog advisory over Toronto: July 1, 2011.
Source: iStock
Figure 12.3 shows the number of days that ozone levels exceeded 80 parts per billion (the ambient air quality standard to protect human health) in the province, as Ontario’s coal use grew. As Figure 12.3 shows, the increase in ozone largely paralleled the increasing number of very hot days, which encourage the formation of ozone.15 However, the number of high ozone days may also have been affected by the increase in coal use and contributed to concern about Ontario’s air quality.
Figure 12.3. 10-year trend of ozone exceedance days and “hot” days in Ontario (1993-2002).
Note: Data based on 21 ozone sites operated over 10 years; “hot” days based on 8 meteorological sites operated over 10 years. An ozone exceedance day has at least a 1 hour ozone concentration > 80 ppb.
Source: Ontario Ministry of the Environment and Climate Change, Air Quality in Ontario 2002 Report (Toronto: MOECC, 2002) at 6.
183Environmental Commissioner of Ontario 2018 Energy Conservation Progress Report, Volume One
How much did the coal shutdown reduce pollution in Ontario? Q12

Other problems with coal: acid rain and mercury
In addition to harming air quality, coal-fired generation contributed to acid rain and mercury pollution. Coal-fired generating stations emit large amounts of both nitrogen oxides (NOx) and sulphur oxides (SOx). Both of these air contaminants, apart from contributing to air pollution problems, also chemically react with rain to create nitric acid and sulphuric acid, which are then deposited onto lakes and soil as acid rain, harming forest and aquatic ecosystems.16
Coal-fired power plants are also major sources of the powerful neurotoxic metal, mercury. Mercury from coal plants disperses through the air and eventually settles onto land, lakes and rivers.17 When mixed with water, inorganic mercury can be metabolized by bacteria into the more toxic methylmercury. Methylmercury is taken up by organisms at the
bottom of the food web, biomagnifies as it moves from one organism to the next, so that mercury concentrations are higher up in the fish–specific food chain. As a result, the mercury most affects the predators/consumers at the top of a food chain be they people or other fish-consuming animals. Mercury consumption is particularly dangerous for the in-uterus baby in pregnant women and other vulnerable groups. Mercury deposition (of which emissions from coal burning is just one source) has led to fish consumption advisories across Ontario.18
Methylmercury can negatively affect reproduction rates, behaviour and physical development in fish and fish-eating birds and mammals. In people, mercury exposure can harm the brain, heart, kidneys, lungs, and immune system. Mercury poisoning causes degraded neurological abilities including tunnel vision; deafness; numbness in arms and legs; uncontrollable shaking; difficulty walking; and even death.19
Coal-fired generation contributed to acid rain and mercury pollution.
184
How much did the coal shutdown reduce pollution in Ontario?
Making Connections: Straight Talk About Electricity in Ontario
Q12

Ontario’s air emissions from coal In 2001, Ontario had five coal-fired generating stations. The emissions of key pollutants associated with each station are listed in Table 12.1. Note that mercury emissions are reported for 1999.
Table 12.1. Air pollutant emissions from coal-fired generating stations in Ontario, 2001.
Station Size (MW)*Sulphur Dioxide
(SO2)Nitrogen Oxides
(NOx)Mercury
(Hg)
Tonnes** kg
Nanticoke 3,940 86,500 22,400 247
Lakeview 2,400 19,000 5,050 83
Lambton 1,980 28,300 11,800 135
Thunder Bay 306 8,810 1,970 67
Atikokan 211 4,480 950 63
Total 8,837 147,090 42,170 595
* “The End of Coal”, online: Government of Ontario <www.ontario.ca/page/end-coal>; [Accessed 8 March 2018]; ** Ontario Public Health Association, Beyond Coal: Power, Public Health and the Environment by Kim Perrotta (Toronto: OPHA, November 2002) at 11.
Together, the five coal plants produced a significant portion of the province’s air pollution, particularly in the Windsor-Quebec corridor. In 2001, Ontario’s coal-fired plants produced about 23% of the sulphur dioxide and 14% of the nitrogen oxides emitted in the entire province.20 Nanticoke Generating Station, one of the largest coal-fired plants in North America, alone emitted about 50% of the total air emissions from all Ontario coal-fired plants. As well, with these emissions Nanticoke also contributed significant amounts to the PM2.5 fraction in the atmosphere. In 2002, New York State’s Attorney General called the Nanticoke plant the largest emitter of NOx in North America.21 In addition, Ontario’s air quality was affected by emissions from U.S. coal-fired plants.
The end of coal and the reduction in air emissionsIn 2001, the Ontario government announced that, in 2005 the 2,400 MW Lakeview Generating Station would stop burning coal.22 By 2002, all three major political parties had agreed on the need to shut down coal-fired generation completely (although on differing timetables). This was in part due to public concern about human health.23
Starting with the closure of Lakeview Generating Station in 2005,24 Ontario began to shut down the province’s coal-fired generation. After 2008, coal-fired electricity generation declined sharply, falling to near-zero in 2014, and zero in 2015 (see timeline of events in Table 12.2).
185
Sources: ( ) ( )
Environmental Commissioner of Ontario 2018 Energy Conservation Progress Report, Volume One
How much did the coal shutdown reduce pollution in Ontario? Q12

Table 12.2. Timeline of events for closing Ontario’s coal fired generating stations.
Year Event
2001 Ontario announces that it will close Lakeview Generating Station (GS)
2003 Ontario commits to the shutdown of coal by 2007
2005 Lakeview GS Closes
2006 Ministry of Energy instructs former Ontario Power Authority (OPA) to plan for coal phase-out at the earliest practical time, ensuring adequate system capacity and reliability
2007 Ontario Regulation 496/07 (Cessation of Coal Use) requires coal closure by Dec. 31, 2014
2009 The Green Energy and Green Economy Act commits to adding new clean and renewable energy resources to the electricity system, and to encourage energy conservation
2010 The 2010 Long-Term Energy Plan (2010 LTEP) commits to coal phase-out by 2014
2012 Atikokan GS Closes
2013 Nanticoke GS and Lambton GS Close
April 2014 Thunder Bay GS (last coal plant) closes
2015 Atikokan and Thunder Bay GS reopen, fuelled by biomass.Ending Coal for Cleaner Air Act prohibits future use of coal
Source: “The End of Coal”, online: Government of Ontario <www.ontario.ca/page/end-coal>. [Accessed 8 March 2018]
Ontario’s coal-fired capacity (measured at year-end) dropped as shown in Figure 12.4.
186
How much did the coal shutdown reduce pollution in Ontario?
Making Connections: Straight Talk About Electricity in Ontario
Q12
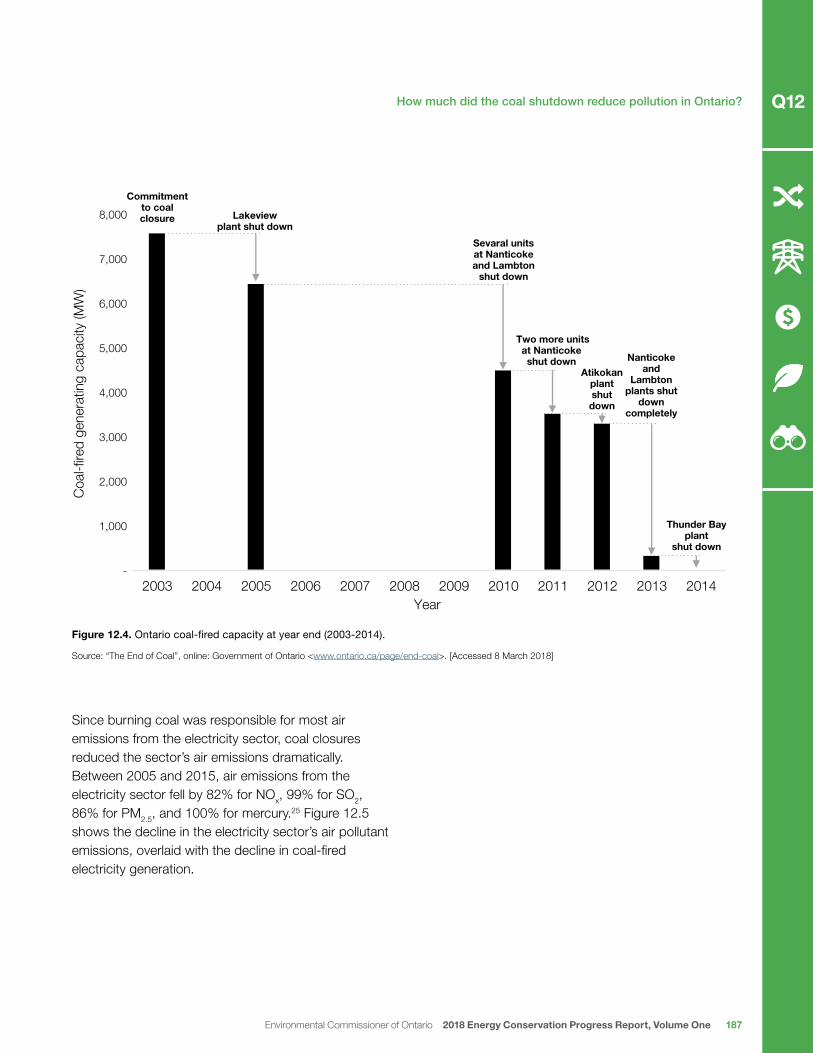
Figure 12.4. Ontario coal-fired capacity at year end (2003-2014).
Source: “The End of Coal”, online: Government of Ontario <www.ontario.ca/page/end-coal>. [Accessed 8 March 2018]
Since burning coal was responsible for most air emissions from the electricity sector, coal closures reduced the sector’s air emissions dramatically. Between 2005 and 2015, air emissions from the electricity sector fell by 82% for NOx, 99% for SO2, 86% for PM2.5, and 100% for mercury.25 Figure 12.5 shows the decline in the electricity sector’s air pollutant emissions, overlaid with the decline in coal-fired electricity generation.
-
1,000
2,000
3,000
4,000
5,000
6,000
7,000
8,000
2003 2004 2005 2006 2007 2008 2009 2010 2011 2012 2013 2014
Coa
l-fire
d ge
nera
ting
capa
city
(MW
)
Year
Commitmentto coalclosure Lakeview
plant shut downSevaral unitsat Nanticokeand Lambton
shut down
Two more unitsat Nanticoke shut down
Atikokanplantshutdown
Nanticokeand
Lambtonplants shut
downcompletely
Thunder Bayplant
shut down
187Environmental Commissioner of Ontario 2018 Energy Conservation Progress Report, Volume One
How much did the coal shutdown reduce pollution in Ontario? Q12

Figure 12.5. Sulphur oxide emissions and nitrogen oxide emissions for Ontario’s electricity sector, and coal-fired electricity generation, 2005-2015.
Note: Mercury and fine particulate matter emissions are not shown, due to a difference in scale. Emissions of these pollutants from electric power generation also dropped dramatically, with mercury emissions falling from 326 kg in 2005 to zero in 2015, and fine particulate matter emissions falling from 1,787 tonnes in 2005 to 249 tonnes in 2015.
Source : Independent Electricity System Operator, “Module 1: State of the Electricity System: 10-Year Review” (presentation, August 2016) slides 23, 35, 36.
0
5
10
15
20
25
30
35
0
20,000
40,000
60,000
80,000
100,000
120,000
140,000
2005 2006 2007 2008 2009 2010 2011 2012 2013 2014 2015
TWh
Tonn
es
Year
Coal electricity production (TWh) Nitrogen oxide emissions (tonnes)
Sulphur oxide emissions (tonnes)
188
How much did the coal shutdown reduce pollution in Ontario?
Making Connections: Straight Talk About Electricity in Ontario
Q12

Could Ontario have cleaned up its coal plants?
Not everyone agreed that coal-fired plants needed to be shut down, or at least not right away; many argued that pollution controls could be implemented to reduce the amount of pollution emitted by coal plants. Air emissions from coal-fired generation can be reduced, but not eliminated, through emissions control technology. In the decade before coal closure, Ontario Power Generation made significant investments in pollution control technologies to reduce emissions of NOx, SO2 and PM2.5,
26 as required by Ontario’s Countdown Acid Rain program.
After the commitment to shut down coal, additional pollution control measures were considered but ultimately abandoned. Pollution control technology is expensive. The cost of two key pollution control measures - flue gas desulphurization and selective catalytic reduction (which remove SOx and NOx from the flue gas, respectively) - was roughly $750 million
at the units where they were installed, and converting all units at Lambton and Nanticoke was estimated to cost an additional $2-3 billion.27
Even these expensive pollution control technologies could not match the pollution-reduction potential of replacing coal with other sources of electricity. Pollution control technologies for coal power plants may have improved since 2002. However, at that time, the Ontario Public Health Association demonstrated that, even if highly efficient emission control technologies were placed on coal fired plants, the resulting emissions would still be significantly higher than other options such as combined cycle natural gas (see Table 12.3), to say nothing of emissions-free alternatives such as renewables or conservation.28 Pollution control would also do nothing to solve coal’s climate problem – greenhouse gas emissions from carbon dioxide would in fact rise with pollution control technology in place, as these technologies would reduce operating efficiency slightly.
Table 12.3. Emission reductions comparison between coal plants with emission control devices and other options.
Pollutant Air Emissions from Coal Plants (kg/MWh)*
with existing (2002) emission controls
% Reduction in Air Emissions if Additional
Emissions Controls Were Installed at Coal Plants29
% Reduction in Air Emissions if Coal Replaced
with Combined Cycle Natural Gas Turbines
Nitrogen Oxide 1.2 63 – 80* 90
Sulphur Dioxide 4.6 84** 99+
Mercury 0.017 (g/MWh) 70*** 99+
Carbon Dioxide 890 Slight increase**** 60
* Additional emissions controls are selective catalytic reduction (SCR) and Low-NOx burners
** Emission controls in this case are flue gas de-sulphurization (FGD) with high-sulphur coal
*** Expected capability of mercury control technologies under development
**** Use of SCR and low-NOx burners and FGD emissions control technologies will result in a small increase in CO2 emissions due to increased energy requirements
Source: Ontario Public Health Association, Beyond Coal: Power, Public Health and the Environment by Kim Perrotta (Toronto: OPHA, November 2002) at 33.
189
Notes:
Environmental Commissioner of Ontario 2018 Energy Conservation Progress Report, Volume One
How much did the coal shutdown reduce pollution in Ontario? Q12

How Ontario’s air quality has improvedSince the coal closures began, ambient air quality has improved across Ontario (see Table 12.4).30 Concentrations of NO2, SO2 and PM2.5 have decreased substantially. Mean ozone levels have increased, but summer levels (which is when concentrations are highest and most likely to have health impacts) have decreased. The drop in summer ozone levels results from reductions in air pollution in both Ontario and the U.S., while the winter increases are attributed to rising global background concentrations.31 From a public health perspective, both overall ozone levels and the “peaks” have a health impact.
Table 12.4. Changes in Ontario ambient air pollutants (2006-2015).
Air Pollutant Change in Ambient Concentration (2006-2015)
Nitrogen dioxide -32%
Sulphur dioxide -48%
Fine particulate matter -25%
Ozone +3% (annual); -4% (summer), +9% (winter)
Note: Trends are based on composite mean values from multiple monitoring sites across Ontario.
Source: Ontario Ministry of the Environment and Climate Change, Air Quality in Ontario 2015 Report (Toronto: MOECC, 2015) at iii and 6.
Another measure of Ontario air quality is the number of Smog and Air Health Advisories issued by the province. When the Air Quality Health Index, based primarily on the three pollutants mentioned above, is expected to reach the high risk level for three hours or more, a Smog and Air Health Advisory is issued.32 (Prior to 2015, these were called Smog Advisories, and a different air quality index was used, so measurements before and after 2015 are not comparable.) High ozone levels are often the trigger for these advisories. For example, in 2003, 11 out of 12 smog episodes were due at least in part to ozone.33
Since the coal shutdown began, there has been a large drop in the number of air quality advisories, from 53 in 2005 to zero in 2014 (under the previous air quality index), and are also zero in 2015 and 2017 (under the new index), as shown in Figure 12.6 below.
There has been only one Smog and Air Health Advisory day since the coal plants were closed.
190
How much did the coal shutdown reduce pollution in Ontario?
Making Connections: Straight Talk About Electricity in Ontario
Q12

Figure 12.6. Smog Advisories in Ontario from 2003-2014 and Smog and Air Health Advisories from 2015-2017.
Note: Beginning in 2015, Ontario adjusted its index for air quality measurements, and also changed the name of its advisories from “Smog Advisories” to “Smog and Air Health Advisories (SAHA)”.
Sources: “Smog Advisory Statistics”, online: Ontario Ministry of the Environment and Climate Change <www.airqualityontario.com/history/aqi_advisories_stats.php > [Accessed 8 March 2018]; “SAQS & SAHA Statistics”, online: Ontario Ministry of Environment and Climate Change <www.airqualityontario.com/aqhi/advisories_stats.php>. [Accessed 8 March 2018]
There has been only one Smog and Air Health Advisory day since the coal plants were closed, in the exceptionally hot summer of 2016. The higher summer temperatures associated with climate change are expected to increase air pollution events, especially due to particulate matter and ground level ozone.34
Ontario’s air quality is still not perfect. In each of 2015 to 2017, Ontario issued from 7 to 10 Special Air Quality Statements (indicating poor air quality for a shorter period of 1 to 2 hours).
How much of a role did the coal shutdown play in Ontario’s improved air quality? One measure is the proportion of overall reductions in Ontario air emissions that came from replacing coal. The Ministry of the Environment and Climate Change reports that air emissions reductions from the elimination of coal account for 24% of Ontario’s overall NOx reductions
between 1990 and 2015; the percentages for SO2 and mercury (based on 2000 -2015 data) are 22% and 29% respectively.35 For particulate matter emissions, as shown in Figure 12.7, the direct contribution of the coal phase-out is much lower, as coal-fired generation only accounted for about 1% of Ontario’s direct PM2.5 emissions. However, both gaseous NOx and SO2, which the coal plants emitted in significant amounts, react in the atmosphere to produce large amounts of additional PM2.5.
36 This means that the contribution of coal to ambient levels of PM2.5 was likely much larger than its proportional share of PM2.5 emissions.
Figure 12.7 shows the declining share of overall air emissions in Ontario that can be attributed to the electricity sector, almost entirely due to the coal shutdown.
0
10
20
30
40
50
60
2003 2004 2005 2006 2007 2008 2009 2010 2011 2012 2013 2014 2015 2016 2017
Smog Advisories (# of events)
Smog Advisories (Total Days)
Smog and Air Health Advisories (#)
191Environmental Commissioner of Ontario 2018 Energy Conservation Progress Report, Volume One
How much did the coal shutdown reduce pollution in Ontario? Q12

Figure 12.7. Ontario’s electricity sector’s contribution to Ontario’s overall air pollution burden as measured with selected pollutants (2005-2015).
Note: The fine particulate matter (<2.5μm) is the same as PM2.5. This data set from Environment and Climate Change Canada shows a small increase in mercury emissions in 2015 from the electricity sector, contrary to the information reported by the IESO. The ECO does not know the reason for this discrepancy.
Source: “Air Pollutant Emission Inventory - Online Data Search”, online: Environment and Climate Change Canada <www.ec.gc.ca/inrp-npri/donnees-data/ap/index.cfm?lang=en >. [Accessed 8 March 2018]
Reduced coal use in the United States has also improved Ontario’s air qualityReduced air emissions from coal in the U.S. have also contributed to improvements in Ontario’s air quality. Coal-fired electricity production in the U.S. has decreased steadily since 2007 (Figure 12.8).
Figure 12.8. Annual share of total U.S. electricity generation by source (1950 – 2016), percent of total.
Source: Tyler Hodge, “Natural gas expected to surpass coal in mix of fuel used for U.S. power generation in 2016” U.S. Energy Information Administration (16 March 2016), online: <www.eia.gov/todayinenergy/detail.php?id=25392>.
0%
5%
10%
15%
20%
25%
30%
2005 2006 2007 2008 2009 2010 2011 2012 2013 2014 2015
Con
tribu
tions
of O
ntar
io's
ele
ctric
ity s
ecto
r to
air
air p
ollu
tion
emiss
ions
(%)
Year
Nitrogen oxide emissions (tonnes)Sulphur dioxide emissions (tonnes)Fine particulate matter (<2.5µm) emissions (tonnes)Mercury emissions (kg)
192
How much did the coal shutdown reduce pollution in Ontario?
Making Connections: Straight Talk About Electricity in Ontario
Q12

As a result, air pollution emissions from the U.S. electric power sector (largely from coal-fired stations) have also dropped significantly.37 The decrease in U.S. NOx
emissions is shown in Figure 12.9. Emissions from plants that are upwind of Ontario will affect the air quality in this province.
Figure 12.9. NOx emission trends from electric utilities in the U.S.
Source: Ontario Ministry of the Environment and Climate Change, Air Quality in Ontario 2015 Report (Toronto: MOECC, 2017) at 16.
American coal plant closures are very good news for Ontario air quality, as well as for acid rain and mercury deposition. Slow moving high pressure systems south of the lower Great Lakes result in long range transport of pollution from the United States,38 many hundreds of kilometres from its point of origin, and can affect most of Ontario’s population.39 The highest levels of ozone in Ontario are typically found in the Tiverton/Grand Bend areas on Lake Huron which are downwind of the precursors emitted in the U.S.
The economic and health benefits of cleaner airUnsurprisingly, the improved air quality has improved health outcomes for Ontarians. The City of Toronto estimates (notwithstanding substantial population growth) that the number of premature deaths due to air pollution in Toronto (from all sources) fell by 23% between 2004 and 2014 (to 1,300 per year), and that the percentage of hospitalizations due to air pollution fell by 40% in the same period (to 3,550 per year).40 Since 2014, when the last coal plant was shut down,
0
1000
2000
3000
4000
Th
ou
san
d t
on
ne
s
5000
6000
7000
201520102005200019951990
193Environmental Commissioner of Ontario 2018 Energy Conservation Progress Report, Volume One
How much did the coal shutdown reduce pollution in Ontario? Q12

these numbers have remained roughly the same; emissions from cars and trucks are now the primary pollutant of concern.41
As the ECO reported in our 2017 GHG Progress Report, Ontario’s Climate Act From Plan to Progress,42 substantial coal plant closures in the U.S., and the resulting improvements in air quality, have also produced huge health and economic benefits.Coal-related air pollution and GHG emissions have dropped most sharply in the nine northeastern US states who work together in North America’s first cap and trade program for GHGs, the Regional Greenhouse Gas Initiative (RGGI). The electric power sector in these states cut their coal-fired power generation from 23% of overall generation in 2007 (comparable to Ontario in 2005) to 7% by 2015, reducing their GHG emissions more than 45%.43 Since then, another coal-fired plant has closed.
As a result, air pollution in the RGGI States has been slashed, resulting in an estimated $5.7 billion in health savings and other benefits, as measured by a retrospective analysis of the impact on air quality and public health.44 Every participating state has experienced health and economic benefits from this cleaner air. Closing Ontario’s coal fired power plants likely delivered similar health benefits.
Electrification can reduce transportation-related air pollution
It is well known that smog is associated with rise in premature deaths and hospitalizations.45 Since 2004, Toronto Public Health has recognized that cars and trucks are the most significant source of air pollution in the city and that reducing these emissions, including reducing emissions from diesel vehicles, should be a priority.46 In December 2017, Toronto City Council directed its Director, Environment and Energy Division, in collaboration with the Medical Officer of Health, to develop best practices on reducing exposure to traffic-related air pollution.47 Air pollution still contributes to 1,300 premature deaths and 3,550 hospitalizations per year in Toronto.
The closer a person lives to major roadways, the more likely they will suffer adverse health effects.48 Respiratory and cardiovascular health impacts are likely most important. However, Public Health Ontario has also shown a direct correlation between traffic-related air pollution and dementia.49
In the ECO’s view, vehicle electrification (which is necessary if Ontario is to meet its climate obligations, as discussed in Q15) can also play an important role in improving local air quality and therefore public health. Toronto’s Medical Officer of Health recommended that electric vehicles should be encouraged.50 The priority focus should be on transportation corridors with high levels of ambient air pollution, and areas with sensitive receptors such as long term health care facilities and schools. These factors could be considered, when identifying locations where public charging stations might provide the most benefit. In addition to electrification, public transit and active modes of transportation will be important to reducing traffic-related air pollution.
$5.7 billion in health savings and other benefits.
194
How much did the coal shutdown reduce pollution in Ontario?
Making Connections: Straight Talk About Electricity in Ontario
Q12

Coal plant closures are not the only reason for Ontario’s improved air quality and public health.
Coal plant closures in Ontario and the U.S. are not the only reason for Ontario’s improved air quality and public health. Other key initiatives include reductions in NOx emissions due to higher emissions standards in new vehicles, stricter diesel regulations and the Drive Clean emissions control program for older vehicles; an industrial emissions trading program for SO2 and NOx, and emissions controls on smelters.51
Due to the difficulty in separating these factors, the Fraser Institute has claimed that Ontario’s coal phase-out led to minimal reductions in Ontario air pollution,52 concluding that most of the improvements were due to emissions reductions in the U.S. (largely from U.S. coal plant closures). The ECO disagrees, as this assessment ignored key variables such as secondary particulate matter formed from coal-related air emissions, which can contribute more than half the total mass of particulates. The report also ignored the benefits from reductions in mercury emissions and acid rain. In the ECO’s view, closing coal-fired plants in both countries has improved Ontario air quality and public health.
Several organizations consider the impact of Ontario’s coal closures to be significant. Toronto Public Health reported that a key initiative in improving local air quality in Toronto was shutting down the coal-fired generating stations,53 and the Ontario Government in their 2010 Long Term Energy plan quoted a 2005 study undertaken for the government, which estimated the air pollution benefits to Ontario at $3 billion per year. Sustainable Prosperity estimated that the damage from Ontario’s coal-fired generating plants (primarily due to health impacts) cost Ontario 5-10 ¢/kWh of electricity generated.54
Canada’s most complete report on the health and economic impacts of coal-fired electricity generation is Environment Canada’s 2012 Regulatory Impact Analysis Statement (RIAS). The RIAS estimated the costs and benefits of reducing (but not eliminating) pollution from all Canadian coal-fired generating stations, and calculated the health benefits alone at about $4.2 billion.55 This is in the same order of magnitude as the results from the RGGI program, as noted above.
A more comprehensive study based on actual Ontario health data could and should be performed. Ontario has very good health monitoring data, which are accessible through the Institute for Clinical Evaluative Sciences (ICES).56 Ontario should assess the impacts of the coal closures in Ontario and the United States on health outcomes for Ontarians (along with other sources of air pollution) and report the results. The relative contributions of the different sources of air pollution in Ontario affecting public health will help support further policy development.
ConclusionThe ECO applauds the substantial contribution that closing Ontario’s coal-fired power plants has made to improve the province’s air quality and public health. Moreover, Ontario’s coal plant shutdowns benefited downwind communities, and Ontario in turn, has benefited from upwind (U.S.) coal closures. The federal government’s plan to close Alberta and Saskatchewan coal-fired power plants by 2030 will also benefit Ontario’s air quality and public health,57 to a small degree. Currently in Ontario, pollutant emissions from mobile sources (cars and trucks) are the most important source of air pollution relevant to public health. Electrification of fossil fuel-based vehicles can therefore help reduce transportation-related air pollution. Policies to increase electrification of mobile sources should take public health benefits into consideration.
195Environmental Commissioner of Ontario 2018 Energy Conservation Progress Report, Volume One
How much did the coal shutdown reduce pollution in Ontario? Q12

Endnotes
1 Ontario Clean Air Alliance, Ontario’s Coal Phase Out, Lessons Learned from a Massive Climate Achievement by Brad Cundiff (Toronto: OCAA, April 2015) at 36, online: <www.cleanairalliance.org/wp-content/uploads/2015/04/CoalPhaseOut-web.pdf>.
2 B T Boadway et al., “Ontario Medical Association position paper on health effects of ground-level ozone, acid aerosols and particulate matter” (1998) 5:5 Canadian Respiratory Journal 367-384 at 378.
3 “Response to the Proposed Provincial Regulation Regarding Lakeview Generating Station”, online: Toronto Medical Officer of Health https://kperrotta2.files.wordpress.com/2012/06/tph-lakeview-air-modelling.pdf, [Accessed 8 March 2018].
4 Ontario Public Health Association, Beyond Coal: Power, Public Health and the Environment by Kim Perrotta (Toronto: OPHA, November 2002) at 5.
5 “Smog”; online: The Lung Association <www.lung.ca/news/expert-opinions/pollution/smog>. [Accessed 18 January 2018]
6 This index was adopted in June 2015, replacing the older Air Quality Index. Prior to June 2015, Ontario used the Air Quality Index to alert the public that there was poor air quality so they could take action.The index provided measurements on the following 6 pollutants: Carbon Monoxide (CO), Fine Particulate Matter (PM2.5), Nitrogen Dioxide (NO2), Ozone (O3), Sulphur Dioxide (SO2), and Total Reduced Sulphur Compounds (TRS).See: Ontario Ministry of Environment and Climate Change, “Ontario’s Experience with Air Quality Index, Smog Advisory, and Smog Alert Response Programs” (presentation, 22 March 2005) slide 2, online: <ijc.org/rel/boards/iaqab/2005workshop/attachment17.pdf>.
7 “Air Quality Ontario Frequently Asked Questions” online: Ontario Ministry of Environment and Climate Change <www.airqualityontario.com/press/faq.php#a4>. [Accessed 8March 2018]
8 “Air Quality Ontario Fine Particulate Matter”, online: Ontario Ministry of the Environment and Climate Change <airqualityontario.com/science/pollutants/particulates.php>.[Accessed 8 March 2018]
9 Volatile organic compounds are chemically active compounds that readily evaporate from such materials as gasoline, paints and cleaning solvents.This is why there is a cap on the gasoline filler at gas stations.
10 Pembina Institute, Out with the Coal, in with the New National benefits of an accelerated phase-out of coal-fired power by Benjamin Israel and Erin Flanagan, (Calgary, Pembina Institute, 2016) at 7.
11 “Great Smog of London”, online: Wikipedia <en.wikipedia.org/wiki/Great_Smog_of_London> [Accessed 8 March 2018]
12 Dr. Aaron J. Cohen et al., “Estimates and 25–year trends of the global burden of disease attributable to ambient air pollution: an analysis of data from the Global Burden of Diseases Study 2015” (2017); 389:10082 The Lancet, at 1911 .
13 Pembina Institute, Out with the coal, in with the new. National benefits of an accelerated phase-out of coal-fired power by Benjamin Israel and Erin Flanagan (Calgary, Pembina Institute, 2016)at 6.
14 Stephen Bede Scharper, “We all breathe easier in post-coal Ontario”, The Toronto Star (December 1, 2013), online: <www.thestar.com/opinion/commentary/2013/12/01/we_all_breathe_easier_in_postcoal_ontario_scharper.html>
15 Ontario Ministry of Environment and Climate Change, Air Quality in Ontario Report & Appendix 2002, (Toronto, MOECC 2002); at 6.
16 Government of Canada, Canada-United States Air Quality Agreement Progress Report 2014 (Ottawa, International Joint Commission, 2014): at Section 2
17 “How people are exposed to mercury”, online: United States Environmental Protection Agency www.epa.gov/mercury/exposure.htm [Accessed 8 March 2018].
18 “Guide to Eating Ontario Fish: advisory database” online: Ontario Ministry of Environment and Climate Change<www.ontario.ca/data/guide-eating-ontario-fish-advisory-database> [Accessed 8 March 2018].
19 Environmental Commissioner of Ontario, Good Choices, Bad Choices, Environmental Rights and Environmental Protection in Ontario, 2017 Annual Environmental Protection Report, Chapter 3 (Toronto: ECO, October 2017).
20 Ontario Public Health Association, Beyond Coal: Power, Public Health and the Environment by Kim Perrotta, (Toronto, OPHA, 2002) at 10.
21 Ibid
22 CBC News, “Coal burning in Mississauga to end by 2005”,CBC News, (27 March, 2001); online: <www.cbc.ca/news/canada/coal-burning-in-mississauga-to-end-by-2005-1.261016>
23 Ontario Clean Air Alliance, Ontario’s Coal Phase Out, Lessons Learned from a Massive Climate Achievement by Brad Cundiff (Toronto: OCAA, April 2015) at 14.
24 “The End of Coal – An Ontario Primer on Modernizing Electricity Supply”, online: Government of Ontario<www.ontario.ca/page/end-coal> [Accessed 8 March 2018].
25 Independent Electricity System Operator, “Ontario Planning Outlook, Module 6: Emissions Outlook”, (presentation,August 2016) slide 13, online: <www.ieso.ca/-/media/files/ieso/document-library/planning-forecasts/ontario-planning-outlook/module-6-emissions-outlook-20160901-pptx.pptx?la=en>.
26 Technologies installed included: electrostatic precipitators, the use of low-sulfur coal, and low NOX burners at most units, selective catalytic reduction on two of Nanticoke’s eight boilers and two of Lambton’s four boilers (these remove NOx from the flue gases), and flue gas desulphurization on two units at Lambton. See: Carleton University, Options for Coal-Fired Power Plants in Ontarioby Professor J.T Rogers (27 September, 2004) at Table 2, online: <www.cns-snc.ca/media/media/CNS_Position_Papers/Ontario_coal.pdf>, [Accessed January 28, 2018].
27 Ibid at 10.
28 Ontario Public Health Association, “Beyond Coal: Power, Public Health and the Environment”, by Kim Perrotta (Toronto, OPHA, 2002) at 33.
29 Ontario Ministry of the Environment, Coal Fired Electricity Generation in Ontario (Toronto, 2001) at table 6.
30 Toronto Public Health, Path To Healthier Air: Toronto Air Pollution Burden of Illness Update by Stephanie Gower et al., (Toronto, Toronto Public Health,2014) at 18.
31 Ontario Ministry of Environment and Climate Change, Air Quality in Ontario 2015 Report (Toronto, Government of Ontario, 2015) at 6.
196
.
.
.
.
.
.
.
.
.
.
.
.
.
.
.
.
.
.
.
.
.
.
.
.
.
.
.
.
.
.
.
How much did the coal shutdown reduce pollution in Ontario?
Making Connections: Straight Talk About Electricity in Ontario
Q12

32 If a high risk Air Quality Health Index value is forecast to last for 1 – 2 hours, then a Special Air Quality Statement will be issued. If it is forecast to last for at least 3 hours then a Smog and Air Health Advisory (SAHA) is issued. There were 7 Special Air Quality Statements issued in 2015, 10 in 2016, and 7 in 2017, but only one Smog and Air Health Advisory, in 2016, which lasted approximately 3 hours and was located in the City of Toronto.Public Health Ontario undertook a comparative review of the two indices – Air Quality Index (AQI) and Air Quality Health Index (AQHI), as there were concerns about how the two indices were calculated. In comparing the two, they found that the AQHI was more closely correlated to the mixture of air pollutants than the AQI. However, neither index recognize possible health effects from chronic exposure to air pollution. Exposure to air pollution from traffic is now becoming more important. See: Public Health Ontario, Review of Air Quality Index and Air Quality Health Index, by Hong Chen and Ray Copes (Toronto, PHO, 2013) at 3.
33 In 2003, ozone alone was responsible for 5 smog days, ozone and fine particulate matter were responsible for 6 additional smog days, and fine particulate matter alone was responsible for 1 additional smog day. In total for 2003 there were 19 smog days and the ECO is not sure why there is this difference. Source: Ontario Ministry of Environment and Climate Change, “Ontario’s Experience with Air Quality Index, Smog Advisory, and Smog Alert Response Programs” (presentation, 22 March 2005) slide 10 online:<www.ijc.org/rel/boards/iaqab/2005workshop/attachment17.pdf>
34 Ontario Ministry of Health and Long Term Care, Ontario Climate Change and Health Modelling Study by William Gough et al. (Toronto, University of Toronto,2016), at 12.
35 Ontario Ministry of Environment and Climate Change, Air Quality in Ontario 2015 Report, (Toronto, MOECC, 2015) at 19. Note that the reduction in mercury emissions is from a starting year of 2000, whereas the starting year is 1990 for the other two pollutants.
36 Pembina Institute, Out with the coal, in with the new. National benefits of an accelerated phase-out of coal-fired power by Benjamin Israel and Erin Flanagan (Calgary, Pembina Institute, 2016) at 7.
37 Ibid, at 16-18
38 Ontario Ministry of Environment and Climate Change, Transboundary Air Pollution in Ontario by Dr. David Yap et al., (Toronto, MOECC, 2005), at ii.
39 The Southern Ontario Oxidant Study (SONTOS) compared ozone levels northeast and southwest of Toronto at two sites, Binbrook and Hastings, and showed how ozone levels downwind are formed by local wind directions. However, the Binbrook site had about a 20 ppb elevated levels of ozone over that of Hastings, resulting from the influx of polluted air from the US. This study showed how far ozone pollution could travel as part of the lake breeze effect, much further than previously thought, and impacting the greater proportion of the Ontario population. York University, Centre for Atmospheric Chemistry, “The Southern Ontario Oxidant Study –SONTOS An Overview”(Toronto, York University, 1997), online: <www.cac.yorku.ca/sontos/> [Accessed 16 January 2018] and also; Natural Sciences Unit, Ontario Hydro Technologies and Department of Chemistry and Centre for Atmospheric Chemistry, York University, Observations of Ozone and Precursor Levels At Two Sites Around Toronto, Ontario During SONTOS 92, by Pascal Roussel et al. online: <yorkspace.library.yorku.ca/xmlui/bitstream/handle/10315/4147/HAS038.pdf?sequence=1> [Accessed 16 January 2018].
40 Toronto Public Health, Path to Healthier Air: Toronto Air Pollution Burden of Illness Update by Stephanie Gower et al., (Toronto, TPH, 2014) at 2.
41 Peter Goffin, “Despite gains, Toronto’s air pollution still causing serious health problems”, The Toronto Star (10 March 2017), online: <www.thestar.com/news/gta/2017/03/10/despite-gains-torontos-air-pollution-still-causing-serious-health-problems.html>
42 Environmental Commissioner of Ontario, Ontario’s Climate Act From Plan to Progress, Annual Greenhouse Gas Progress Report 2017, (Toronto: ECO, January 2018).
43 The Regional Greenhouse Gas Initiative, The Investment of RGGI Proceeds in 2015, by RGGI Inc. (2017), at 3
44 Abt Associates, News Release, “Regional Greenhouse Gas Initiative Improves Health, Saves Lives, and Generates $5.7 Billion in Benefits,” (17 January 2017).
45 Ontario Public Health Association, Beyond Coal: Power, Public Health and the Environment by Kim Perrotta (Toronto: OPHA, November 2002) at 19.
46 Toronto Public Health, Path to Healthier Air: Toronto Air Pollution Burden of Illness Update by Stephanie Gower et al., (Toronto, TPH, 2014) at i.
47 Toronto Medical Officer of Health and Deputy City Manager, Internal Corporate Services, Reducing Health Risks from Traffic-Related Air Pollution (TRAP) in Toronto, (Toronto, TPH, 2017) at 2.
48 To help minimize these health effects, public policies could be implemented, such as: encouraging more people to use public transport, increased electrification of vehicles, and ensuring vulnerable receptors such as long-term healthcare facilities and daycares are not located close to busy roadways.
49 Hong Chen et al. “Living near major roads and the incidence of dementia, Parkinsons’s disease and multiple sclerosis: a population-based cohort study”, (2017) 389:10070 The Lancet at 718–726.
50 Toronto Medical Officer of Health and Deputy City Manager, Internal Corporate Services, Reducing Health Risks from Traffic-Related Air Pollution (TRAP) in Toronto, (Toronto, TPH, 2017) at 1.
51 Ontario Ministry of Environment and Climate Change, Air Quality in Ontario 2015 Report, (Toronto, MOECC, 2015) at iii.
52 The Fraser Institute, Did the Coal Phase-out Reduce Ontario Air Pollution? by Ross McKitrick and Elmira Aliakbari (Vancouver, The Fraser Institute, 2017) at 19.
53 Toronto Public Health, Path to Healthier Air: Toronto Air Pollution Burden of Illness Update by Stephanie Gower et al., (Toronto, TPH, 2014) at 20.
54 Sustainable Prosperity, What is Happening to Ontario Electricity Prices? by Donald Dewees (Ottawa, University of Ottawa, 2012) at 9.
55 Reduction of Carbon Dioxide Emissions from Coal-fired Generation of Electricity, C Gaz 2012 II 2055 (Canadian Environmental Protection Act 1999)
56 Institute for Clinical Evaluation Sciences, is a not-for-profit research institute and which includes access to an array of Ontario’s health-related data, web site <https://www.ices.on.ca/About-ICES>.
57 Pembina Institute, Out with the Coal, in with the New. National benefits of an accelerated phase-out of coal-fired power by Benjamin Israel and Erin Flanagan, (Calgary, Pembina Institute, 2016) at 18.
.
.
.
.
.
.
.
.
.
.
.
.
.
.
.
.
.
.
.
.
.
.
.
.
.
.
197Environmental Commissioner of Ontario 2018 Energy Conservation Progress Report, Volume One
How much did the coal shutdown reduce pollution in Ontario? Q12

2005
O N TA R I O ’ S E L E C T R I C I T Y F U T U R E
Q U ES T I O N 13
What does the 2017 Long-Term Energy Plan propose for Ontario’s electricity future?
Not much new generation, and electricity costs will be moderated, but the Long-Term Energy Plan is not consistent with Ontario’s climate obligations.
The 2017 Long-Term Energy Plan makes no commitments to new electricity supplies, but does recommit to refurbishing nuclear plants and continuing conservation. Future electricity supply needs are to be met through market-based auctions. Near-term electricity bills will be lower than previously forecast, due largely to the Fair Hydro Plan.
The Plan does not assess the energy use or emissions of other forms of energy such as natural gas, gasoline, and diesel. It assumes low levels of fuel switching away from fossil fuels to electricity. This would likely make it impossible for Ontario to meet its greenhouse gas reduction obligations.

199Environmental Commissioner of Ontario 2018 Energy Conservation Progress Report, Volume One
What does the 2017 Long-Term Energy Plan propose for Ontario’s electricity future? Q13
Contents
THE DETAILS . . . . . . . . . . . . . . . . . . . . . . . . . . . . . . . . . . . . . . . . . . . . . . . . . . . . . . . . . . . . . . . . . . 200
Introduction . . . . . . . . . . . . . . . . . . . . . . . . . . . . . . . . . . . . . . . . . . . . . . . . . . . . . . . . . . . . . . . . . . . 200
No new electricity supply commitments . . . . . . . . . . . . . . . . . . . . . . . . . . . . . . . . . . . . . . . . . . . . 200
Market mechanisms will meet future electricity needs. . . . . . . . . . . . . . . . . . . . . . . . . . . . . . . . . 201
Lower electricity bills . . . . . . . . . . . . . . . . . . . . . . . . . . . . . . . . . . . . . . . . . . . . . . . . . . . . . . . . . . . 202
Not a comprehensive energy plan . . . . . . . . . . . . . . . . . . . . . . . . . . . . . . . . . . . . . . . . . . . . . . . . . 204
Encouraging steps towards balancing the grid . . . . . . . . . . . . . . . . . . . . . . . . . . . . . . . . . . . . . . . 205
ECO comment . . . . . . . . . . . . . . . . . . . . . . . . . . . . . . . . . . . . . . . . . . . . . . . . . . . . . . . . . . . . . . . . . 205
Endnotes . . . . . . . . . . . . . . . . . . . . . . . . . . . . . . . . . . . . . . . . . . . . . . . . . . . . . . . . . . . . . . . . . . . . . 209

The details…
IntroductionThe Ministry of Energy’s 2017 Long-Term Energy Plan (LTEP), Delivering Fairness and Choice, released in October 2017, sets the high-level policy direction for Ontario’s electricity future. The LTEP’s planning horizon is 20 years, but its focus is mainly on initiatives and policies that will be implemented within the next 3 years.
The clear priority in the LTEP is lowering near-term electricity prices, ignoring the transformation that will be needed in Ontario’s energy sector in the next 10-20 years. Should the LTEP’s projection of no significant increase in overall electricity use (including low levels of fuel switching away from fossil fuels to electricity) in the next 20 years come to pass, it will almost certainly mean that Ontario will break its climate law (the
Climate Change Mitigation and Low-carbon Economy Act, 2016) and miss its 2030 greenhouse gas (GHG) emissions reduction target.
No new electricity supply commitmentsThe most notable aspect of the 2017 Long-Term Energy Plan is that, unlike both previous LTEPs, it makes no commitments to new electricity supplies. The ministry defers decisions on new electricity resources, concluding that Ontario will not face a gap between supply and peak demand until roughly 2023, after several units at Pickering nuclear station are retired.
Figure 13.1. Long-Term Energy Plan electricity supply and demand outlook.
Source: Ontario Ministry of Energy, Ontario’s Long-Term Energy Plan 2017: Delivering Fairness and Choice (Ontario: Queen’s Printer, 2017) at 37.
35,000
2017
2018
2019
2020
2021
2022
2023
2024
2025
2026
2027
2028
2029
2030
2031
2032
2033
2034
2035
30,000
25,000
20,000
15,000
10,000
5,000
Existing Capacity
Cap
acity
Con
trib
utio
n at
Sum
mer
Pea
k (M
W)
Committed. Not Yet In-Service Directed Procurements
Expired Contracts Demand Outlook
0
Capacity gap
No commitments to new electricity supplies.
200 Making Connections: Straight Talk About Electricity in Ontario
Q13

The LTEP’s supply forecast includes generation facilities contracted for but not yet in service (these are shown as “Committed, Not Yet In-Service” in Figure 13.1).1
The 2017 LTEP’s prescriptions for each type of electricity resource are as follows:
• Nuclear: Nuclear refurbishment will be completed at both the Darlington and Bruce nuclear stations (10 nuclear units in total, representing 9,800 MW) to extend the working lives of these stations by nearly 40 more years.2 The Pickering nuclear station, previously scheduled to close in 2020, will keep all six active reactors running until 2022, and four of these six until 2024. As all three of these stations were in service in 2016, these decisions preserve, but do not expand, the role of nuclear in Ontario’s electricity supply. The government announced these decisions prior to the LTEP. They have significant implications for Ontario’s future supply mix and are examined in Q14.
• Renewables: Renewable electricity projects that have already been awarded contracts but are not yet in-service (1,911 MW as of mid-2017) will proceed to completion.3 No additional renewable electricity contracts will be awarded until further notice. The government will permit electricity customers to install small renewable energy projects (most likely solar) for their own use to offset part of their own electricity costs (“net metering”). No target for net metering is set (or included in supply forecasts). Q18 explores the implications of the new net metering policies.
• Conservation and demand response: The long-term conservation target remains at 30 TWh of conservation by 2032. This suggests that conservation program activity and funding would remain at roughly current levels throughout that time. However, the current budget and framework go only to the end of 2020, and no decision on conservation spending beyond 2020 has yet been made. “Conservation” in the current conservation
framework has been redefined to include infrastructure improvements by electric utilities that reduce electricity losses, and to exclude gas-fired combined heat and power projects installed by electricity customers that reduce consumption from the grid.4
For demand response, (an important subcategory of conservation that is used to reduce peak electricity demand), the LTEP states that “demand response capacity realized each year will depend on system needs and the competitiveness of demand response with other resources.”5 This is a change from the 2013 LTEP, which had an explicit goal of using demand response to meet 10% of peak demand by 2025 (approximately 2,500 MW of demand response).6 Q19 examines the future of conservation, and Q17 looks at demand response as part of the Market Renewal initiative.
• Natural gas: Natural gas projects (including combined heat and power) that have already been awarded contracts but are not yet in-service (roughly 1,300 MW in total) will proceed to completion, but no additional contracts will be awarded until further notice.7
Market mechanisms will meet future electricity needs The 2017 LTEP states that future electricity capacity needs will be met through market-based auction mechanisms, under the banner “Market Renewal”. This may result in yearly auctions to procure additional supply, in contrast to the province’s previous approach of long-term fixed-price contracts. The government
-
“Conservation” has been redefined.
201Environmental Commissioner of Ontario 2018 Energy Conservation Progress Report, Volume One
What does the 2017 Long-Term Energy Plan propose for Ontario’s electricity future? Q13

hopes that this approach will achieve significant cost savings and enable system flexibility. How the Market Renewal model might work, and its implications for Ontario’s electricity supply and GHG emissions, are examined in Q17.
Lower electricity billsThe 2017 LTEP forecasts lower electricity bills, both in comparison to 2016 bills, and to forecasts in previous LTEPs (Figure 13.2).
Figure 13.2. Long-Term Energy Plan residential electricity bill forecast.
Note: Part of the reason for the lower bill forecast is that the 2017 LTEP assumes less electricity consumption (750 kWh) to calculate the monthly cost of an Ontarian’s bill; the previous LTEPs used 800 kWh.
Source: Ontario Ministry of Energy, Ontario’s Long-Term Energy Plan 2017: Delivering Fairness and Choice (Ontario: Queen’s Printer, 2017) at 27.
These lower predicted electricity bills are due to lower consumer electricity use, combined with some real cost savings and large cost transfers from current electricity ratepayers to either taxpayers or future ratepayers.
The first reason for the predicted lower residential power bills is that the 2017 LTEP assumes that an average Ontario household will buy only 750 kWh/month of electricity, the amount that the Ontario Energy Board (OEB) now considers to represent current average household use. The previous two LTEPs assumed that each household would buy 800 kWh/month, the OEB’s previous household average. This difference likely explains much of the longer-term difference in bill forecasts between the 2013 and 2017 LTEPs.
2010
2011
2012
2013
2014
2015
2016
2017
2018
2019
2020
2021
2022
2023
2024
2025
2026
2027
2028
2029
2030
2031
2032
2033
2034
2035
100
150
200
250
2010 LTEP (800 kWh) 2013 LTEP (800 kWh)
2017 LTEP (750 kWh)
Mon
thly
Res
iden
tial B
ill (N
omin
al $
)
Lower predicted electricity bills are due to lower consumer electricity use, combined with some real cost savings and large cost transfers from current electricity ratepayers to either taxpayers or future ratepayers.
202
What does the 2017 Long-Term Energy Plan propose for Ontario’s electricity future?
Making Connections: Straight Talk About Electricity in Ontario
Q13

The sharp temporary drop in residential bills over the next five years, prominently noted in the 2017 LTEP and shown in Figure 13.2, is almost entirely due to cost transfers, not real savings. It is the result of decisions in the province’s Fair Hydro Plan to:
1. pay some of the current costs of the electricitysystem with borrowed money (to be recovered withinterest from future electricity ratepayers), and
2. use taxes (instead of electricity rates) to pay fora rebate on electricity bills equal to the provincialportion of the Harmonized Sales Tax, and toprovide targeted relief for some groups of electricitycustomers.8
These measures move about 20% of the cost of operating the electricity system off the bills of current electricity ratepayers, but they do not reduce these costs.9 Instead, as the Financial Accountability Office reported, between now and 2045 (by which time all of the borrowed funds will have been repaid), the Fair Hydro Plan will add roughly $21 billion in extra interest charges to the cost of Ontario electricity.10
To separate the cost impact of the LTEP’s supply and demand projections from the Fair Hydro Plan’s policy choices regarding how Ontario pays these costs, the real projected cost of operating the electricity system, per unit of electricity, is shown in Figure 13.3. This cost is not affected by the Fair Hydro Plan’s decisions to move some costs to taxpayers, or to future ratepayers, and also does not include the $21 billion in interest on borrowed money that will have to be paid because of the Fair Hydro Plan.
Figure 13.3. Projected unit cost of Ontario’s electricity (2017-2035, real $2017, ¢/kWh), without interest charges.
Source: Ontario Ministry of Energy, information provided to the ECO in response to ECO inquiry (March 2018).
The sharp temporary drop in residential bills over the next five years is almost entirely due to cost transfers, not real savings.
$0.14
$0.12
$0.08
$0.09
$0.10
$0.11
$0.12
$0.13
$0.14
$0.15
$0.16
2017
2018
2019
2020
2021
2022
2023
2024
2025
2026
2027
2028
2029
2030
2031
2032
2033
2034
2035
Unit
cost
of e
lect
ricity
ser
vice
(cen
ts/k
ilow
att-h
our,
real
201
7 do
llars
)
203Environmental Commissioner of Ontario 2018 Energy Conservation Progress Report, Volume One
What does the 2017 Long-Term Energy Plan propose for Ontario’s electricity future? Q13

As shown in Figure 13.3, the LTEP predicts a drop of 13% in average cost of service, in contrast to the increase experienced between 2006 and 2016 ( Q8), assuming that little new supply will be needed because of low electricity demand, and also that current solar, wind and natural gas generation units will provide much cheaper power after their current contracts expire.
The 2017 LTEP claims that it will save about $28 billion in real system costs (on a net present value basis over the 20-year planning horizon) by cancelling or deferring planned electricity supply projects that were identified in previous LTEPs but have not been needed due to the drop in demand. Examples include cancelling the second round of the Large Renewable Procurement, and delaying the Bruce nuclear refurbishment.11 Delaying this refurbishment does not reduce its total costs, but does reduce the percentage of those costs that will have to be paid in the next 20 years.
The LTEP also assumes that existing projects whose contracts will expire before 2035 will continue to deliver electricity, but at lower prices. These resources are shown as “Expired Contracts” in Figure 13.1. This seems like a reasonable assumption. As existing electricity contracts for natural gas and renewables expire, the owners of these facilities should be willing to bid into the Market Renewal auctions to supply electricity at a much lower price, since some or all of the capital costs of their assets will have been paid. Solar and wind, in particular, will have very low operating costs, and may be able to provide cheap power.
The LTEP’s electricity cost projections are closely linked to its assumption that electricity demand will remain flat. The LTEP projects annual Ontario electricity demand of 145 TWh in 2030, almost unchanged from 2016 (143 TWh).12 The LTEP does not assess how system costs would change if demand rises and new electricity supply resources are needed.13
Not a comprehensive energy planThe LTEP does not consider Ontario’s use, or GHG emissions from, energy sources other than electricity. It notes only that “the outlook for the supply and demand of [other] fuels will depend on policy and program decisions over the next 20 years, as well as on technological innovation and adoption”.14
The LTEP’s electricity demand forecast assumes that only a modest degree of electrification of other energy uses such as transportation and heating will occur in the next 20 years.15 The LTEP takes only very limited steps to make a higher-electrification future possible (e.g., incentives for electric heat pumps, and a commitment to better integrate electric vehicles on the distribution grid),16 and sets no quantitative goals for electrification. Q15 demonstrates that much greater electrification (on the order of an increase of 1/3 in overall electricity use by 2030) will be needed for Ontario to meet its GHG emission reduction obligations.
The LTEP predicts a drop of 13% in average cost of service, assuming that little new supply will be needed and that current solar, wind and natural gas generation units will provide much cheaper power after their current contracts expire.
204
What does the 2017 Long-Term Energy Plan propose for Ontario’s electricity future?
Making Connections: Straight Talk About Electricity in Ontario
Q13

Encouraging steps towards balancing the gridA strength of the 2017 LTEP is its recognition that more needs to be done to balance the fluctuations in electricity supply and demand that occur each day. The LTEP makes commitments to tackle this problem from multiple avenues, including:
• A pilot to use surplus electricity to produce hydrogen, which can be converted back to electricity at times of high demand
• Removing regulatory barriers to electricity storage
• Doing more to match the price of electricity to supply, i.e. to strongly encourage electricity use when supply is plentiful, and discourage use when supply is scarce, and
• Facilitating utility investment in smart electric vehicle charging, to shift charging to off-peak times of day for the benefit of both customers and utilities.
These policies, and other ways to balance supply and demand, are discussed in Q16.
ECO commentThe 2017 LTEP’s choice to largely ignore Ontario’s use or GHG emissions from energy sources other than electricity is a critical failure that ignores the essential role of electrification in reducing emissions from the energy sector as a whole. In the ECO’s view, it is also a clear breach of the legal requirement that the LTEP cover Ontario’s energy needs, not just the 20% of that energy that comes from electricity.
RECOMMENDATION: The Ministry of Energy should amend the Electricity Act, 1998 (section 25.29(2)(e)), to require the Long-Term Energy Plan to align greenhouse gas emissions from the energy sector (all energy sources) with the government’s climate obligations under the Climate Change Mitigation and Low-carbon Economy Act, 2016.
RECOMMENDATION: Ontario’s Long-Term Energy Plan should comply with the Electricity Act, 2017 and plan Ontario’s entire energy system, not merely electricity.
In 2016, the ECO’s special report, Developing the 2017 Long-Term Energy Plan, made 14 recommendations, emphasizing: integrating the energy plan with Ontario’s climate targets, assessing the environmental impacts of energy use, putting conservation first, applying evidence-based decision-making, and providing opportunities for meaningful public participation. In general, the ECO’s recommendations were not well addressed in the 2017 LTEP, as shown in Table 13.1, and the government has provided no rationale for failing to address these recommendations.
The 2017 LTEP’s choice to largely ignore energy sources other than electricity is a critical failure.
205Environmental Commissioner of Ontario 2018 Energy Conservation Progress Report, Volume One
What does the 2017 Long-Term Energy Plan propose for Ontario’s electricity future? Q13

Table 13.1. Summary of ECO recommendations for the 2017 Long-Term Energy Plan and how they were addressed.
ECO Recommendation Addressed in 2017 LTEP?
Details
Enable Ontario to meet its climate change targets.
Plan for an energy supply mix that enables Ontario to achieve its greenhouse gas targets.
No The LTEP focuses on electricity, and omits energy and greenhouse gas emissions forecasts for other energy sources. Action on reducing emissions from fuels will be dependent on other policies – as the LTEP notes that “the outlook for the supply and demand of fuels will depend on policy and program decisions over the next 20 years, as well as on technological innovation and adoption.” (p. 42)
Address the risk of increased greenhouse gas emissions from customers choosing natural gas over electricity for cost reasons.
No This ECO recommendation was primarily aimed at overcoming the cost barrier to electrifying space heating. The LTEP notes that Ontario will aim to increase the use of heat pumps for heating and cooling, through the Green Ontario Fund (p. 115). However, the “deep electrification” scenarios (outlooks C, D, E, F) found in the technical planning reports, and the consequences on electricity demand and cost, are not mentioned in the final LTEP, and no roadmap is laid out to get a higher-electrification future.
Consider the environmental impacts of energy resources on our air, water, and land.
Minimize the environmental impacts of Ontario’s energy system.
No The LTEP makes no commitment to examine the environmental impacts of energy supply resources on land, air, and water in an integrated fashion.
Commit the government of Ontario to meaningfully participate in the federal approvals process for energy projects with a significant impact on Ontario’s environment.
Partially The LTEP notes that “to ensure its strategic interests in pipeline projects are represented, the government will continue to participate in regulatory proceedings at the NEB [National Energy Board] and at intergovernmental forums that discuss the delivery of energy in a safe and environmentally sustainable manner. Ontario is also working with the federal government on regulatory initiatives such as modernizing the NEB to ensure major energy projects are reviewed in a predictable manner that increases public confidence.” (p. 147)
However, the ECO recommendation was also intended to apply to Ontario participation in federal oversight of nuclear projects. The only LTEP reference is that “the CNSC [Canadian Nuclear Safety Commission] will ensure that Pickering operates safely” (until 2024) (p. 51).
206
What does the 2017 Long-Term Energy Plan propose for Ontario’s electricity future?
Making Connections: Straight Talk About Electricity in Ontario
Q13

Put conservation first.
Demonstrate to the public that all feasible conservation opportunities are exhausted before building new energy infrastructure.
Not explicitly The LTEP makes no explicit commitments to new supply infrastructure. In theory, this could be addressed in the future as part of the Independent Electricity System Operator’s (IESO’s) Market Renewal initiative, if conservation is given a “fair chance” to compete with generation in Market Renewal.
Improve the methodology for comparing energy conservation with energy supply.
No The LTEP does not go into this level of detail, however, work is being done through the Conservation Mid-Term Review, including adjusting the value assigned to greenhouse gas emissions reductions and other non-energy benefits.
Set conservation targets for all energy sources.
No Conservation targets for other fuels are not mentioned.
Ensure that regional planning puts conservation first and is effectively integrated with other levels of energy planning.
Yes The LTEP recognizes that “in order to increase the range of cost-effective solutions [in regional planning], barriers to non-wires solutions such as conservation, demand response and other distributed energy resources must be reduced” (p. 139). A subsequent LTEP 2017 implementation directive requests the IESO to “identify barriers to the implementation of cost effective non-wires solutions such as conservation and demand management and distributed energy resources, and provide options to address any such barriers, including potential legislative or regulatory changes, as well as options to address local distribution company capacity; and propose approaches for improving the integration of regional planning with bulk system, distribution and community energy planning, and approaches to ensure alignment with market-based approaches”.17
Apply evidence-based decision-making.
Provide detailed plans to hedge against energy supply risks associated with nuclear refurbishment and license extension.
No The LTEP notes the province’s ability to apply “off-ramps” for nuclear refurbishment due to cost or scheduling (pp. 50-51), but does not discuss implications for how alternative supply would be sourced if the province exercises these off-ramps. It is fair to assume that the IESO would rely on its future energy auction system to respond to any future gaps in supply.
207Environmental Commissioner of Ontario 2018 Energy Conservation Progress Report, Volume One
What does the 2017 Long-Term Energy Plan propose for Ontario’s electricity future? Q13

Compare all options to balance supply and demand in the electricity system, not just natural gas.
Yes The LTEP commits to further exploring the role of using surplus electricity to produce hydrogen to inject and reduce the carbon emissions of Ontario’s natural gas grid (p. 75). It also looks at other ways of balancing electricity supply and demand, including: • removing regulatory barriers for companies providing
electricity storage (p. 61) (one barrier, the application of the Global Adjustment charge for storage facilities, has already been removed through regulation)
• working with the Ontario Energy Board (OEB) to enable smart timing of charging of electric vehicles (p. 61) and
• supporting the OEB’s actions to test different time-of-use price structures, including a commitment to look at some equivalent of time-of-use pricing for larger customers (p. 56)
Before subsidizing expansion of the natural gas distribution system, publicly compare costs and benefits of alternatives such as conservation and clean energy technologies.
No The LTEP renews the government’s commitment to natural gas system expansion, including its Natural Gas Grant program to pay some of the infrastructure costs (p. 135).
Provide opportunities for meaningful public participation.
Consult the public on a detailed draft Long-Term Energy Plan.
No No draft LTEP was released.
Consult the public on implementation directives/plans.
Partial Implementation directives to the IESO and the OEB were released without public consultation, with a request for implementation plans to be submitted by these agencies by January 31, 2018. The IESO conducted public consultations as it developed its implementation plan; the OEB did not. The Ministry of Energy has approved both plans without any additional consultation.
Do not override the Long-Term Energy Plan and its approved implementation plans in between the three-year review cycle.
TBD
208
What does the 2017 Long-Term Energy Plan propose for Ontario’s electricity future?
Making Connections: Straight Talk About Electricity in Ontario
Q13

Endnotes
1 However, projected savings from future conservation programs show up as a drop in the demand outlook, not as “committed” supply.
2 Ontario Ministry of Energy, Ontario’s Long-Term Energy Plan 2017: Delivering Fairness and Choice (Ontario: Queen’s Printer, 2017) at 45.
3 Independent Electricity System Operator, A Progress Report on Contracted Electricity Supply, Second Quarter 2017 (Ontario: IESO, 18 September 2017) at 11, online: <www.ieso.ca/-/media/files/ieso/document-library/contracted-electricity-supply/progress-report-contracted-supply-q22017.pdf?la=en>.
4 Ontario Ministry of Energy, Ontario’s Long-Term Energy Plan 2017: Delivering Fairness and Choice (Ontario: Queen’s Printer, 2017) at 104.
5 Ibid at 114.
6 Ontario Ministry of Energy, Achieving Balance: Ontario’s Long-Term Energy Plan (Ontario: Queen’s Printer, 2013) at 23.
7 Two large gas plants (1,214 MW), plus 14 combined heat and power projects (85 MW), had been awarded contracts but were not yet in commercial operation, as of mid-2017 (Independent Electricity System Operator, A Progress Report on Contracted Electricity Supply, Second Quarter 2017 (Ontario: Independent Electricity System Operator, 18 September 2017) at 11, online: <www.ieso.ca/-/media/files/ieso/document-library/contracted-electricity-supply/progress-report-contracted-supply-q22017.pdf?la=en>). This is in addition to an unknown number of combined heat and power projects that will not be contracted but could receive capital incentives through conservation programs, if applied for before July 1, 2018.
8 A full assessment of the fiscal impact of the Fair Hydro Plan on taxpayers and ratepayers has been conducted by the Financial Accountability Office of Ontario. Financial Accountability Office of Ontario, An Assessment of the Fiscal Impact of the Province’s Fair Hydro Plan (Toronto: FAO, Spring 2017).
9 In 2020, the Ministry of Energy estimates the total cost of electricity service at $20.5 billion, $4.1 billion of which will be funded by taxes or deferred, instead of paid for by current ratepayers, due to the Fair Hydro Plan. (Ontario Ministry of Energy, information provided to the ECO in response to ECO inquiry (1 March 2018)).
10 Financial Accountability Office of Ontario, An Assessment of the Fiscal Impact of the Province’s Fair Hydro Plan (Toronto: FAO, Spring 2017) at 1. However, the Fair Hydro Plan will provide savings to electricity ratepayers of $24 billion over the life of the Plan. This is because of the cost transfers from ratepayers to taxpayers of $45 billion over the Plan’s 29-year life, particularly the rebate on the provincial portion of the HST, which is assumed to be permanent, and represents a $42 billion transfer.
11 The government estimates $15 billion in savings from avoiding new nuclear construction, at least $3 billion in savings from reductions in renewable energy prices and a return to competitive procurement for large renewables, up to $3.8 billion in savings from cancelling the second round of Large Renewable Procurement, $3.7 billion in savings from renegotiating renewable energy contracts with Samsung, $1.7 billion in savings from delaying the Bruce refurbishment until 2020, and as much as $600 million in savings from continued operation of Pickering station until 2024. Ontario Ministry of Energy, Ontario’s Long-Term Energy Plan 2017: Delivering Fairness and Choice (Ontario: Queen’s Printer, 2017) at 20.
12 Ontario Ministry of Energy, information provided to the ECO in response to ECO inquiry (1 March 2018).
13 The IESO had previously modeled the cost impact of scenarios with different levels of electricity demand. Independent Electricity System Operator, “Module 7: Electricity System Cost Outlook” (presentation, August 2016).
14 Ontario Ministry of Energy, Ontario’s Long-Term Energy Plan 2017: Delivering Fairness and Choice (Ontario: Queen’s Printer, 2017) at 40.
15 Ibid at 37.
16 Ontario Ministry of Energy, Ontario’s Long-Term Energy Plan 2017: Delivering Fairness and Choice (Ontario: Queen’s Printer, 2017) at 61-62 (electric vehicles) and 115 (heat pumps).
17 Directive from Ontario Minister of Energy to the Independent Electricity System Operator, (untitled) (26 October 2017), online: <www.ieso.ca/-/media/files/ieso/document-library/ministerial-directives/2017/directive-2017-ltep-20171026.pdf?la=en>..
.
.
.
.
.
.
.
.
.
.
.
.
.
.
.
.
209Environmental Commissioner of Ontario 2018 Energy Conservation Progress Report, Volume One
What does the 2017 Long-Term Energy Plan propose for Ontario’s electricity future? Q13

2005
Q U ES T I O N 14
What are the consequences of the Long-Term Energy Plan’s commitment to nuclear power?
If everything goes as planned, nuclear refurbishment of Bruce and Darlington will provide a large amount of low-carbon electricity at a reasonable cost, compared to current alternatives.
Nuclear power has risks that Ontario must balance against Ontario’s share of the grave consequences of climate change. In a future where much of our energy use will need to come from electricity, Ontario needs to consider all low-carbon electricity sources, including nuclear.
Nuclear refurbishment appears to be in Ontario’s best interests today. However, the commitment period is almost 50 years. During that time, renewables and storage are expected to become much cheaper, and conservation must also play a larger role. Ontario’s large, long-term commitment to nuclear may restrict Ontario from taking full advantage of conservation and renewables.
To some degree, economies of scale lock in the province to completing the refurbishment process that it has launched, but Ontario can re-evaluate its need for future refurbishments before giving the final go-ahead, particularly the Bruce units that are scheduled for the late 2020s.
It is not clear whether the plan to extend operations at the Pickering station from 2020 to 2024 still makes sense.
O N TA R I O ’ S E L E C T R I C I T Y F U T U R E

Contents
THE DETAILS . . . . . . . . . . . . . . . . . . . . . . . . . . . . . . . . . . . . . . . . . . . . . . . . . . . . . . . . . . . . . . . . . . 212
Environmental concerns with nuclear power . . . . . . . . . . . . . . . . . . . . . . . . . . . . . . . . . . . . . . . . 213
Nuclear waste and decommissioning . . . . . . . . . . . . . . . . . . . . . . . . . . . . . . . . . . . . . . . . . . . . . . . 213
Nuclear accidents . . . . . . . . . . . . . . . . . . . . . . . . . . . . . . . . . . . . . . . . . . . . . . . . . . . . . . . . . . . . . 214
Financial cost of nuclear refurbishment . . . . . . . . . . . . . . . . . . . . . . . . . . . . . . . . . . . . . . . . . . . . 215
What if things don’t go smoothly?. . . . . . . . . . . . . . . . . . . . . . . . . . . . . . . . . . . . . . . . . . . . . . . . . . 216
Financial risks the FAO considered . . . . . . . . . . . . . . . . . . . . . . . . . . . . . . . . . . . . . . . . . . . . . . . . . 216
Financial risks the FAO did not consider . . . . . . . . . . . . . . . . . . . . . . . . . . . . . . . . . . . . . . . . . . . . . 219
Are there alternatives? . . . . . . . . . . . . . . . . . . . . . . . . . . . . . . . . . . . . . . . . . . . . . . . . . . . . . . . . . . 220
Renewables? . . . . . . . . . . . . . . . . . . . . . . . . . . . . . . . . . . . . . . . . . . . . . . . . . . . . . . . . . . . . . . . . . 220
Conservation? . . . . . . . . . . . . . . . . . . . . . . . . . . . . . . . . . . . . . . . . . . . . . . . . . . . . . . . . . . . . . . . . 221
Imports from Quebec? . . . . . . . . . . . . . . . . . . . . . . . . . . . . . . . . . . . . . . . . . . . . . . . . . . . . . . . . . . 221
We may need all of these and more . . . . . . . . . . . . . . . . . . . . . . . . . . . . . . . . . . . . . . . . . . . . . . . . 221
The special case of continued operation at Pickering . . . . . . . . . . . . . . . . . . . . . . . . . . . . . . . . . 221
Does Ontario’s electricity system need Pickering? . . . . . . . . . . . . . . . . . . . . . . . . . . . . . . . . . . . . . . 222
Conclusion. . . . . . . . . . . . . . . . . . . . . . . . . . . . . . . . . . . . . . . . . . . . . . . . . . . . . . . . . . . . . . . . . . . . 224
Endnotes . . . . . . . . . . . . . . . . . . . . . . . . . . . . . . . . . . . . . . . . . . . . . . . . . . . . . . . . . . . . . . . . . . . . . 225
211Environmental Commissioner of Ontario 2018 Energy Conservation Progress Report, Volume One
What are the consequences of the Long-Term Energy Plan’s commitment to nuclear power? Q14

The details…
The Ontario government is making a huge bet on nuclear electricity. The commitment (restated in the Long-Term Energy Plan) to refurbish the Bruce and Darlington nuclear stations will dominate Ontario’s electricity future – all the way to 2064.
The Bruce and Darlington nuclear plants require expensive, time-consuming refurbishment in order to continue to operate. The units scheduled for refurbishment supply more than 40% of the electricity that Ontario currently uses, approximately 60 terawatt-hours (TWh) a year, as shown in Figure 14.1.1
If the nuclear plants were closed, instead of refurbished, all this electricity would need to come from somewhere
else, and Ontario’s challenge of maintaining a low-carbon electricity system would be much greater. Are there alternatives that should be considered? Is it too late?
The government is also proposing to keep the Pickering nuclear plant open for up to four additional years (through 2024) past its planned end of life. Does this choice make sense?
Figure 14.1. Projected electricity production from nuclear power, assuming current refurbishment and life extension plans.
Note: Assumes extended operation of Pickering to 2022/2024. Acronyms: BNGS (Bruce Nuclear Generating Station), DNGS (Darlington Nuclear Generating Station), PNGS (Pickering Nuclear Generating Station).
Source: Financial Accountability Office of Ontario, Nuclear Refurbishment: An Assessment of the Fiscal Impact of the Province’s Fair Hydro Plan (Toronto: FAO, Fall 2017) at 8.
The Ontario government is making a huge bet on nuclear electricity.
0
10
20
30
40
50
60
70
80
90
100
2016
2018
2020
2022
2024
2026
2028
2030
2032
2034
2036
2038
2040
2042
2044
2046
2048
2050
2052
2054
2056
2058
2060
2062
2064
Ann
ual N
ucle
ar E
lect
ricity
P
rodu
ctio
n (T
Wh) Pickering
Darlington
Bruce
BNGS and DNGS reactorsbegin to be taken offline
DNGS and BNGS reactors online
Reduced DNGS & BNGS Production During
Refurbishment
212 Making Connections: Straight Talk About Electricity in Ontario
Q14

Environmental concerns with nuclear powerAs discussed in Q10, every source of electricity (except conservation) has some environmental downside. The major environmental concerns with nuclear power are very different than other electricity sources, and are difficult to weigh against those of other sources.
The most significant environmental concerns with nuclear power relate to:
• the radioactive waste that is produced on an ongoing basis, and which will have to be managed indefinitely to prevent radioactive exposure to humans and the environment
• how to safely and permanently decommission the nuclear plants after use, and
• the risk of accidental releases of radiation.
While the environmental aspects of Ontario’s other electricity sources are regulated by the province, regulation of nuclear power to protect human health and the environment is primarily a federal responsibility, carried out by the Canadian Nuclear Safety Commission (CNSC). A brief summary of these issues is provided below.
Nuclear waste and decommissioning
Ontario’s nuclear plants generate high-level nuclear wastes (the used nuclear fuel from reactors) that will be dangerous for hundreds of thousands of years, far
longer than any human society has survived.High-level waste is extremely radioactive. Currently, used nuclear fuel is stored onsite at nuclear power plants, initially through wet storage with water providing shielding. The spent fuel is then transferred to dry storage using steel and concrete to provide shielding from radioactivity.
Used nuclear fuel in dry storage container.
Source: Ontario Power Generation.
The major environmental concerns with nuclear power are very different than other electricity sources.
Nuclear wastes will be dangerous for hundreds of thousands of years, far longer than any human society has survived.
213Environmental Commissioner of Ontario 2018 Energy Conservation Progress Report, Volume One
What are the consequences of the Long-Term Energy Plan’s commitment to nuclear power? Q14

The federally mandated Nuclear Waste Management Organization (NWMO) is responsible for and has developed a plan to deal with used fuel. The plan is storage underground in a “deep geological repository”, in a willing host community with suitable stable geology. No long-term repository for used nuclear reactor fuel yet exists anywhere in the world, although the first is now under construction deep underground in Finland.2
All five municipalities currently under consideration as host communities for the Canadian repository are located in Ontario.3 Safe transportation of waste from reactor sites to the final repository by road or rail (estimated at 1 – 2 truckloads per day of high-level waste from all Canadian reactors) will also need to be ensured. The NWMO expects that a site will be selected for the facility within about five years.4 Realistically, this process is still decades away from having an operational facility that accepts high-level waste.
In addition to the high-level nuclear waste, there is also a large amount of low- and intermediate-level waste, which will be radioactive for many years. The three existing nuclear stations generate a combined volume of roughly 5,000 – 7,000 cubic metres of low- and intermediate-level waste annually (reduced to 2,000 – 3,000 cubic metres after processing).5 Ontario Power Generation (OPG) has been working on a proposal to develop a similar geological repository for this waste, on the site of the Bruce nuclear power plant near Kincardine (currently this waste is stored above-ground on this site).6 The environmental assessment process for this proposal has been going on for more than a decade (initiated in 2005). Despite a favourable recommendation from the federal Joint Review Panel, the federal Minister of the Environment has not yet approved the project, and has asked OPG for additional information.7
The issue of radioactive waste is also relevant to reactors at their end of life. Decommissioning of a nuclear plant involves reducing radioactivity at the site
to safe levels, by removing fuel and cleaning up and dismantling radioactive components. The first stage of decommissioning is “safe storage” to provide time for radioactivity levels to decline. Two units at the Pickering nuclear station were placed in this state between 2005 and 2010. Active decommissioning of Pickering will not take place until the 2050s.8 While Ontario has not yet decommissioned a commercial nuclear reactor, nine reactors have been decommissioned in the U.S., and refurbishment involves some of the same work.9
Nuclear accidents
The potential for a large release of radioactivity from a nuclear accident at an operating plant is a major concern, and this fear was reignited for many by the Fukushima disaster in Japan in 2011. While there are differences in geology and nuclear technology between Ontario and Japan, Ontario’s reactors also depend on cooling of the reactor fuel. If all cooling systems were to fail, temperatures in the reactor core would rise, and a release of radiation could occur.10
The independent Commission that reviewed the Fukushima incident concluded that the direct causes of the accident were foreseeable in advance, but the plant operator, regulator and government had failed to develop the necessary safety requirements. In the Commission’s words, Fukushima was “a manmade disaster”, and “the root causes were the organizational and regulatory systems that supported faulty rationales for decisions and actions”.11 These findings emphasize the importance of a vigilant safety culture within Canada’s nuclear sector, among both operators and regulators.
These findings emphasize the importance of a vigilant safety culture.
214
What are the consequences of the Long-Term Energy Plan’s commitment to nuclear power?
Making Connections: Straight Talk About Electricity in Ontario
Q14

Post-Fukushima, the CNSC established an Action Plan to address the lessons learned from the Fukushima accident in order to enhance the safety of Canadian nuclear facilities.12 Key areas of review included assessing and improving the safety of reactors, assessing any site-specific external hazards, and enhancing emergency response plans. Ontario Power Generation’s actions in these areas are noted in their CNSC application for continued operation of the Pickering nuclear station.13
OPG’s focus is on minimizing the likelihood of an accident or its consequences, through its actions at the facility. If a nuclear accident does occur, Ontario, through Emergency Management Ontario, has responsibility for off-site emergency response preparation. And although the province has recently updated its Provincial Nuclear Emergency Response Plan to enhance emergency planning,14 some critics consider the updated plan inadequate.15
The CNSC has modeled the potential health impacts of a hypothetical severe nuclear accident and radiation release from the Darlington nuclear station, although the radiation release modeled was much smaller than the levels at Fukushima.16 The study assessed the potential for increases in four types of cancer from radiation poisoning. It concluded that there would be a small increase in the rate of childhood thyroid cancer, but no impact on the other three types of cancer examined.
However, the study assumed that all of the procedures in the Provincial Nuclear Emergency Response Plan would be fully carried out – evacuation from within a certain zone around the affected plant, sheltering, and ingestion of protective potassium iodide pills, as applicable.17 Whether this is a realistic assumption for a real incident is questionable. In particular, Pickering’s location in the densely populated Greater Toronto Area would make complete implementation of the Plan very challenging should an accident happen there.
The CNSC believes that such an incident is “extremely unlikely to occur”,18 but it is a risk that not everyone wants to accept.
Financial cost of nuclear refurbishment The province has never released an explicit cost-benefit case to support its decision to proceed with nuclear refurbishment. On the contrary, in 2015 the Ministry of Energy amended O. Reg. 53/05 to prohibit the Ontario Energy Board (OEB) from reviewing the need for the Darlington refurbishment (when the OEB assessed OPG’s application to recover the costs from electricity ratepayers).19
The Financial Accountability Office of Ontario (FAO) analyzed the financial cost of the program of nuclear refurbishment, in comparison with alternative sources of electricity. The FAO concluded that, if the refurbishments are executed as planned, they will “provide ratepayers with a long-term supply of relatively low-cost, low-emissions electricity”.20 The FAO estimates that average cost of electricity from nuclear power over the next 50 years will be roughly 8.1¢ per kilowatt-hour (kWh), in 2017 dollars.21 This is more expensive than the current cost of nuclear power (6.9¢/kWh), but cheaper than the average cost paid by customers for all generation (11.5¢/kWh).22
The province has never released an explicit cost-benefit case to support its decision to proceed with nuclear refurbishment.
215Environmental Commissioner of Ontario 2018 Energy Conservation Progress Report, Volume One
What are the consequences of the Long-Term Energy Plan’s commitment to nuclear power? Q14

The average cost of nuclear power (from Bruce and Darlington together) is expected to go up during the refurbishment period, peaking in 2027 at around 9.5¢/kWh (in 2017 dollars), and falling below 8¢/kWh by around 2034.23
What if things don’t go smoothly?
The FAO estimate of nuclear electricity costs assumes that the refurbishments will be executed as planned, at the costs currently projected. What happens if the refurbishments do not go smoothly? The FAO analysis reviews the consequences of some financial risks associated with the refurbishment, including refurbishment cost overruns and opportunity costs, but does not consider others, such as underestimates of waste management or decommissioning costs, and liability risks in the event of a nuclear accident.
The risk to Ontarians is different for the Darlington and Bruce refurbishments. The government of Ontario owns OPG, while Bruce Power is a private company. This means that all of the financial risk for the OPG refurbishment is borne by Ontarians, partly through electricity rates, and partly through the impact of OPG’s profits and losses on provincial government finances.24 With the Bruce refurbishment, the financial risks are split between ratepayers and Bruce Power. This applies in particular to the risks of refurbishment cost overruns and poor operating performance, discussed below. The converse is true as well – if the refurbishments come in under budget or have lower operating costs than anticipated, Ontarians receive the full benefit for Darlington, but only about 50% of the savings for Bruce.25
Financial risks the FAO considered
Refurbishment risk: Nuclear construction projects have a history of going over budget. How would cost overruns affect the estimated cost of nuclear power? The FAO notes that because of the long lifetime of nuclear reactors, the capital cost of the refurbishment itself is only a minor portion of lifetime costs (the largest share is ongoing operating costs). This means that refurbishment costs would have to be significantly higher than expected to greatly change the estimated cost of nuclear power. An increase in refurbishment cost therefore results in a much smaller proportional increase in the lifetime cost (e.g., a 50% increase in refurbishment cost translates into a 9% increase in the overall unit cost of nuclear power).26 This assumption only holds true if the plants end up being used for their full lifetime of almost 50 years – if not, the impact of refurbishment cost overruns would be more significant (see the discussion of “Opportunity cost risk” below).
The Ministry of Energy advises that the Darlington refurbishment is off to a good start with the refurbishment of the first unit (Unit 2) tracking on time and budget. The Ministry has therefore given OPG the go-ahead in February 2018 to refurbish the second unit (Unit 3).27
The Darlington refurbishment is off to a good start.
216
What are the consequences of the Long-Term Energy Plan’s commitment to nuclear power?
Making Connections: Straight Talk About Electricity in Ontario
Q14

Turbine removal in the Darlington refurbishment.
Source: Ontario Power Generation.
Station performance risk: Another risk is that the nuclear stations will perform worse than expected. The FAO refers to this as “station performance risk”. Nuclear plants have high fixed operating costs that do not vary much with the amount of power produced. This means that the portion of time the plant is up and running and delivering electricity has a large impact on the unit cost of electricity. The FAO assumed that the refurbished Darlington and Bruce units would deliver 88% of maximum power over the course of their operating lives (88% capacity factor), and did not quantitatively assess how poorer station performance would affect cost projections.
After the FAO report was issued, the OEB issued a decision on OPG’s application to increase its rates. In total, OPG spends more than $2.8 billion every year to operate its nuclear plants, but has missed many of its own power production forecasts. In its December 28, 2017 rate decision, the OEB commented on the “poor management” and “poor performance” of OPG’s nuclear division:
OPG benchmarks itself annually against other North American nuclear operators on 20 measures. Of these 20, three have been identified as “key metrics”: total generating cost (TGC), which is the “all-in” cost for generating electricity expressed on a $/MWh basis; the Nuclear Performance Index (NPI), which is a weighted composite of ten safety and performance indicators; and Unit Capability Factor (UCF), which measures a plant’s actual output as a percentage of its potential output over a period of time….28
OPG’s nuclear operations benchmarking results have been a concern to the OEB since it began regulating OPG in 2008. In all three previous cost of service cases the OEB has noted OPG’s poor performance relative to its peers, and has made disallowances at least partially on account of this…
Since OPG began benchmarking… its overall results have been very poor. Since 2008 its ranking for each of the three key metrics has been either at or near the bottom in every year. Both the OEB and OPG expect better than this, and ratepayers should expect better too.29
The OEB commented on the “poor management” and “poor performance” of OPG’s nuclear division.
217Environmental Commissioner of Ontario 2018 Energy Conservation Progress Report, Volume One
What are the consequences of the Long-Term Energy Plan’s commitment to nuclear power? Q14

Much of this poor performance is driven by the old Pickering units, and may be more relevant for the decision on Pickering extended operation (discussed later in the chapter), than for the Darlington refurbishment. Pickering is the one of the highest cost nuclear plants in North America, per unit of electricity produced:
OPG argues that its poor results are driven to a large extent by the Pickering units. Pickering’s performance is hampered by its small unit size, first generation CANDU technology, and low capability factor.30
Despite the challenges of operating an older facility, OPG is responsible for Pickering’s performance and should be expected to achieve at least its own performance targets. OPG set its targets with full knowledge of the facility and its condition. Despite that, OPG has continuously failed to meet its own targets.31
The OEB expects OPG’s overall nuclear benchmarking results to get worse in the next five years, due to the high fixed operating costs and lower power production during the Darlington refurbishment.32 OPG responds that Pickering’s performance was much improved in 2017.33
Opportunity cost risk: In the ECO’s opinion, the biggest economic risk identified in the FAO report is the opportunity cost risk. Unlike the short extension proposed for Pickering, the unit cost of nuclear power from the refurbishment of Bruce and Darlington assumes the plants will provide power for almost 50 years. If low-carbon electricity alternatives become cheaper than nuclear during the next 50 years, Ontario may not be able to take full advantage, due to sunk costs and economies of scale.
For the next decade, the government has “off-ramps” that could allow it to terminate the remaining Bruce and Darlington refurbishments under certain circumstances.34 For Bruce Power, there are two different types of off-ramps – “threshold” off-ramps that can only be exercised for each reactor refurbishment if Bruce Power’s updated cost estimate for the refurbishment is more than 30% higher than the original estimate, or if the proposed duration for the reactor refurbishment exceeds certain thresholds. “Economic” off-ramps are more general and address opportunity cost risk – they allow the IESO to terminate future Bruce refurbishments if demand has dropped, or more cost-effective supply is available, and can only be exercised prior to the 3rd and 5th (of 6) Bruce reactor refurbishments. These decisions would need to be made in approximately 2024 and 2027, using the current refurbishment timeline (a year before these refurbishments are scheduled to commence). For OPG, the FAO’s assessment is that the government can cancel refurbishments at Darlington for any reason at any time. However, because the Darlington refurbishments will happen sooner than at Bruce, any off-ramps would need to be taken sooner (by roughly 2023 for the last unit).
The front-loading of refurbishment costs and economies of scale reduce the value of the off-ramps.35 For example, cancelling two out of six refurbishments saves much less than one third of the cost. Significant design and planning costs are sunk ahead of the first unit refurbishment at a nuclear plant (of the estimated $12.8 billion total cost of the Darlington refurbishment, $2.9 billion had already been spent by the time of
If low-carbon electricity alternatives become cheaper than nuclear during the next 50 years, Ontario may not be able to take full advantage.
218
What are the consequences of the Long-Term Energy Plan’s commitment to nuclear power?
Making Connections: Straight Talk About Electricity in Ontario
Q14

the 2016 Ontario Energy Board review).36 In addition, ongoing operations costs at nuclear stations do not scale in a linear fashion with the number of reactors – in other words, the average cost of nuclear electricity would be higher if fewer reactors at a station were refurbished. These factors mean that alternatives would have to drop well below the cost of nuclear quickly for a mid-stream refurbishment cancellation to make sense. For the Bruce refurbishment, if Ontario exercises the economic off-ramps and Bruce Power ends up having to recover its invested capital and operating costs from a smaller number of operating reactors, the risk of stranded costs would be shared between Bruce Power and Ontario ratepayers.37
Once the refurbishments are completed, estimated for 2033, Ontario will have no further off-ramps to reduce its nuclear commitment, except to wait for the reactors to reach the end of their useful life between 2044 and 2064 (Figure 14.1). Ontarians will still incur much of the cost of nuclear power from their annual operating costs. In the U.S., several nuclear plants have already had to close because their operating costs are too high to compete with gas-fired or renewable power. Ontario could do the same at some point in the future, but it would mean writing off a large sunk cost. Another way to think about this: The average cost of nuclear power per kWh will turn out to be much higher if the substantial refurbishment costs cannot be amortized over the planned 40 years of operation.
Financial risks the FAO did not consider
Scoped out of the FAO report is any analysis of economic risks related to decommissioning, nuclear waste management, or radioactive releases.38 OPG’s budgeted costs of nuclear waste management and decommissioning are included in the FAO’s estimate of the price of electricity from nuclear power, but the FAO did not assess whether these costs are accurate, and what the impact would be if they are not.
OPG is responsible for the costs of nuclear waste management and decommissioning from all of Ontario’s commercial reactors, including the Bruce facility. OPG must pay into segregated funds established under the Ontario Nuclear Funds Agreement (ONFA) to address nuclear waste management and decommissioning. OPG estimated that these funds would be valued at $18.198 billion dollars on January 1, 2018, which is in excess of the liability it estimates for these activities.39
There is some oversight of the estimated costs of nuclear waste management and decommissioning at both the federal and provincial levels. The estimated liability for the costs for nuclear waste management and decommissioning are established by OPG in a Reference Plan that is updated at least once every five years, and must be submitted to and approved by the province, pursuant to ONFA, an agreement between the province and OPG.40 This Reference Plan is confidential. The Ontario Financing Authority, which implements ONFA for the province, has told the ECO that it hires a consulting firm with engineering and technical expertise in nuclear energy, including nuclear liabilities, to perform a review of OPG’s Reference Plan, including its technical programs for nuclear decommissioning and waste management and the cost estimates on the Ontario government’s behalf. This analysis is not made public.41
The CNSC requires that a nuclear operator provide a financial guarantee for its nuclear liabilities for decommissioning and waste management. As part of this, OPG submits to the CNSC its cost and liability estimates. Following a public hearing, in October 2017
Scoped out of the FAO report is any analysis of economic risks related to decommissioning, nuclear waste management, or radioactive releases.
219Environmental Commissioner of Ontario 2018 Energy Conservation Progress Report, Volume One
What are the consequences of the Long-Term Energy Plan’s commitment to nuclear power? Q14

the CNSC accepted OPG’s updated liability estimate and the value of the nuclear segregated funds as adequate to satisfy the CNSC’s financial guarantee requirement.42
If the actual costs for decommissioning or nuclear waste management turn out to be higher than expected,43 Ontarians will have to pay those additional costs, whether through their electricity rates or their taxes.44 Experience with decommissioning of plants internationally, and the work being done in Finland on final disposal of high-level waste should help better refine these cost estimates. As some of the same activities are carried out in refurbishment and decommissioning, Ontario’s refurbishments will also provide information on Ontario-specific decommissioning costs.
Another financial risk not assessed by the FAO is the cost of a nuclear accident. The federal Nuclear Liability and Compensation Act means that nuclear power plant operators are only responsible for the first $1 billion in civil damages resulting from an accident at their plant (this liability limit was raised in 2015 from $75 million).45 Any damages above this amount are to be covered by the federal government, i.e. the taxpayer. This is an important subsidy to the nuclear industry; its cost is not included in any of the estimates of the cost of Ontario’s nuclear power.
Are there alternatives?The FAO concluded that “there are currently no alternative generation portfolios that could provide the same supply of low emissions baseload electricity generation at a comparable price to the Base Case Nuclear Refurbishment Plan” (i.e., at the projected price of 8.1¢/kWh).46
The ECO agrees with this assessment. However, it is worth considering again whether a combination of renewables, conservation, imports of clean power and storage could replace some portion of Ontario’s nuclear capacity, before Ontario makes a final commitment to each of the future reactor refurbishments.
Renewables?
The FAO’s estimated average cost of refurbished nuclear is similar to the current price of new renewable electricity in Ontario (almost the same as large wind projects, and less expensive than large solar projects). Costs for wind and solar used to be much higher, but, particularly for solar, have been dropping rapidly. Ontario’s 2016 renewable procurement awarded wind contracts with an average price of 8.6¢/kWh, very close to the projected nuclear price.47 The price of renewables has come down even further since then; Alberta recently signed wind contracts at 3.7¢/kWh, although it has more favourable wind resources than Ontario.48
The unit cost of power is not enough on its own to determine whether non-hydro renewables could replace nuclear. Variable wind and solar would require significant additional costs (e.g., storage) and operational changes. As Q6 discusses, operating an electricity system with a large fraction of intermittent renewables does have challenges, although an increasing number of jurisdictions around the world have large and growing renewable supplies, and are learning how to manage them. Nuclear also has challenges matching demand, as it works best when it runs at full power around the clock, and has poor flexibility to adapt to the fluctuations in demand that Ontario experiences ( Q3).
220
What are the consequences of the Long-Term Energy Plan’s commitment to nuclear power?
Making Connections: Straight Talk About Electricity in Ontario
Q14

Conservation?
Conservation is cheaper than nuclear (at an average historical cost of roughly 3-4¢/kWh saved; even lower in 2016). Ontario’s conservation programs have delivered an increasing amount of savings in recent years, and the role of conservation should grow in the future ( Q19). However, as Ontario is already planning for a large amount of conservation (30 TWh by 2032), only additional savings beyond this will contribute to reducing the role the LTEP foresees for nuclear power.
Imports from Quebec?
Waterpower is more predictable and dependable than wind and solar for baseload power, and Quebec has abundant waterpower production, which Ontario can potentially make better use of, through imports. Quebec imports can also work well to balance the intermittency of wind and solar. In 2016, Ontario signed an electricity trade agreement with Quebec that secured 2 TWh of electricity from Quebec through 2023.49
The FAO concluded that Quebec imports are not a workable replacement for the entire program of refurbishing Ontario’s nuclear plants, for three reasons: (1) Quebec is forecasting less electricity available for export in the future, (2) there will be increasing competition for this electricity from US markets, therefore driving up prices and (3) the cost of upgrading transmission lines to deliver large amounts of power from Quebec to Ontario could be significant, likely requiring new interties.50 The Ministry of Energy notes that it is continuing to explore the potential for smaller import agreements with Quebec.51
We may need all of these and more
Each resource described above has the potential to replace part of the electricity provided by nuclear. But we may need all of these resources and the full amount of nuclear power from the refurbishments, if electricity demand rises to meet new energy uses such as heating and transportation that are currently supplied by fossil fuels ( Q15).
As the ECO and other parties have noted, the government has never explained the process or the criteria that it will use when assessing whether to take the nuclear off-ramps.52 Prior to giving the final go-ahead on each refurbishment commitment, Ontario should do an updated needs assessment, accounting for refurbishment costs, changes in demand, and changes in the prices of alternative resources. This would be particularly valuable for the two Bruce economic off-ramps described earlier. A lot may change in the decade before the final Bruce unit refurbishments are scheduled to begin.
The special case of continued operation at PickeringThe Long-Term Energy Plan’s decision to “extend” operations at the Pickering nuclear station is quite different from its commitment to “refurbish” Darlington and Bruce. The proposed financial commitment, timeline, scope of work and potential electricity production benefits of the extension are all much lower than they would be for a full refurbishment. Two of the eight reactors at the Pickering nuclear station are
Conservation is cheaper than nuclear.
A lot may change in the decade before the final Bruce unit refurbishments are scheduled to begin.
221Environmental Commissioner of Ontario 2018 Energy Conservation Progress Report, Volume One
What are the consequences of the Long-Term Energy Plan’s commitment to nuclear power? Q14

already permanently out of service; the other six are currently scheduled to close in 2020. The government now hopes to keep all six active reactors running until 2022, and four of these six until 2024, by which time three units at Darlington and one unit at Bruce may have returned to service after refurbishment.
Operating safety at the Pickering station is a concern for many, given the location of the station (close to large populations in the GTA) and the age of two of the reactors (in operation since the early 1970s). In particular, the uranium fuel channels in their reactor cores have already been used for more than 210,000 operating hours, which was originally assumed to be their design life. They are now well past this number. Based on technical studies of their fitness-for-service, their operating lifetime has already been extended once, and OPG is now seeking a second extension, to 295,000 operating hours.53 The CNSC is the federal regulator responsible for overseeing nuclear safety issues. The Pickering plant cannot continue to operate past August 31, 2018 without an operating license extension from the CNSC. The CNSC has therefore held a public hearing to assess whether this extension should be granted. The CNSC’s decision is expected later in 2018.
Should the CNSC decide that Pickering is safe for continued operation, the Pickering extension is still not a done deal. The 2017 Long-Term Energy Plan requires OPG to seek final approval from the Ontario government to proceed with the extension.54 Should Ontario give such approval?
There has been no independent review of whether the Pickering extension still makes environmental and financial sense for Ontario.
In 2015, the IESO concluded that the Pickering extension would deliver a net benefit to electricity customers of between $300 million and $500 million, while keeping greenhouse gas emissions low. However, the economic case was not clear-cut – with small changes to some of the assumptions (e.g. amount of expected electricity production from Pickering, capital and operating cost, natural gas prices), the same computer model would predict that the Pickering extension will cost electricity customers money.55 The IESO did not offer a final recommendation as to whether continued operation of Pickering was in the province’s interest.
The FAO did not assess the economic case for extending the operation of the Pickering station through 2024, nor did the OEB. The OEB approved OPG’s plans to do some preliminary work, but only because the government had already decided, before and in the LTEP, to proceed with the extension. OEB staff noted that they were not asked to review whether the extension should take place, and that “it is an open question as to whether the PEO {Pickering Extended Operation} would still show benefits if the model were re-run today”.56 Ontario is not yet irrevocably committed to the costs of the Pickering extension. 2/3rd of the $300 million in enabling costs will not be spent until 2019 or 2020, and the primary cost of the Pickering extension will be the operating cost of running the plant beyond 2020 ($1.4 billion in 2021 alone).57
Does Ontario’s electricity system need Pickering?
Can Ontario get by without the electricity produced by Pickering, and have adequate electricity capacity to meet peak demand, from 2021 to 2024?58
There has been no independent review of whether the Pickering extension still makes environmental and financial sense for Ontario.
222
What are the consequences of the Long-Term Energy Plan’s commitment to nuclear power?
Making Connections: Straight Talk About Electricity in Ontario
Q14

Electricity consumedPickering currently provides about 20 TWh of electricity per year. In 2015, the IESO predicted that only about half of the electricity provided by the Pickering extension would be useful to Ontarians. The other half (delivered at times of lower electricity demand) would lead to higher exports (at less than average cost) or curtailment of existing renewable power.59 Given that Ontario’s annual grid-supplied electricity demand has dropped sharply since then (down 4.9 TWh between 2015 and 2017),60 an updated analysis might find that even less of Pickering’s electricity would be useful to Ontarians. Another way of looking at this is that the effective cost per unit of electricity from Pickering is roughly twice as high, if we cannot make productive use of the other half of the power it produces.
Q15 of this report notes that fuel switching from fossil fuels to electricity will be needed to meet Ontario’s climate obligations, which will drive an increase in overall electricity demand. However, the two to four years covered by the Pickering extension would likely be over before significant electrification occurs, and much of the additional demand from electrification could be focussed off-peak, when Pickering electricity is not needed.
The useful fraction of Pickering’s electricity could be obtained from Ontario’s existing gas-fired generators and/or imports, supplemented with conservation and new renewables. If it were all replaced with gas-fired power, this would increase greenhouse gas (GHG) emissions by 8-17 MT over the four years.61 The emissions impact would be lower if much of this energy
came from low-emission power, such as Quebec waterpower. However, Ontario’s existing electricity trade agreement with Quebec is already counting on using much of the existing intertie capability to bring in Quebec power at times of high demand to reduce the use of gas-fired generation, so there may not be much remaining potential.62 Better use of Ontario’s surplus off-peak renewable electricity, perhaps with existing pumped storage (see Q16), may help, as could more conservation and new renewables. Still, a decision to not extend Pickering would likely increase GHG emissions to some degree, although the exact amount is uncertain.
Peak capacityThe other issue is whether Ontario can, at a reasonable cost, without major infrastructure upgrades, replace the capacity that Pickering provides to reliably meet peak demand. As discussed in Q5, Ontario does not have significant excess capacity at summer peak, even with Pickering operating. Extending the life of Pickering would help Ontario avoid procuring new capacity for a few years.63 Quebec may or may not be able to assist Ontario here. Evidence suggests that the existing Quebec interties could be made firm for the purposes of meeting Ontario’s reliability requirements at a reasonable cost (this would not necessarily lead to an increase in the actual amount of electricity moving annually across the lines)64 if Quebec will commit to delivering this power. While Quebec will not guarantee additional capacity at its winter peak, Ontario currently has its peak load in the summer when Quebec has substantial capacity available. Another option identified in the OEB hearing was demand response (reducing electricity use at times of peak demand), which may be able to replace some or all of the capacity provided by Pickering at a lower cost.65
In the ECO’s view, the OEB hearing raised some doubt that extended operation of Pickering is in the best interests of Ontarians. The GHG reduction benefits may justify continued operation of Pickering even at
Only about half of the electricity provided by the Pickering extension would be useful to Ontarians.
223Environmental Commissioner of Ontario 2018 Energy Conservation Progress Report, Volume One
What are the consequences of the Long-Term Energy Plan’s commitment to nuclear power? Q14

the price of higher electricity system costs, but if so, the government should explain why the Pickering extension is the most cost-effective way to reduce GHG emissions. If the government decides to go ahead with Pickering instead of making better use of the renewable power we already pay for, reducing peak demand, encouraging new renewables and importing only the extra power that Ontario needs, Ontarians have a right to know why.
RECOMMENDATION: If Pickering’s operating license is extended by the Canadian Nuclear Safety Commission, Ontario should report to the public whether the Pickering extension still makes sense, and if so, why.
ConclusionOntario is making an all in, 50-year commitment to nuclear power. Refurbishment of Bruce and Darlington should provide a large amount of low-carbon electricity at a reasonable price, and appear to be important components of a future where more of Ontario’s energy needs must be met with low-carbon electricity. However, they may restrict Ontario from taking advantage of cheaper alternatives in the future. Extending the operating life of the Pickering nuclear station is a more questionable choice that needs review. Much of its power is not needed when there may be less costly low-carbon alternatives for Ontario electricity consumers.
If the government decides to go ahead with Pickering instead of making better use of the renewable power we already pay for, reducing peak demand, encouraging new renewables and importing only the extra power that Ontario needs, Ontarians have a right to know why.
224
What are the consequences of the Long-Term Energy Plan’s commitment to nuclear power?
Making Connections: Straight Talk About Electricity in Ontario
Q14

Endnotes
1 All units together at Bruce and Darlington can supply approximately 75 TWh of production, but this includes the two units at Bruce (Bruce 1 and 2) where refurbishment has already been completed.
2 Henry Fountain, “On Nuclear Waste, Finland Shows U.S. How It Can Be Done”, The New York Times (9 June 2017), online: <www.nytimes.com/2017/06/09/science/nuclear-reactor-waste-finland.html>.
3 “Study Areas”, Nuclear Waste Management Organization, online: <https://www.nwmo.ca/en/Site-selection/Study-Areas>. [Accessed 15 March 2018]
4 Nuclear Waste Management Organization, information provided to the ECO in response to ECO inquiry (27 February 2018).
5 Joint Review Panel, Environmental Assessment Report: Deep Geologic Repository for Low and Intermediate Level Radioactive Waste Project (Ottawa: Minister of Environment, Government of Canada, 6 May 2015) at 54, online: <www.ceaa-acee.gc.ca/050/documents/p17520/101595E.pdf>;
6 “What is the Deep Geologic Repository (DGR)”, Ontario Power Generation, online: <opg.dr.com>. [Accessed 20 March 2018]
7 Joint Review Panel, Environmental Assessment Report: Deep Geologic Repository for Low and Intermediate Level Radioactive Waste Project (Ottawa: Minister of Environment, Government of Canada, 6 May 2015) at xiii, online: <www.ceaa-acee.gc.ca/050/documents/p17520/101595E.pdf>; Letter from Minister of the Environment to Ontario Power Generation (18 February 2016), online:<www.ceaa-acee.gc.ca/050/documents/p17520/104964E.pdf>.
8 Ontario Power Generation, Preliminary Decommissioning Plan – Pickering Generating Stations A & B (OPG: December 2016) at 19, online: <www.opg.com/generating-power/nuclear/Documents/P-PLAN-00960-00001_PNGS_PDP.pdf>.
9 “Decommissioning Nuclear Power Plants”, Nuclear Energy Institute, online: <www.nei.org/resources/fact-sheets/decommissioning-nuclear-power-plants>. [Accessed 20 March 2018]
10 Anna Mehler Paperny, “Fukushima’s ripple effects on nuclear power in Canada”, The Globe and Mail (7 April 2011), online: <www.theglobeandmail.com/news/politics/fukushimas-ripple-effects-on-nuclear-power-in-canada/article575784/>.
11 National Diet of Japan, The official report of the Fukushima Nuclear Accident Independent Investigation Commission (National Diet of Japan, 2012) at 16, online: <www.nirs.org/wp-content/uploads/fukushima/naiic_report.pdf>.
12 Canadian Nuclear Safety Commission, On the Lessons Learned From the Fukushima Daiichi Nuclear Accident (CNSC, August 2013), online: <www.nuclearsafety.gc.ca/eng/pdfs/reports/FTFR-CNSC-Integrated-Action-Plan.pdf>.
13 Letter from Ontario Power Generation to the Canadian Nuclear Safety Commission (28 August 2017), “Application for Renewal of Pickering Nuclear Generating Station Power Reactor Operating Licence” at section 2.4.6, online: <www.opg.com/generating-power/nuclear/stations/pickering-nuclear/Documents/P-CORR-00531-05055_PickeringNGS_Licence_Renewal.pdf>.
14 Ontario Ministry of Safety and Correctional Services, News Release, “Strengthening Ontario’s Nuclear Preparedness: Province Releases Updated Nuclear Emergency Response Plan” (21 December 2017).
15 Rob Ferguson, “Ontario’s long-awaited new nuclear emergency plan falls short, Greenpeace says”, The Toronto Star (28 December 2017), online: <www.thestar.com/news/queenspark/2017/12/22/ontarios-long-awaited-new-nuclear-emergency-plan-falls-short-greenpeace-says.html>.
16 Canadian Nuclear Safety Commission, Study of Consequences of a Hypothetical Severe Nuclear Accident and Effectiveness of Mitigation Measures (Ottawa: CNSC, September 2015) at table 3.2, online: <www.nuclearsafety.gc.ca/eng/pdfs/health-studies/Severe-Nuclear-Accident-Study-eng.pdf>.
17 Only after the draft study had been released did the CNSC require reactor operators to ensure that the potassium iodide pills (which protect against absorption of radioactive iodine and thus reduce thyroid cancer risk) were distributed to residents living within 10 km of nuclear plants, previously these were only available at local pharmacies and schools.Daniel Otis, “East end given iodine pills as nuclear disaster precaution”, The Toronto Star (10 November 2015), online: <www.thestar.com/news/gta/2015/11/10/east-end-given-iodine-pills-as-nuclear-disaster-precaution.html>.
18 Canadian Nuclear Safety Commission, Study of Consequences of a Hypothetical Severe Nuclear Accident and Effectiveness of Mitigation Measures (Ottawa: CNSC, September 2015) at 73, online: <www.nuclearsafety.gc.ca/eng/pdfs/health-studies/Severe-Nuclear-Accident-Study-eng.pdf>.
19 O Reg 353/15, which amended Payments Under Section 58.1 of the Act, O Reg 53/05. Section 12(v) of O Reg 53/05 requires the OEB to accept the need for the Darlington refurbishment.
20 Financial Accountability Office of Ontario, Nuclear Refurbishment: An Assessment of the Fiscal Impact of the Province’s Fair Hydro Plan (Toronto: FAO, Fall 2017) at 45, online: <http://www.fao-on.org/web/default/files/publications/Nuc%20Refurb%20nov%202017/Nuclear-Refurb-EN.pdf>.
21 Ibid, at 45. This estimate is in 2017 dollars. The FAO analysis is a blended average price for all nuclear generation from 2016 to 2064 (not just the power produced from reactors after refurbishment, but also the power produced in this timeframe from Pickering, the power from the Bruce units that have already been refurbished, and the power from Bruce/Darlington units before they go down for refurbishment), so the actual unit cost of post-refurbishment power is likely slightly higher. It is not possible to separate this spending and provide an accurate cost estimate of only the refurbished generation (Financial Accountability Office of Ontario, information provided to the ECO in response to ECO inquiry (8 January 2018).
22 Ibid, at 7.
23 Ibid, at 24.
24 The OEB could prevent OPG from recovering certain cost overruns from electricity customers, but this would just mean that OPG would earn lower profits, to the detriment of the province.
25 Financial Accountability Office of Ontario, Nuclear Refurbishment: An Assessment of the Fiscal Impact of the Province’s Fair Hydro Plan (Toronto: FAO, Fall 2017) at 31, 37-38.
225Environmental Commissioner of Ontario 2018 Energy Conservation Progress Report, Volume One
.
.
.
.
.
.
.
.
.
.
.
.
.
.
.
.
.
.
.
.
.
.
.
.
.
What are the consequences of the Long-Term Energy Plan’s commitment to nuclear power? Q14

26 Ibid, at 12.
27 Joel Wittnebel, “Refurb of Darlington’s Unit 2 reactor reaches halfway point”, The Oshawa Express (21 February 2018), online: <oshawaexpress.ca/refurb-of-darlingtons-unit-2-reactor-reaches-halfway-point/>.
28 Ontario Energy Board, Decision and Order EB-2016-0152 Ontario Power Generation Inc. Application for payment amounts for the period from January 1, 2017 to December 31, 2021 (OEB, 28 December 2017) at 46, online: <www.rds.oeb.ca/HPECMWebDrawer/Record/595053/File/document>.
29 Ibid, at 49.
30 Ibid.
31 Ibid at 50.
32 Ibid at 51.
33 Ontario Power Generation, information provided in response to ECO inquiry (6 February 2018).
34 Financial Accountability Office of Ontario, Nuclear Refurbishment, An Assessment of the Financial Risks, of the Nuclear Refurbishment Plan (Toronto: FAO, November 2017) at 11.
35 Ibid, at 12.
36 Ontario Energy Board, Decision and Order EB-2016-0152 Ontario Power Generation Inc. Application for payment amounts for the period from January 1, 2017 to December 31, 2021 (OEB, 28 December 2017) at 26, online: <www.rds.oeb.ca/HPECMWebDrawer/Record/595053/File/document>.
37 Bruce Power L.P. and the Independent Electricity System Operator, Amended and Restated Bruce Power Implementation Agreement (Bruce Power and IESO, 3 December 2015) at article 4.11 and exhibit 4.11, online: <www.ieso.ca/-/media/files/ieso/document-library/power-data/supply/amended-and-restated-bruce-power-refurbishment-implementation-agreement.pdf?la=en>. These sections of the contract indicate that the contract price for electricity from Bruce Power would be adjusted if Ontario exercises its option to terminate some of the refurbishments.
38 Financial Accountability Office of Ontario, Nuclear Refurbishment, An Assessment of the Financial Risks of the Nuclear Refurbishment Plan (Toronto: FAO, November 2017) at 19.
39 Letter from Ontario Power Generation to Mr. M. LeBlanc, Commission Secretary, Canadian Nuclear Safety Commission, “Request for Acceptance of OPG’s Financial Guarantee” (4 August 2017) at Tables 7 and 8, online: <www.opg.com/generating-power/nuclear/Documents/Financial_Guarantee_Commission_Member_Document.pdf>.
40 Ontario Nuclear Funds Agreement between the Minister of Finance and Ontario Power Generation (1 April 1999, amended 28 October 2004), online: <www.opg.com/about/regulatory-affairs/Documents/2017-2021/OPG_IRR_Issue_8.0_20170210.pdf>
41 Ontario Financing Authority, information provided in response to ECO inquiry (9 March 2018).
42 Canadian Nuclear Safety Commission, Financial Guarantee for the Future Decommissioning of Ontario Power Generation Inc.’s Facilities in Ontario (Ottawa: EGD, 11 October 2017), online: <www.suretenucleaire.gc.ca/eng/the-commission/pdf/RecordofDecision-OPG-FG-e.pdf>
43 Of course, many of these costs would be incurred regardless of the decision on refurbishment, as all nuclear sites will eventually need to be decommissioned regardless, and have already generated significant amounts of high-level waste. Refurbishment will add incremental costs.
44 The Ontario Nuclear Funds Agreement specifies the division of responsibility for liabilities between the province and Ontario Power Generation. Since the province is the sole shareholder of Ontario Power Generation, Ontarians will bear this risk in either case.
45 “The Nuclear Liability and Compensation Act”, online: Natural Resources Canada <www.nrcan.gc.ca/energy/uranium-nuclear/19224>. [Accessed 21 March 2018]
46 Financial Accountability Office of Ontario, Nuclear Refurbishment, An Assessment of the Financial Risks of the Nuclear Refurbishment Plan (Toronto: FAO, November 2017) at 47.
47 “News Releases: IESO Announces Results of Competitive Bids for Large Renewable Projects”, online: Independent Electricity System Operator <www.ieso.ca/corporate-ieso/media/news-releases/2016/03/ieso-announces-results-of-competitive-bids-for-large-renewable-projects>. [Accessed 21 March 2018]
48 “Rep Round 1 Results”, online: Alberta Electric System Operator <www.aeso.ca/market/renewable-electricity-program/rep-round-1-results/>. [Accessed 21 March 2018]
49 Independent Electricity System Operator, “Overview of Electricity Trade Agreement Between Quebec and Ontario” (presentation, 10 May 2017), slide 5, online: <www.ieso.ca/-/media/files/ieso/document-library/sac/2017/sac-20170510-ontario-hydro-quebec-agreement.pdf?la=en>.
50 Financial Accountability Office of Ontario, Nuclear Refurbishment, An Assessment of the Financial Risks of the Nuclear Refurbishment Plan (Toronto: FAO, November 2017) at 61-63.
51 Ontario Ministry of Energy, information provided in response to ECO inquiry (28 February 2018).
52 Environmental Commissioner of Ontario, Developing the 2017 Long-Term Energy Plan, A special report to the Legislative Assembly of Ontario (Toronto: ECO, December 2016) at 23; Canadian Environmental Law Association/Greenpeace/Lake Ontario Waterkeeper/Ontario Clean Air Alliance, Application for Request for Review to the Ministry of Energy at Tab B, online: <www.cela.ca/publications/nuclear-reactor-life-extensions-request-review>.
53 Ontario Power Generation, Pickering Nuclear Generating Station Power Reactor Operating Licence Application (Toronto: OPG, August 2017) at 36-37, online: <www.opg.com/generating-power/nuclear/stations/pickering-nuclear/Documents/P-CORR-00531-05055_PickeringNGS_Licence_Renewal.pdf>.
54 Ontario Ministry of Energy, Ontario’s Long-Term Energy Plan 2017, Delivering Fairness and Choice (Toronto: Ontario Ministry of Energy, October 2017) at 51.
55 Independent Electricity System Operator, “Assessment of Pickering Life Extension Options” (presentation, November 2015), slides 15-19, online: <www.opg.com/about/regulatory-affairs/Documents/2017-2021/F2-02-03_Pickering_Extended_Operations_20161110.pdf>.
56 Ontario Energy Board staff submission, Ontario Power Generation Inc. 2017-2021 Payment Amounts, Ontario Energy Board File no. EB-2016-0152 (Toronto: OEB, 19 May 2017) at 97, online: <www.rds.oeb.ca/HPECMWebDrawer/Record/571945/File/document>.
.
.
.
.
.
.
.
.
.
.
.
.
.
.
.
.
.
.
.
.
.
.
.
.
.
.
.
.
.
.
.
226
What are the consequences of the Long-Term Energy Plan’s commitment to nuclear power?
Making Connections: Straight Talk About Electricity in Ontario
Q14

57 Ontario Energy Board, Decision and Order EB-2016-0152 Ontario Power Generation Inc. Application for payment amounts for the period from January 1, 2017 to December 31, 2021 (OEB, 28 December 2017) at 58-59, online: <www.rds.oeb.ca/HPECMWebDrawer/Record/595053/File/document>.
58 Given the short timeframe, it would likely need to do this with existing infrastructure.
59 The exported electricity could provide regional benefits in reducing greenhouse gas emissions outside Ontario (Independent Electricity System Operator, “Assessment of Pickering Life Extension Options” (presentation, November 2015), slide 12, online: <www.opg.com/about/regulatory-affairs/Documents/2017-2021/F2-02-03_Pickering_Extended_Operations_20161110.pdf>).
60 Ontario demand in 2015 and 2016 was identical at 137.0 TWh (“2017 Electricity Data”, online: Independent Electricity System Operator <www.ieso.ca/corporate-ieso/media/year-end-data>. [Accessed 21 March 2018]).
61 Independent Electricity System Operator, “Assessment of Pickering Life Extension Options” (presentation, November 2015), slide 8, online: <www.opg.com/about/regulatory-affairs/Documents/2017-2021/F2-02-03_Pickering_Extended_Operations_20161110.pdf>
62 Independent Electricity System Operator, Ontario-Quebec Interconnection Capability - A Technical Review (Toronto: IESO, May 2017) at 30, online: <www.ieso.ca/-/media/files/ieso/document-library/power-data/supply/intertiereport-20170508.pdf?la=en >.
63 Independent Electricity System Operator, “Assessment of Pickering Life Extension Options” (presentation, November 2015), slide 5, online: <www.opg.com/about/regulatory-affairs/Documents/2017-2021/F2-02-03_Pickering_Extended_Operations_20161110.pdf
64 According to the IESO, it could make firm 1,250 MW of existing intertie capacity with Quebec (and potentially 1,650 MW - about 80% of Pickering B’s nominal capacity) for about $20 million plus operational changes (Independent Electricity System Operator, Ontario-Quebec Interconnection Capability - A Technical Review (Toronto: IESO, May 2017) at 23). The remaining gap would be less than 400 MW. Demand response may also be able to fill some of this gap.
65 Submissions of Environmental Defence, Application by Ontario Power Generation pursuant to S. 78.1 of the OEB Act for payment amounts for the period January 1 2017 and December 31 2021, Ontario Energy Board EB-2016-0152 (Toronto: ED, May 2017) at 11, online: <www.rds.oeb.ca/HPECMWebDrawer/Record/572671/File/document>.
What are the consequences of the Long-Term Energy Plan’s commitment to nuclear power? Q14
227Environmental Commissioner of Ontario 2018 Energy Conservation Progress Report, Volume One
.
.
.
.
.
.
.
.
.

2005
Q U ES T I O N 15
How much of Ontario’s energy system must be electrified to meet Ontario’s legal greenhouse gas limits?
Much more than is currently planned. The needed electrification could increase Ontario electricity demand by one-third in the next twelve years; the Long-Term Energy Plan ignores Ontario’s climate obligations when it forecasts relatively stable demand.
Ontario’s energy system requires a major transition, for which the province’s energy system plan (the Long-Term Energy Plan, or LTEP) fails to prepare. As we move towards 2030, Ontario’s Climate Change Mitigation and Low-carbon Economy Act (‘the Climate Act’) will increasingly limit fossil fuel use (e.g., gasoline, diesel, natural gas and oil). The Climate Act’s annual limits on greenhouse gas (GHG) emissions will require emissions from burning fossil fuels for energy to drop by about 45% in the next 12 years.
What can replace these fuels? Much more conservation, more efficient use of fossil fuels, direct use of renewable energy, and low-carbon renewable fuels (e.g., bioenergy) will all help, but are not enough. Significant electrification – switching from fossil fuels to low-carbon electricity – will also be needed. This will require new electricity capacity, as electricity use may need to increase roughly 35% by 2030.
The LTEP does not prepare Ontario for this shift. It contemplates significant (but not sufficient) electrification in parts of the transportation sector; it does not contemplate significant electrification of water and space heating, nor does it plan for needed new low-carbon electricity supplies.
The shift will not be easy. Motivating the switch to electricity will be a challenge as long as the alternatives are less expensive. Once electrification does occur, managing winter demand for electric heating will be critical in order to keep electricity system costs from rising steeply. Ensuring that new electricity generation capacity is low-carbon and is efficiently integrated in Ontario’s electricity system will also be vital to meeting GHG limits and keeping costs under control. These and other issues will require thoughtful analysis in order to transition without undesirable side effects.
O N TA R I O ’ S E L E C T R I C I T Y F U T U R E

Contents
THE DETAILS . . . . . . . . . . . . . . . . . . . . . . . . . . . . . . . . . . . . . . . . . . . . . . . . . . . . . . . . . . . . . . . . . . 230
Climate law requires reduced fossil fuel use . . . . . . . . . . . . . . . . . . . . . . . . . . . . . . . . . . . . . . . . . 230
What can reduce fossil fuel use? . . . . . . . . . . . . . . . . . . . . . . . . . . . . . . . . . . . . . . . . . . . . . . . . . . 233
The Long-Term Energy Plan does not plan for this future . . . . . . . . . . . . . . . . . . . . . . . . . . . . . . 234
Possible scenario to meet 2030 GHG limit. . . . . . . . . . . . . . . . . . . . . . . . . . . . . . . . . . . . . . . . . . . 235
Note to reader . . . . . . . . . . . . . . . . . . . . . . . . . . . . . . . . . . . . . . . . . . . . . . . . . . . . . . . . . . . . . . . . 238
Is the ECO scenario plausible?. . . . . . . . . . . . . . . . . . . . . . . . . . . . . . . . . . . . . . . . . . . . . . . . . . . . 238
Transportation . . . . . . . . . . . . . . . . . . . . . . . . . . . . . . . . . . . . . . . . . . . . . . . . . . . . . . . . . . . . . . . . 238
Space and water heating . . . . . . . . . . . . . . . . . . . . . . . . . . . . . . . . . . . . . . . . . . . . . . . . . . . . . . . . 239
Conclusion. . . . . . . . . . . . . . . . . . . . . . . . . . . . . . . . . . . . . . . . . . . . . . . . . . . . . . . . . . . . . . . . . . . . 242
Endnotes . . . . . . . . . . . . . . . . . . . . . . . . . . . . . . . . . . . . . . . . . . . . . . . . . . . . . . . . . . . . . . . . . . . . . 243
229Environmental Commissioner of Ontario 2018 Energy Conservation Progress Report, Volume One
How much of Ontario’s energy system must be electrified
to meet Ontario’s legal greenhouse gas limits?Q15

The details…
Climate law requires reduced fossil fuel use Burning fossil fuels for energy (mostly petroleum products such as gasoline, diesel and oil, as well as natural gas) was responsible for 75% of Ontario’s 2015 GHG emissions, about 126 Mt. That cannot continue.
As we move towards 2030, Ontario’s Climate Act will increasingly limit fossil fuel use.i The Act and its regulations set legal limits to ensure that Ontario’s emissions do not exceed 37% below 1990 GHG emissions in 2030.1
i In this answer, the ECO assumes that Ontario’s capped emitters will meet their compliance obligations with the legal maximum of offset credits and with cap and trade allowances issued by Ontario. Ontario emitters cannot count on continued access in 2030 to surplus allowances from California, for the reasons described in our 2017 climate report, From Plan to Progress, Appendix B.
37% below 1990 GHG emissions is about 115 Mt of province-wide GHG emissions in 2030; or about 31% below Ontario’s emissions in 2015. Within that 115 Mt, there is a cap of 88.5 Mt on the GHG allowances that will be available in 2030 for all capped emissions, including industrial process and product use (explained below) and fossil fuel use emissions (see Figures 15.1
and 15.2).2 As a result of that cap on allowances, the ECO estimates there could be about 35% more demand for low-carbon electricity by 2030. Even in the absence of Ontario’s cap and trade program, the federal government’s proposed mandatory minimum carbon tax could still drive a similar shift.
The government can start planning for this transition now, and ensure the transition is strategic and minimal cost, or can do it later, under greater time pressure, with less opportunity for strategic planning, and likely higher overall costs.
At the time of writing, the provincial government has not planned for this low-carbon energy system future.
As we move towards 2030, Ontario’s Climate Act will increasingly limit fossil fuel use.
Economy-wideemissions:
1990 GHGs 2015 GHGs 2030 limit
181 Mt → →166 Mt 115 Mt
230 Making Connections: Straight Talk About Electricity in Ontario
Q15

Figure 15.1. Ontario’s emission reduction targets, cap on allowances for capped emitters, and estimate for non-capped sectors.
Source: Section 6(1) of the Climate Change Mitigation and Low-carbon Economy Act, 2016, for Ontario emission reduction targets; Section 54 of The Cap and Trade Program, O Reg 144/16 for Ontario’s allowance caps to 2030.
Figure 15.2. Ontario’s emissions by economic sector, grouped according to whether they are capped under Ontario’s cap and trade program.
Note: (a) Industry includes emissions from energy use and industrial processes and product uses. (b) Transportation and buildings are exclusively from energy use. (c) Agriculture includes emissions from energy use (capped) plus manure and fertilizer (uncapped).
Source: Environment and Climate Change Canada, National Inventory Report 1990-2015: Greenhouse Gas Sources and Sinks in Canada (2017), Part 3, Table A12-7, at 82.
2017
2018
2019
2020
2021
2022
2023
2024
2025
2026
2027
2028
2029
2030
0
50
100
150
200
Ont
ario
GH
G e
miss
ions
(Mt C
O2e
q/yr
)
Allowance Cap
Emissions IncludingNon-Capped Sectors
2020 Emissions Target
2030 Emissions Target
Uncapped emissions
Capped emissions
WasteAgricultureBuildingsIndustry Transportation Electricity
231Environmental Commissioner of Ontario 2018 Energy Conservation Progress Report, Volume One
How much of Ontario’s energy system must be electrified
to meet Ontario’s legal greenhouse gas limits?Q15

Some of Ontario’s capped emissions, about 22 Mt in 2015, come from industrial processes (e.g., CO2 release from conversion of limestone to lime for cement production) and product use (e.g., solvents). At present, industrial non-combustion emissions may have few cost-effective reduction options.3 Annual industrial process and product use emissions may therefore not drop significantly by 2030, with emissions increases due to economic growth offset by small reductions where opportunities do exist.
Deducting these 22 Mt from the cap of 88.5 Mt would leave only about 66.5 Mt of emission allowances for all other capped sources in Ontario in 2030, namely all fossil fuels used for energy. Ontario’s fossil fuel suppliers will have a little more flexibility than this, because they can use up to 8% offset credits (and possibly some allowances from outside Ontario) to meet part of their compliance obligations. In total, emitters will be able to use up to 7 Mt of offset credits to increase their allowable emissions.
66.5 Mt is approximately half of the emissions released through fossil fuel combustion in 2015, and 2030 is only 12 years from now. Ontario’s population is expected to increase by about 13% in that time.4
As discussed below, the ECO estimates GHGs from Ontario’s energy system (including transportation and heating) may need to drop about 45% in the next 12 years (see Figure 15.3). The 2050 GHG target of 80% reduction from 1990 levels will require an even more substantial drop in GHGs from the energy system, requiring dramatic changes over the following 20 years. We need to start planning for these changes today.
2030 cap on GHG allowances
assumed to stay constant from industrial processes & product use
2030 max GHG allowances for fossil fuel (plus up to 7 Mt of offset credits)
88.5 Mt-22 Mt
66.5 Mt~~
→→
→
Fossil fuel emissions:(i.e., natural gas, gasoline, diesel, oil)
2015 GHGs 2030 limit
→126 Mt 66.5-73.5 Mt
GHGs from Ontario’s energy system (including transportation and heating) may need to drop about 45% in the next 12 years.
232
How much of Ontario’s energy system must be electrified
to meet Ontario’s legal greenhouse gas limits?
Making Connections: Straight Talk About Electricity in Ontario
Q15

Figure 15.3. Ontario emissions by sector in 2015 compared to emissions by sector needed to meet cap and trade program requirements and satisfy Ontario’s GHG-reduction target in 2030.
Note: The 2030 scenario assumes industrial process and product use emissions are constant and assumes waste and agriculture will achieve maximum potential reductions as outlined by the Trottier Energy Futures Project (linearly interpolated for 2030).5 The scenario shown assumes Ontario will meet its 2030 emission reduction target with domestic emission reductions (including up to 7 Mt of offsets). However, Ontario’s cap and trade system allows for allowances and offset credits from outside the province.
Source: ECO’s analysis, using data from (1) Environment and Climate Change Canada, National Inventory Report 1990-2015: Greenhouse Gas Sources and Sinks in Canada (2017); (2) Section 6(1) of the Climate Change Mitigation and Low-carbon Economy Act, 2016; and (3) the Trottier Energy Futures Project.
What can reduce fossil fuel use?What can reduce fossil fuel emissions so much in so short a time? More conservation, more efficient use of fossil fuels, and more renewable energy use (e.g., bioenergy) will all help.6 But they are not likely to be enough, without substantial fuel switching to low-carbon electricity, because:
• the technical potential for conservation of natural gasis limited7
• there is limited potential to improve the efficiency ofgasoline and diesel use for transportation, becausecurrent technology is approaching the technical limitsof internal combustion engines8
• many current internal combustion engines fortransportation have limited potential to use high levelsof common biofuels (e.g., ethanol and biodiesel)9
• it is difficult to scale up other forms of low-carbonrenewable fuels (e.g., renewable natural gas andrenewable diesel) to replace a significant share offossil fuel use, because potential supplies are small
What can reduce fossil fuel emissions so much in so short a time?
126
66.5
7
22
22
10
9
9
7
0
20
40
60
80
100
120
140
160
180
2015 2030
Ont
ario
GH
G e
miss
ions
(Mt C
O2e
q/yr
)
Waste
Agriculture
Industrial processes and product use
Potential additional energy use ifmaximum offsets are usedEnergy use
Energy GHGsmust decrease 42% to 47%, depending on offsets
233Environmental Commissioner of Ontario 2018 Energy Conservation Progress Report, Volume One
How much of Ontario’s energy system must be electrified
to meet Ontario’s legal greenhouse gas limits?Q15

and/or would have adverse environmental or societal impacts,10 and
• direct uses of renewable energy like passive solar heating (i.e., uses excluding renewable electricity generation) are not able to scale up to meet existing needs in existing buildings (particularly during winter).
In contrast, Ontario could substantially scale up its supply of low-carbon electricity, although this would have its own challenges, including:
• motivating the switch to electricity despite its cost
• managing the winter peaks from additional electricity use in space heating
• finding environmentally appropriate generation sites ( Q10), and
• ensuring that new low-carbon electricity (and any supporting transmission upgrades) are as efficient as possible to minimize the cost to customers.
The Long-Term Energy Plan does not plan for this futureOntario’s 2017 Long-Term Energy Plan (LTEP) should have explored how Ontario can reduce its fossil fuel use enough to comply with the legally binding Climate Act, and selected a plan to do so. Instead, the Ministry of Energy chose to ignore the problem.
As shown in Q13, the LTEP is a critically important policy document. It is the government’s “road map of
the province’s energy system over the next 20 years”11 – and therefore essential information for businesses, the broader public sector, and the provincial government. It is the only document that outlines the province’s macro-level, long-term energy policies. The LTEP is updated every three to four years, and is supposed to take into account, among other things, advancements in technology, evolving government policy, updated energy use data and supply and demand forecasts.
In 2016, the province released two background documents to inform the 2017 LTEP, one about the electricity system (the Ontario Planning Outlook), the other about the remaining energy system fuels (the Fuels Technical Report). Each analyzed several future demand scenarios and their GHG impacts.12 The ECO looked at the implications of these various scenarios for meeting Ontario’s GHG targets in Developing the 2017 Long-Term Energy Plan.13 Only by combining the most aggressive GHG reduction scenarios from both documents (which assumed that Ontario would have 2.4 million EVs by 2035, significant electrification of heating, and some electrification in the industrial sector), would Ontario’s energy sector come close to providing a proportional share of GHG emissions reductions in 2030 (i.e., about 31% below 2015 emissions).14 However, as mentioned above, the energy sector will actually have to decrease emissions 42% to 47% by 2030, significantly more than its proportional share of reductions, because some other GHG sources (e.g., industrial process and product use emissions) cannot feasibly be reduced.
The 2017 LTEP did not explore what it would take for Ontario’s energy sector to reduce its annual emissions 31% – let alone what is actually needed (at least 42%) – by 2030. The government also did not facilitate informed public debate on the topic during the plan’s development. The LTEP did not disclose the data and assumptions it depends on until 5 months after its release. More importantly, it did not (and still does not) provide energy or GHG forecasts for the energy
Ontario’s 2017 Long-Term Energy Plan should have explored how Ontario can reduce its fossil fuel use enough to comply with the Climate Act.
234
How much of Ontario’s energy system must be electrified
to meet Ontario’s legal greenhouse gas limits?
Making Connections: Straight Talk About Electricity in Ontario
Q15
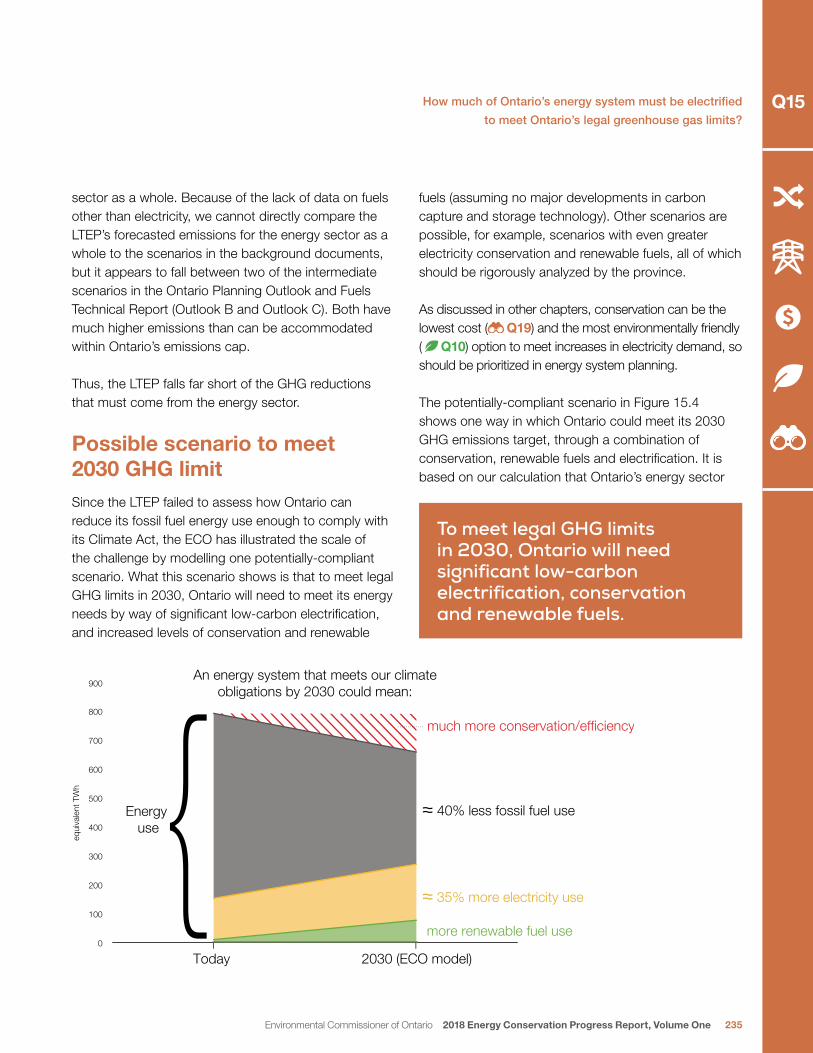
sector as a whole. Because of the lack of data on fuels other than electricity, we cannot directly compare the LTEP’s forecasted emissions for the energy sector as a whole to the scenarios in the background documents, but it appears to fall between two of the intermediate scenarios in the Ontario Planning Outlook and Fuels Technical Report (Outlook B and Outlook C). Both have much higher emissions than can be accommodated within Ontario’s emissions cap.
Thus, the LTEP falls far short of the GHG reductions that must come from the energy sector.
Possible scenario to meet 2030 GHG limitSince the LTEP failed to assess how Ontario can reduce its fossil fuel energy use enough to comply with its Climate Act, the ECO has illustrated the scale of the challenge by modelling one potentially-compliant scenario. What this scenario shows is that to meet legal GHG limits in 2030, Ontario will need to meet its energy needs by way of significant low-carbon electrification, and increased levels of conservation and renewable
fuels (assuming no major developments in carbon capture and storage technology). Other scenarios are possible, for example, scenarios with even greater electricity conservation and renewable fuels, all of which should be rigorously analyzed by the province.
As discussed in other chapters, conservation can be the lowest cost ( Q19) and the most environmentally friendly ( Q10) option to meet increases in electricity demand, so should be prioritized in energy system planning.
The potentially-compliant scenario in Figure 15.4 shows one way in which Ontario could meet its 2030 GHG emissions target, through a combination of conservation, renewable fuels and electrification. It is based on our calculation that Ontario’s energy sector
To meet legal GHG limits in 2030, Ontario will need significant low-carbon electrification, conservation and renewable fuels.
An energy system that meets our climateobligations by 2030 could mean:
much more conservation/efficiency
40% less fossil fuel use
2030 (ECO model)Today
equi
vale
nt T
Wh
900
800
700
600
500
400
300
200
100
0
Energy use
35% more electricity use
more renewable fuel use
235Environmental Commissioner of Ontario 2018 Energy Conservation Progress Report, Volume One
How much of Ontario’s energy system must be electrified
to meet Ontario’s legal greenhouse gas limits?Q15

(including both fuels and electricity generation) can emit 73.5 Mt in 2030, at most. This is based on the same assumptions as Figure 15.3, namely:
• the 88.5 Mt allowance cap for that year set by O.Reg. 144/16
• minus 22 Mt for industrial process and product use emissions
(assuming they will remain at their current level (22 Mt) through 2030, with increases due to economic growth offset by small reductions in emission intensity for some uses)
• which leaves about 66.5 Mt in allowances for the energy sector
• plus up to 7 Mt in offset credits (capped emitters can meet up to 8% of their compliance obligations from offset credits (7 Mt), if all possible offset credits were used by the energy sector, it would result in about 73.5 Mt in 2030).
In 2015, Ontario’s energy sector emitted approximately 126 Mt, so 73.5 Mt in 2030 represents a 42% reduction.
The starting point for the potentially-compliant scenario in Figure 15.4 is a combination of Outlook F in the Fuels Technical Report and Outlook D in the Ontario Planning Outlook. Together, these two outlooks assume aggressive levels of conservation (of both fossil fuels and electricity), public transit ridership, alternative fuels (renewable natural gas, biodiesel, etc.), and moderate amounts of low-carbon electrification (electric cars, space heating). These two outlooks would result in energy sector emissions of 92 Mt in 2030 (87 Mt from fuels and 5 Mt from electricity generation). This exceeds maximum allowable energy sector emissions in 2030 by at least 19 MT. In order to stay within the GHG limit outlined above (i.e., 73.5 Mt), the scenario in Figure 15.4 assumes further emission reductions in 2030 would have to be achieved through a combination of:
• Fuels conservation: doubling of the conservation measures assumed in the Fuels Technical Report’s Outlook F (more home insulation, more transit, etc.)
• Electricity conservation: of an extra 7 TWh a year of electricity demand (i.e., about 5% of overall demand15) that is additional to Ontario’s existing electricity conservation target
• Electrification:16
- of an additional 12 TWh a year worth of transportation fuel use,17 and
- of an additional 17 TWh a year worth of natural gas used for residential and commercial space heating.18
In this scenario, annual electricity demand in 2030 would be 194 TWh: 29 TWh from additional electrification minus 7 TWh of additional conservation equals a net increase of 22 TWh, on top of the 172 TWh from the most aggressive GHG-reduction scenarios considered in the LTEP background technical reports. 194 TWh in 2030 is about a third larger than the 2017 LTEP forecast of 145 TWh in 2030.
Increasing supply to meet this demand is well within the capabilities of Ontario’s electricity industry if planning and development began immediately. More challenging could be persuading Ontario consumers and businesses to purchase heat pumps and electric vehicles in the required numbers.
The current LTEP plan, the most aggressive government planning scenarios, and the ECO’s potentially-compliant scenario are illustrated in Figure 15.4 (energy use) and Figure 15.5 (emissions).
-
-
In this scenario, annual electricity demand in 2030 would be 194 TWh, about a third larger than the 2017 LTEP forecast for 2030.
236
How much of Ontario’s energy system must be electrified
to meet Ontario’s legal greenhouse gas limits?
Making Connections: Straight Talk About Electricity in Ontario
Q15

Figure 15.4. Ontario’s 2030 energy use scenarios: (1) the 2017 LTEP, (2) the most aggressive GHG reduction scenario considered in the LTEP background technical reports, and (3) a potentially-compliant scenario developed by the ECO that could meet Climate Act requirements.
Notes: Because only the electricity sector is considered in the 2017 LTEP, The ‘Current 2030 plan’ assumes business-as-usual for other fuels (as per Fuels Technical Report Scenario B), except for a small decrease in liquid fossil fuel use to account for the 2017 LTEP’s electrification assumptions. The ‘most aggressive GHG-reduction scenario’ is a combination of Outlook D of the Ontario Planning Outlook (electricity) and Outlook F of the Fuels Technical Report.
Source: ECO’s analysis.
Figure 15.5. Ontario 2030 GHG emission scenarios: (1) 2017 LTEP, (2) the most aggressive GHG reduction scenario considered in the LTEP background technical reports, and (3) a potentially-compliant scenario that could meet Climate Act requirements.
Note: Industrial processes and product use, agriculture, and waste are assumed based on the findings of the Trottier Energy Futures Project.19 For ‘energy (excluding electricity)’ and ‘electricity generation’, the 2017 LTEP is based on a combination of the electricity analysis from the 2017 LTEP and Outlook B of the Fuels Technical Report. The ‘most aggressive GHG-reduction scenario’ is a combination of Outlook D of the Ontario Planning Outlook and Outlook F of the Fuels Technical Report.
Source: ECO’s analysis.
145 172 194
276 222 180
265
178128
90
81
81
21
76
76
0
100
200
300
400
500
600
700
800
900
Current 2030 plan(from 2017 LTEP)
Most aggressive GHG-reduction scenario
(from LTEP technical reports)
Potentially-compliantscenario to meet
Climate Act requirements
Ont
ario
ene
rgy
use
in 2
030
(eTW
h)
Renewable fuelsIndustrial fuelsNatural gas and propaneLiquid fossil fuelsElectricity
4 5 6.4
122
8767.1
22
22
22
10
10
10
9
9
9
0
20
40
60
80
100
120
140
160
180
Current 2030 plan(from 2017 LTEP)
Most aggressive GHG-reduction scenario
(from LTEPTechnical Reports)
Potentially-compliantscenario to meet
Climate Act requirements
Ont
ario
203
0 G
HG
em
issio
ns (M
t CO
2eq/
yr)
Waste (assumed)
Agriculture (assumed)
Industrial processes andproduct use (assumed)
Energy (ecxcluding electricity)
Electricity generation
Emissions target
237Environmental Commissioner of Ontario 2018 Energy Conservation Progress Report, Volume One
How much of Ontario’s energy system must be electrified
to meet Ontario’s legal greenhouse gas limits?Q15

What this modelling exercise makes clear is that the 2017 LTEP does not plan for adequate levels of electrification:
• the LTEP assumes 2.4 million electric vehicles using 8 TWh a year of electricity by 2035; the ECO’s potentially-compliant scenario assumes more than three times this level in 2030, and
• while the LTEP mentions electric heat pumps, and their potential to reduce fossil fuel use for space and water heating, it does not plan for any related increase in electricity demand.
Note to reader
This is only one possible scenario. This scenario does not include a cost or feasibility analysis; it is provided for conceptual purposes only. Other potentially-compliant scenarios could and should be considered, but any scenario that includes less growth in electricity demand would also need to include correspondingly greater conservation of fuels and/or conventional electricity uses. This is because the ECO’s research suggests that any development of alternative fuels significantly beyond that assumed in the Fuels Technical Report’s Outlook F would result in environmental damage.20 The requirement for electrification would be even higher if the assumed levels of conservation and alternative fuels development were not achieved.
Is the ECO scenario plausible?Ontario has at least two major opportunities for substantial switching from fossil fuels to electricity:
• transportation of passenger vehicles, and
• space and water heating.21
Electrification of industry is not discussed below, as it requires a more detailed, complex, and industry-specific analysis. Much of industry’s carbon footprint is due to process reactions and related high-temperature process heating, which cannot feasibly be electrified.22 However, some lower temperature space and water-heating electrification potential also exists within industry.23
Transportation
Transportation is Ontario’s largest source of greenhouse gas emissions (39% in 2015), and it has grown an average of 1.4% per year since 1990.24 Within transportation, passenger vehicles are Ontario’s largest single source of greenhouse gas emissions (21% of total 2015 emissions), although emissions from freight are the fastest growing.25
The 2017 Long-Term Energy Plan assumes that 2.4 million EVs will be on Ontario’s roads by 2035.26 This would mean about 25% of all cars, trucks and other vehicles on the road,27 and 50% of new vehicle sales, are electric by 2035. Note that this is merely an assumption, not an official target, and Ontario does not have a plan to achieve it. The ECO model suggests
The 2017 LTEP does not plan for adequate levels of electrification.
Ontario has at least two major opportunities for substantial switching from fossil fuels to electricity.
238
How much of Ontario’s energy system must be electrified
to meet Ontario’s legal greenhouse gas limits?
Making Connections: Straight Talk About Electricity in Ontario
Q15
that three times this level of planned transportation electrification is needed. (In contrast, EVs made up only 1.6% of new vehicle sales in 2017,28 despite subsidies that already make EV ownership cost-competitive, especially for those who drive longer distances or keep their cars longer than 5 years.)
Ontario’s only official EV target is for 5% of new car sales to be electric or hydrogen by 2020.29 The need for a longer-term, more ambitious target is clear.
Electrifying transportation is recognized across the globe as good public policy, and is a prominent feature of countries’ pledges to the Paris Agreement. Many countries have announced that they will be banning the sale of gasoline- and diesel-fueled vehicles altogether, some as early as 2025, others by 2040.30 These planned bans are driven both by national climate targets, and by local air pollution and health objectives. Fossil-fueled vehicles are a major cause of urban air pollution. As a result, other countries have reached higher rates of EV penetration. For example, in 2017, 39% of Norway’s new vehicle sales were plug-in electric vehicles, including hybrid vehicles, it was 52%.31
Electric vehicles might also provide important electricity grid-balancing opportunities. For example, if EVs charge during low demand periods (e.g., overnight), they can provide a productive use of Ontario’s surplus capacity of clean electricity during low demand periods ( Q16). The amount of power curtailed in 2017 due to lack of demand was enough to power the projected 2.4 million EVs, and the Ontario government has committed to providing four years of free overnight charging.32 EVs may also provide electricity storage for homes or the grid, though this might shorten the life of the vehicle’s expensive battery ( Q16).33 Ontario’s
electricity grid operator and local electricity distribution companies are working on how to manage this intricate new relationship, but overall, it appears that EVs can be a net benefit to the grid.34
Space and water heating
Ontario’s Independent Electricity System Operator (IESO) identified space and water heating as having the largest quantitative potential for electrification.35 Despite this, the 2017 LTEP forecast, though it discusses low-carbon fuel alternatives for heating at several points, does not appear to assume any significant electrification of heating, beyond the minimal, short-term commitments in the five-year Climate Change Action Plan.36
Buildings generate about 22% of Ontario’s GHG emissions, primarily due to the use of natural gas for space and water heating.37 In 2015, three expert reports to the Canadian government advised that electrification of building heating is critical to achieving a low-emissions energy system.38 This is particularly true in Ontario, which has a higher ratio of natural gas to electricity use for space and water heating than most other provinces ( Q8), and a low-carbon electricity supply.
Because heat pumps can replace both furnaces and also offer air conditioning, their capital costs can be comparable (at least for air source heat pumps; ground source heat pumps have higher upfront costs but lower operating costs, due to their higher efficiency).39 Air conditioning may be increasingly attractive to both residents and businesses as summer heat waves become more common. The Government of Ontario also subsidizes some of the capital costs for electric heat pumps for homes heated by propane,
Subsidies already make EV ownership cost-competitive.
Electrification of building heating is critical.
239Environmental Commissioner of Ontario 2018 Energy Conservation Progress Report, Volume One
How much of Ontario’s energy system must be electrified
to meet Ontario’s legal greenhouse gas limits?Q15

oil or electricity through the Green Ontario Fund and saveONenergy electricity conservation programs. However, homes heated by natural gas (the largest share of space heating by far) are not currently eligible for incentives for air source heat pumps.40 As a result, electrification of heating will likely be more challenging
than electric vehicles particularly for residents without the capital or tenants without permission to make the change.
The operating costs of electric pump heating are high compared to natural gas heating. Although heat pumps typically use less than half as much energy to heat than natural gas furnaces, electricity is far more than twice the price of natural gas (although the price differential is not as great during off-peak hours, and the Fair Hydro Plan has further reduced this disparity, Q8) (see Figure 15.6).41 Heat pumps are already cost-competitive against less-efficient fuel oil, propane or electric baseboard heating,42 especially when buildings are more energy efficient.
Figure 15.6. A comparison of recent electricity and natural gas prices in Ontario.
Note: Rates do not include delivery charges. Union Gas includes transportation charges as of January 2017.
Source: “Historical natural gas and electricity rates”, online: Ontario Energy Board <www.oeb.ca/rates-and-your-bill/natural-gas-rates/historical-natural-gas-rates>. [Accessed December 2017]
Heat pumps also offer air conditioning, which will be increasingly attractive as summer heat waves become more common.
0
10
20
30
40
50
2006 2007 2008 2009 2010 2011 2012 2013 2014 2015 2016 2017
Ener
gy p
rice
($/G
J)
Electricity (price rangebetween on- and off-peak)
Gas (Enbridge)
Gas (Union)
240
How much of Ontario’s energy system must be electrified
to meet Ontario’s legal greenhouse gas limits?
Making Connections: Straight Talk About Electricity in Ontario
Q15

Carbon pricing can help incent fuel switching to lower carbon energy sources.43 However, forecasted carbon prices from Ontario’s cap and trade program are too low to stop fuel switching away from electricity in the space heating sector, let alone incent fuel switching towards electricity.44 Carbon pricing is projected to add less than $1/GJ natural gas by 2020. Currently, electricity is about $30/GJ on average, while natural gas is about $5/GJ (see Figure 15.6). In other words, current carbon prices alone are unlikely to make switching to electric heating financially attractive.
A second challenge with electric heating (if not managed carefully) is related to the electricity grid. Electricity used for heating would be concentrated in the coldest months of the year, and could increase the use of Ontario’s electricity in periods of peak demand. Since Ontario currently uses natural gas-fired electricity to meet peak demand, this could increase emissions. Existing
technologies, such as smart thermostats and thermal storage (e.g., ceramic heaters), have some ability to reduce peak demand, and thus use of natural gas power plants. These technologies can help spread heating loads over the course of a day. There would be little GHG benefit, and a considerable cost penalty, to converting heating from direct use of natural gas to natural gas-fired electricity, so it is important that the additional electricity source at the margin be low-carbon.
How to meet incremental winter electricity demand without ramping up natural gas-fired electricity generation? One option is to use natural gas furnaces as backup heaters on the coldest days, when heating demand is at its highest and heat pump performance would be at its worst. The rest of the heating (and cooling) load would be provided by small, add-on heat pumps, supplying the majority of the energy needed over the course of the year from low-carbon electricity (see Figure 15.7.).45
Figure 15.7. Electric and natural gas heating systems can work together to reduce the costs of emission reductions.
Note: -5 degrees is assumed to be the threshold at which the natural gas furnace takes over heating.
Source: “Data Download for Ottawa”, online: Weatherstats.ca <ottawa.weatherstats.ca/download.html>. [Accessed 20 March 2018]
0
5
10
15
20
25
30
35
40
45
Janu
ary 1
Febru
ary 1
March 1
April 1
May 1
June
1Ju
ly 1
Augus
t 1
Septem
ber 1
Octobe
r 1
Novem
ber 1
Decem
ber 1
2017
Otta
wa
heat
ing
degr
ee d
ays
Natural gas heating
Electric heating
241Environmental Commissioner of Ontario 2018 Energy Conservation Progress Report, Volume One
How much of Ontario’s energy system must be electrified
to meet Ontario’s legal greenhouse gas limits?Q15

More opportunities exist in new buildings. They can be built to higher energy efficiency levels so that the cost premium for using electric heating (and the grid impact) is not as great. They can also be designed to make better use of building or neighbourhood-scale thermal storage, and higher-efficiency ground source heat pumps, to reduce winter peak demand.46
ConclusionOntario is facing a major transformation of its energy system. In order to comply with the limits on fossil fuel emissions in the Climate Act, and to meet Ontario’s GHG reduction targets, Ontario must plan for a future where electricity use rises steadily (about 35% by 2030), in addition to aggressive increases in conservation and in renewable fuel production. This is a big shift in a short time. The average life span of a vehicle and a furnace is 15 to 25 years. If Ontario is to meet its climate targets and emissions caps, serious planning needs to start now.
This transformation to electricity offers important benefits but also hard choices, which the government should make openly and in full consultation with Ontarians. The 2017 Long-Term Energy Plan does not do these things, and does not fulfill the Ministry of Energy’s legal obligation to plan Ontario’s energy system, which includes planning for all fuels (not just electricity).
If Ontario is to meet its climate targets and emissions caps, serious planning needs to start now.
242
How much of Ontario’s energy system must be electrified
to meet Ontario’s legal greenhouse gas limits?
Making Connections: Straight Talk About Electricity in Ontario
Q15

Endnotes
1 Section 6(1) of the Climate Change Mitigation and Low-carbon Economy Act, 2016.
2 Section 6(1) of the Climate Change Mitigation and Low-carbon Economy Act, 2016, for Ontario emission reduction targets; Section 54 of The Cap and Trade Program, O.Reg 144/16 for Ontario’s allowance caps to 2030.
3 Trottier Energy Futures Project Partners, Canada’s Challenge and Opportunity, Transformations for Major Reductions in GHG Emissions, Full Technical Report and Modelling Results (Ottawa: The Canadian Academy of Engineering, April 2016) at 18.
4 Ontario’s population in 2015 was 13,797,038, and the reference case projection for 2030 is 15,606,083 (“Ontario Population Projections Update, 2016-2041”, online: Ministry of Finance <www.fin.gov.on.ca/en/economy/demographics/projections/table1.html>. [Accessed 15 March 2018])
5 All sectors need to make changes in order to meet Canada’s 2050 climate change target, but there are limits for some sectors. By 2050, potential industrial process emissions reductions are negligible, agricultural emissions reductions are not likely to exceed 15%, and the most ambitious waste emission reductions are 50%. (Trottier Energy Futures Project Partners, Canada’s Challenge and Opportunity, Transformations for Major Reductions in GHG Emissions, Full Technical Report and Modelling Results (Ottawa: The Canadian Academy of Engineering, April 2016) at 12, 15, 19 and 22.)
6 Carbon capture and storage from fossil fuel combustion, if and when it becomes commercially available, could also help.
7 By 2030, the technically achievable potential for natural gas conservation in Ontario is considered to be up to 45%, though not in a manner that is economic, that looks more like 26%, a manner that is practical looks more like 18%. (ICF International, Natural Gas Conservation Potential Study (Toronto: Ontario Energy Board, 7 July 2016) at ii and iv); In high electrification scenarios, the economic conservation potential is lower. (Navigant, Fuels Technical Report (Ministry of Energy: Toronto, September 2016) at 36.)
8 David Chandler, “Explained: The Carnot Limit”, MIT News (19 May 2010), online: <news.mit.edu/2010/explained-carnot-0519>; However there remains some potential efficiency gains within that limit, e.g., through the use of lighter-weight car manufacturing materials (“Technology Collaboration Programmes: Advanced Materials for Transportation”, online: International Energy Agency <www.iea.org/tcp/end-use-transport/amt/>. [Accessed 23 February 2018])
9 Provincial renewable content requirements for gasoline (10%) and diesel (4%) are approximately the quantities of ethanol and biodiesel, respectively, that can be widely used in conventional vehicles. Relatively low cost vehicle modifications can enable the use of higher quantities of ethanol or biodiesel.
10 The Ontario Planning Outlook forecasts 20% alternative fuels penetration by 2035 as the most aggressive future scenario, however this assumes significantly lower fossil fuel demand (Navigant, Fuels Technical Report (Ministry of Energy: Toronto, September 2016) at 38); Only 5.6% of 2010 natural gas distribution in Ontario is the estimated renewable natural gas potential in Ontario (Environmental Commissioner of Ontario, Every Drop Counts: Reducing the Energy and Climate Footprint of Ontario’s Water Use (Toronto: ECO, May 2017) at 120).
11 Ontario Government, News Release, “Backgrounder: 2017 Long-Term Energy Plan” (26 October 2017).
12 The Ontario Planning Outlook considers four scenarios for electricity to 2035, called “A” (lowest level of electricity use) to “D” (highest level of electricity use, due to electrification of transportation and heating). The Fuels Technical Report considers five scenarios for all other fuel use, called “B” (highest level of fossil fuel use) to “F” (lowest level of fossil fuel use). Scenarios “B” through “D” for the fuels sector make the same assumptions about electrification of fossil fuel use that are in the electricity scenarios “B” through “D”. Fuel sector scenarios “E” and “F” both assume the same level of electrification as Scenario “D”, but also assume additional measures to reduce fossil fuel use.
13 Environmental Commissioner of Ontario, Developing the 2017 Long-Term Energy Plan, Special Report (Toronto: ECO, December 2016).
14 Ibid, at Figure 3.
15 Based on projected electricity demand in Ontario Planning Outlook’s Outlook B.
16 The potentially-compliant scenario in Figure 15.4 is based on the estimate that electrification can reduce energy sector GHG emissions by approximately 1 Mt for every additional 2 TWh of electricity generation. This estimate is based on the following: • electric vehicles and heat pumps are more efficient than conventional
vehicles and furnaces (EVs can be up to 3 times more efficient than combustion engines, whereas heat pumps can only be up to 2 times more efficient than natural gas furnaces), and
• additional electricity grid supply can be provided with a combination of wind, solar, Ontario and imported hydro and some natural gas generation (to supplement when demand is high and wind/renewables are low). Comparing Outlook B and Outlook D in the IESO’s Ontario Planning Outlook, an additional 29.6 TWh of electricity generation is estimated to increase emissions by 1.5 MT, suggesting an emissions intensity factor of 51 g/kWh or 14 g/MJ. This is significantly lower than the emissions intensity factors for natural gas (50 g/MJ) and liquid fossil fuels (around 71 g/MJ), and the difference is even greater considering that each unit of electric energy can replace 2 to 3 units of fossil energy.
17 i.e., a further 15% reduction in transportation fuel use from the Fuels Technical Report’s Outlook F.
18 i.e., a further 34% reduction in natural gas and renewable natural gas use for space heating. The Fuels Technical Report’s Outlook F already assumes that the use of other fuels for space heating will be almost eliminated in 2030 through electrification and conservation.
19 Trottier Energy Futures Project Partners, Canadas’ Challenge & Opportunity, Transformations for major reductions in GHG emissions (Ottawa: The Canadian Academy of Engineering, April 2016) at 12, 15, 19 and 22.
20 Environmental Commissioner of Ontario, “Ethanol in Gasoline” in Facing Climate Change, Annual Greenhouse Gas Progress Report 2016 (Toronto: ECO, November 2016) at 121.
21 Independent Electricity System Operator, Ontario Planning Outlook (IESO: Toronto, 1 September 2016) at 7.
22 International Energy Agency, World Energy Outlook 2017 (OECD/IEA: Paris, 2017) at 318-320.
23 Ibid.
24 Environmental Commissioner of Ontario, Every Joule Counts, Annual Energy Conservation Progress Report 2016/2017 (Volume Two) (Toronto: ECO, August 2017) at 24.
243Environmental Commissioner of Ontario 2018 Energy Conservation Progress Report, Volume One
How much of Ontario’s energy system must be electrified
to meet Ontario’s legal greenhouse gas limits?Q15
.
.
.
.
.
.
.
.
.
.
.
.
.
.
.
.
.
.
.
.
.
.
.
.

25 Environmental Commissioner of Ontario, Ontario’s Climate Act: From Plan to Progress, Annual Greenhouse Gas Progress Report 2017 (Toronto: ECO, January 2018) at 32-33.
26 Ministry of Energy, Delivering Fairness, Ontario’s Long-Term Energy Plan 2017 (Toronto: Ministry of Energy, 26 October 2017) at 37.
27 In 1999, just over 6 million light-road motor vehicles (vehicles weighing less than 4,500 kgs) were registered, and in 2016 it had risen to just over 8 million, a linear forecast estimates that if the same year-over-year growth continues, by 2035, it would reach 9.8 million. (Calculations by the ECO,
based on historical car registration data from Statistics Canada, Table 405-0004 - Vehicle Registrations, annual (number).)
28 Eric Schmidt, “Electric Vehicle Sales in Canada: 2017 Final Update”, FleetCarma (8 February 2017), online: <www.fleetcarma.com/ev-sales-canada-2016-final/>.
29 Government of Ontario, 2016 Ontario Climate Change Action Plan (Toronto: Government of Ontario, 2016) at 19.
30
Examples of jurisdictions that have committed to ban the sale or use of combustion-engine vehicles (non-exhaustive)
Jurisdiction Ban details Source
Norway Bans sales of fossil fuelled cars by 2025
Jess Staufenberg, “Norway to ‘completely ban petrol powered cars by 2025’”, Independent (4 June 2016), online: <www.independent.co.uk/environment/climate-change/norway-to-ban-the-sale-of-all-fossil-fuel-based-cars-by-2025-and-replace-with-electric-vehicles-a7065616.html>.
India Selling only electric vehicles by 2030
Jackie Wattles, “India to sell only electric cars by 2030”, Money.CNN (3 June 2017), online: <money.cnn.com/2017/06/03/technology/future/india-electric-cars/index.html>.
Britain ban sale of all new petrol and diesel cars and vans from 2040
Anushka Asthana and Matthew Taylor, “Britain to ban sale of all diesel and petrol cars and vans from 2040”, The Guardian (25 July 2017), online: <www.theguardian.com/politics/2017/jul/25/britain-to-ban-sale-of-all-diesel-and-petrol-cars-and-vans-from-2040>.
France ban sales of petrol and diesel cars by 2040
Angelique Chrisafis and Adam Vaughan, “France to ban sales of petrol and disel cars by 2040”, The Guardian (6 July 2017), online: <www.theguardian.com/business/2017/jul/06/france-ban-petrol-diesel-cars-2040-emmanuel-macron-volvo>.
Paris Bans use of all combustion-engine cars by 2030
“Corrected- Paris plans ban on combustion-engine cars by 2030”, Reuters (12 October 2017), online: <www.reuters.com/article/france-paris-autos/corrected-paris-plans-ban-on-combustion-engine-cars-by-2030-idUSL8N1MN13H>.
Netherlands All new sales to be emissions free by 2030
Fred Lambert, “The Dutch government confirms plan to ban new petrol and diesel cars by 2030”, Electrek (20 October 2017), online: <electrek.co/2017/10/10/netherlands-dutch-ban-petrol-diesel-cars-2030-electric-cars/>.
31 Camilla Knudsen and Alister Doyle, “Norway powers ahead (electrically): over half new cars sales now electric or hybrid”, Reuters (3 January 2018), online: <www.reuters.com/article/us-environment-norway-autos/norway-powers-ahead-over-half-new-car-sales-now-electric-or-hybrid-idUSKBN1ES0WC>.
32 10 TWh of power was curtailed in 2017 ( Q7). Typically, an electric vehicle with a daily commuting distance of 40km requires 6-8kWh of energy to recharge (Eric Schmidt, The Impact of Growing Electric Vehicle Adoption on Electric Utility Grids (Fleet Carma, 28 August 2017), online: <www.fleetcarma.com/impact-growing-electric-vehicle-adoption-electric-utility-grids>); 8kWh x 365 days x 2.4 million EVs ≈7 TWh; The province also predicts 8 TWh to be the electricity demand of 2.4 million EVs. (Independent Electricity System Operator, Ontario Planning Outlook (Toronto: IESO, 1 September 2016) at 7.)
33 Ontario Society of Professional Engineers, Ontario’s Energy Dilemma: Reducing Emissions at an Affordable Cost (Toronto: OSPE, March 2016) at 22.
.
.
.
.
.
.
.
.
.
244
How much of Ontario’s energy system must be electrified
to meet Ontario’s legal greenhouse gas limits?
Making Connections: Straight Talk About Electricity in Ontario
Q15

.
.
.
.
.
.
.
.
.
.
.
.
.
34 Fleet Carma is running various pilots across North America to examine different ways to manage the grid impacts of EV charging (see Q16 for further details).
35 About 58 TWh by 2035 of additional electrification is considered in Outlook D of the OPO in the combined residential, commercial and industrial sectors, as compared to an additional 6 TWh considered in Outlook D for electric vehicles. (Independent Electricity System Operator, Ontario Planning Outlook (Toronto: IESO, 1 September 2016) at 7.)
36 The 2017 LTEP electrification assumptions for the residential and commercial sectors are considered to be equivalent to those in the ‘Business-as-Usual’ scenario, OPO, Outlook B. (Independent Electricity System Operator, Ontario Planning Outlook (Toronto: IESO, 1 September 2016) at 7; Ministry of Energy, Delivering Fairness, Ontario’s Long-Term Energy Plan 2017 (Toronto: Ministry of Energy, 26 October 2017) at 42.)
37 In 2015, GHG emissions from Ontario’s residential sector were due primarily to space and water (20.4 of 20.7 Mt), as were commercial/institutional sector GHG emissions (11.9 of 12.3 Mt). Data not available for Ontario’s industrial sector. (“Comprehensive Energy Use Database: Ontario”, online: Natural Resources Canada <oee.nrcan.gc.ca/corporate/statistics/neud/dpa/menus/trends/comprehensive_tables/list.cfm>. [Accessed 15 March 2018])
38 Trottier Energy Futures Project Partners, Canada’s Challenge and Opportunity, Transformations for Major Reductions in GHG Emissions, Full Technical Report and Modelling Results (Ottawa: The Canadian Academy of Engineering, April 2016) at 166, 171-175; Expert Panel on Energy Use and Climate Change, Technology and Policy Options for a Low-Emission Energy System in Canada (Ottawa: Council of Canadian Academies, 2015) at 84; C Bataille et al., Pathways to deep decarbonization in Canada (SDSN & IDDRI, September 2015) at 26.
39 Without considering the impact of existing subsidies. (ICF, Marginal Abatement Cost Curve for Assessment of Natural Gas Utilities’ Cap and Trade Activities (EB-2016-0359) (Toronto: ICF, 20 July 2017) at A-2.)
40 Homes heated by natural gas are eligible for incentives for ground source (geothermal) heat pumps.
41 Independent Electricity System Operator, An Examination of the Opportunity for Residential Heat Pumps in Ontario (Toronto: IESO, 6 March 2017) at 3; Based on 2017 prices in Toronto, electric heat pumps are still more expensive to operate than a gas boiler based on calculations by the Canadian Green Building Council, even when assuming a carbon tax of $50/tonne. (Canada Green Building Council, A Roadmap for Retrofits in Canada: Charting a path forward for large buildings (Ottawa: CGBC, 2017) at 19.)
42 Cold climate air source heat pumps have paybacks less than 5 years vs. fuel oil or electric baseboard heating. (Independent Electricity System Operator, An Examination of the Opportunity for Residential Heat Pumps in Ontario (Toronto: IESO, 6 March 2017) at 19.
43 Ministry of Energy, Delivering Fairness, Ontario’s Long-Term Energy Plan 2017 (Toronto: Ministry of Energy, 26 October 2017) at 42.
44 Dave Sawyer, Jotham Peters & Seteon Stiebert, Impact Modelling and Analysis of Ontario’s Proposed Cap and Trade Program, Overview of Macroeconomic and Household Impacts of Ontario’s Cap and Trade Program (Ottawa: EnviroEconomics, 27 May 2016) at 10. (The 2017 price
impact of Ontario’s cap and trade program on the cost of a 1 m3 of natural gas is assumed to be $0.033. As 26.853 m3 are in 1 GJ, then $0.033 X 26.853 m3 = $0.886/GJ).
45 Tyler Hamilton, “Is reducing natural gas the key to hitting Ontario’s climate targets?”, TVO.org (3 May 2016) online: <tvo.org/article/current-affairs/climate-watch/is-reducing-natural-gas-the-key-to-hitting-ontarios-climate-targets>.
46 Enbridge is considering a geothermal utility model for new building developments in Ontario. (Jennifer Runyon, “Canadian-Based Enbridge Embark on Geothermal Plan” Renewable Energy World (18 April 2017), online: <www.renewableenergyworld.com/articles/2017/04/canadian-based-enbridge-embarks-on-geothermal-plan.html>.)
245Environmental Commissioner of Ontario 2018 Energy Conservation Progress Report, Volume One
How much of Ontario’s energy system must be electrified
to meet Ontario’s legal greenhouse gas limits?Q15

2005
O N TA R I O ’ S E L E C T R I C I T Y F U T U R E
Q U ES T I O N 16
How can Ontario make full use of clean off-peak electricity and prevent it from going to waste?
Instead of curtailing or exporting “surplus” low-carbon off-peak electricity, Ontario should use this power productively within the province.
Options include:
• Storing surplus power and converting it back to electricity, to return to the grid when needed or to power electric vehicles;
• Converting surplus electricity to other forms of energy that are easier to store, such as hydrogen, methane, heat or cold; and/or
• Allowing Ontario individuals and businesses to buy excess power inexpensively.
These actions can also reduce peak demand.
To facilitate these solutions, regulatory changes will be needed to encourage and support technological innovation, particularly in the electricity distribution sector.

247Environmental Commissioner of Ontario 2018 Energy Conservation Progress Report, Volume One
How can Ontario make full use of clean off-peak electricity and prevent it fromgoing to waste? Q16
Contents
THE DETAILS . . . . . . . . . . . . . . . . . . . . . . . . . . . . . . . . . . . . . . . . . . . . . . . . . . . . . . . . . . . . . . . . . . 248
Ontario is not making full use of its low-carbon electricity supply . . . . . . . . . . . . . . . . . . . . . . . 248
How long will Ontario have an electricity surplus? . . . . . . . . . . . . . . . . . . . . . . . . . . . . . . . . . . . . . . 249
Better options for surplus electricity . . . . . . . . . . . . . . . . . . . . . . . . . . . . . . . . . . . . . . . . . . . . . . . 249
Electricity storage . . . . . . . . . . . . . . . . . . . . . . . . . . . . . . . . . . . . . . . . . . . . . . . . . . . . . . . . . . . . . . 250
Pumped hydro storage . . . . . . . . . . . . . . . . . . . . . . . . . . . . . . . . . . . . . . . . . . . . . . . . . . . . . . . . . . 252
Other storage technologies. . . . . . . . . . . . . . . . . . . . . . . . . . . . . . . . . . . . . . . . . . . . . . . . . . . . . . . 254
Innovative electricity storage in Ontario . . . . . . . . . . . . . . . . . . . . . . . . . . . . . . . . . . . . . . . . . . . . . . 254
Enbridge’s Power to Gas Project. . . . . . . . . . . . . . . . . . . . . . . . . . . . . . . . . . . . . . . . . . . . . . . . . . . 255
The economics of grid electricity storage . . . . . . . . . . . . . . . . . . . . . . . . . . . . . . . . . . . . . . . . . . . . 256
Electric vehicle charging . . . . . . . . . . . . . . . . . . . . . . . . . . . . . . . . . . . . . . . . . . . . . . . . . . . . . . . . 258
FleetCarma’s Electric Vehicle Charging Pilots . . . . . . . . . . . . . . . . . . . . . . . . . . . . . . . . . . . . . . . . . 259
Storing electricity as heat or cold . . . . . . . . . . . . . . . . . . . . . . . . . . . . . . . . . . . . . . . . . . . . . . . . . 261
Targeted price discounts for surplus electricity . . . . . . . . . . . . . . . . . . . . . . . . . . . . . . . . . . . . . . 262
Ontario’s Industrial Electricity Incentive Program (IEI) . . . . . . . . . . . . . . . . . . . . . . . . . . . . . . . . . . . . 262
Smarter pricing for all electricity customers . . . . . . . . . . . . . . . . . . . . . . . . . . . . . . . . . . . . . . . . . 263
Local electricity utilities . . . . . . . . . . . . . . . . . . . . . . . . . . . . . . . . . . . . . . . . . . . . . . . . . . . . . . . . . 263
Enabling and rewarding innovation . . . . . . . . . . . . . . . . . . . . . . . . . . . . . . . . . . . . . . . . . . . . . . . . 264
Should LDCs be allowed to pay for innovations through rates? . . . . . . . . . . . . . . . . . . . . . . . . . . . . 265
Conclusion. . . . . . . . . . . . . . . . . . . . . . . . . . . . . . . . . . . . . . . . . . . . . . . . . . . . . . . . . . . . . . . . . . . . 266
Endnotes . . . . . . . . . . . . . . . . . . . . . . . . . . . . . . . . . . . . . . . . . . . . . . . . . . . . . . . . . . . . . . . . . . . . . 267

The details…
Ontario is not making full use of its low-carbon electricity supplyAs discussed in Q7 of this report, Ontario’s nuclear and renewable resources generate more power during some off-peak hours than Ontario has been able to use. Ontario cannot save money by turning off this power, because:
• Renewable power (e.g., wind) has extremely lowoperating costs; and
• Nuclear plants cost virtually the same whether theyare making power or not.
Instead, Ontario curtails (i.e., turns off and wastes) or exports some of its surplus clean electricity.1 The electricity that Ontario curtails (5% of potential production in 2016) or exports (8%) is a resource that
Ontario could make better use of. For 2017, preliminary data indicates that the province curtailed 7% and exported (net) 9% of the electricity produced.2
As shown in Q7, more than half of the surplus is exported for more than it costs to produce that power (its marginal cost), but the rest cannot presently be exported at a financial benefit and so is curtailed. Curtailment of surplus low-carbon power provides no financial, environmental or other benefit to Ontario. Yet the Independent Electricity System Operator (IESO) projects that it will continue to curtail surplus clean electricity for many years – see Figure 16.1.
Figure 16.1. Projected curtailment of Ontario surplus electricity, 2018-2035.
Note: This figure does not include electricity that is projected to be exported out of Ontario.
Source: Independent Electricity System Operator, information provided in response to ECO inquiry (12 January 2018).
Curtailment of surplus low-carbon power provides no financial, environmental or other benefit to Ontario.
0
1
2
3
4
5
6
7
8
2018 2019 2020 2021 2022 2023 2024 2025 2026 2027 2028 2029 2030 2031 2032 2033 2034 2035
Surp
lus
Base
load
Gen
erat
ion
(TW
h)
Year
248 Making Connections: Straight Talk About Electricity in Ontario
Q16

This chapter looks at better options to use surplus power in Ontario, so that Ontario gets full value from the electricity produced by its nuclear, wind, and hydro (without water storage) assets.3
How long will Ontario have an electricity surplus?
The Independent Electricity System Operator (IESO) projects that the province’s surplus will be high through 2020; fall during the Bruce and Darlington nuclear refurbishments from 2021 to 2024; and stay low after the Pickering nuclear station is retired (2024). This projection may assume implementation of some of the methods described in this chapter, such as off-peak electric vehicle (EV) charging.
However, the Long-Term Energy Plan does not plan for the increase in low-carbon electricity supply that will be needed to electrify more of the province’s energy sector, as required by Ontario’s climate law (discussed in Q14). If no other measures are taken, increasing total low-carbon electrical capacity could result in additional off-peak electricity production, i.e., a larger surplus and more curtailment than the IESO predicts.
Better options for surplus electricityOntario has at least three options for using surplus electricity productively:• Storing the power and converting it back to electricity,
- to return to the grid when needed, e.g., through pumped storage, batteries or flywheels
- to charge electric vehicles (EVs).
• Converting electricity to other forms of energy that are easier to store, such as hydrogen, methane, heat or cold, and/or
• Using pricing tools, i.e., allowing Ontarians to buy surplus inexpensively for their electrical needs, if, as and when surplus power is available.
Ontario has at least three options for using surplus electricity productively.
249Environmental Commissioner of Ontario 2018 Energy Conservation Progress Report, Volume One
How can Ontario make full use of clean off-peak electricity and prevent it fromgoing to waste? Q16

Table 16.1. Options to Make Use of Surplus Electricity.
Approach Technologies include Description
Store and use later as electricity – reinject to grid
Flywheels, batteries, pumped storage, power-to-gas, compressed air, electric vehicle-to-grid
Withdraw electricity from the grid, store it for a period of time and then re-inject the electricity back into the grid on demand (minus some losses)
Store and use later as electricity – electric vehicle charging
Electric vehicles Electricity used to charge electric vehicle battery (not reinjected into grid) during off-peak hours
Store as other forms of energy Heat storage, ice production Electricity is consumed off peak to heat or cool a storage medium (often water or air). Used for space heating or cooling, or water heating. This can displace electricity demand of the host facility during peak hours later, or reduce use of fossil fuels that would otherwise be used for heating.
Fuel production, hydrogen or methane, steam production
Withdraw off peak electricity from the grid, convert it to another form of storable energy or fuel which is then subsequently used directly. Examples: power-to-gas where surplus electricity is used to break down water into hydrogen and oxygen and the hydrogen is used as fuel, perhaps through the natural gas system.
Time-shift electricity use through pricing tools
Many Adjust timing of electricity use that is not time-sensitive, usually in response to price signals. Instead of building and operating electricity supply to follow demand, these tools adjust demand for electricity to match the available supply.
By making use of electricity in off-peak hours, some of the options described in Table 16.1 also could reduce electricity use in peak hours.
Electricity storageThe simplest, but not necessarily cheapest, option is to store electricity so that it can be returned back to the grid later as electricity. Electricity storage can offer Ontario’s electricity system a wide range of services, as presented in Figure 16.3.
250
How can Ontario make full use of clean off-peak electricity and prevent it from going to waste?
Making Connections: Straight Talk About Electricity in Ontario
Q16

Figure 16.3. The potential range of services that can be provided by electricity storage.
Source: International Renewable Energy Agency, Electricity Storage and Renewables: Costs and Markets to 2030 (Abu Dhabi: IRENA, October 2017) at 11.
Some of these “ancillary services” can help balance the grid on a very short time scale (seconds) or help provide power quickly if renewable generation production differs from forecast (see Q6). Others provide storage for longer durations, which can help make Ontario’s surplus electricity available later when it is needed. Bulk electricity storage can reduce the need for peaking gas generation plants as the stored electricity can be used to meet spikes in demand. This would not only defer expensive procurement for the province, but also help in meeting Ontario’s greenhouse gas (GHG) reduction goals, as illustrated in Figure 16.4.
The simplest, but not necessarily cheapest, option is to store electricity so that it can be returned back to the grid later as electricity.
Bulk energyservices
Electric energytime shift
(arbitrage) Regulation Transmission
upgrade deferralDistribution
upgrade deferralPower quality
Ancillaryservices
Electric supplycapacity
Spinning, non-spinning and
supplemental reserves
Transmissioncongestion relief
Voltage support Power rellability
Voltage support Retail electricenergy time shift
Black start Demand chargemanagement
Transmissioninfrastructure
services
Distributioninfrastructure
services
Customer energymanagement
servicesOff-grid
Solar homesystems
Mini-grids:System stability
services
Mini-grids:Facilitating high
share of variable renewable
energy
Electric 2/3wheelers, buses,
cars andcommercial
vehicles
Transportsector
Boxes in red: Energy storage services directly supporting the integration of variable renewable energy
Increasedself-consumption
of solar PV
251Environmental Commissioner of Ontario 2018 Energy Conservation Progress Report, Volume One
How can Ontario make full use of clean off-peak electricity and prevent it fromgoing to waste? Q16
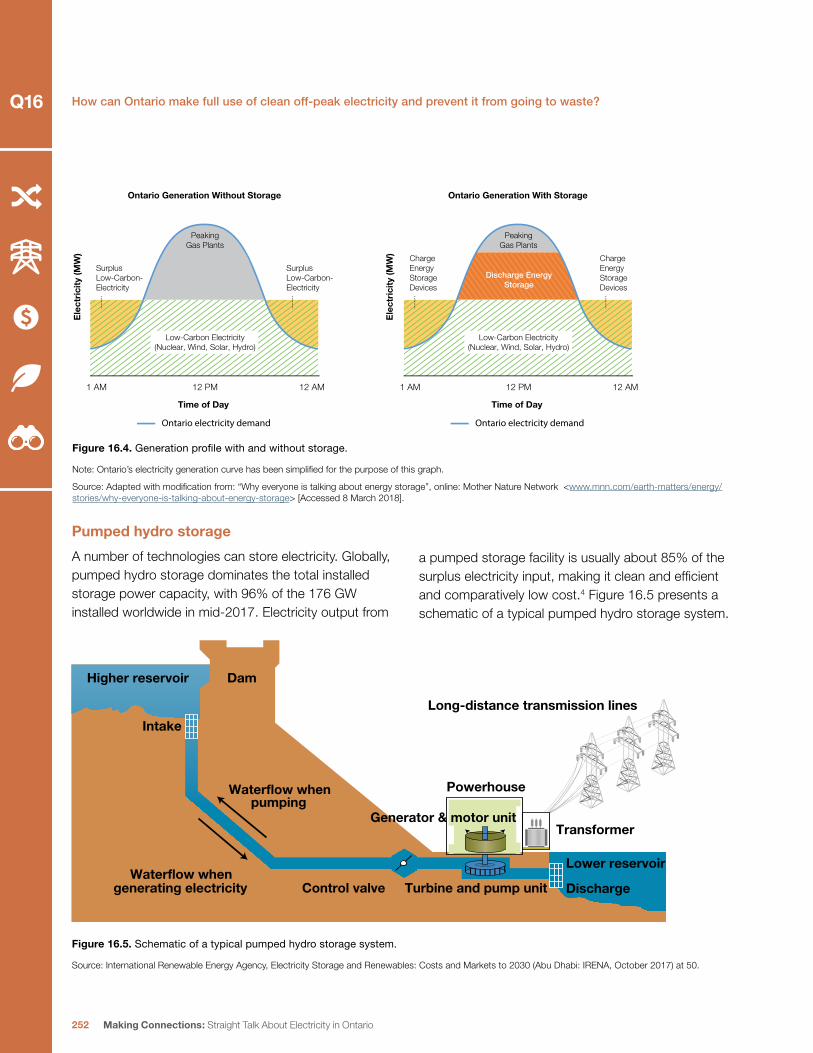
Ontario Generation Without Storage Ontario Generation With Storage
Figure 16.4. Generation profile with and without storage.
Note: Ontario’s electricity generation curve has been simplified for the purpose of this graph.
Source: Adapted with modification from: “Why everyone is talking about energy storage”, online: Mother Nature Network <www.mnn.com/earth-matters/energy/stories/why-everyone-is-talking-about-energy-storage> [Accessed 8 March 2018].
Pumped hydro storage
A number of technologies can store electricity. Globally, pumped hydro storage dominates the total installed storage power capacity, with 96% of the 176 GW installed worldwide in mid-2017. Electricity output from
a pumped storage facility is usually about 85% of the surplus electricity input, making it clean and efficient and comparatively low cost.4 Figure 16.5 presents a schematic of a typical pumped hydro storage system.
Figure 16.5. Schematic of a typical pumped hydro storage system.
Source: International Renewable Energy Agency, Electricity Storage and Renewables: Costs and Markets to 2030 (Abu Dhabi: IRENA, October 2017) at 50.
Elec
tric
ity (M
W)
SurplusLow-Carbon-Electricity
SurplusLow-Carbon-Electricity
PeakingGas Plants
Low-Carbon Electricity(Nuclear, Wind, Solar, Hydro)
Elec
tric
ity (M
W)
1 AM 12 PM
Time of Day
12 AM
Discharge EnergyStorage
Ontario electricity demand
ChargeEnergyStorageDevices
ChargeEnergyStorageDevices
PeakingGas Plants
Low-Carbon Electricity(Nuclear, Wind, Solar, Hydro)
1 AM 12 PM
Time of Day
12 AM
Ontario electricity demand
Higher reservoir
Intake
Dam
pumpingWaterflow when
Waterflow whengenerating electricity Turbine and pump unitControl valve
Powerhouse
Generator & motor unitTransformer
Long-distance transmission lines
Lower reservoir
Discharge
252
How can Ontario make full use of clean off-peak electricity and prevent it from going to waste?
Making Connections: Straight Talk About Electricity in Ontario
Q16

Pumped storage hydro at Niagara Falls has historically been Ontario’s only form of grid-scale storage.5 The Pumped Generating Station reservoir is 300 hectares (750 acres) in size, and holds 20 billion litres of water (enough to fill 8,000 Olympic-sized swimming pools). This reservoir is similar to a giant battery for the electricity system, because it stores water to be used for generation when power is needed the most. The station is capable of pumping 680,000 litres of water a second, which will fill the reservoir in about eight hours. This station recently completed a $60 million refurbishment, and can operate for another 50 years or more.
Pumped hydro storage is an important tool for curbing peak demand and reducing GHGs.6 However, the Niagara pumped storage facility has been used little in
recent years, due to regulatory barriers and charges. It is a wasted opportunity for Ontario to curtail so much low-carbon power while leaving the Niagara pumped storage facility underused. Ontario Power Generation is working with the IESO to examine how changes through Market Renewal ( Q17) could improve utilization of the Niagara pumped storage facilities.
Ontario has two other major pumped storage opportunities that are not currently being pursued. One is the proposed pumped storage project in the Marmora Mine in eastern Ontario. The site, which is currently not in use, could be converted to a 400 MW pumped storage facility that would use surplus electricity from off-peak hours to pump water from a cavern deep in the old mine to an upper reservoir that would flow back during on-peak hours to generate electricity and supply the grid. Another potential pumped storage site is the existing Lower Notch Generating Station and dam on the Montreal River.7 This site could use existing generation and reservoir infrastructure, and environmental impacts would likely be minimal. 300 MW of potential new peaking capacity could come from this location. However, the
Sir Adam Beck Generating station, with the pumped storage hydro reservoir on the top left, Niagara Falls, Ontario.
Source: Ontario Power Generation.
Pumped storage hydro at Niagara Falls has historically been Ontario’s only form of grid-scale storage.
253Environmental Commissioner of Ontario 2018 Energy Conservation Progress Report, Volume One
How can Ontario make full use of clean off-peak electricity and prevent it fromgoing to waste? Q16

IESO considers the Northeast Zone where the station is located to be “transmission capacity constrained” and has no plans to procure additional transmission capacity to this location.
Festival Hydro battery storage facility.
Source: Festival Hydro.
Other storage technologies
Other storage technologies used around the world include thermal storage at 3.3 GW (1.9% of global storage), batteries at 1.9 GW (1.1%) and others, including flywheels and compressed air, at 1.6 GW (0.9%).8
Some examples of using batteries to make use of renewables and reduce peaking generation are described in Q6. Another is the $24 million, 2.2 MW battery storage project in North Cape, Prince Edward Island, started in 2014. Local wind energy that is not needed at the time of generation is stored in batteries and used during other times of the day when there is higher demand. The batteries can store enough electricity to power 600 homes for 2 hours. Storage
reduces expensive diesel-fueled generation or electricity imports from New Brunswick and enables P.E.I. to make better use of its local renewable power, saving money and reducing GHG emissions.9
Innovative electricity storage in Ontario
The IESO began looking for innovative electricity storage in 2012 through a small, 2 MW pilot. In 2014, the IESO procured 50 MW of energy storage (34 MW) from 5 companies to provide ancillary services, and another 16.75 MW for bulk storage (roughly 4 hours worth, if operated at maximum power).10 11 Storage technologies selected include batteries, compressed air, hydrogen and thermal storage.
One notable project is Festival Hydro’s battery storage facility in Stratford, Ontario, the largest of its kind in Canada. The capacity of the four lithium ion battery cell arrays is around 8.8 MW and will be used by the IESO to pilot reactive support, voltage control and demand response during peak hours.12 The project
The IESO began looking for innovative electricity storage in 2012.
254
How can Ontario make full use of clean off-peak electricity and prevent it from going to waste?
Making Connections: Straight Talk About Electricity in Ontario
Q16

is a partnership between various private enterprises, Festival Hydro and the IESO.
Another potential form of energy storage is compressed air storage, which can be stored for comparatively long periods, from days to weeks. One such project is the partnership between Toronto Hydro and Hydrostor Inc.
to analyze the electrical grid benefits of underwater compressed air storage. During off-peak hours, surplus electricity is stored by driving compressed air into a flexible wall air accumulator below Lake Ontario’s surface. When there is demand, the water weight drives the stored air into an expander that drives a generator to supply electricity back to the grid.
Enbridge’s Power to Gas Project13
Another storage project selected by the IESO is a 2 MW power-to-gas project by Enbridge Gas, in partnership with Hydrogenics Corporation. This will be North America’s first utility-scale project that will convert surplus off-peak electricity to hydrogen and then back to electricity when grid demand peaks. When the IESO has surplus electricity, the electrolyser will separate pure water molecules into hydrogen and oxygen. While the oxygen is (for now) released into the environment, the hydrogen is stored in fuel tanks, large enough to produce 8 MWh of electricity. When the IESO signals that there is peak demand, the hydrogen will be converted back to electricity by a fuel cell and fed back to the provincial grid. This project is expected to be in commission by mid-2018.
The hydrogen from this process will be used to generate electricity, not mixed into the natural gas that Enbridge’s pipelines deliver to consumers. This is partly because hydrogen can escape easily and can also be corrosive to the gas infrastructure at high concentrations. In addition, after July 1, 2018, electricity that is stored and returned to the grid as electricity will benefit from a substantial price discount, which is not available for converting electricity to gas.14 However, Enbridge is also assessing options to create renewable natural gas, e.g., by blending small amounts of hydrogen into natural gas or converting the hydrogen into methane.
Electrolyser at the Enbridge Power to Gas facility in Markham, Ontario.
Source: Enbridge Gas Distribution.
255Environmental Commissioner of Ontario 2018 Energy Conservation Progress Report, Volume One
How can Ontario make full use of clean off-peak electricity and prevent it fromgoing to waste? Q16

The province’s Long-Term Energy Plan has recognized the importance of energy storage and has promised to eliminate regulatory barriers to encourage its wider use. Through the Smart Grid Fund, the province has also been investigating the different operational and practical aspects of storage and how it can support the future grid.
The economics of grid electricity storage
One of the biggest barriers to large-scale electricity storage, other than pumped storage, has been their cost, combined with the low price differential between on-peak and off-peak power. However, storage costs are expected to drop by 30-65% by 2030 because of increased performance of the technologies, decreasing
material costs, increased competition, expanding research and development, and favourable policy and regulatory changes.
Table 16.2 looks at some electricity storage options and their present and estimated future costs.15
Table 16.2. Electricity Storage Technologies Cost Comparisons.
Electricity Storage Technologies 2016 cost ($ U.S./kWh of storage capacity)
2030 cost ($ U.S./kWh of storage capacity)
Pumped storage $10-$100 $10-$100
Compressed air $20-$90 $15-$70
Flywheel $2000-$6000 $1000-$4000
Lithium-ion batteries $200-$1500 $0-$800
Lead acid batteries $100-$500 $50-$250
Flow batteries $200-$2000 $100-$1000
High-temperature battery storage $300-800 $200-500
Source: International Renewable Energy Agency, Electricity Storage and Renewables, Costs and Markets to 2030 (Abu Dhabi: IRENA, October 2017) at 55-89.
Figure 16.6 estimates the potential of the technologies listed in Table 16.2 in terms of discharging power and power ratings.
One of the biggest barriers has been their cost, combined with the low price differential between on-peak and off-peak power.
256
How can Ontario make full use of clean off-peak electricity and prevent it from going to waste?
Making Connections: Straight Talk About Electricity in Ontario
Q16

Figure 16.6. Energy storage technologies per their power rating and discharge times at rated power.
Source: International Renewable Energy Agency, Electricity Storage and Renewables, Costs and Markets to 2030 (Abu Dhabi: IRENA, October 2017) at 41.
The costs in Table 16.2 are the capital cost for a given amount of electricity storage (e.g., the size of a battery). To assess the economics of bulk electricity storage, we are also interested in the round-trip cost to withdraw a unit of electricity and reinject it into the grid, which depends on other factors, such as how much energy is lost in conversion, and the technology’s operating life. For example, a 2017 Lazard study estimates that a grid-scale lithium-ion battery project with an installed cost of $335 per kWh of capacity, would have a round-trip cost of 28.2 cents per kWh of electricity, if operated every day over 20 years.17 The economics will be worse if the storage is used less than daily.
Buying off-peak electricity from the grid when prices are low, and selling it back when demand and prices are high, is known as energy arbitrage. In July 2018, Ontario electricity storage facilities will no longer pay the Global Adjustment on electricity stored and returned to the grid; this removes an important pricing barrier that inhibited energy arbitrage.18 However, in Ontario, the daily price spread between peak and off-peak electricity on the wholesale market is rarely more than about 5 cents per kWh.19 So even if the input cost of purchasing electricity were zero, energy arbitrage with batteries would still not be profitable by itself in Ontario’s wholesale electricity market.20
Uninterruptible power supplypower quality
Flow Batteries
Advanced Lead-acid Battery
Lead-acid Battery
High-Power Flywheels
Lithium-ion Battery
PumpedHydro
Compressed AirEnergy Storage
Transmission & distribution grid supportload shifting
Bulk power management
System Power Ratings, Module Size
1 kW 1 MW 10 MW 100 MW 1 GW10 kW 100 kW
Dis
char
ge T
ime
at R
ated
Pow
er
Sec
onds
Min
utes
Hou
rs
257Environmental Commissioner of Ontario 2018 Energy Conservation Progress Report, Volume One
How can Ontario make full use of clean off-peak electricity and prevent it fromgoing to waste? Q16

For battery storage to make economic sense, it needs to deliver (and be paid for) additional benefits to the grid (see Figure 16.3 for a list of potential services). Of these, one key benefit occurs when storage can defer or replace new investment in expensive peaking generation, by providing reliable peak capacity (see Q5). Indeed, the Lazard study estimates that 75% of the potential revenue for a grid-scale battery project would come from providing peak capacity, with only 20% of revenue from energy arbitrage.21 Ontario’s new capacity market (see Q17) might provide an opportunity for energy storage to compete and provide this service. Distribution utilities may also be able to use local storage to defer or avoid local infrastructure upgrades. An appropriate policy and regulatory framework from the government or the Ontario Energy Board (OEB) could encourage such investments, as discussed later in the chapter.
A great Ontario example of multiple financial benefits is the battery electricity storage facility that Toronto Hydro is building as part of the Eglinton Crosstown Light Rail Transit (LRT) project. The LRT and the storage facility are expected to be in operation by 2021. Some form of back-up power source was needed to supply emergency power in the event of a power interruption; the original proposal was for an 18 MW gas-fired generating station, which caused concerns regarding local air pollution. The electricity storage facility avoids the costs associated with this back-up generator, and will be able to provide up to four hours of emergency power. The battery can also be used to store electricity during off-peak hours and supply it to the LRT system to reduce usage of on-peak power. This will help lower
overall electricity use, GHG emissions and operational costs, services the gas-fired generator could not have provided.
Electric vehicle chargingSurplus electricity does not have be reinjected into the grid; it can also be used to charge electric vehicles. Ontario’s Climate Change Action Plan promised four years of free overnight charging for electric vehicles (EVs), but has not yet implemented it.
Ontario’s Long-Term Energy Plan assumes that 2.4 million electric vehicles will be on the road by 2035. As shown in Q15, even greater electrification of transportation will be needed to meet Ontario’s climate commitments. While this can be expected to increase the total demand for electricity, electric vehicle owners can be incented to preferentially use off-peak electricity, thus balancing grid demand and supply more effectively.
Some of Ontario’s surplus off-peak electricity (particularly weeknights and weekends) will be consumed by electric vehicles even without targeted policies; a large number of vehicles are driven to work during the day and are plugged in to charge during the night and during weekends, when electricity is not in high demand and prices are also lower. However, supporting initiatives, some incenting behavioural changes and others offering direct control through technology, can help better align the timing of EV charging with periods of surplus electricity. Such initiatives can also avoid evening surges in electricity demand in areas with numerous electric vehicles, which could otherwise require expensive transmission and distribution upgrades.
The textbox “FleetCarma’s Electric Vehicle Charging Pilots” highlights some important initiatives by a Waterloo, Ontario company. Its EV charging initiatives show there is high potential for electric vehicles to use surplus off-peak electricity if EV owners are incented to charge off-peak.
For battery storage to make economic sense, it needs to deliver (and be paid for) additional benefits to the grid.
258
How can Ontario make full use of clean off-peak electricity and prevent it from going to waste?
Making Connections: Straight Talk About Electricity in Ontario
Q16

FleetCarma’s Electric Vehicle Charging Pilots22
FleetCarma is a Waterloo, Ontario based information and communications technology company that supports the use of clean transportation by creating innovative solutions for electricity utilities, fleet managers, automotive research and sustainability professionals across Ontario, Canada and the U.S. to accelerate the adoption of electric vehicles. FleetCarma’s programs range from gathering customers’ electric vehicle charging data for research purposes to piloting technologies that can directly control the vehicle’s charging load to help balance the electricity grid. FleetCarma uses a C2 device, which is a lightweight cellular data logger that clips into the On-Board Diagnostics II port and supports both liquid fueled and electric vehicles. The data collected through this device is presented through an online portal that allows customers to gain insight into their usage.
Some of the programs that FleetCarma has been involved in:
• ChargetheNorth: this is a federally run program that is currently deployed and has approximately 1,000 participants across Canada. This is in its initial stages with participating local distribution companies (LDCs) gathering baseline EV data within their service territories to better understand the impact on the overall load, peak demand and on LDC infrastructure. Customers are able to see their data and compare their usage with other EV owners.23 Ontario LDCs participating in this pilot include Toronto Hydro, Alectra Utilities, Burlington Hydro, Oakville Hydro and Waterloo North Hydro.24
• City of Toronto ChargeTO pilot: this pilot, in partnership with Toronto Hydro and supported by the Ministry of Energy, captured baseline charging behaviour of 30 EV owners in the city and then offered “paired smart-charging” over a 5-month
FleetCarma’s C2 device that plugs into a vehicle’s On Board Diagnostics.
Source: FleetCarma.
FleetCarma’s online portal for customer to track electric vehicle charging.
Source: FleetCarma.
There is high potential for electric vehicles to use surplus off-peak electricity if EV owners are incented to charge off-peak.
259Environmental Commissioner of Ontario 2018 Energy Conservation Progress Report, Volume One
How can Ontario make full use of clean off-peak electricity and prevent it fromgoing to waste? Q16

period where the LDC was able to control charging and reduce peak charging times by more than 50%. Participants generally had a positive response to the pilot, with 72% of the participants particularly valuing the ability for FleetCarma to provide a guaranteed minimum battery charge and a full state of charge by the time it was needed. This also gave Toronto Hydro an understanding whether its existing infrastructure would be able to manage current EV loads.25 Reported results from the pilot are shown in Figure 16.7.
• Smart Charge Rewards: this is a plug and playincentive program to incentivize customers toshift EV charging to off-peak hours by providingthem with monetary and other rewards. Severalutilities in North America have not deployed theSmart-Charge Reward Program. Customers track
their EV statistics and automatically earn rewards each month by charging within a service territory. Customers can also earn additional rewards by shifting charging to off-peak hours and staying clear of summer peak hours. Initial results have shown that customer EV charging has a completely different load shape under this program. The shape of the EV charging load shifts from evening peak hours (5 p.m. to 10 p.m.) to early morning off-peak hours (2 a.m. to 6 a.m.) which helps to balance the grid. EV owners have the ability to set their vehicles to charge at any time, so providing the appropriate incentives is helping to shift consumption to off-peak hours desired by utilities and system operators. New York’s Con Edison is currently piloting this program with the aim of getting over 4,000 participants.26
Figure 16.7. Comparison of Managed vs. Unmanaged EV Charging.
Source: Fleetcarma, Residential Smart Charging Pilot in Toronto, Results of a Utility Controlled Charging Pilot (Waterloo: Fleetcarma, 2017) at 21.
Dis
trib
uti
on
Tran
sfo
rmer
Lo
ad k
W
50
40
30
20
10
0
6 AMMidnight 12 Noon 6 PM
Approx. Distribution Transformer Limit
Auto Curtailment Period
Managed Load Actual Unmanaged Load Calculated
260
How can Ontario make full use of clean off-peak electricity and prevent it from going to waste?
Making Connections: Straight Talk About Electricity in Ontario
Q16

Like other kinds of batteries, electric vehicle batteries could in the future store surplus electricity and feed it back to the grid when required (vehicle-to-grid). Ontario’s Long-Term Energy Plan (LTEP) notes that EV batteries could be used to deliver electricity to a home or a business during a short-term outage or back to a community or the grid during peak hours. If so, electric vehicles could become a generation resource that could increase resilience and defer expensive electricity infrastructure upgrades.
The U.S. National Renewable Energy Laboratory is collaborating with automakers, charging station manufacturers and utilities to create opportunities for EVs to play an active role in grid management. Some of those opportunities include:27
• integrating intermittent renewable resources with vehicle charging
• emergency backup power during outages and disaster recovery
• improving local power quality by improving grid stability, and
• bidirectional power flow to better manage peak-power demands.
Several jurisdictions have successfully run vehicle-to-grid pilots, including a Japan-US pilot in Maui, Hawaii, between 2011 and 2016 and between Spain and Japan in Malaga, Spain, between 2012 and 2015. In 2016, Pacific Gas & Electric and BMW partnered successfully
to use EV batteries as a grid resource to meet peak demand, holding over 200 demand-response events over 18 months.28
Storing electricity as heat or coldEnergy storage can also be accomplished (often at a lower cost) by withdrawing surplus electricity from the grid and storing it as heat or cold. As shown above, thermal storage is more common around the world (at 3.3 GW) than battery storage (at 1.9 MW).
Examples of thermal storage include: making ice or pre-cooling water for air conditioning (chillers); or heating domestic hot water tanks. Ceramic heaters can use off-peak, nighttime electricity to keep a home warm all day. There is a natural link between Ontario’s need to electrify space and water heating ( Q15) to reduce GHG emissions, and the potential to do so (at least in part) by using surplus off-peak electricity.
A great example of thermal storage is the Heat for Less Now initiative in the City of Summerside, Prince Edward Island (P.E.I.). It installs purchased or leased Electric Thermal Storage (ETS) systems, such as water heaters, room/space heaters and furnaces, in homes to take surplus green energy (mostly from wind power) and store it as heat. The ETS system is controlled remotely by Summerside’s utility using smart grid technologies. The utility uses cheap off-peak electricity to fully heat the ETS systems. The stored heat warms the homes or water heaters all day, so they use much less power during the more expensive peak hours.
Electric vehicle batteries could in the future store surplus electricity and feed it back to the grid.
A great example of thermal storage is the Heat for Less Now initiative.
261Environmental Commissioner of Ontario 2018 Energy Conservation Progress Report, Volume One
How can Ontario make full use of clean off-peak electricity and prevent it fromgoing to waste? Q16

Over 300 homes and businesses in Summerside have participated in this program, which has made much better use of off-peak local wind electricity, reduced the carbon footprint of diesel formerly used to heat some of the homes (3,000 litres of oil is being saved every year), and resulted in savings on electricity bills. P.E.I.’s 2016 draft energy strategy recommended expanding this successful program to the rest of the province.
However, energy storage in the form of heat (or cold) usually stores the energy only for a day. This means it can help with daily swings in demand, not with seasonal swings. Ontario’s surplus electricity is more common during spring and fall when overall electricity demand is lower than in summer and winter.29 Currently, large-scale seasonal heat or cold storage is largely impractical.30
Targeted price discounts for surplus electricity Appropriate pricing policies to stimulate market demand for off-peak (surplus) electricity are an important tool to increase the use of variable renewables such as wind, and to reduce curtailments (see Q6).31 Ontario already has experience with this (see textbox “Ontario’s Industrial Electricity Incentive Program”).
Ontario’s Industrial Electricity Incentive Program
The Ontario government established the Industrial Electricity Incentive (IEI), which ran between 2012 and 2014, to “improve the load management and management of electricity demand”. With industrial electricity use dropping by nearly 5 TWh in Ontario since 2007, the province was experiencing periods of electricity surplus.32 The program encouraged existing industries to expand their operations, and new industries to set up operations (of a minimum size), to consume the surplus electricity and take advantage of reduced electricity rates to run those operations.33 The program rules, developed by the IESO, focused the IEI program on surplus electricity by favouring facilities that would consume electricity during off-peak surplus hours (11 p.m. to 7 a.m.) and those located in regions where more surplus electricity is available.34 The rules also required participants to submit annual energy management plans, allowing the Ontario Power Authority (now IESO) to audit the facilities to ensure compliance with those plans.
Between 2012 and 2014, the IEI contracted 1.9 TWh of electricity annually.35 According to the IESO, the program was at worst, neutral, and at best, a net benefit to existing customers, since participants paid the marginal cost of generation and may also have covered some of the fixed costs. However, the IESO notes that the amount of electricity used through the program has a flat load shape (the same in all 24 hours), meaning that it has not preferentially led to consumption of off-peak electricity.
Appropriate pricing policies are an important tool to reduce curtailments.
262
How can Ontario make full use of clean off-peak electricity and prevent it from going to waste?
Making Connections: Straight Talk About Electricity in Ontario
Q16

In theory, a pricing plan offering surplus off-peak electricity at lower rates would impose no additional costs on other ratepayers, and could increase system revenue. The program can, and must, be designed not to increase demand during peak hours, when gas-fired generation is running. Increasing peak demand could both increase emissions and contribute to a need for expensive new generating capacity, which would increase costs to all electricity customers.
Smarter pricing for all electricity customersThe time-based imbalances in supply and demand that lead to surplus electricity could be greatly reduced if all customers received stronger electricity price signals to move demand from peak to off-peak.36 This would also give all customers the opportunity to manage their electricity costs more effectively.
On its own, Ontario’s time-of-use pricing has not been very effective, because the price difference between peak and off-peak pricing has been too small to motivate much behavioural change. The Ontario Energy Board (OEB) is assessing alternative pricing structures that would take longer-term needs of the system into consideration. As part of this review, several local distribution utilities are running innovative pricing pilots that offer options to customers. These include: higher ratios between on- and off-peak prices; different on- and off-peak periods; critical peak pricing (which increases rates during a small number of peak demand hours); low overnight rates; and seasonal pricing plans.37 For example, London Hydro will be running a one-year electricity pricing pilot that will test ombinations of quick-ramping, critical peak pricing with load control technologies and real-time information feedback delivered through a home energy management system.38 Once the pilots are completed in 2019 and results are assessed, the Board could design a much more effective pricing framework.
The Ministry of Energy has also committed to looking at changes to pricing policy for mid-size commercial and industrial customers, as most of their electricity costs do not vary with time-of-use. Technology (e.g., smart appliances and control systems) will likely be important to enable customers to take advantage of these pricing plans. The Ontario Energy Board’s LTEP Implementation Plan includes plans to look at the way all Class B customers are charged for electricity.39
Local electricity utilitiesSome of the innovations needed to make better use of surplus electricity will be province-wide, but much of the solution will depend on thousands of smaller-scale resources and technologies connected to local distribution systems. To effectively integrate these new technologies and meet new demand and supply patterns, local electricity delivery infrastructure (both wires and information technology) may need to be upgraded or changed. Ontario’s local distribution companies (LDCs) will therefore play a key role in facilitating appropriate use of surplus power.
At a minimum, utilities must provide an enabling platform for distributed energy technologies such as energy storage (in various forms), electric vehicle chargers, renewable energy systems, and smart appliances. Utilities could also play a more active role, operating these resources on behalf of customers (e.g., controlling the timing of EV charging), or even take
The time-based imbalances in supply and demand that lead to surplus electricity could be greatly reduced if all customers received stronger electricity price signals.
263Environmental Commissioner of Ontario 2018 Energy Conservation Progress Report, Volume One
How can Ontario make full use of clean off-peak electricity and prevent it fromgoing to waste? Q16

full ownership. By intelligently matching the location and operation of storage and other technologies to the needs of the distribution system, utilities and their customers will see more benefits, such as improving reliability, reducing losses, deferring or avoiding lines and other infrastructure upgrades, and maximizing the use of surplus electricity to avoid new peaking generation.
Under the OEB’s Renewed Regulatory Framework, LDCs are already required to consider smart grid investments in their distribution system plans. Distribution system plans are expected to consider grid modernizations that are cost-effective and to include long-term plans for meeting customer and system needs.40 For example, in its recent distribution system plan application, Toronto Hydro proposed to invest in energy storage and demand response as a means of deferring more traditional investments on its grid.41
However, the Electricity Distributors Association (EDA), which represents a majority of the province’s LDCs, does not believe that current rules go far enough.42 The EDA argues that current government and OEB rules do not encourage LDCs to innovate or to invest in the new technologies, essential for full use of surplus power. In its view, Ontario’s policies and regulations must do more to reward LDCs that invest in technologies to balance supply and demand. The EDA argues that the current rate-setting mechanism for LDCs favours wires-based solutions over non-wires solutions, which is much of the new technology,43 and prevent them from recovering innovation costs in electricity rates.44 This is because current formulae to calculate Operations,
Maintenance and Administration (OM&A) costs during rate applications do not include the costs and risks associated with investments in new technologies.45
Enabling and rewarding innovationThe province has asked the OEB to consider these concerns, and to make necessary regulatory changes to promote a stronger innovation culture, including allowing electricity distributors to pilot technologies such as energy storage and recover the costs through rates. At the same time, an OEB modernization panel will be reviewing how the OEB itself can adapt to innovative services and technologies, and to the many challenges for Ontario’s energy systems.46
The OEB’s 2017-2022 Strategic Blueprint sets out the OEB’s priorities for the next five years. The blueprint states that utilities that embrace innovation will be compensated appropriately for their efforts. The OEB will be looking into remuneration frameworks that incent and enable utilities to pursue cost-effective innovation, and undertake a more comprehensive review of its current rules and regulations with the intention of modernization to allow innovation. That might include two specific issues identified by the EDA: rate-setting frameworks that encourage investments in innovative technologies, and that increase the predictability of OEB approval for capital investments in non-wires solutions, such as storage.47
As part of implementing the Long-Term Energy Plan, the Minister of Energy issued a directive to the OEB that required the OEB to examine some of these areas,
Ontario’s local distribution companies play a key role in facilitating appropriate use of surplus power.
Utilities that embrace innovation will be compensated appropriately.
264
How can Ontario make full use of clean off-peak electricity and prevent it from going to waste?
Making Connections: Straight Talk About Electricity in Ontario
Q16

including smart grid and non-wires solutions, active system management and customer participation, identifying barriers to resources such as storage, and facilitating smart charging for electric vehicles.48 The OEB’s approved LTEP implementation plan lays out the scope of work and timelines to modernize the electricity industry to meet the goals established in the LTEP.49 Some of these initiatives include:
• regulatory processes to support cost-effective grid modernization and reduce barriers to the development of distributed energy resources
• examining opportunities for LDCs to facilitate access to residential smart charging
• exploring rate-setting mechanisms and allowable revenues for LDCs to encourage investments in new technologies
• examining regulatory reforms that encourage the efficient placement and operation of distributed energy resources to supplement traditional distribution assets, including how the customer can get more involved
• improving time-of-use (TOU) price signals to promote efficient consumption and behavioural changes and possibly introducing a new pricing framework for customers who are not eligible for the Regulated Price Plan, and
• identifying regulatory reforms needed to facilitate residential smart charging for electric vehicles.
The OEB will be undertaking extensive consultations and preparing reports before making final code and/or policy changes. This also means that the process will take years to produce results. Recommendations for future TOU pricing, for example, are not scheduled until late 2020, by which time the current electricity surpluses will be largely disappearing. This seems like a missed opportunity.
Should LDCs be allowed to pay for innovations through rates?
Local electricity utilities want the OEB to expand the types of investments that would be eligible for cost recovery through distribution rates paid by electricity customers. This could certainly scale up investment in new technology for electricity load management. However, it also brings the risks that LDCs may make inappropriate investments that do not benefit all their customers, or may crowd out other service providers and stifle innovation.
In many cases, the benefits of new technologies such as smart EV charging will be diffuse – some will benefit the LDC (and all of its customers), but other benefits will flow to the specific customers who are owners/operators of the technology. This makes it harder to determine whether an investment should be eligible for rate regulation. The OEB’s LTEP Implementation Plan notes this challenge.
There is a healthy debate as to whether LDCs should be the primary actors in enabling new technologies, and whether including these technologies in rates is in the best interest of electricity customers. Many other players are also interested in providing some of these services. For example, Ontario Power Generation also owns a number of distributed energy resources and has built up considerable experience in the field.50
LDCs can pursue innovative business activities that are not rate-regulated. With a few minor exceptions, LDCs used to be prohibited from undertaking any business activity other than distributing electricity, except through an affiliate.51 Affiliate organizations unlicensed by the OEB can pursue additional lines of business – these are not rate-regulated, and operate in a competitive marketplace.52 Recent amendments have authorized an LDC to carry on other business activity directly, with the approval of the OEB.53 However, as of February 2018, no LDC had ever applied for such permission.54
265Environmental Commissioner of Ontario 2018 Energy Conservation Progress Report, Volume One
How can Ontario make full use of clean off-peak electricity and prevent it fromgoing to waste? Q16

ConclusionOntario is moving towards a future where greater electricity use will be needed to meet the province’s Climate Act goals ( Q15). To minimize the costs of this electrification, it is crucial that Ontario take full advantage of all existing clean power. Ontario’s current off-peak surpluses provide an immediate opportunity to develop expertise in storage, pricing, and other approaches to better match supply and demand and to stop curtailments of low-carbon power. Given the urgency of climate change, and the temporary nature of Ontario’s large surpluses of low-carbon power, it would be a shame to wait until the surpluses are gone before deciding how to use them.
Ontario’s current off-peak surpluses provide an immediate opportunity to develop expertise in storage, pricing, and other approaches to stop curtailments of low-carbon power.
266
How can Ontario make full use of clean off-peak electricity and prevent it from going to waste?
Making Connections: Straight Talk About Electricity in Ontario
Q16

. .
. .
.
.
.
.
. .
. .
.
.
.
. .
.
.
. .
.
.
.
.
.
.
.
Endnotes
1 Some of the electricity that is exported is not “surplus”, but is generated deliberately for export, when it is profitable to do so.
2 “2017 Year End Data” online: Independent Electricity System Operator <www.ieso.ca/corporate-ieso/media/year-end-data>. [Accessed February 28,2018]; Ontario Power Generation, information provided to the ECO in response to ECO inquiry (12 January 2018).
3 As an example of how not all clean electricity can currently be utilized, consider the plan to extend the life of the Pickering nuclear generating station. Only half of the electricity from the Pickering extension is currently needed in Ontario, and would otherwise be provided by higher-emission gas-fired generation or imports; the off-peak half will crowd out more renewable electricity, which the IESO will then need to export or curtail. (Ontario Power Generation, “Assessment of Pickering Life Extension Options October 2015 Update” (presentation to Ministry of Energy November 2015), slide 12.
4 Northland Power Inc. “Marmora Pumped Storage Hydro Facility: Questions and Answers (Toronto: Northland Power, October 2014) at 5.
5 Some dams provide storage capabilities, without electricity as an input.
6 Ontario Power Generation, information provided in response to ECO inquiry (1 March 2018).
7 Ontario Power Generation, “Conversion of Lower Notch GS to Pumped Storage Plant” (presentation February 2018).
8 International Renewable Energy Agency, Electricity Storage and Renewables: Costs and Markets to 2030 (Abu Dhabi: IRENA, October 2017) at 21.
9 “Wind energy project stores electricity in massive batteries at North Cape, PEI”, CBC News (19 February 2016), online <www.cbc.ca/news/canada/prince-edward-island/wind-energy-1.3454865>.
10 “Energy Storage” online: Independent Electricity System Operator <www.ieso.ca/sector-participants/energy-procurement-programs-and-contracts/energy-storage>. [Accessed 28 February 2018];
11 Four hours of power drawn from values in Independent Electricity System Operator, Energy Storage Procurement Phase II Backgrounder (Toronto: IESO, November 2015); In a subsequent report, the IESO highlighted the following key findings: energy storage can provide a wide variety of services to the operational aspects of the grid such as: regulation, voltage control, and operating reserves, but to do this most effectively they must be located appropriately and sized correctly; there is limited benefit to storing energy for short periods of time (such as for days) – a greater benefit is obtained when able to store energy for longer periods of time such as for months; any future storage procurement should be targeted towards the service it is intended to provide e.g., provide additional capacity, or voltage regulation (Independent Electricity System Operator, IESO Report: Energy Storage (Toronto: IESO, March 2016) at 15-20.)
12 Festival Hydro, information provided to ECO in response to inquiry (12 January 2018); Galen Simmons, “Festival Hydro hosts grand opening ceremony for Canada’s largest battery storage facility”, Stratford Beacon Herald (13 December 2017), online <www.stratfordbeaconherald.com/2017/12/13/festival-hydro-hosts-grand-opening-ceremony-for-canadas-largest-battery-storage-facility> ; Independent Electricity System Operator, information provided in response to ECO inquiry (5 March 2018).
13 Enbridge Gas, information provided in response to ECO in response to ECO inquiry (25 January 2018).
14 O. Reg. 429/04, Amendments under s. 25.33 of the Act, under the Electricity Act, 1998.
15 International Renewable Energy Agency, Electricity Storage and Renewables: Costs and Markets to 2030 (Abu Dhabi: IRENA, October 2017) at 50-99.
16 Given that pumped storage is a mature technology, it is expected that there will be no major technology improvements for this technology and therefore costs will remain the same.
17 Lazard, Lazard’s Levelized Cost of Storage Analysis- Version 3.0 (New York City: Lazard, November 2017) at 9 ,12, 14 and 28. The “peaker replacement” example from the report is used. The price of the off-peak electricity is less than 15% of the calculated round-trip cost.
18 O Reg 516/17, amending O. Reg. 429/04, Amendments under s. 25.33 of the Act, under the Electricity Act, 1998.
19 “Hourly Ontario Energy Price 2002-2017”, online: Independent Electricity System Operator <www.ieso.ca/-/media/files/ieso/power-data/data-directory/hoep_2002-2017.csv?la=en>. [Accessed 28 February 2018] The price difference between peak and off-peak electricity will be affected if the amount of storage becomes a significant share of the overall electricity demand. The operation of the storage facility will affect the market clearing prices both during the day (its supply of electricity will lower the market clearing price) and at night (its withdrawal of electricity will raise the market price).Consequently, the price difference between day and night will shrink.
20 There may also be a non-zero cost for purchasing the surplus electricity, and electricity losses in storing electricity and returning it to the grid. These losses can be as low as 10% or as high as 70% depending on the storage technology.
21 Lazard, Lazard’s Levelized Cost of Storage Analysis- Version 3.0 (New York City: Lazard, November 2017) at 27.
22 FleetCarma, information provided to the ECO in response to ECO inquiry (31 January 2018).
23 Ibid.
24 “Charge the North”, online: Charge the North <chargethenorth.fleetcarma.com/>. [Accessed 28 February 2018]
25 FleetCarma, Residential Smart Charging Pilot in Toronto, Results of a Utility Controlled Charging Pilot (Waterloo: FleetCarma, 2017) at 4-6.
26 “Electric Vehicle Charging Rewards”, online: conEdison<www.coned.com/en/save-money/rebates-incentives-tax-credits/rebates-incentives-tax-credits-for-residential-customers/electric-vehicle-rewards>. [Accessed 9 March 2018]
27 “Electric Vehicle Grid Integration”, online: National Renewable Energy Laboratory<www.nrel.gov/transportation/project-ev-grid-integration.html>. [Accessed 28 February 2018]
28 International Renewable Energy Agency, Electricity Storage and Renewables: Costs and Markets to 2030 (Abu Dhabi: IRENA, October 2017) at 73.
267Environmental Commissioner of Ontario 2018 Energy Conservation Progress Report, Volume One
How can Ontario make full use of clean off-peak electricity and prevent it fromgoing to waste? Q16

.
.
.
.
.
.
.
.
.
.
.
.
.
.
.
.
.
.
.
.
.
.
.
.
.
.
29 Independent Electricity System Operator, IESO Report: Energy Storage (Toronto: IESO, March 2016) at 18.
30 Ibid at 23.
31 Similarly, the Ontario Society of Professional Engineers (OSPE), has recommended that the surplus clean electricity be made available to Ontario businesses at a nominal rate (less than 2 cents per kWh) to be used for thermal applications such as space heating or for energy storage such as power-to-gas (Ontario Society of Professional Engineers, Empower Ontario’s Engineers to Obtain Opportunity , An Analysis of Ontario’s Clean Electricity Exports (Toronto : OSPE, November 2017) at 5).
32 Directive from Ontario Minister of Energy to the Ontario Power Authority, Re: Industrial Electricity Incentive Program (1 November 2012).
33 “Industrial Electricity Incentive Programs”, online: Independent Electricity System Operator <www.ieso.ca/sector-participants/energy-procurement-programs-and-contracts/industrial-electricity-incentive-program>. [Accessed February 28, 2018]
34 Environmental Commissioner of Ontario, Building Momentum- Results, Annual Energy Conservation Report- 2012, Volume 2 (Toronto: ECO, December 2013) at 56.
35 Independent Electricity System Operator, information provided in response to ECO inquiry (5 March 2018).
36 Environmental Commissioner of Ontario, Building Momentum- Results, Annual Energy Conservation Report- 2012, Volume 2 (Toronto: ECO, December 2013) at 57.
37 Ontario Energy Board, Electricity Pricing Pilots Test More Choice for Residential Consumers (Toronto : OEB, August 2017).
38 Letter from the Ontario Energy Board to London Hydro (April 13, 2017), online <www.rds.oeb.ca/HPECMWebDrawer/Record/568500/File/document>
39 Class B customers include all customers with a peak demand of less than 500 kW, and some between 500 kW and 5 MW. Regulated Price Plan customers (including residential customers and some small businesses) are a subcategory of class B customers with a peak demand of less than 50 kW, that are already on time-of-use pricing.
40 Ontario Energy Board, information provided to the ECO in response to ECO inquiry (31 Jan 2018).
41 Ibid.
42 EDA, The Power to Connect, 2017
43 John A.D. Vellone, Borden Ladner Gervais LLP, The Power to Adapt through Innovation (presentation delivered at January 2018 EDIST conference, 2018) at 24.
44 Ontario Energy Board, information provided in response to ECO inquiry (5 March 2018).
45 John A.D. Vellone, Borden Ladner Gervais LLP, The Power to Adapt through Innovation (presentation delivered at January 2018 EDIST conference, 2018) at 27.
46 https://news.ontario.ca/mei/en/2017/12/ontario-establishing-panel-to-modernize-the-ontario-energy-board.html
47 Electricity Distributors Association, The Power to Connect, Advancing Customer-Driven Electricity Solutions for Ontario (Toronto: EDA, February 2017) at 37-38 and 69-70.
48 Directive from the Ontario Minister of Energy to the Ontario Energy Board, Re: 2017 Long-Term Energy Plan Implementation Plan (25 October 2017).
49 Ontario Energy Board, The Ontario Energy Board’s 2017 LTEP Implementation Plan (Toronto: OEB, January 31, 2018) at 10-14, 19-23 and 33-35.
50 OPG owns a significant number of distributed renewable generators, principally hydro electric stations embedded in Hydro One’s distribution systems. Consequently, OPG has considerable experience and expertise in operating distributed energy resources. OPG expects to continue to play a leading role in this space as it evolves and is actively developing new opportunities in this area that will benefit customers. (information provided by OPG, 1 March 2018).
51 Ontario Energy Board Act, 1998, s 71 (1).
52 An Affiliate Relationship Code provides rules on the relationship between LDCs and their affiliate businesses.
53 Ibid, s 71 (4).
54 Ontario Energy Board, information provided to the ECO in response to ECO inquiry (31 Jan 2018).
268
How can Ontario make full use of clean off-peak electricity and prevent it from going to waste?
Making Connections: Straight Talk About Electricity in Ontario
Q16

This page has been intentionally left blank
269Environmental Commissioner of Ontario 2018 Energy Conservation Progress Report, Volume One
How can Ontario make full use of clean off-peak electricity and prevent it fromgoing to waste? Q16

2005
O N TA R I O ’ S E L E C T R I C I T Y F U T U R E
Q U ES T I O N 17
What impact will Ontario’s electricity market redesign have on the cost and greenhouse gas emissions of our electricity system?
The market redesign (known as Market Renewal) may save money, but it does not yet provide a clear path towards a long-term low-carbon electricity future.
Today, generators earn only 17% of their revenue in Ontario’s electricity markets, with the rest from long-term contracts or regulated rates ( Q2). Market Renewal is intended to reduce cost to customers by compelling generators to compete for much more of their revenue in short-term markets for different services, such as ability to meet peak demand, supply electricity in all hours, or respond quickly to changes in demand. Transforming the market is a large task and will take many years.
The most important stream of Market Renewal is a new capacity auction, specifically to procure incremental capacity to ensure Ontario has enough electricity at times of peak demand. Capacity auctions force generators and other resources to compete repeatedly for the opportunity to supply electricity capacity or reduce peak demand, without secure long-term contracts. A capacity auction should bring on some resources that have a low
marginal cost, such as continuing production from existing gas, wind, or solar generators after initial contracts expire; upgrades to existing facilities; or conservation that reduces peak electricity use. However, it may not incent significant new generation capacity that requires upfront investment, and if it does, gas-fired generation may dominate instead of low-emission generators.
This model might keep new supply costs low if electricity demand stays flat, as the Long-Term Energy Plan envisions. As currently proposed, Market Renewal seems less likely to meet Ontario’s needs in a world where low-emission electricity use must grow ( Q15). Without better policies to support new low-carbon electricity resources and conservation, gas-fired generation and greenhouse gas emissions will likely increase. The Independent Electricity System Operator is working to address this concern.

271Environmental Commissioner of Ontario 2018 Energy Conservation Progress Report, Volume One
What impact will Ontario’s electricity market redesign have on the cost
and greenhouse gas emissions of our electricity system?Q17
Contents
THE DETAILS . . . . . . . . . . . . . . . . . . . . . . . . . . . . . . . . . . . . . . . . . . . . . . . . . . . . . . . . . . . . . . . . . . 272
Introduction . . . . . . . . . . . . . . . . . . . . . . . . . . . . . . . . . . . . . . . . . . . . . . . . . . . . . . . . . . . . . . . . . . . 272
How do Ontario’s existing electricity markets work? . . . . . . . . . . . . . . . . . . . . . . . . . . . . . . . . . . 272
What is changing under Market Renewal? . . . . . . . . . . . . . . . . . . . . . . . . . . . . . . . . . . . . . . . . . . 274
What is a capacity market and how will it work? . . . . . . . . . . . . . . . . . . . . . . . . . . . . . . . . . . . . . 274
What resources would participate? . . . . . . . . . . . . . . . . . . . . . . . . . . . . . . . . . . . . . . . . . . . . . . . . . 275
Can electricity conservation fit into Market Renewal?. . . . . . . . . . . . . . . . . . . . . . . . . . . . . . . . . . . . 276
Will Market Renewal save money? . . . . . . . . . . . . . . . . . . . . . . . . . . . . . . . . . . . . . . . . . . . . . . . . . 277
Will a capacity auction get new generation facilities built? . . . . . . . . . . . . . . . . . . . . . . . . . . . . . . . . 277
If so, what kind?. . . . . . . . . . . . . . . . . . . . . . . . . . . . . . . . . . . . . . . . . . . . . . . . . . . . . . . . . . . . . . . 278
Will Ontario’s electricity mix stay low-carbon under Market Renewal?. . . . . . . . . . . . . . . . . . . . 278
Potential solutions. . . . . . . . . . . . . . . . . . . . . . . . . . . . . . . . . . . . . . . . . . . . . . . . . . . . . . . . . . . . . . 280
Conclusion. . . . . . . . . . . . . . . . . . . . . . . . . . . . . . . . . . . . . . . . . . . . . . . . . . . . . . . . . . . . . . . . . . . . 280
Endnotes . . . . . . . . . . . . . . . . . . . . . . . . . . . . . . . . . . . . . . . . . . . . . . . . . . . . . . . . . . . . . . . . . . . . . 281

In Ontario’s long philosophical debate between government control or free markets, this is a swing back to free markets.
272 Making Connections: Straight Talk About Electricity in Ontario
Q17The details…
IntroductionOntario’s electricity system needs to do many things well, including: having enough electricity production capacity on hand to reliably meet Ontario’s needs when electricity demand is at its highest; supplying electricity at a reasonable cost and environmental impact at all hours of the year; and continuously matching electricity supply and demand in real time. It must also help Ontario achieve other policy goals, such as complying with the Climate Change Mitigation and Low-carbon Economy Act.
As Ontario’s existing electricity resources reach their end of life, or external conditions (e.g., overall electricity demand) change, new resources may be needed so that Ontario’s electricity system continues to function as intended.
Ontario’s 2017 Long-Term Energy Plan commits to procuring new resources through competitive, market-based mechanisms such as auctions, each designed to meet specific system needs. Some proposed market changes are already known, but others will likely be developed. This approach is known as “Market Renewal”. It is a major change from the system used over the past decade, which has used centralized procurement and long-term, technology-specific contracts (often 20 years in length) to get new electricity generation resources built ( Q2).
The goal of Market Renewal is to improve and expand Ontario’s electricity markets, “to meet Ontario’s current and future energy needs reliably, transparently, efficiently and at lowest cost”.1 Market Renewal will address some known issues with the current market design, and increase the electricity system’s responsiveness to changing conditions, by avoiding long-term contract commitments. Its key methodology is to have generators and other resources compete to provide specific services for short periods of time. In Ontario’s long philosophical debate between which is best for
energy policy, government control or free markets,2 this is a swing back to free markets. In essence, it parallels many companies’ shift from offering long-term, secure employment to the gig economy, where workers compete for individual pieces of work.
Like the gig economy, this approach usually saves the buyer money, at least in the short run, but this reduction in price may come at the cost of other public goods (social, economic, environmental, etc.).
How do Ontario’s existing electricity markets work?The IESO operates several markets for electricity services. The most important by far is the real-time electricity market. Electricity generators offer their potential electricity production into the market at a price of their choosing, and the IESO continuously manages this market (on a five-minute interval basis) to select the lowest-cost set of offers that can meet Ontario’s immediate electricity demand. This market sets the wholesale electricity price, and determines which generators will be supplying electricity in each five-minute interval. In general, the market price settles just above the marginal operating cost of generation (near-zero for nuclear or most renewables, and around the cost of fuel for gas-fired generation).
In recent years, the wholesale market price has fallen (Figure 17.1), as (1) more generation with low marginal cost has come online, and (2) fuel costs for gas-fired generation have dropped to historically low levels ( Q4). All generators receive the market-clearing

Generators earned only about 17% of their revenue from markets in 2016.
273Environmental Commissioner of Ontario 2018 Energy Conservation Progress Report, Volume One
What impact will Ontario’s electricity market redesign have on the cost
and greenhouse gas emissions of our electricity system?Q17
price when they are dispatched by the IESO to deliver electricity. This means that all generators have seen a drop in revenue from the wholesale electricity market. Because of the limited revenue opportunities in the wholesale market, long-term contracts have been used to get new generation built, by guaranteeing generators
enough revenue to recover their capital costs. An out-of-market payment known as the Global Adjustment (see Q8) makes up the other 83% of their revenue, i.e. the difference between what generators are guaranteed in these long-term contracts, and what they make in the IESO markets.
Figure 17.1. Average annual wholesale Ontario electricity price, 2002-2017.
Source: “Average weighted hourly prices c/kWh”, online: Independent Electricity System Operator <www.ieso.ca/-/media/files/ieso/power-data/data-directory/average-weighted-hourly-price-kwh.xlsx?la=en>.[Accessed 15 March 2018]
The IESO runs several other markets for additional grid services, for example, operating reserve (stand-by power that can be called upon to deliver electricity on very short notice). These markets can be important for some electricity resources, but their overall size is small.
Under Market Renewal, electricity resources are to earn more of their revenue in markets, without long-term contracts or the need for the Global Adjustment. Figure 17.2 shows that generators earned only about 17% of their revenue from markets in 2016. Because most resources are currently under long-term contracts (that will not expire for decades in some cases), and much of Ontario Power Generation’s revenue is guaranteed through a rate regulation process, a full transition to market mechanisms may not be possible. If it is, will take many years.
5.59 5.71
5.22
7.21
4.88
5.05 5.17
3.16
3.79
3.15
2.41
2.65
3.60
2.36 1.66 1.55
0
1
2
3
4
5
6
7
8
2002 2003 2004 2005 2006 2007 2008 2009 2010 2011 2012 2013 2014 2015 2016 2017
Aver
age
who
lesa
le e
lect
ricity
pric
e(c
ents
/kilo
wat
t-hou
r)
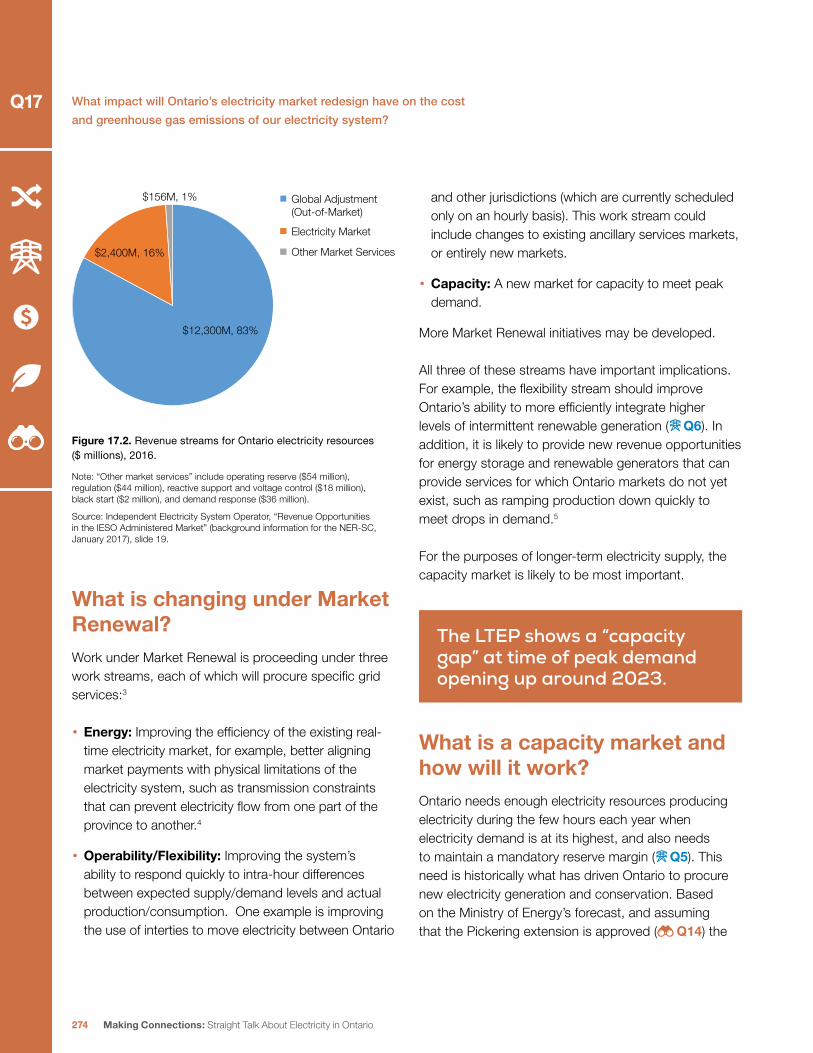
The LTEP shows a “capacity gap” at time of peak demand opening up around 2023.
274
What impact will Ontario’s electricity market redesign have on the cost
and greenhouse gas emissions of our electricity system?
Making Connections: Straight Talk About Electricity in Ontario
Q17
Figure 17.2. Revenue streams for Ontario electricity resources ($ millions), 2016.
Note: “Other market services” include operating reserve ($54 million), regulation ($44 million), reactive support and voltage control ($18 million), black start ($2 million), and demand response ($36 million).
Source: Independent Electricity System Operator, “Revenue Opportunities in the IESO Administered Market” (background information for the NER-SC, January 2017), slide 19.
What is changing under Market Renewal? Work under Market Renewal is proceeding under three work streams, each of which will procure specific grid services:3
• Energy: Improving the efficiency of the existing real-time electricity market, for example, better aligning market payments with physical limitations of the electricity system, such as transmission constraints that can prevent electricity flow from one part of the province to another.4
• Operability/Flexibility: Improving the system’s ability to respond quickly to intra-hour differences between expected supply/demand levels and actual production/consumption. One example is improving the use of interties to move electricity between Ontario
and other jurisdictions (which are currently scheduled only on an hourly basis). This work stream could include changes to existing ancillary services markets, or entirely new markets.
• Capacity: A new market for capacity to meet peak demand.
More Market Renewal initiatives may be developed.
All three of these streams have important implications. For example, the flexibility stream should improve Ontario’s ability to more efficiently integrate higher levels of intermittent renewable generation ( Q6). In addition, it is likely to provide new revenue opportunities for energy storage and renewable generators that can provide services for which Ontario markets do not yet exist, such as ramping production down quickly to meet drops in demand.5
For the purposes of longer-term electricity supply, the capacity market is likely to be most important.
What is a capacity market and how will it work?Ontario needs enough electricity resources producing electricity during the few hours each year when electricity demand is at its highest, and also needs to maintain a mandatory reserve margin ( Q5). This need is historically what has driven Ontario to procure new electricity generation and conservation. Based on the Ministry of Energy’s forecast, and assuming that the Pickering extension is approved ( Q14) the
$2,400M, 16%
$12,300M, 83%
$156M, 1% Global Adjustment(Out-of-Market)
Electricity Market
Other Market Services

275Environmental Commissioner of Ontario 2018 Energy Conservation Progress Report, Volume One
What impact will Ontario’s electricity market redesign have on the cost
and greenhouse gas emissions of our electricity system?Q17
LTEP shows a “capacity gap” at time of peak demand opening up around 2023 (Figure 17.3).
The new capacity auction is intended to fill this gap. Resources will bid based on how much capacity (measured in megawatts, MW) they can reliably deliver
at peak times, either by supplying electricity or reducing electricity use. The Ontario capacity market would likely use annual auctions. Successful participants would only be guaranteed a revenue payment for one, or at most a few, years, unlike the 20-year guarantees in existing contracts.
Figure 17.3. 2017 LTEP forecasted electricity demand and existing capacity, assuming that existing resources will continue to supply power after their current contracts expire (2017-2035).
Source: Ontario Ministry of Energy, Ontario’s Long-Term Energy Plan 2017: Delivering Fairness and Choice (Ontario: Queen’s Printer, 2017) at 37.
What resources would participate?
Ontario is proposing to use a capacity auction only for “incremental” capacity. In other words, capacity from existing resources under contract (or OPG resources rate-regulated by the Ontario Energy Board) would not participate. (These resources could participate only if they can provide additional capacity that is not currently under contract, e.g., through upgrades).6 The auction would be technology-neutral. Resources that might participate include generators whose contracts have expired, imports, energy storage facilities, conservation
resources (e.g., large electricity customers who could reduce their electricity use at times of peak), and potentially new generators.
In Ontario, existing electricity generators with expiring contracts, but remaining useful life, are likely to play a large role in the capacity auction. By the mid-2020s, many gas plants will be in this position, followed several years later by a large number of wind, solar, and hydro plants.7 As Figure 17.3 shows, if all expired resources participate in the capacity auction, this would fill most,
35,000
2017
2018
2019
2020
2021
2022
2023
2024
2025
2026
2027
2028
2029
2030
2031
2032
2033
2034
2035
30,000
25,000
20,000
15,000
10,000
5,000
Existing Capacity
Cap
acity
Con
trib
utio
n at
Sum
mer
Pea
k (M
W)
Committed. Not Yet In-Service Directed Procurements
Expired Contracts Demand Outlook
0
Capacity gap
276
What impact will Ontario’s electricity market redesign have on the cost
and greenhouse gas emissions of our electricity system?
Making Connections: Straight Talk About Electricity in Ontario
Q17
but not all, of the future capacity gap anticipated by the LTEP.
In some other jurisdictions, capacity auctions have been successful in procuring low-cost resources other than new generation. Examples from PJM (the Pennsylvania-New Jersey-Maryland electricity system) include upgrades to improve the electricity production capacity of existing generators, demand-side resources, and imports.8 Some of these resources might not have been identified through centralized system planning.
The potential role of conservation in Market Renewal is explored more in the textbox “Can electricity conservation fit into Market Renewal?”
Can electricity conservation fit into Market Renewal?
Conservation can contribute capacity to meet peak demand, by reducing electricity use instead of generating electricity. One form of conservation – demand response, which involves electricity customers reducing electricity use in real-time or near real-time in response to instructions from the system operator – has already proven to be a good fit for the capacity auction that will be at the centre of Market Renewal. In fact, in the past several years, Ontario has run an auction specifically for demand response providers that has served as a test bed for a more comprehensive future capacity auction.9 This demand response auction has been successful in securing capacity from a wider variety of participants, at a lower cost than the previous demand response model, which involved longer-term contracts at a set price. For 2018, the IESO has 571 MW of demand response capacity available for the summer
peak and 712 MW for the winter peak, procured through the auction.10
The use of these demand response resources is integrated into the wholesale electricity market. When market prices are projected to be very high (or there is an emergency operating state), demand response providers are placed on standby, and must be ready to reduce their electricity use during that day if the market price reaches anticipated levels.11 The current structure is not perfect, as the trigger conditions have made it very unlikely that demand response providers will actually be called on to reduce their electricity use. The IESO is working on changes that will lead to demand response being utilized more, and also intends to replace the demand-response specific auction, by including demand response in the capacity auction, where it will compete against other resources such as generation.12
What about traditional conservation and energy efficiency measures, which save electricity, including at peak times, but cannot respond to instructions from the grid operator in the way that demand response and generation can? The New England Independent System Operator (ISO) shows that conservation of this type can also participate in a capacity auction.13 Demand resources under the New England ISO are categorized as active demand resources (demand response) which are activated when needed; or as passive demand resources (conservation initiatives) that save electricity across many hours.
Both active and passive demand resources have been incorporated into the New England capacity market since 2010. Passive demand resources offer into the capacity auction based on their

Markets can produce lower prices when supply is ample; markets can also produce rapid price increases when demand is high.
277Environmental Commissioner of Ontario 2018 Energy Conservation Progress Report, Volume One
What impact will Ontario’s electricity market redesign have on the cost
and greenhouse gas emissions of our electricity system?Q17
ability to reduce electricity consumption during peak summer and winter hours (e.g., 1 p.m. to 5 p.m. on June, July, and August weekdays for the summer peak). Passive demand resources do not participate in the real-time energy market. In January 2018, New England had approximately 2,700 MW of demand resources providing capacity; 2,000 MW of these were passive demand resources.14
In some other jurisdictions, customers and private-sector providers can compete in a conservation-specific auction, by bidding in the amount of incentive that they will require in order to deliver a specified amount of electricity savings. In theory, this might acquire conservation at a lower cost than we pay today. One example is the American Electric Power Ohio’s Bid4Efficiency Program.15 However, higher-cost conservation programs, such as those focussed on low-income or aboriginal communities, might not be funded in such a system.
These examples suggest that some conservation programs, other than Demand Response, could potentially be integrated into Market Renewal in some fashion.16 This would be a large change from Ontario’s current conservation model, where LDCs and the IESO have budgets to deliver conservation programs ( Q19), completely outside the electricity market framework.
More analysis is needed to determine whether a market-based approach to conservation makes sense. With the exception of Demand Response, integration of conservation into Market Renewal is not an immediate priority for the IESO.
Will Market Renewal save money?
A cost-benefit assessment prepared for the IESO estimates that Market Renewal can reduce future generation costs by between $2.2 billion and $5.2 billion over a ten-year period.17 But it is worth remembering that markets can produce lower prices when supply is ample and demand is low; markets can also produce rapid price increases when demand is high and supply is tight, as happened in Ontario’s electricity market in the hot summer of 2002.18 As described in Q15, the LTEP does not account for the large increase in electricity use that will be needed to electrify other parts of the energy sector in order to meet Ontario’s climate obligations. Thus, Figure 17.3 and the LTEP likely underestimate Ontario’s future capacity needs. If so, Market Renewal may not reliably procure low-cost electricity.
The potential to avoid expensive new generation is the central appeal of capacity auctions. In PJM, the capacity auction deferred the need for higher-cost new generation resources for almost a decade. The IESO anticipates being able to dip its toes into the capacity market slowly, with the first auction looking for a small amount of capacity that will likely not require new generation.19 Of course, these low-cost opportunities may eventually run out.
Will a capacity auction get new generation facilities built?
Capacity markets have succeeded in getting some new resources built in some other jurisdictions, but not in others. For example, they worked better in New

Short-term capacity auctions change the types of facilities that get built.
The current elements of Market Renewal will not keep emissions from Ontario’s electricity sector at their current low levels.
278
What impact will Ontario’s electricity market redesign have on the cost
and greenhouse gas emissions of our electricity system?
Making Connections: Straight Talk About Electricity in Ontario
Q17
England and Pennsylvania-New Jersey-Maryland than in California.20 Ontario’s system is probably more comparable to California, because of the large amount of generation under long-term contract.
If so, what kind?
Even if they succeed in getting something built, short-term capacity auctions change the types of facilities that get built. These auctions favour generators with low initial capital costs (even if they have higher operating costs and emissions), and discourage generators with high capital costs, even if they have lower long-term costs and low emissions.21 Unless specific precautions are taken, they are therefore more likely to procure gas-fired generation22 than renewable, low-carbon resources or storage.23
Another question is how fast new generation can be built. Ontario is proposing a “forward period” of perhaps 3-4 years between the auction and the commitment period, to enable new generation to be built. Several submissions to the IESO have noted that the development cycle for new generation can take six years or more (depending on resource type).24 If so, a forward period of only 3-4 years would exclude certain resources (e.g., hydro).
Will Ontario’s electricity mix stay low-carbon under Market Renewal?The Long-Term Energy Plan notes that Market Renewal will take into account Ontario’s greenhouse gas emission reduction requirements, but does not explain how.25 The current elements of Market Renewal, including the capacity market, will not be enough to keep emissions from Ontario’s electricity sector at their current low levels.
In 2016, gas-fired generators were called on to help meet market demand in roughly 17% of hours, and provided 8% of electricity (4% in 2017 preliminary numbers). Under the LTEP projections, this would increase moderately in the coming years, as gas is to play a larger role after the closure of the Pickering nuclear station and during the refurbishments of Bruce and Darlington nuclear stations ( Q14). Greenhouse gas emissions from the electricity sector would increase slightly as a result (Figure 17.4).

Market Renewal lacks any mechanism to keep Ontario’s new electricity supplies low-carbon or low-polluting.
279Environmental Commissioner of Ontario 2018 Energy Conservation Progress Report, Volume One
What impact will Ontario’s electricity market redesign have on the cost
and greenhouse gas emissions of our electricity system?Q17
Figure 17.4. Ontario’s electricity sector emissions (2005-2035).
Source: Ontario Ministry of Energy, Ontario’s Long-Term Energy Plan 2017: Delivering Fairness and Choice (Ontario: Queen’s Printer, 2017) at 109.
Again, this projection assumes essentially flat electricity demand. If, instead, demand grows to displace fossil fuels from heating and transportation ( Q15), and no new low-carbon generation is built, emissions from gas-fired generators will soar.26
Electricity markets on their own will not necessarily achieve emissions reductions in the absence of a market-based carbon policy. If no carbon pricing exists or carbon prices are too low to achieve the desired level of emissions reductions, then the wholesale electricity market will simply minimize other costs without fully considering the public policy value of avoiding carbon emissions.27
So far, Market Renewal lacks any mechanism to keep Ontario’s new electricity supplies low-carbon or low-polluting. The capacity market on its own is unlikely to bring on new renewable generation. The wholesale market is also unlikely to provide enough revenue to procure new renewable generation, at least in the early years of Market Renewal, because the average wholesale electricity price is so low, as shown in Figure 17.1. A higher-demand future would increase the
average wholesale price of electricity, because gas-fired generation would set the market-clearing price in more hours, and the offer price for gas-fired generation in these hours will be higher, due to cap and trade.28 However, this would still likely be insufficient incentive for new renewable generation to be built.
Under current proposals, neither will these markets greatly expand the role of conservation in reducing electricity use and emissions. The capacity market is likely to attract new demand response resources, but experience to date suggests that, once procured, these resources will not be utilized very frequently to reduce electricity use. This is because they may require a higher price than gas-fired generation to be dispatched in the wholesale electricity market.29

It is far from clear how to reconcile a market approach focussed on minimizing short term costs with Ontario’s other public policy goals, including clean air and mitigating climate change.
280
What impact will Ontario’s electricity market redesign have on the cost
and greenhouse gas emissions of our electricity system?
Making Connections: Straight Talk About Electricity in Ontario
Q17
Potential solutionsThe IESO has recognized this dilemma, and has established a special Market Renewal working group, the Non-Emitting Resources Subcommittee.30 This group is looking at how to integrate low-carbon resources into auctions, what other services they can provide to the grid, and whether there is a need for additional incentive mechanisms to value environmental attributes.31
Potential approaches could include:
1. Explicit government policy limiting the amount of fossil fuels that can bid into the market
2. Dedicated auctions, perhaps with longer commitment periods, limited to clean energy and conservation resources, and
3. Additional markets that provide an explicit value for environmental benefits.
ConclusionMarket Renewal may reduce Ontario’s electricity supply costs, at least in the short run and if demand growth is limited. However, it is far from clear how to reconcile a market approach focussed on minimizing short term costs with Ontario’s other public policy goals, including clean air and mitigating climate change. Market Renewal may not reliably procure low-cost and/or low-carbon electricity in a high-electrification future.
If Ontario is to meet its climate change obligations, the need for new low-carbon resources will be greater than the Ministry of the Energy and the IESO are planning for. Decisions will need to be made as to whether these resources can be procured through the redesigned markets, or whether other approaches are needed. With a capacity gap opening by 2023, Ontario does not have a lot of time to get this right.

Endnotes
Environmental Commissioner of Ontario 2018 Energy Conservation Progress Report, Volume One 281
What impact will Ontario’s electricity market redesign have on the cost
and greenhouse gas emissions of our electricity system?Q17
.
.
.
.
.
.
.
.
.
.
.
.
.
.
.
.
.
.
.
.
.
.
.
Endnotes
1 “Overview of Market Renewal”, online: Independent Electricity System Operator <www.ieso.ca/en/sector-participants/market-renewal/overview-of-market-renewal>. [Accessed 15 March 2018]
2 Winfield, M., and B.MacWhirter, “Competing paradigms, Policy Windows and the Search for Sustainability in Ontario Electricity Policy,” in G.Albo and R.McDermid, eds., Divided Province: Ontario in the Age of Neo-Liberalism” Queens-McGill University Press - in press.
3 Johannes Pfeifenberger et al., The Future of Ontario’s Electricity Market, a Benefits Case Assessment of the Market Renewal Project (Toronto: IESO, 20 April 2017) at iv.
4 Ontario currently operates a two-schedule market, where price is first set in a schedule that ignores transmission limitations, and then a second schedule is needed that corrects for the transmission constraints and adjusts which generators will operate. This can lead to out-of-market payments and opportunities for gaming. Generators may offer into the market, knowing that their electricity cannot be used due to transmission constraints, but that they may end up receiving compensation payments.
5 Brattle Group, “Market Design for a Clean Grid, Unlocking the Potential of Non-Emitting and Emerging Technologies” (presentation to IESO Non-Emitting Resource Subcommittee, January 2018), slide 13.
6 Independent Electricity System Operator, “Introduction, Non-Emitting Resource Subcommittee” (presentation, 22 January 2018), slide 38-51.
7 Ontario Ministry of Energy, Ontario’s Long-Term Energy Plan 2017: Delivering Fairness and Choice (Ontario: Queen’s Printer, 2017) at 43-44.
8 Johannes Pfeifenberger et al., The Future of Ontario’s Electricity Market, a Benefits Case Assessment of the Market Renewal Project (Toronto: IESO, 20 April 2017) at 66.
9 More information on the IESO’s Demand Response Auction is available at “Demand Response Auction”, online: Independent Electricity System Operator <www.ieso.ca/sector-participants/market-operations/markets-and-related-programs/demand-response-auction>. [Accessed 15 March 2018]
10 Independent Electricity System Operator, “2017 DR Auction Results” (presentation to the IESO Demand Response Working Group, 30 January 2018).
11 Independent Electricity System Operator, “Improvements to Hourly DR Data” (presentation to the IESO Demand Response Working Group, 6 April 2017), slide 9.
12 Ibid, slide 5-8.
13 “About Demand Resources”, online: Independent System Operator New England <www.iso-ne.com/markets-operations/markets/demand-resources/about>. [Accessed 15 March 2018]
14 Independent System Operator New England, “Demand Resources Working Group” (presentation, 31 January 2018), slide 2 and 3, online<www.iso-ne.com/static-assets/documents/2018/01/a01_intro_drwg_mtg_02_01_2017.pptx>
15 Under this program, non-residential customers and solution providers lock in their incentives for energy efficiency projects through a bidding process. Incentives for a project can range from $25,000 to $1,000,000. Participants have to bid in a year ahead to partake in achieving the state’s energy efficiency goals (AEP Ohio, Bid4Efficiency FAQ (Canton: AEP Ohio, 2016) at 1, online <aepohio.com/global/utilities/lib/docs/save/business/programs/aepohio/EnergyEfficiencyAuction/B4E%20FAQ%202017%20072617%20v2.pdf>
16 The IESO has taken a step in the direction by offering a “Pay-for-Performance” program which compensates customers for overall reductions in electricity use, allowing customers wide latitude in how to achieve these savings. However, compensation is at a fixed rate, not through an auction as in the AEP process.
17 Johannes Pfeifenberger et al., The Future of Ontario’s Electricity Market, a Benefits Case Assessment of the Market Renewal Project (Toronto: IESO, 20 April 2017) at iii.
18 Winfield, M., and B.MacWhirter, “Competing paradigms, Policy Windows and the Search for Sustainability in Ontario Electricity Policy,” in G.Albo and R.McDermid, eds., Divided Province: Ontario in the Age of Neo-Liberalism” Queens-McGill University Press - in press.
19 Independent Electricity System Operator, “Introduction, Non-Emitting Resources Subcommittee” (presentation, 22 January 2018), slide 45.
20 Johannes Pfeifenberger et al., The Future of Ontario’s Electricity Market, a Benefits Case Assessment of the Market Renewal Project (Toronto: IESO, 20 April 2017) at 67-69.
21 This is because a short-term capacity market introduces substantial investment risk for new generators, whereas long-term contracts place most risk on electricity ratepayers (at least once a facility is built and operating). A business case to build new generation with a long capital payback period would rely on the uncertain possibility of the generator being repeatedly successful in future capacity auctions at similar prices, or making revenue from other markets (e.g., the wholesale electricity market). Over the long operating life of generators, there is substantial risk that any assumptions made regarding these revenue streams may not prove accurate, due to electricity policy changes or other factors.
22 The Energy Information Administration shows gas-fired generation has currently having the lowest “overnight” cost per installed megawatt of electricity generating technologies, and the advantage of gas will be even greater, considering its capacity contribution at time of peak (U.S. Energy Information Administration, Cost and Performance Statistics of New Generating Technologies, Annual Energy Outlook 2018 (Washington D.C,: US EIA, January 2018), at 2).
23 Other jurisdictions with auctions that recognize or incentivize low- or non-emitting resources include: California, New York, and New England. Johannes Pfeifenberger et al., The Future of Ontario’s Electricity Market, a Benefits Case Assessment of the Market Renewal Project (Toronto: IESO, 20 April 2017) at 5, 29.

282
What impact will Ontario’s electricity market redesign have on the cost
and greenhouse gas emissions of our electricity system?
Making Connections: Straight Talk About Electricity in Ontario
Q17
.
.
.
.
.
.
.
.
24 Letter from the Ontario Waterpower Association to the Independent Electricity System Operator (17 January 2018), “Request for Information – Non Emitting Resources”, online: <www.ieso.ca/-/media/files/ieso/document-library/working-group/market-renewal/nersc/nersc-20180117-owa.pdf?la=en>; Letter from EDF EN Canada Development Inc. to the Independent Electricity System Operator (17 January 2018), “Re: Request for feedback on the upcoming Non-Emitting Resources Request for Information (‘NER RFI’)”, online: <www.ieso.ca/-/media/files/ieso/document-library/working-group/market-renewal/nersc/nersc-20180117-edf-en-canada.pdf?la=en>.
25 Ontario Ministry of Energy, Ontario’s Long-Term Energy Plan 2017: Delivering Fairness and Choice (Ontario: Queen’s Printer, 2017) at 51.
26 Even if no new gas-fired generation is added, Ontario’s existing gas-fired generators have ample ability to ramp up production and meet much of the additional electricity demand.
27 Johannes Pfeifenberger et al., The Future of Ontario’s Electricity Market, a Benefits Case Assessment of the Market Renewal Project (Toronto: IESO, 20 April 2017) at 114.
28 This is because Ontario’s cap and trade system now requires gas-fired generators to internalize the cost of carbon allowances into their market offer prices. For example, a carbon price of $20 per ton would translate into an increased offer price of about 0.85 cents per kilowatt-hour.
29 The offer price for demand response resources into the wholesale energy market has tended to be well above $100/MWh. Independent Electricity System Operator, “Improving Utilization of HDR Resources” (presentation to the IESO Demand Response Working Group, 30 January 2018), slide 20, online: <www.ieso.ca/-/media/files/ieso/document-library/working-group/demand-response/drwg-20180130-improving-utilization-hdr-resources.pdf>.
30 “Market Renewal: Non-Emitting Resources Subcommittee”, online: Independent Electricity System Operator <http://www.ieso.ca/en/sector-participants/market-renewal/non-emitting-resources-subcommittee>. [Accessed 15 March 2018]
31 Independent Electricity System Operator, “Request for Information: Non-Emitting Resources” (webinar and information session, 21 December 2017) at slide 18-22, online: <www.ieso.ca/-/media/files/ieso/document-library/working-group/market-renewal/ner-rfi-20171221-presentation.pdf>.

283Environmental Commissioner of Ontario 2018 Energy Conservation Progress Report, Volume One
What impact will Ontario’s electricity market redesign have on the cost
and greenhouse gas emissions of our electricity system?Q17
This page has been intentionally left blank.

2005
O N TA R I O ’ S E L E C T R I C I T Y F U T U R E
Q U ES T I O N 18
What impact will net metering have on the future of renewable electricity in Ontario?
The transition from fixed-price contracts (such as FIT and microFIT) to net metering will reduce near-term costs to electricity ratepayers, but will also discourage renewable electricity generation.
Net metering will allow customers to reduce their own power bills, but will not allow them to make money by selling renewable power to the grid.
Even for customers who wish to reduce their own bills, net metering, as currently proposed, does not recognize the value of distributed, renewable electricity to the electricity system, including the value of solar in meeting peak demand. It will therefore unduly discourage installation of new renewable electricity sources, at least until electricity prices rise and/or renewables cost continues to fall.
Ontario should support customer interest in generating their own renewable electricity, at a low overall cost, by paying “time-of-use” rates and by allowing virtual net metering for group or community projects.

What impact will net metering have on the future of renewable electricity in Ontario? Q18
285Environmental Commissioner of Ontario 2018 Energy Conservation Progress Report, Volume One
Contents
THE DETAILS . . . . . . . . . . . . . . . . . . . . . . . . . . . . . . . . . . . . . . . . . . . . . . . . . . . . . . . . . . . . . . . . . . 286
From long-term contracts to net metering . . . . . . . . . . . . . . . . . . . . . . . . . . . . . . . . . . . . . . . . . . 286
How net metering will work . . . . . . . . . . . . . . . . . . . . . . . . . . . . . . . . . . . . . . . . . . . . . . . . . . . . . . 287
Time-of-use pricing for net metered customers . . . . . . . . . . . . . . . . . . . . . . . . . . . . . . . . . . . . . . . . 290
Options for expanding net metering . . . . . . . . . . . . . . . . . . . . . . . . . . . . . . . . . . . . . . . . . . . . . . . 291
Will net metering encourage renewable electricity? . . . . . . . . . . . . . . . . . . . . . . . . . . . . . . . . . . . 292
Impact on the solar industry. . . . . . . . . . . . . . . . . . . . . . . . . . . . . . . . . . . . . . . . . . . . . . . . . . . . . . 295
Does net metering benefit LDCs and other electricity customers? . . . . . . . . . . . . . . . . . . . . . . . 296
Utility integration of net metering and on-site energy storage . . . . . . . . . . . . . . . . . . . . . . . . . . . . . . 298
Conclusion. . . . . . . . . . . . . . . . . . . . . . . . . . . . . . . . . . . . . . . . . . . . . . . . . . . . . . . . . . . . . . . . . . . . 300
Endnotes . . . . . . . . . . . . . . . . . . . . . . . . . . . . . . . . . . . . . . . . . . . . . . . . . . . . . . . . . . . . . . . . . . . . . 301

For a decade, Ontario successfully encouraged Ontario citizens, communities and businesses to invest in renewable electricity.
After 2017, Ontario will no longer enter long-term contracts for renewable electricity.
286 Making Connections: Straight Talk About Electricity in Ontario
Q18The details…
From long-term contracts to net meteringFor a decade, Ontario successfully encouraged Ontario citizens, communities and businesses to invest in renewable electricity projects – from small rooftop solar to large wind and water – by awarding fixed-price, 20-year contracts. This included some 25,000 microFIT projects all over the province, almost all of them small solar.1 Long-term contracts were also awarded to encourage investors to build other forms of generation, such as natural gas.
After 2017, Ontario will no longer enter long-term contracts for renewable electricity. Existing contracts will continue, but no new contracts will be awarded. Instead, according to the 2017 Long-Term Energy Plan (LTEP), new renewable electricity projects will only be offered net metering (described below), i.e. the ability to reduce one’s own power bill. Net metering is an enabling tool to modestly support customer self-sufficiency, not a procurement tool to increase Ontario’s electricity supply. The IESO’s Market Renewal Initiative will examine procurement opportunities for renewable generation (likely larger-scale renewables) as the need arises ( Q17).
Net metering allows a household or business that produces renewable electricity for their own use to receive bill credits for some extra electricity sent into the grid. The bill credits are calculated based on the average unit price that the customer normally pays their utility to purchase electricity. However, the renewable system must be designed to primarily to meet the customer’s own electricity needs. If renewable electricity production exceeds consumption (over a 12-month period), customers are not given any credit for the “excess” electricity delivered to the grid.2
All Canadian provinces already offer some form of net metering.3 Ontario has allowed net metering since 2006, but it has been little used; the various Feed-in Tariff (FIT) programs, despite their administrative hassles and interconnection issues, were more economically attractive. Other jurisdictions, such as Manitoba, Alberta, and Saskatchewan also allow net metering, sometimes in addition to capital incentives for solar.4
The FIT/microFIT program was a cornerstone of the 2009 Green Energy Act ( Q9). FIT participants were guaranteed a fixed price for the electricity they will generate over a 20-year contract. Contract prices varied by size and energy source. They were set at the level needed to attract the capital investments required to get projects operating, i.e. to guarantee developers a reasonable rate of return (e.g., 8% over 20 years, with a 12 year break even point). FIT was intended to ensure projects were built and to help develop an Ontario-based renewable energy technical support industry to supply clean power to the grid. FIT was the international “best practices” benchmark for building a renewable energy industry at the time the Green Energy Act was passed.
Since then, with the dramatic price drop in solar technology, many jurisdictions have moved to some form of net metering for small-scale renewable electricity. However, the ECO finds that there may be

Under Ontario’s net metering plan, it is not possible to make money by producing more power than one needs.
287Environmental Commissioner of Ontario 2018 Energy Conservation Progress Report, Volume One
What impact will net metering have on the future of renewable electricity in Ontario? Q18
limited uptake in Ontario. Under Ontario’s net metering plan, it is not possible to make money by producing more power than one needs over the course of a year.5 It is not even possible to entirely eliminate one’s own power bill. Because there is no credit given for extra electricity produced, net metering customers will size renewable energy systems primarily to meet their own electricity need. This means that larger, lower cost renewable electricity projects are unlikely to be developed, unless they can be developed on the site of a customer with very large electricity needs. Large projects produce most of Ontario’s renewable electricity, and can do so at lower overall costs due to economies of scale.
Even for those who wish to produce their own power, net metering is not a contract, but a policy and regulation that could change at any time. It offers no price certainty, and no guarantee that the net metering policy will remain in place (at any price) long enough for a new system to pay for itself. However, Ontario has had a net metering regulation since 2005 and the recent proposals build on that framework.
In the short term, if it were not for the likelihood that grid power prices will continue to rise ( Q9), it may not make financial sense for most grid-connected customers to build renewable power under net metering. Over the long term, the Ministry of Energy expects increased interest in the program as a result of proposed regulatory enhancements and many people’s desire to be part of a solution to climate change.
In the hope of improving the economics of net metering for some potential producers, the government is considering regulatory changes to expand the scope of eligible net metering ownership models.6 These proposed ownership models include third party ownership and virtual net metering demonstration projects. The purpose is to allow greater opportunities for Ontarians to participate in net metering and thereby to help them reduce their electricity bills. These ownership models will result in helping net metering participants to reduce their upfront costs for the system. Consumer protection is also part of this proposal. What will these changes accomplish, and how will they affect the future of renewable electricity in Ontario?
How net metering will workOntario’s net metering regulation (O.Reg.541/05: Net Metering) came into force in January 2006.7 It was recently revised, following consultation including use of the Environmental Registry (Proposal # 012-8435), with changes coming into force in July 2017.8 A schematic of how net metering works is shown in Figure 18.1.

What impact will net metering have on the future of renewable electricity in Ontario?
Making Connections: Straight Talk About Electricity in Ontario
Q18
Net metering allows customers to treat the grid as a battery.
288
Figure 18.1. How net metering works.
Source: Ontario Ministry of Energy, Delivering Fairness and Choice, Ontario’s Long-Term Energy Plan, (Toronto: Ministry of Energy, October 2017) at 57.
Notes:
1. Solar panels mounted on the roof of a house generate electricity. 2. The electricity generated is used to power the house first. 3. Any extra electricity generated is sent to the local grid. 4. Net-metered customers receive credits on their electricity bill for electricity sent to the local grid. 5. Electricity is drawn from the local grid when the home’s electricity needs are higher than the amount of electricity generated by the solar panels. 6. Net-metered customers’ monthly electricity charges are calculated based on the difference between the amount of electricity used from the local grid and the credits received from any electricity sent to the local grid from the solar panels.
To be eligible for net metering, electricity must be generated from a renewable energy source. It is expected that most net metered generation will be rooftop solar systems, at least for residential customers. It is a billing arrangement between the customer who generates the electricity and their electricity distributor. There is no limit on the size of the renewable electricity system,9 which could enable larger industrial or commercial customers to install quite large renewable energy systems, if they have suitable roof space or available land and enough demand to use the electricity produced. There is additional net metering potential if net metering facilities could also be used in structures for covering parking lots.
In essence, net metering allows customers to treat the grid as a battery where any excess electricity is stored until they need it. If they need more electricity than they are generating, then they take this additional amount from the grid, just as they would from a battery.
But when they generate more electricity than they are using, the excess is injected into the grid. Customers are credited for this, at the same rate that they are usually charged for electricity. The monetary value of the credit is based on all volumetric (kWh) charges that a customer consuming this amount of electricity would otherwise pay.10
Net metering can reduce commodity charges, and some delivery and regulatory charges (see Q8 for a description of the residential bill).11 But as electricity bills also include fixed charges, which net metering cannot reduce, a customer’s bill will not drop in proportion to the percentage of their electricity use that is self-generated.12
1
2
54
3
6

Why do customers still need to pay an electricity bill if they generate 100% of their own electricity?
What impact will net metering have on the future of renewable electricity in Ontario? Q18
289Environmental Commissioner of Ontario 2018 Energy Conservation Progress Report, Volume One
For example, a Hydro One residential customer who uses 750 kWh per month13 of electricity and generates 50% of this (375 kWh) will see their bill fall by 38%. A customer that generates an amount exactly equal to their consumption (750 kWh) of electricity will see their bill fall by 75%, but not to zero.14 This equates to a payment of about 11¢ for every kilowatt-hour of electricity generated (using the electricity rates in effect in early 2018), much less than the 21-31¢/kWh tariff that was available to rooftop solar projects in 2017, the last year of the FIT/microFIT programs.15 The figures for other utilities are similar.
Why do customers still need to pay an electricity bill if they generate 100% of their own electricity? The reason is that they are using the electricity grid infrastructure as back-up to compensate for the real-time imbalances between their electricity production and their electricity use (Figure 18.2). This has value to the net metered customer, as it avoids the need for the customer to buy a large amount of on-site energy storage (such as batteries). The fixed charge for grid access is currently about $20/month for residential customers (the exact amount will vary by local distribution company (LDC)). These amounts will rise in the future, as more of the electricity bill will be recovered through a fixed charge. The move to a fixed rate is being phased in over 4 years and will be completed by 2019 for most utilities (perhaps adding another $15/month or so in fixed charges for residential customers; again this will vary by LDC). The fixed charge is still significantly less than the cost for a customer to go completely off-grid.
Commercial rooftop solar array.
Source: Abundant Solar Energy

290
What impact will net metering have on the future of renewable electricity in Ontario?
Making Connections: Straight Talk About Electricity in Ontario
Q18
Some Ontario LDCs charge an additional monthly fee to process net metering statements, which creates another cost barrier for net metering.
Time-of-use pricing for net metered customers
Time-of-use pricing (electricity rates that vary with time of day) is mandatory for almost all Regulated Price Plan electricity customers in Ontario (i.e., residential and small business customers), to recognize that it is much more expensive for the grid to produce power during times of peak demand. In the summer, time-of-
use rates are highest between 11 a.m. and 5 p.m., as demand is high during these hours. This is exactly when solar systems are producing much of their electricity. In other words, the higher time-of-use price periods tend to align with the production curves for solar.
Figure 18.2 shows a schematic of electricity generation and use on a typical summer day with a residential solar photovoltaic (PV) system that is net metered. The exports to the grid (the green bars) are the amount of electricity that the customer would be credited for, offsetting their purchases from the grid (the blue bars).
Figure 18.2. Electricity production and consumption on a summer day from a net metered 4 kW rooftop solar system.
Source: Ontario Ministry of Energy, Delivering Fairness and Choice, Ontario’s Long Term Energy Plan (Toronto: Ontario Ministry of Energy, October 2017) at 58.
However, net metered customers are not billed and credited based on time-of-use rates. They are billed on tiered rates that do not vary by time of day.16 This is due to information technology issues related to metering and billing. Using tiered rates allows each LDC to bill net-metered customers with the minimal
data management effort, but the trade-off is that it ignores the higher value of distributed solar power when provided at peak times, and also likely makes net metering less financially attractive for potential participants.
1
0.5
1
1.5
2
2.5
3
02 3 4 5 6 7 8 10 11 12 13 14 15 16 17 18 19 20 21 22 23 249
Co
nsu
mp
tio
n/G
en
era
tio
n (
kW)
Hour of the Day
Electricity Bought from LDC
Generation Sent to LDC
Self-Consumption
Typical Summer Day Load

Using tiered rates allows each LDC to bill net-metered customers with minimal effort, but ignores the higher value of distributed solar power when provided at peak times.
291Environmental Commissioner of Ontario 2018 Energy Conservation Progress Report, Volume One
What impact will net metering have on the future of renewable electricity in Ontario? Q18
Options for expanding net meteringThe Ontario Ministry of Energy recently posted regulatory proposals and invited comment on some options, such as third party ownership, and virtual net metering demonstration projects, that could expand opportunities for net metering.17
Third party ownership: Third party ownership would enable other entities to own a net metering generation facility at a customer’s site. This could help raise capital and professionalize construction and operation, enabling net metering for customers who cannot or do not want to take the financial or operational risk of owning and operating their own renewable energy system. The customer would enter into a financial agreement with the owner of the generation facility to take the electricity generated and to allow any excess to be directed into the LDC’s system. The customer would then receive a credit on their bill for this excess electricity, and would presumably share that credit in some fashion with the third party operator. The Ministry is also considering consumer protection measures, similar to those that are in place for electricity retailing, when a customer enters into an agreement with a generator.18
The uptake in Third Party Ownership projects will depend in part on the creditworthiness of load customers, which will vary. This will impact the ability of
solar energy providers to secure financing and leasing options to provide this service to potential customers.19
Virtual net metering: Virtual net metering is considered an “innovation” in the LTEP ( Q3). Virtual net metering allows Ontarians who are not able to have a net metered renewable energy project at their own location to participate in renewable energy projects located elsewhere (within the same LDC territory or potentially in the territory of other LDCs). For example, customers who rent, or homeowners without sun access could invest in, and be credited for, solar electricity generated on a neighbour’s property. Businesses with multiple locations could add solar at the most suitable locations, and offset some of their electricity use at other sites. The Ministry of Energy plans to allow proponents (likely in partnership with LDCs) to undertake demonstration projects, to help guide future policy.
Depending on how it is implemented, virtual net metering could also enable community solar, whereby individuals or businesses aggregate their funds (e.g., through a co-operative) to develop one or more larger-scale renewable energy projects, and use the electricity generated from the projects to reduce their electricity bills. Larger systems are more economical to install and operate than smaller systems.20
Siting restrictions: To ensure that generation facilities are sited appropriately, the Ministry is proposing siting restrictions for net metered facilities, similar to what existed under the FIT/microFIT programs, so that projects will not negatively impact residential areas and the province’s most productive soil will remain available for agriculture.21 Non-rooftop (ground-mounted) solar PV systems would have to be more than 15 metres from the property boundary and could not be sited on prime agricultural land. There would be a blanket prohibition on wind and non-rooftop solar net metered projects connected to residential dwellings. The Canadian Solar Industries Association (CanSIA) believes
Virtual net metering could enable community solar.
LDCs are not required to have technical capacity to accommodate renewables.
292
What impact will net metering have on the future of renewable electricity in Ontario?
Making Connections: Straight Talk About Electricity in Ontario
Q18
that these siting requirements are too restrictive.22 The ECO also believes that there are good opportunities to use solar in structures that cover vehicle parking and that these should be excluded from the siting restrictions on “non-rooftop solar”.
Integrating net metering into distribution networks: The Ontario Energy Board has established a working group to address any issues in connecting to the distribution system that could arise if there is increased interest in net metering.23
The most important issue and a key barrier is a provision in the distribution system code which only requires distributors to facilitate net metering until the total amount of generation capacity from net metered customers reaches the 1% threshold of the distribution system’s peak load (averaged over 3 years). It is at the utility’s discretion as to whether to permit additional net metering.24 This provision will be reviewed by the Net Metering Working Group.
The 1% threshold for net metered projects is one example of the larger regulatory and technical challenges of integrating more renewables into distribution networks. It is not clear whether the 1% threshold was originally set to minimize any financial impact on LDCs from net metering, or whether it was also set in part as a (very conservative) estimate as to the amount of distributed generation an LDC should be able to accommodate without any upgrades to its distribution network. LDCs understandably must ensure that the new two-way power flow does not cause problems for their distribution system, which was originally designed for one-way power flow.
The Green Energy Act gave the Ontario Energy Board a new objective of promoting network upgrades
to facilitate renewable energy connections, and took steps to spread some of the costs of network upgrades across all provincial electricity customers, so that certain LDCs were not burdened with excessive upgrade costs.25 The Board has provided guidance as to how distributors can seek funding for grid upgrades to enable renewables. At least $800M in approved infrastructure upgrades since the passage of the Green Energy Act were done (at least in part) to support renewable energy integration.26
But LDCs are not required to ensure that they have technical capacity throughout their network to accommodate renewables, and there is no clarity as to what level of upgrades (and what level of spending) is reasonable for utilities to make. Utilities therefore move at their own pace in making their network renewable-ready, and adopt their own technical criteria for whether or not projects can be connected.27 For example, Hydro One and some other distributors limit renewable energy on a line to 7-10% of the line capacity; this has been a significant barrier to renewable energy development in some parts of the province.28 The IESO is currently assessing the potential for rooftop solar in Ontario based on building roof space, but this analysis does not take into account whether the relevant LDC will accept the power.29
Will net metering encourage renewable electricity?Will net metering encourage Ontarians to add renewable electricity supply? It looks unlikely, at least in the short term. In 2016, after a decade of net

At the moment, net metering projects do not make financial sense for most customers.
The economics can make more sense for larger commercial projects.
293Environmental Commissioner of Ontario 2018 Energy Conservation Progress Report, Volume One
What impact will net metering have on the future of renewable electricity in Ontario? Q18
metering, Ontario had only 983 net metering facilities (851 of them solar), with a total capacity of only 12 megawatts.30 While this was 30% higher than in 2015, it still represents a vanishingly small fraction (about 0.04%) of Ontario’s overall electricity capacity.
Of course, customers previously had the more lucrative option of applying for a long-term fixed price contract, which will no longer be a possibility. The first phase of net metering amendments only took effect in July 1, 2017, so it is too soon to be certain what impact they will have. The Ministry of Energy declined to provide an estimate of expected future participation in net metering.31
To ensure potential participants are aware of the possibility of net metering, the Ontario Energy Board is looking at how to improve the availability of information for customers.32 Although the Government of Ontario has a net metering web site, which explains how the system will work and who is eligible, not much explanatory information is available on the websites of many distributors.33
The larger problem is not lack of awareness, but economics. At the moment, net metering projects do not make financial sense for most customers. The estimated cost to a homeowner of installing solar electricity is about 16–30 ¢/kWh34, well above the credit for net metered electricity (roughly 11 ¢/kWh). “Grid parity” (where the unit cost of self-generated electricity matches or is lower than the cost for electricity obtained from the grid) has been reached in some European countries but not yet in Ontario.35 There will likely be some customers who see a non-monetary
benefit in meeting their energy needs with self-generated renewable electricity, and would be willing to pay a small premium for this (similar to customers who buy energy from premium renewable vendors such as Bullfrog Power), but it is unclear how large this customer base is.
The economics can make more sense for larger commercial projects, (which currently cost 12–22 ¢/kWh),36 especially since installing solar can fix the cost of electricity for 20 years or more (for the lifetime of the system), while grid prices are likely to go up. Commercial customers typically have larger useable roof space, can take a longer pay-back period and have higher on-site loads.37 One major reason why large solar is cheaper is that soft (non-hardware) costs such as installation, permitting, customer acquisition can make up a large share (more than half) of solar costs, and economies of scale mean that these costs are not proportionally as important for larger projects.38 While CanSIA has made it a priority to reduce these costs for all sizes of solar projects, virtual net metering will be required for most potentially economic (larger) systems to fit into the net metering framework. Even then, CanSIA expects future net metering uptake to be small.39
Electricity pricing and rate design obviously affect the economics of net metering. The Fair Hydro Plan (which reduces residential electricity bills by 25%, for a few years) pushes net metering farther away from grid parity and likely makes third party models for residential and small commercial customers uneconomical.40 Denying time-of-use pricing to net metered solar customers further erodes the financial case for installing renewable
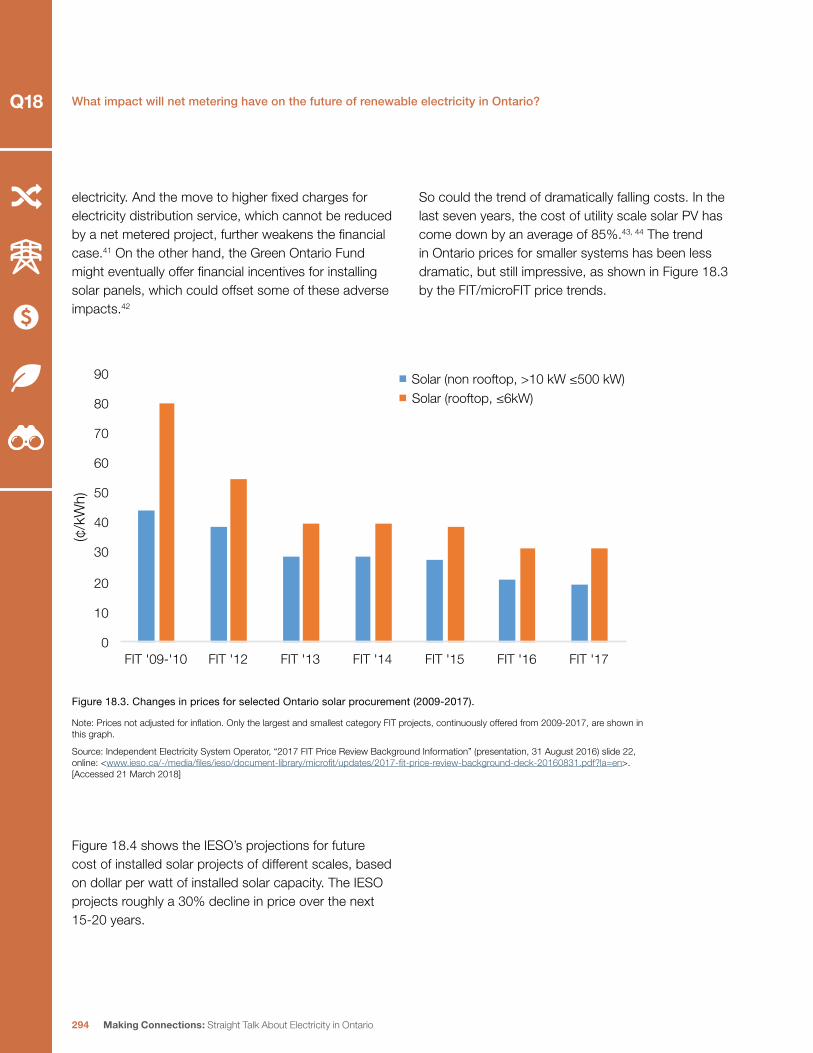
294
What impact will net metering have on the future of renewable electricity in Ontario?
Making Connections: Straight Talk About Electricity in Ontario
Q18
electricity. And the move to higher fixed charges for electricity distribution service, which cannot be reduced by a net metered project, further weakens the financial case.41 On the other hand, the Green Ontario Fund might eventually offer financial incentives for installing solar panels, which could offset some of these adverse impacts.42
So could the trend of dramatically falling costs. In the last seven years, the cost of utility scale solar PV has come down by an average of 85%.43, 44 The trend in Ontario prices for smaller systems has been less dramatic, but still impressive, as shown in Figure 18.3 by the FIT/microFIT price trends.
Figure 18.3. Changes in prices for selected Ontario solar procurement (2009-2017).
Note: Prices not adjusted for inflation. Only the largest and smallest category FIT projects, continuously offered from 2009-2017, are shown in this graph.
Source: Independent Electricity System Operator, “2017 FIT Price Review Background Information” (presentation, 31 August 2016) slide 22, online: <www.ieso.ca/-/media/files/ieso/document-library/microfit/updates/2017-fit-price-review-background-deck-20160831.pdf?la=en>. [Accessed 21 March 2018]
Figure 18.4 shows the IESO’s projections for future cost of installed solar projects of different scales, based on dollar per watt of installed solar capacity. The IESO projects roughly a 30% decline in price over the next 15-20 years.
0
10
20
30
40
50
60
70
80
90
FIT '09-'10 FIT '12 FIT '13 FIT '14 FIT '15 FIT '16 FIT '17
(¢/k
Wh)
Solar (non rooftop, >10 kW ≤500 kW) Solar (rooftop, ≤6kW)

Ontario’s hard stop in renewable electricity procurement dramatically undercuts the future of this industry in Ontario.
295Environmental Commissioner of Ontario 2018 Energy Conservation Progress Report, Volume One
What impact will net metering have on the future of renewable electricity in Ontario? Q18
Figure 18.4. Installed solar PV cost projections in Ontario.
Source: Independent Electricity System Operator, “Appendix B, Data Tables for the Technical Report” (presentation, August 2016).
If and when the cost of solar reaches grid parity, averaged over the 20+ year working life of the panels, the number of customers interested in net metering could spike upwards.
Impact on the solar industryOntario has made numerous promises about building a low carbon economy. The FIT/microFIT and renewable electricity procurement programs allowed Ontario to build up substantial expertise and a large solar value chain, from professional services (e.g. financing, engineering), to photovoltaic module production, to manufacturing of supporting components, to construction and installation.45
In a report to the International Energy Agency, CanmetENERGY (part of Natural Resources Canada) confirmed that Ontario has about 99% of the total solar installed capacity in Canada, and accounted for 90% of the Canadian market share for new installations in 2016.46 There are still three companies producing PV modules in Ontario with a total maximum production capacity of about 250 MW/yr.47 One of these companies (Canadian Solar) is one of the three biggest solar companies in the world by revenue at about $2.8 billion,48 an important Ontario success story. Heliene, located in Sault Ste. Marie is helping to transform Northern Ontario with alternative energy projects including this manufacturing facility.49 Silfab Solar has also now partnered with Morgan Solar Inc.
of Toronto to mass produce low cost PV modules.50 The report authors estimated that the total value of PV capacity installations in 2016 in Canada was about $340 million, with $300 million of this in Ontario. Ontario manufacturers are well positioned to take advantage of export markets to other jurisdictions where there is a growing demand for renewable electricity in the U.S. and elsewhere in Canada.51
Ontario’s hard stop in renewable electricity procurement, including the termination of the FIT/microFIT programs as well as the cancellation of the Large Renewable Procurement (LRP II) {~ 980 MW}, dramatically undercuts the future of this industry in Ontario, other than the small niche of off-grid systems. Some of the industry is shifting to other provinces and states that do encourage solar development. Alberta, for example, now gives rebates of up to 30% off solar installations, to a maximum of $10,000, to foster the industry and spur job creation and has committed to 30% of all electricity to come from renewables by 2030.52, Both Alberta and Saskatchewan are taking the lead in utility scale solar projects, which are attracting companies from Ontario.53

During hot summer days, solar generation displaces some natural gas-fired generation, reducing cost and greenhouse gas emissions.
296
What impact will net metering have on the future of renewable electricity in Ontario?
Making Connections: Straight Talk About Electricity in Ontario
Q18
If Ontario allows virtual net metering and third party operation, pays time-of-use rates, and works to address other regulatory barriers and soft costs, then net metering could allow Ontario to transition away from the FIT model and maintain some of the capacity for solar production and installation that it has developed over the last decade. This would keep some solar jobs and expertise in Ontario, an important consideration as one projection shows a net loss of about 5,000 jobs in Ontario’s solar sector between 2017 and 2021.54
Does net metering benefit LDCs and other electricity customers?Net metered customers use the grid as a large battery. They use the wires and poles that move electricity around, and grid sources of power when their own system is unable to meet demand. How does net metering affect the cost of distribution and of generation for the system as a whole?
For wires and poles, net metered customers are roughly paying a fair share of the current costs to maintain the existing grid, under the current distribution rate design.55 This means they do not impose any additional distribution costs to customers who do not participate in net metering. In the longer term, net metering could increase or decrease grid infrastructure costs. On one hand, generation is typically sited closer to load. This may reduce costs, i.e., there may be opportunities to “downsize” parts of the grid when infrastructure is replaced, or existing infrastructure may accommodate more growth.56 There may also be savings because less energy is lost through line losses as electricity travels from generator to consumer. On the other hand, utilities may need to make additional investments to manage the two-way flow of electricity, which the distribution networks were not originally designed for.
The generation cost impact of net-metered projects on non-participating customers is equivalent to the government purchasing an open-ended amount of new renewable electricity generation, at a rate that is currently roughly 11¢/kWh. This is lower than we have historically paid for renewable electricity in Ontario (the average cost of solar PV in LRP 1 was about 15.7¢/kWh). Therefore, the transition to net metering reduces electricity supply costs to non-participating customers, at least in the near term.
Solar electricity production is high during summer days, as shown in Figure 18.5, which benefits the environment and the electricity system. This output coincides with the current peak demand requirements of Ontario’s system (primarily from the increased use of air conditioners). Peak electricity is by far the most expensive for the grid to provide. During hot summer days, solar generation displaces some natural gas-fired generation, reducing cost and greenhouse gas emissions.57 Solar does not supply power at night (unless it is combined with energy storage), when Ontario’s system generally needs power the least. It may also reduce the need for new generation capacity, although this might change if Ontario switches to a winter-peaking jurisdiction in the future (e.g., due to electrification of heating).58

Most U.S. studies have concluded that net metering benefits all utility customers.
297Environmental Commissioner of Ontario 2018 Energy Conservation Progress Report, Volume One
What impact will net metering have on the future of renewable electricity in Ontario? Q18
Figure 18.5. Average daily solar radiation – Toronto.
Source: “Frequently Asked Questions”, online: Northern Lights Solar Systems <www.solarman.ca/faqtech.php>. [Accessed 21 March 2018]
In U.S. states where net metering has become popular, the argument about how it is impacting utilities and their customers has been widely debated. Most U.S. studies have concluded that net metering benefits all utility customers, once all benefits such as avoided infrastructure investments and carbon reductions are considered.59 However, the precise impacts depend on local characteristics. An extreme example is Hawaii, where there is lots of sun and high electricity prices (due to the need to import fuel) made net metering very attractive. The Hawaii Public Utilities Commission in 2015 closed its net metering program; there was so much solar generation in the State that the utility had problems managing the low combustion levels required from its fossil-fuel generators. In the Hawaiian Electric Company territory, 16% of customers had net metered systems and accounted for more than 30% of the individual circuit peak load.60 Nevada also rolled
back their net metering provisions, which resulted in the major providers of rooftop panels, such as SolarCity, leaving the State entirely.61 Some states, such as Massachusetts, have placed a cap on the amount of net metering, hoping to help protect the LDCs but also encourage the deployment of solar technology.62
Time-of-use pricing could improve the value of net metered renewable electricity to the grid, by encouraging customers to integrate it with energy storage, and return stored energy to the grid during “on-peak” periods, when the electricity rate is higher,
1.682.28
3.6
4.95.36
5.826.18
5.28
3.9
2.5
1.28 1.18
0
1
2
3
4
5
6
7
Janu
ary
Febru
aryMarc
hApri
lMay
June Ju
ly
Augus
t
Septem
ber
Octobe
r
Novem
ber
Decem
ber
Aver
age
daily
sol
ar ra
diat
ion
(hou
rs)

298
What impact will net metering have on the future of renewable electricity in Ontario?
Making Connections: Straight Talk About Electricity in Ontario
Q18
particularly in the fall and winter, when demand peaks later in the day, after the time that solar production peaks. Time-of-use pricing was the primary concern raised in public comments submitted through the Environmental Registry on the first round of the Ministry’s net metering amendments.63 The Ministry of Energy has committed to undertake a cost-benefit
analysis to assess whether the required investments should be made to enable province-wide time-of-use pricing for all net metered customers. Direct utility control of energy storage and net metering might deliver additional grid benefits, as discussed in the textbox “Utility integration of net metering and on-site energy storage”.
Utility integration of net metering and on-site energy storage
In the 2017 Long-Term Energy Plan (LTEP), the Ontario Government has promised to work with the Independent Electricity System Operator (IESO) to develop some renewable distributed energy demonstration projects.64 Residential energy storage is one technology to be considered.
Customers may wish to pair solar with storage to protect against grid outages. However, in everyday operations, most customers will not notice or care how power flows between their solar system, their battery, and the grid, so long as their electricity needs are being met. However, the direction and timing of power flow will matter to utilities. If they can have some control of this operation, they can use it to extend the life of grid infrastructure, reduce peak demand, and provide additional grid services.
Ontario local distribution companies (LDCs) are exploring how various forms of distributed energy resources may support their business models and enhance grid reliability. Various projects which involve linking a number of houses who are net metered, with storage capabilities and where the LDC’s control and data acquisition system directs the flow of
energy for maximum benefit, are being planned or are in operation.
For example, Oshawa PUC together with Tabuchi Electric and Panasonic Eco Solutions have launched a pilot project that provides thirty homes with solar panels, batteries and an inverter (to convert electricity between direct current and alternating current) free of charge.65 These customers will be switched to a net metering contract. The homes’ energy usage during a power outage will be pre-determined to allow the battery bank to provide this minimal power for a few days.66 Aside from that constraint, the utility will determine when the stored energy in the battery is used. With an efficient control and data acquisition system operated by the utility, it will allow the LDC to shift demand from on-peak to off-peak.67
Alectra has conducted a similar residential solar storage pilot (the Power.House project). To test more northerly regions where daylight periods are longer in summer but shorter in winter, the company has also partnered with Thunder Bay Hydro.68

299Environmental Commissioner of Ontario 2018 Energy Conservation Progress Report, Volume One
What impact will net metering have on the future of renewable electricity in Ontario? Q18
Sunverge’s residential solar electricity battery storage system used by Alectra Utilities in their Power.House demonstration project.
Source: Sunverge
These examples (and others)69 show the future of distributed electricity generation in Ontario may be one in which net metering is combined with solar generation and storage, potentially along with some degree of utility operational control. Residential or community sized, the issue remains one of how to deploy and manage these systems over a large number of customers. If such systems are to help manage peak loads and provide energy across the grid as and when needed with the maximum benefit to customers, an advanced control and data
acqusition system will be key to its success. The Electricity Distributors Association has released a vision paper that sees utility control of distributed energy resources, including behind-the-meter energy generation and storage, as a key to helping make sure that distributed resources are used in a manner that provides the maximum value to the energy grid and customers.70 It is an open question as to how large a role should be played by LDCs versus other actors in advancing distributed electricity generation and other innovative energy technologies ( Q16).

Ontario has turned dramatically away from supporting the growth of renewable energy in favour of keeping near-term electricity prices down. This is a serious blow to the low-carbon economy that Ontario has been building for the last 10 years.
300
What impact will net metering have on the future of renewable electricity in Ontario?
Making Connections: Straight Talk About Electricity in Ontario
Q18
ConclusionOntario has turned dramatically away from supporting the growth of renewable energy in favour of keeping near-term electricity prices down. This is a serious blow to the low-carbon economy that Ontario has been building for the last 10 years.
Net metering will not get renewable energy projects built at the same level that occurred under the FIT program. However, it does preserve a modest option for Ontario consumers who are interested in generating their own electricity and doing their part for the environment.
If properly implemented, net metering could allow Ontario to keep some portion of its solar industry jobs and expertise, as well as procuring a small amount of distributed renewable electricity at a relatively low cost.
The government should ensure that siting restrictions and constraints connecting to the distribution system do not unduly inhibit uptake of net metering.
RECOMMENDATION: The Ministry of Energy should ensure that prohibitions on siting of non-rooftop solar projects within residential areas or near property boundaries do not apply to structures that shade vehicle parking areas, whether or not they are attached to a building.
RECOMMENDATION: The Ontario Energy Board should require utilities to accommodate a reasonable level of renewable distributed generation.
Since larger projects are less expensive to build and operate, policies that encourage cooperative and community projects (such as virtual net metering and third-party operation) are likely to increase the number of net metering projects.
RECOMMENDATION: The Ministry of Energy’s net metering framework should accommodate and encourage co-operative and community projects.
The amount credited for net metered electricity should better match its value to the system, including its carbon reductions and peak demand reductions. Wherever possible, this should include time of day rates.
RECOMMENDATION: The Ministry of Energy should facilitate time-of-use pricing for net metering.

301Environmental Commissioner of Ontario 2018 Energy Conservation Progress Report, Volume One
What impact will net metering have on the future of renewable electricity in Ontario? Q18
.
.
.
.
.
.
.
.
.
.
.
.
.
.
.
.
.
.
.
.
.
.
.
.
.
.
.
.
.
Endnotes
1 Independent Electricity System Operator, A Progress Report on Contracted Electricity Supply, Second Quarter 2017 (Toronto: IESO, September 2017) at 30.
2 Production can exceed consumption within a given month – customers are given a credit for the excess that can be carried forward for up to 12 months to offset future costs. See for example, Hydro One’s Net Metering Program <www.hydroone.com/business-services/generators/net-metering>. [Accessed 21 March 2018]
3 International Energy Agency, National Survey Report of PV Power Applications in Canada (Ottawa, Natural Resources Canada, 2014) at 15.
4 Manitoba Hydro has a net metering solar program and also pays a capital incentive of $1 per watt installed capacity. Originally established in 2008, Alberta’s Micro-Generation Regulation allows Albertans to generate their own electricity to meet their own needs.This was updated in 2016 to increase the size allowed to 5 MW and allow systems to serve adjacent sites.It is currently again being reviewed to allow community owned generation. SaskPower also has a net metering program for up to 100 kW in which they will also provide up to $20,000 as a capital rebate.
5 Some jurisdictions like Nova Scotia do allow the sale of excess generation at the end of the year.
6 Environmental Registry Regulation Proposal #013-1913, Proposed Amendment of Ontario Regulation 541/05: Net Metering or a New Regulation (To Be Determined) to be made under the Ontario Energy Board Act, 1998 (28 November 2017).
7 Ontario Energy Board Act, 1998, O. Reg 541/05: Net Metering.
8 Environmental Registry Regulation Proposal #012-8435, Amendment of Ontario Regulation 541/05: Net Metering, made under the Ontario Energy Board Act, 1998 (22 December 2016).
9 The Environmental Registry (012-8435), posted December 22 2016, regulatory proposal removed the 500kW maximum size limit.
10 How an LDC should bill a net metered customer is explained in the net metering regulation. O.Reg. 541/05: Net Metering.
11 See the Sunfish web site for an example of a Hydro One bill for a net metered customer; online: <i0.wp.com/sunfishsolar.ca/wp-content/uploads/2015/02/Hydro-generation.jpg> [Accessed 21 March 2018]
12 Larger business customers not eligible for the Regulated Price Plan pay a larger portion of their bills based on their demand (kW). As with fixed charges, demand-based charges cannot be offset based on net metering.
13 The OEB set the standard residential consumption in Ontario at 750 kWh/month on April 14, 2016.
14 The calculation is based on customers having tiered rates (“Bill calculator”, online: Ontario Energy Board <www.oeb.ca/consumer-protection/energy-contracts/bill-calculator>.[Accessed 21 March 2018].
15 “FIT/microFIT Price Schedule (January 1, 2017)”, online: <ieso.ca/-/media/files/ieso/document-library/fit/2017-fit-price-schedule.pdf?la=en>. [Accessed 13 March 2017].
16 As of July 1, 2017, tiered rates were: 7.7¢/kWh for less than 600 kWh used per month, and 9.0 ¢/kWh above this level of consumption. These prices do not depend on the time of day when electricity is used.
17 Environmental Registry Regulation Proposal # 013-1913, Proposed Amendment of Ontario Regulation 541/05: Net Metering, or a new Regulation (To Be Determined), to be made under the Ontario Energy Board Act 1998 (28 November 2017).
18 Environmental Registry Regulation proposal # 013-1915 Proposed Amendment of Ontario Regulation 389/10: (General), to be made under the Energy Consumer Protection Act, 2010 (28 November 2017)
19 Ontario Ministry of Energy, Market Analysis of Ontario’s Renewable Energy Sector, (Toronto: Compass Renewable Energy Consulting Inc., June 2017) at 14.
20 Independent Electricity System Operator, Ontario Planning Outlook (Toronto: IESO, September 2016) at 13.
21 Environmental Registry Regulation Proposal #013-1916, Proposed New Regulation to be made under the Electricity Act, 1998 (28 November 2017).
22 “Submission re: Proposed Enhancement’s to Ontario Net Metering Framework”, online: CanSIA <www.cansia.ca/uploads/7/2/5/1/72513707/180118_-_cansia_submission_re_ebr_net_metering_20_final.pdf>. [Accessed 16 March 2018]
23 “Net Metering Consultation”, Ontario Energy Board, online: <www.oeb.ca/industry/policy-initiatives-and-consultations/net-metering-consultation>. [Accessed 21 March 2018]
24 Ontario Energy Board, Distribution System Code, (Toronto: OEB, March 2018) at 127.
25 The exact wording of the OEB’s objective is “to promote the use and generation of electricity from renewable energy sources in a manner consistent with the policies of the Government of Ontario, including the timely expansion or reinforcement of transmission systems and distribution systems to accommodate the connection of renewable energy generation facilities” (Ontario Energy Board Act, s. 1(1)5); Ontario Regulation 330/09: (Cost Recovery re Section 79.1 of the Act) defines the formula for recovering some network upgrade costs for renewables integration from all provincial customers.
26 Ontario Energy Board information provided to the ECO in response to ECO inquiry (22 December 2017).
27 Ontario Energy Board, Filing Requirements for Electricity Transmission and Distribution Applications, Chapter 4 (Toronto, OEB, July 2014) at 16. Applicants can use this information to seek approval from the Board for funding to upgrade their network to accommodate renewables. However, this is not mandatory- distributors determine the pace at which they upgrade their system to accommodate renewables, and can reject projects if the “technical capacity” does not exist. One exception is a 2011 directive from the Minister of Energy that specifically directed the Board to require Hydro One to upgrade certain aspects of their transmission system to enable renewables; online:<www.hydroone.com/abouthydroone/RegulatoryInformation/oebapplications/Documents/dec_order_et_HONI_20110228.pdf>. [Accessed 21 March 2018]
28 Ontario Power Authority Comments,Board Staff Discussion Paper on Issues Related to the Connection of Micro-Embedded Generation Facilities EB-2012-0246 (Toronto: Ontario Power Authority, January 2013)at 3.
29 Independent Electricity System Operator, information provided to the ECO in response to ECO inquiry (17 November 2017).

302
What impact will net metering have on the future of renewable electricity in Ontario?
Making Connections: Straight Talk About Electricity in Ontario
Q18
.
.
.
.
.
.
.
.
.
.
.
.
.
.
.
.
.
.
.
.
.
.
.
.
.
.
.
.
.
.
.
.
.
30 Ministry of Energy, information provided to the ECO in response to ECO inquiry (17 November 2017).
31 Ibid.
32 Letter from the Ontario Energy Board to All Licensed Electricity Distributors and All Other Interested Parties (25 May 2017), online: <www.oeb.ca/sites/default/files/letter-Net-Metering-Consultation_20170525.pdf>
33 Some general information is available at: “Save on your energy bill with net metering”, online: Ontario Ministry of Energy, Renewable Energy Facilitation Office <www.ontario.ca/page/save-your-energy-bill-net-metering>.
34 Canadian Solar Industries Association, “Feedback to AWG”, (presentation, 13 March 2017) slide 4 online:<www.cansia.ca/uploads/7/2/5/1/72513707/170313_-_cansia_nmf_feedback_to_awg_vf.pdf>
35 European Commission, Best practices on Renewable Energy Self-consumption (Brussels: European Commission, July 2015) at 2.
36 In addition to the capital cost of the system, in some cases there are other charges incurred for net metering, which could include an account set up charge and a monthly service charge. For example, see Hydro Ottawa, who charge $30 to set up the account and $19/month as a service charge. (“Generator Charges”, online: HydroOttawa <hydroottawa.com/accounts-and-billing/generation/generator-charges>. [Accessed 21 March 2018]
37 Canadian Solar Industries Association, “Feedback to AWG” (presentation, 13 March 2017) slide 5 online: <www.cansia.ca/uploads/7/2/5/1/72513707/170313_-_cansia_nmf_feedback_to_awg_vf.pdf>
38 Canadian Solar Industries Association, Roadmap 2020 Powering Canada’s Future With Solar Electricity (Ottawa: CanSIA, 2017) at 16.
39 Ibid.
40 Ibid at 4.
41 No LDC has completed the transition to fully fixed distribution rates, which is being phased in over a four-year period, but most distributors will be on fully fixed pricing by 2019 or 2020 (Ontario Energy Board information provided to the ECO in response to ECO inquiry (17 November 2017)).
42 One exception is the Smart Green program, managed by the Canadian Manufacturers and Exporters, which is only available to smaller manufacturing businesses, where solar is one of the project categories eligible for incentives (“Project Funding Guidelines”, online: Smart Green Program <cmeweb.crm.eperformanceinc.com/smartgreen/smartgreenproject/> [Accessed 21 March 2018]).
43 “Expect the Unexpected: The Disruptive Power of Low-carbon Technology”, online: Carbon Tracker <www.carbontracker.org/reports/expect-the-unexpected-the-disruptive-power-of-low-carbon-technology/>.[Accessed 16 March 2018]
44 “Lazard’s Levelized Cost of Energy Analysis – Version 10.0”, online: Lazard <www.lazard.com/media/438038/levelized-cost-of-energy-v100.pdf>. [Accessed 16 March 2018]
45 CanmetENERGY, Sector Profile for Solar Photovoltaics in Canada by Navigant Consulting (Toronto: Navigant Consulting, March 2012) at 59.
46 CanmetENERGY, National Survey Report of PV Power Applications in CANADA – 2016, (Ottawa, CanmetENERGY, 2017) at 6
47 The three companies are: Silfab (Mississauga), Heliene (Saulte Ste. Marie), and Canadian Solar (Guelph).
48 “Canadian Solar - Company Profile North America”, online: Canadian Solar <www.canadiansolar.com/media/canadian_solar-web_brochure-north_america.pdf>. [Accessed 16 March 2018]
49 Peter Kuitenbrouwer, “Renewing the Soo: How alternative energy investments are transforming Saulte Ste. Marie”, Financial Post, (12 August 2016) online: <business.financialpost.com/executive/smart-shift/renewing-the-soo-how-alternative-energy-investments-are-transforming-sault-ste-marie?__lsa=103d-c154>
50 Silfab Solar, News Release, “Silfab Partners with Morgan Solar To Disrupt The Cost of PV”, (5 December 2017).
51 Ontario Ministry of Energy, Market Analysis of Ontario’s Renewable Energy Sector, (Toronto, Compass Renewable Energy Consulting Inc., June 2017) at 7.
52 Slav Kornik, “Alberta offering up to 30% off solar panel installation with $36M program” (21 June 2017) online: <globalnews.ca/news/3544679/alberta-government-revealing-details-about-solar-program/>
53 CanSIA “Solar Year-In-Review”, Solar Canada 2017, (presentation 3 December 2017) slide 11, online: <solarcanadaconference.ca/wp-content/uploads/2017/12/Day1-2-Solar-Year-In-Review-Outlook-2018.pdf>.
54 Ontario Ministry of Energy, Market Analysis of Ontario’s Renewable Energy Sector, (Toronto, Compass Renewable Energy Consulting Inc. June 2017) at 25.
55 This is because of the transition to a fixed customer charge for distribution costs, at least for residential customers. This fixed cost serves to cover grid maintenance, and is not tied to the amount of electricity a customer uses.
56 Stakeholder meeting with the Electricity Distributors Association, November 2017.
57 Independent Electricity System Operator, information provided to ECO inquiry (17 November 2017).
58 Independent Electricity System Operator, “Module 7: Electricity System Cost Outlook”, (presentation, August 2016).
59 “Rooftop solar: Net metering is a net benefit”, online: Brookings <www.brookings.edu/research/rooftop-solar-net-metering-is-a-net-benefit/>. [Accessed 21 March 2018]
60 Julia Pyper, “Hawaii Regulators Shut Down HECO’s Net Metering Program” Greentech Media (14 October 2015) online: <www.greentechmedia.com/articles/read/hawaii-regulators-shutdown-hecos-net-metering-program#gs.MrsOkHc>
61 Ivan Penn, “SolarCity to leave Nevada after PUC cuts rooftop solar benefits”, (23 December 2015) online: <www.latimes.com/business/la-fi-solarcity-nevada-rooftop-20151223-story.html>
62 Electricity Distributors Association, The Power To Connect, Advancing Customer-Driven Electricity Solutions for Ontario (Vaughan: Electricity Distributors Association, February 2017) at 73.

303Environmental Commissioner of Ontario 2018 Energy Conservation Progress Report, Volume One
What impact will net metering have on the future of renewable electricity in Ontario? Q18
.
.
.
.
.
.
.
.
63 Environmental Registry Regulation Proposal # 012-8435, Amendment of Ontario Regulation 541/05: Net Metering, made under the Ontario Energy Board Act, 1998 (22 December 2016).
64 Ontario Ministry of Energy, Delivering Fairness and Choice, Ontario’s Long-Term Energy Plan 2017 (Toronto: Ontario Ministry of Energy, October 2017) at 68.
65 Electricity Distributors Association, The Power To Connect, Advancing Customer-Driven Electricity Solutions for Ontario (Vaughan: Electricity Distributors Association, February 2017) at 57.
66 “Solar Storage Pilot Program”, online: Oshawa PUC Networks Inc., <www.opuc.on.ca/frequently-asked-questions-faqs/>. [Accessed 16 March 2018]
67 Electricity Distributors Association, The Power To Connect, Advancing Customer-Driven Electricity Solutions for Ontario (Vaughan, Electricity Distributors Association, February 2017) at 57.
68 PowerStream Inc., News Release, “PowerStream Expanding Residential Solar-Storage Through Other Utilities” (7 October 2016).
69 Examples of future energy management are: a) “Community Energy Storage”, online: Ecamion <www.ecamion.com/portfolio/ces/> [Accessed 21 March 2018]; b) CBC News, “Construction begins on North Bay’s new community energy park microgrid” CBC News online: <www.cbc.ca/news/canada/sudbury/north-bay-hydro-microgrid-1.4419161>
70 Electricity Distributors Association, The Power To Connect, Advancing Customer-Driven Electricity Solutions for Ontario (Vaughan: Electricity Distributors Association, February 2017) at 9.
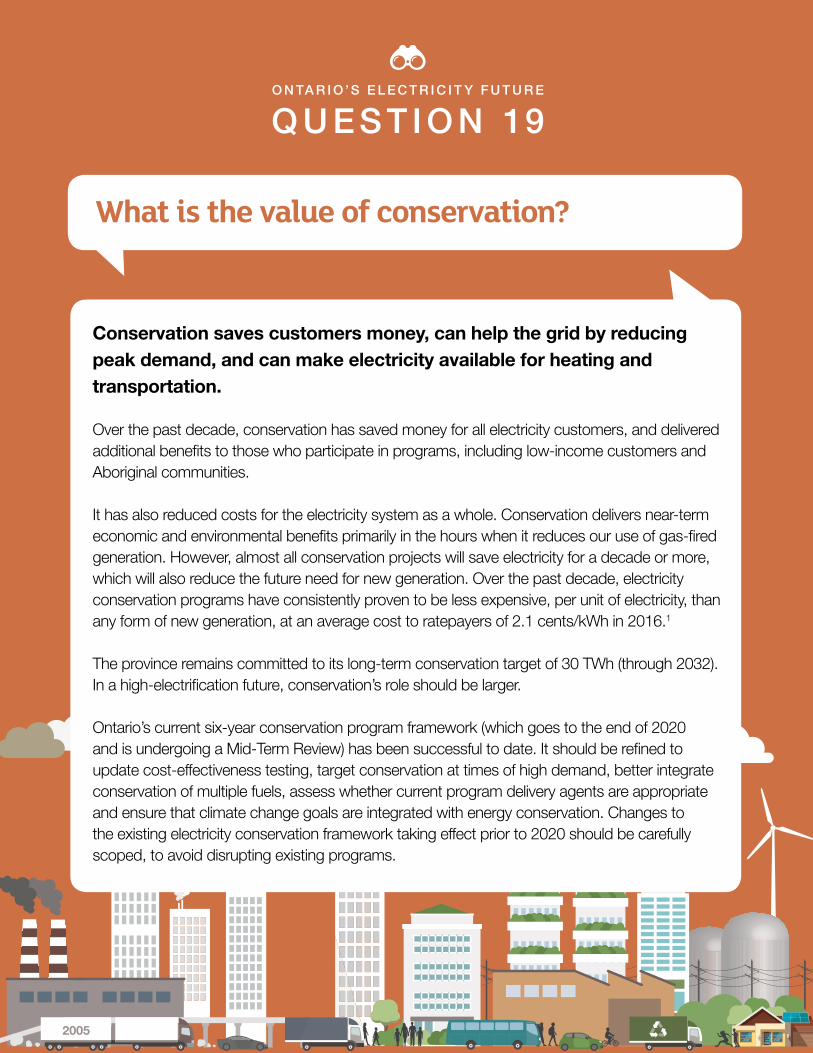
2005
O N TA R I O ’ S E L E C T R I C I T Y F U T U R E
Q U ES T I O N 19
What is the value of conservation?
Conservation saves customers money, can help the grid by reducing peak demand, and can make electricity available for heating and transportation.
Over the past decade, conservation has saved money for all electricity customers, and delivered additional benefits to those who participate in programs, including low-income customers and Aboriginal communities.
It has also reduced costs for the electricity system as a whole. Conservation delivers near-term economic and environmental benefits primarily in the hours when it reduces our use of gas-fired generation. However, almost all conservation projects will save electricity for a decade or more, which will also reduce the future need for new generation. Over the past decade, electricity conservation programs have consistently proven to be less expensive, per unit of electricity, than any form of new generation, at an average cost to ratepayers of 2.1 cents/kWh in 2016.1
The province remains committed to its long-term conservation target of 30 TWh (through 2032). In a high-electrification future, conservation’s role should be larger.
Ontario’s current six-year conservation program framework (which goes to the end of 2020 and is undergoing a Mid-Term Review) has been successful to date. It should be refined to update cost-effectiveness testing, target conservation at times of high demand, better integrate conservation of multiple fuels, assess whether current program delivery agents are appropriate and ensure that climate change goals are integrated with energy conservation. Changes to the existing electricity conservation framework taking effect prior to 2020 should be carefully scoped, to avoid disrupting existing programs.

305Environmental Commissioner of Ontario 2018 Energy Conservation Progress Report, Volume One
Q19What is the value of conservation?
Contents
THE DETAILS . . . . . . . . . . . . . . . . . . . . . . . . . . . . . . . . . . . . . . . . . . . . . . . . . . . . . . . . . . . . . . . . . . 306
Current conservation targets and programs . . . . . . . . . . . . . . . . . . . . . . . . . . . . . . . . . . . . . . . . . 306
The value of conservation for participating customers . . . . . . . . . . . . . . . . . . . . . . . . . . . . . . . . 308
The value of conservation to the electricity system . . . . . . . . . . . . . . . . . . . . . . . . . . . . . . . . . . . 309
Incorporating greenhouse gas emission reductions in conservation cost-benefit calculations . . . . . . 311
Conservation will be more valuable in a high-electrification future . . . . . . . . . . . . . . . . . . . . . . . . . . . 313
The need for a continuous culture of conservation. . . . . . . . . . . . . . . . . . . . . . . . . . . . . . . . . . . . . . 313
Is more electricity conservation possible? . . . . . . . . . . . . . . . . . . . . . . . . . . . . . . . . . . . . . . . . . . . . 314
The mid-term review of conservation programs . . . . . . . . . . . . . . . . . . . . . . . . . . . . . . . . . . . . . . 316
ECO comment . . . . . . . . . . . . . . . . . . . . . . . . . . . . . . . . . . . . . . . . . . . . . . . . . . . . . . . . . . . . . . . . . 316
Endnotes . . . . . . . . . . . . . . . . . . . . . . . . . . . . . . . . . . . . . . . . . . . . . . . . . . . . . . . . . . . . . . . . . . . . . 318

306
Q19
Making Connections: Straight Talk About Electricity in Ontario
Ontario has a long-term electricity conservation target that is roughly 20% of current electricity demand.
The details…
“Why do we invest in conservation during an electricity surplus?” is a common question from Ontario’s energy stakeholders and critics. As shown in Q5 and
Q7, Ontario has surplus electricity only at times of low demand, and most of this surplus is temporary.
During hours of high demand, Ontario runs more expensive and polluting gas-fired generation, which could be avoided through conservation and demand management. As explained in Q5, Ontario can only just meet its peak summer demand with existing resources, and will need new generation in future years because of planned nuclear refurbishments and closures and projected electrification (see Q15).
Electricity conservation programs, which have been reducing overall electricity consumption and consumption during peak demand hours since 2005, will become increasingly valuable as the “surplus” runs out and as the province moves towards electrification to achieve its climate goals. Conservation measures installed today will deliver savings for many years. This section of the ECO’s report discusses the current and future value of conservation, and what changes can make conservation more effective.
Current conservation targets and programsOntario’s Long-Term Energy Plan (LTEP) has a long-term electricity conservation target (30 TWh reduction in electricity use by 2032, roughly 20% of Ontario’s current electricity demand). This target is to be achieved through conservation programs, energy codes and standards, pricing policies and other initiatives.
In this chapter, we focus only on utilities’ electricity conservation programs that are partially funded through electricity rates and are delivered by local distribution companies (LDCs) and/or the Independent Electricity System Operator (IESO). These programs have been available across the province since 2005. Note: This chapter does not discuss programs such as GreenON, which are funded with cap and trade proceeds to reduce GHG emissions, nor the risk of overlap and confusion between the two types of programs.2
The budget to deliver these utility programs comes from all Ontario electricity customers and includes program administration (26% of total cost in 2015) and incentives to customers who participate in conservation projects (74% of total cost in 2015).3 For most programs, the incentives to participants do not cover the full cost of the conservation project; roughly one-third of the program cost is paid for by participants, as seen in Figure 19.1. The amount spent on conservation is a small fraction of Ontarians’ electricity bills. In 2016, electricity customers paid $307 million on LDC/IESO electricity conservation programs, 1.4% of the total cost of electricity service.4 Conservation spending was lower in 2016 than in 2015.5

307Environmental Commissioner of Ontario 2018 Energy Conservation Progress Report, Volume One
Q19What is the value of conservation?
Figure 19.1. The costs and benefits to society of 2014 electricity conservation programs
Note: This figure is based on the actual spending data provided by the IESO for a previous ECO report.
Source: Environmental Commissioner of Ontario, Conservation Let’s Get Serious, Annual Energy Conservation Progress Report- 2015/2016 (Toronto: ECO, May 2016) at 126.
Currently, the province is halfway through the 2015-2020 Conservation First Framework (CFF) that targets 7 TWh of incremental electricity savings for distribution-connected customers (a subset of the longer-term 30 TWh target).6 For more specifics on this conservation framework and the programs offered, see our report Every Joule Counts. In the first two years of the six-year framework (2016 is the latest year for which final verified results are available), electricity conservation programs had saved 2.8 TWh of their 7 TWh target.7
Without the ratepayer-funded programs delivered since 2006, Ontario’s 2016 electricity use would have been 7 TWh (5% of provincial consumption) higher (there were additional savings from energy codes and standards and other programs ( Q3)). Savings from ratepayer-funded utility conservation programs are illustrated in Figure 19.2.

Electricity conservation programs benefit participants.
308
Q19 What is the value of conservation?
Making Connections: Straight Talk About Electricity in Ontario
Figure 19.2. Persistent electricity savings from IESO/LDC conservation programs, 2006-2016.
Note: this figure tracks persistent savings from IESO-LDC delivered conservation programs only, and not savings from other policies and initiatives that lead to electricity savings, which we talk about in more detail in
Source: Independent Electricity System Operator, information provided in response to ECO inquiry (31 January 2018).
Q3 of this report.
The 2017 LTEP reaffirms the government’s commitment to meet the 2032 conservation target. Though the province has not made any specific commitments beyond the 2020 end date of the current conservation framework, the LTEP emphasizes the importance of reducing electricity consumption through conservation programs in the early to mid 2020s. By that time, the province’s supply will decrease because of nuclear refurbishments, and demand should increase because of electrification of fossil fuel uses ( Q15).8
The value of conservation for participating customersElectricity conservation programs benefit participants. They save money because they become more energy efficient. Current programs offer a mixture of financial incentives and technical assistance, and programs
are offered to all sectors. Conservation programs targeting low-income customers and on-reserve First Nations provide proportionally more financial support to participants, while large industrial customers often require higher program budgets to support study and implementation of complex energy efficiency projects that bring about large savings.
Conservation programs are offered to low-income customers and First Nations communities at little or no cost to participants, and deliver other benefits. In addition to reducing electricity bills, conservation programs provide other societal benefits such as better bill arrears management, more comfortable
0
1
2
3
4
5
6
7
8
2006 2007 2008 2009 2010 2011 2012 2013 2014 2015 2016
Pers
isten
t net
ene
rgy
savin
gs (T
Wh)
Year
The electricity system as a whole benefits from conservation much of the year.
309Environmental Commissioner of Ontario 2018 Energy Conservation Progress Report, Volume One
Q19What is the value of conservation?
•
living conditions and improved health and safety for residents. Many homes in vulnerable communities are electrically heated. The benefits from improved thermal comfort, and reduction in heat- and cold-related and financial stress can be significant for conservation measures targeting the building envelope or heating or cooling systems.9
In August 2017, the Minister of Energy issued a direction to the IESO to redesign, fund and centrally deliver the Home Assistance Program in order to enhance the program and ensure province-wide access.10 First Nations conservation programs have a similar societal impact on residents. Hydro One, which has the province’s largest share of on-reserve First Nations customers, has enrolled close to 3,500 homes in its First Nations Conservation Program. According to the latest LTEP, existing First Nations and Metis conservation programs will be reviewed with the objective of better aligning programs with community needs and interests.
The value of conservation to the electricity systemThe electricity system as a whole benefits from conservation much of the year.
First, conservation reduces the use of existing generation. This is especially valuable at times of higher demand, when it avoids dispatching higher cost (and frequently GHG emitting) electricity generation, or allows waterpower to be saved for use at peak. This saves the operational and fuel cost and emissions of the electricity that did not get generated because of conservation. The primary benefit occurs from avoiding the need to run a peaking gas generator plant with its considerable fuel costs and emissions.
• Much more gas-fired generation would have been needed in 2016 and 2017 if not for the 7 TWh accomplishments of conservation efforts in previous years.
• There were further opportunities for conservation to directly reduce the use of gas-fired generation in approximately 17% of the hours in 2017.12
• In another 25% of the hours, conservation could have replaced peaking hydro generation.13 This also has value, as much of this peaking hydro could otherwise have been stored and used at times of high demand to reduce the use of gas-fired generation.
• Therefore, in 17-42% of the hours in 2017, additional conservation could have directly reduced fuel and operating costs and GHG emissions.
Because conservation measures put in place today will save electricity for many years, they may also reduce the need for capital investments in new generation, transmission or distribution assets, especially if the reductions occur at times of higher demand.
Even though Ontario does not immediately need new electricity generation today, most conservation programs’ savings persist for years. Today’s programs will therefore help delay or eliminate the need to build new supply in the coming years. Conservation measures with longer lifespans have a higher value since they contribute longer to defer expensive asset upgrades.
Per unit of electricity produced (or saved), conservation is cheaper than any form of new generation, as presented in Figure 19.3.

Conservation when peaking gas generation is running yields financial, air quality and environmental benefits for the province.
310
Q19 What is the value of conservation?
Making Connections: Straight Talk About Electricity in Ontario
Figure 19.3. Minimum cost estimates of new electricity generation in Ontario, 2016.
Source: Independent Electricity System Operator, information provided in response to ECO inquiry (31 January 2018).
Currently, the value of conservation savings is assessed through two primary cost-effectiveness tests, the Total Resource Cost (TRC) and the Program Administrator Cost (PAC), which compare the costs and benefits of conservation.14 Most electricity conservation programs have to score greater than 1 in both these tests, to ensure that the programs financially benefit Ontario electricity customers.15
Not all conservation is of equal value. Conservation during times of high demand has a much bigger impact. Both operating costs and the ability to defer new generation are maximized when electricity is saved in hours of high demand. Conservation when peaking gas generation is running yields financial, air quality and environmental benefits for the province.16 There are few, if any, current system benefits from conservation of electricity during off-peak hours, especially when the province is curtailing surplus electricity ( Q16).
The current cost-effectiveness screening does not adequately recognize this important difference. While it does provide a credit for avoiding new generation from electricity savings at time of system peak, it estimates avoided operational costs from electricity savings in all
hours as being of almost identical value.17 The “avoided cost” assumptions being used by the IESO to calculate the cost effectiveness of the province’s suite of conservation programs are outdated, being published in 2014.18 Given that carbon pricing was not part of the energy system at that time, a 15% adder was included in the cost-effectiveness test to account for benefits such as greenhouse gas reductions.19
The IESO recently informed the ECO that the existing avoided cost and their assumptions will be updated as part of the IESO’s Mid-Term Review process. The IESO is currently working on updating those assumptions as current demand/supply conditions and carbon pricing are not accurately reflected in the avoided cost calculations (see textbox “Incorporating greenhouse gas emission reductions in conservation cost-benefit calculations”).20
16
14
12
12
8
8
8
7
2
0 2 4 6 8 10 12 14 16 18
Bioenergy
Solar
New Nuclear
Hydroelectricity
Nuclear refurbishment
Combined heat and power
Natural gas
Wind
Conservation
Estimated minimum cost of new generation (cents/kWh)
Sour
ce o
f gen
erat
ion
311Environmental Commissioner of Ontario 2018 Energy Conservation Progress Report, Volume One
Q19What is the value of conservation?
Incorporating greenhouse gas emission reductions in conservation cost-benefit calculations
Under the 2015-2020 Conservation First Framework (CFF), an additional 15% adder is included as part of the societal benefits of conservation in cost-effectiveness testing to account for non-energy benefits such as greenhouse gas (GHG) emission reductions.21 This is intended as a surrogate for the environmental, economic and social benefits of conservation, but is not very accurate. This adder is currently being reviewed by the IESO as part of the mid-term review process.22
A more accurate way of quantifying and valuing GHG emissions reductions from conservation will be needed as the province moves towards major electrification as part of its climate change goals. Two possible tools are presented below. It appears that the IESO will be using a variation of option 1 as it updates its values for the costs and benefits of conservation.
Option 1. Calculating GHG emissions at the margin with a carbon price adder
As explained earlier, conservation programs should focus on reducing consumption during periods of high demand. This is when Ontario turns to gas peaking plants to meet that demand and thereby increases GHG emissions. Cost-effectiveness calculations will more accurately value conservation programs at times of high demand if the cost-effectiveness calculation includes a carbon price adder.23 The adder would quantify the economic benefit for emissions reductions based on the type of electricity generation at the margin (which would be turned off in the event of conservation).24 The Atmospheric Fund (TAF) presented this methodology
in 2017 to calculate carbon emissions from marginal electricity emissions factors versus the average electricity emissions factors.25 Using average factors tend to overstate the emissions reductions in hours of low demand and understate those in hours of low demand since savings from all hours are considered the same. According to their analysis, accurately calculating carbon emissions is critical in identifying which conservation programs are more effective in helping the province to meet its climate change goals.
To convert emissions reductions to an economic value, this approach requires an estimate for the cost of carbon (whether based on an estimated market price under cap and trade or a societal cost) that goes out many years into the future, because a conservation measure will deliver savings for many years after implemented.26
Option 2. Starting with a “zero emissions energy alternative”
Another way of ensuring that the benefits of GHG emission reductions are accurately valued is to compare the cost of conservation with a “zero emissions energy alternative,” to account for the province’s climate change goals, which should rule out greater use of gas-fired generation. This path was taken by British Columbia in 2012. Instead of comparing the cost of conservation to the cost of natural gas-fired generation (which was much lower), the province compared conservation to the zero emissions generation source, which was hydroelectric (and much more expensive than gas-fired generation). This change led to a jump in the value of conservation and to more program availability.27 For Ontario, zero emissions energy alternatives to consider could be the cost of building and operating a new nuclear plant or more wind and solar farms.

The current suite of electricity conservation programs fails to focus conservation during hours of high demand, when it is needed the most.
312
Q19 What is the value of conservation?
Making Connections: Straight Talk About Electricity in Ontario
Cost-effectiveness testing influences what programs make it to market and are offered to customers. The result is that the current suite of electricity conservation programs fails to focus conservation during hours of high demand, when it is needed the most.
Figure 19.4 presents the proportion of electricity savings that occur from province-wide electricity conservation programs during three distinct summer and winter periods (peak, mid-peak and off-peak) and two shoulder season (spring and fall) periods (mid-peak and off-peak).28 These peak periods include not just the few hours annually when the system is at overall peak demand, but a larger number of hours when demand is high (e.g. the summer peak period is 1 p.m. to 7 p.m. on weekdays in June, July, and August).
Figure 19.4. 2016 SaveONenergy Programs load profile across peak and off-peak periods.
Source: Independent Electricity System Operator, information provided in response to ECO inquiry (12 January 2018).
0%
5%
10%
15%
20%
25%
30%
35%
40%
45%
50%
WinterPeak
WinterMid-Peak
WinterOff Peak
SummerPeak
SummerMid-Peak
SummerOff Peak
ShoulderMid-Peak
ShoulderOff Peak
Load
pro
file,
% o
f ann
ual e
lect
ricity
sav
ings
Peak and Off-Peak Periods
Coupons Heating and CoolingResidential New Construction Home Assistance ProgramRetrofit Small Business Lighting
Audit Funding Existing Bldg CommissioningHigh Performance New Construction Energy ManagerProcess System & Upgrade

313Environmental Commissioner of Ontario 2018 Energy Conservation Progress Report, Volume One
Q19What is the value of conservation?
In the next decade, electricity conservation programs will be essential to temper the increase in demand and to keep costs and emissions low.
Only a few of the current programs, such as the SaveONenergy Existing Building Commissioning Initiative, the Audit Funding Initiative and the High Performance New Construction, have a high proportion of savings during summer peak hours (44, 22 and 16% respectively). Most of the province’s programs deliver electricity savings relatively evenly throughout the year. Therefore, conservation programs should be improved to incent electricity savings primarily during hours of high demand.
Conservation will be more valuable in a high-electrification future
Q15 of this report emphasizes the importance of this province moving towards conservation and electrification of transportation and heating to meet its climate change obligations. In the early 2020s, electrification should increase demand just as the province’s surplus generation dwindles because of nuclear refurbishments and shutdowns, and just as natural gas-fired generation grows ( Q17). In the next decade, electricity conservation programs will be essential to temper the increase in demand and to keep costs and emissions low. Conservation’s importance will only grow later in the decade. Most conservation measures installed now will still be saving electricity in 2030, by which time Ontario must have dramatically reduced its reliance on fossil fuels.
The need for a continuous culture of conservation
Another reason for continuing conservation programs now, even though Ontario has surplus electricity in some hours, is that consistency is key to ensure that Ontarians have sufficient conservation when we need it.29
The province has made fostering a culture of conservation, for both electricity and gas, a priority. The infrastructure and expertise to deliver conservation has been built up over a decade. Technologies (e.g., software tools to track and report electricity savings) and human resources (conservation staff including specialized roles like energy managers and trained channel partners) take years to build and cannot be easily cancelled or turned on and off without consequence. This also includes customer education to ensure customers are aware of conservation programs.
As a result, electricity conservation results have increased greatly since 2011, as presented in Figure 19.5. Part of this is likely due to program staff improving competence and effectiveness and developing relationships with customers and channel partners over time, with savings coming to fruition in recent years. As a related point, the unit cost of delivering conservation was lower in 2016 than in previous years.

314
Q19 What is the value of conservation?
Making Connections: Straight Talk About Electricity in Ontario
Figure 19.5. First year energy savings from electricity conservation programs 2011-2016.
Source: Independent Electricity System Operator, information provided in response to ECO inquiry (12 January 2018); Independent Electricity System Operator, 2015 Conservation Results Report (Toronto: IESO, 2016) at 8; “Annual Conservation Results for 2016”, online: Independent Electricity System Operator <www.ieso.ca/power-data/conservation-overview/conservation-reports>. [Accessed 12 March 2018]
Over time, utilities have also grown better at delivering innovative programs. As of early 2017, LDCs had run or were running 12 local/regional conservation programs and close to 20 conservation pilots.30 The IESO’s Conservation Fund has funded over 200 innovative energy projects since 2005, with five projects running in 2015 and another 10 approved in 2016.31
Is more electricity conservation possible?
As noted, Ontario already has a target to reduce electricity conservation by 30 TWh by 2032 (20% of Ontario’s electricity consumption in 2016). If we want more conservation, can we get it?
Achievable potential studies (APS) are one way to assess how much electricity use conservation programs can reduce. These studies consider elements such as:
• what conservation programs are currently available
• current budget of the framework
• how customers are reacting to these programs (participation rates)
0
200
400
600
800
1000
1200
1400
1600
2011 2012 2013 2014 2015 2016
Firs
t Yea
r Con
serv
atio
n Sa
ving
s (G
Wh)
Year

315Environmental Commissioner of Ontario 2018 Energy Conservation Progress Report, Volume One
Q19What is the value of conservation?
• financial incentives to encourage participation
• determination of energy efficiency measures and associated measure consumption data
• costs and savings for residential, commercial and industrial sectors
• similar activities happening in other jurisdictions.
This produces a range of results of how much or how much more conservation can be achieved.
Unsurprisingly, the “potential” for conservation that these studies predict depend heavily on the constraints applied to them in advance. A study which places a budget limit or requires programs to be “cost-effective” in certain ways will predict a much smaller conservation potential than a study of all conservation programs that are technically feasible.32
In 2016, the IESO released two separate studies on the short-term potential (until 2020) and the long-term potential (until 2035) of conservation. The longer-term study found that conservation programs could save from 17 TWh (roughly 12% of 2016 Ontario electricity use) to 79 TWh (55% of 2016 electricity use), depending on the assumptions used.33 The lowest number assumes the current budget and rates of program participation, the highest estimate represents capturing 100% of the technical potential with no economic constraints. A realistic number is almost certainly somewhere in-between. For example, if 100% of Ontario’s customers participated in “cost effective” conservation, the province has the potential to save 45 TWh.34 While removing constraints increases the estimated amount of electricity that can be reduced in the province using electricity conservation programs, the estimated costs to design and deliver these programs also increase.35
In a high-electrification future, the achievable potential for electricity conservation will be higher than it is today. More conservation actions will be cost-effective, and there will also be new opportunities – for example, building conversions from natural gas to electric heating should be accompanied by energy conservation improvements to the building envelope such as insulation, as well as high-efficiency forms of electric heating such as air source or geothermal heat pumps.36 With low-carbon electrification, electricity conservation will be important to limit new electricity loads, but how much potential there is needs more analysis.37
The IESO will now be working with the Ontario Energy Board on the 2019 APS that integrates electricity and natural gas conservation potentials. This APS will identify and quantify (for both fuel sources) energy savings, GHG emission reductions and associated costs for 2019-2038, bringing the potential studies more in line with the province’s climate change goals. The study is expected to be completed by June 2019.

316
Q19 What is the value of conservation?
Making Connections: Straight Talk About Electricity in Ontario
The mid-term review of conservation programsThe IESO is close to completing a Mid-Term Review of the current 2015-2020 conservation framework. It must present the Mid-Term Review by June 1, 2018 to the Minister of Energy with recommendations on improving the rest of the framework and any post-2020 framework.38
The review is primarily focused on near-term operational elements of the framework that will apply through 2020.39 Some of the key discussions and findings during the consultation stage include:40
• LDCs as a whole are on track to achieve the 7 TWh target
• This framework has lower costs and greater cost-effectiveness than the previous 2011-2014 framework
• Some LDCs/regions are performing better than others. There is a need to shift allocated targets and budgets to ensure customers continue to have access to all programs across the province
• Barriers to improving the programs and/or the framework include the rigidities around existing LDC/IESO relationship and each party’s responsibilities
• Larger customers are looking for greater flexibility in programs to meet their individual requirements, and
• New policies such as the Fair Hydro Plan and the Climate Change Action Plan will have an impact on the conservation framework.41
ECO commentConservation remains valuable to Ontario electricity customers and will also become more important as Ontario electrifies to meet its climate obligations. However, it is wasteful and inefficient to incent conservation at all hours as if they were of equal value.
RECOMMENDATION: Ontario’s utility conservation programs should be focussed on reducing electricity consumption during hours of high demand, when it can directly or indirectly reduce the use of gas-fired generation.
The ECO also puts forward the following parameters to consider as the province and the IESO review the existing framework and begin work on the post-2020 framework:
• The current conservation framework has largely been successful, and the province’s LDCs are well positioned to achieve the current conservation target of 7 TWh by the end of 2020.42 Changes prior to 2020 should be carefully scoped so that they do not overly disrupt the current framework and delivery of existing programs, including conservation projects already in the pipeline.
• Designing a new post-2020 framework should begin now to ensure there is no gap between frameworks, and that conservation programs remain available to customers.
• Cost-effectiveness testing needs to be updated to accurately value greenhouse gas emissions reductions, and to reflect the value of conservation in a future where electricity demand must rise.

Environmental Commissioner of Ontario 2018 Energy Conservation Progress Report, Volume One 317
Q19What is the value of conservation?
• Co-ordination of conservation between gas and electric utilities has always been a challenge, and the launch of the Green Ontario Fund (GreenON) to deliver cap-and-trade funded programs (that must reduce greenhouse gas emissions) brings another actor into the mix. There are risks of duplication of resources, customer confusion, and unclear attribution of results. Ontario should clarify who is the appropriate delivery agent for conservation, ideally with the goal of integrating gas, electricity, and climate into one regulatory framework focussed on improving the customer experience.
• There may also be a role for the private sector to have a larger role in conservation, which could potentially include participation in the Market Renewal Initiative ( Q17) and lower the cost of acquiring conservation savings.

Endnotes
318
Q19 What is the value of conservation?
Making Connections: Straight Talk About Electricity in Ontario
.
.
.
.
.
.
.
.
.
.
.
.
.
.
.
.
.
.
.
.
.
.
Endnotes
1 Independent Electricity System Operator, 2016 Conservation Results Report (Toronto: IESO, January 2018) at 11.
2 For more information on the progress of cap and trade programs in Ontario, see: Environmental Commissioner of Ontario, Ontario’s Climate Act, From Plan to Progress, Annual Greenhouse Gas Progress Report 2017 (Toronto: ECO, January 2018.
3 For a full breakdown of electricity conservation spending by type in 2015, see: Environmental Commissioner of Ontario, Every Joule Counts, Ontario’s Energy Use and Conservation Year in Review, Annual Energy Conservation Progress Report (Toronto: ECO, August 2017) at 96.
4 Independent Electricity System Operator, information provided in response to ECO inquiry (12 January 2018).
5 Environmental Commissioner of Ontario, Every Joule Counts, Ontario’s Energy Use and Conservation Year in Review, Annual Energy Conservation Progress Report (Toronto: ECO, August 2017) at 95.
6 There is also a separate target of 1.7 TWh through 2020, and an associated budget, for a conservation program (Industrial Accelerator) delivered by the IESO for larger customers connected to the transmission grid (“Industrial Accelerator Program”, online: Independent Electricity System Operator <www.ieso.ca/sector-participants/energy-efficiency-for-large-consumers/industrial-accelerator-program>. [Accessed 12 March 2018]).
7 “Annual Conservation Results for 2016”, online: Independent Electricity System Operator <www.ieso.ca/power-data/conservation-overview/conservation-reports>. [Accessed 12 March 2018]. February 2018 SAC meeting: As of January 15, 2018, preliminary results show that the province has achieved 3.85 TWh of its 7 TWh target.
8 Ontario Ministry of Energy, Ontario’s Long-Term Energy Plan 2017, Delivering Fairness and Choice (Toronto: Queen’s Printer, October 2017) at 37.
9 DNV-GL, “IESO Non-Energy Impacts 2016 Results and Next Steps” (presentation at IESO Mid-Term Review Working Group meeting, October 2017), slide 29 <www.ieso.ca/-/media/files/ieso/document-library/engage/cf/cf-20171019-nei-results.pdf?la=en>. [Accessed 12 March 2018]
10 “Home Assistance Program and Green Ontario Fund Direction from Minister”, online: Independent Electricity System Operator <www.ieso.ca/en/sector-participants/conservation-delivery-and-tools/conservation-e-blasts/2017/08/home-assistance-program-and-green-ontario-fund-direction-from-minister>. [Accessed 12 March 2018]
11 “First Nations Conservation Program”, online: Hydro One <www.hydroone.com/saving-money-and-energy/residential/first-nations-conservation-program>. [Accessed 12 March 2018]; Hydro One’s FCP took over from the OPA’s Aboriginal Conservation Program after 2015. 3000 of Hydro One’s 3,400 participants were from the previous program (Ministry of Energy, information provided in response to ECO inquiry (13 March 2018)).
12 2017 data is until November 30 of that year (Independent Electricity System Operator, information provided in response to ECO inquiry (31 January 2018)).
13 Independent Electricity System Operator, information provided in response to ECO inquiry (31 January 2018).
14 The costs of conservation are the administration costs, the cost of customer incentives and/or the incremental cost of more efficient technology, depending on the specific test. The province’s provincial, regional and local programs have to pass the Total Resource Cost (TRC) test and the Program Administrator Cost (PAC) test before being delivered (except for programs geared towards low-income customers and First Nations communities). The Total Resource Cost is defined by the IESO as costs incurred to design and deliver programs and customers’ costs with the avoided electricity and other supply-side resource costs (generation, transmission, natural gas etc.). The Program Administrator Cost test, on the other hand, compares the costs incurred to design and deliver programs by the program administrator with avoided electricity supply-side resource costs from the perspective of the program administrator (Independent Electricity System Operator, Conservation and Demand Management Energy Efficiency Cost Effectiveness Guide (Toronto: IESO, March 2015) at 10 and 12)).
15 Low Income and Aboriginal conservation programs do not have to be cost-effective. CDM pilots are also not required to be cost-effective.
16 Environmental Commissioner of Ontario, Conservation: Lets Get Serious, Annual Energy Conservation Progress Report 2015/2016 (Toronto: ECO, May 2016) at 116.
17 The IESO’s most recent avoided cost values are several years old, and have very similar values of avoided energy costs across the eight time-of-use periods (Independent Electricity System Operator, Evaluation, Measurement and Verification Protocols and Requirements (Toronto: IESO, 2014) at 58). These avoided costs are the output of an IESO planning analysis which compares the hourly costs of a system mix with and without conservation. However, they do not appear to reflect the fact that the marginal cost of electricity in many off-peak hours is currently near zero. One possibility is that the eight chosen time-of-use periods do not align well with the split between hours when gas is on the margin vs baseload resources such as nuclear or renewables.
18 Independent Electricity System Operator, “Ontario Planning Outlook Module 3: Conservation Outlook (presentation, August 2016), slide 16.
19 For more information see: Environmental Commissioner of Ontario, Every Joule Counts, Ontario’s Energy Use and Conservation Year in Review, Annual Energy Conservation Progress Report 2016/2017 (Volume Two) (Toronto: ECO, August 2017) at 97.
20 Independent Electricity System Operator, information provided in response to ECO inquiry (31 January 2018).
21 Directive from the Ontario Minister of Energy to the Ontario Power Authority, re: Amending March 31, 2014 Direction Regarding 2015-2020 Conservation First Framework (23 October 2014).
22 As part of that review, the IESO retained a consultant who undertook a cross-jurisdictional review of various societal non-energy benefit adders used. The consultant’s scan concluded that the 15% adder may be too conservative as the GHG value alone may be around 15%. (DNV-GL, “IESO Non-Energy Impacts 2016 Results and Next Steps” (presentation at IESO Mid-Term Review Working Group meeting, October 2017), slide 18 <www.ieso.ca/-/media/files/ieso/document-library/engage/cf/cf-20171019-nei-results.pdf?la=en> [Accessed 13 March 2018]). The proposed carbon price of $43 is based off of a Ministry of Environment and Climate Change estimate of the social cost of carbon, which the IESO is currently taking into consideration as cost-effectiveness numbers are being reviewed under the mid-term review (Independent Electricity System Operator, information provided in response to ECO inquiry (1 December 2017); Independent Electricity System Operator, information provided in response to ECO inquiry (12 January 2018)).

319Environmental Commissioner of Ontario 2018 Energy Conservation Progress Report, Volume One
Q19What is the value of conservation?
.
.
.
.
.
.
.
.
.
.
.
.
.
.
.
.
.
.
.
.
.
23 Only natural gas-fired generation and imports have an additional cost of carbon, since the cap and trade regime has been put in place.
24 A methodological challenge is determining what carbon price should be used, given that savings will persist for many years.
25 The Atmospheric Fund, A Clearer View of Ontario’s Emissions: Practical Guidelines for Electricity Emissions Factors (Toronto: TAF, July 2017) at 11.
26 For more information on how to calculate the social cost of carbon, see: Environmental Commissioner of Ontario, Ontario’s Climate Act, From Plan to Progress, Annual Greenhouse Gas Progress Report 2017 (Toronto: ECO, January 2018) at 228 and 251.
27 Katherine Muncaster et al., Adventures in Tweaking the TRC: Experiences from British Columbia (BC: ACEEE, 2012) at 4-5; BC Ministry of Energy and Mines, Electricity and Alternative Energy Division, Guide to the Demand-side Measures Regulation (BC: Ministry of Energy and Mines, July 2014) at 7.
28 IESO’s EM&V Protocols calculate peak hours differently from the OEB’s TOU on-peak bucket. The defined summer and winter peak blocks for 2015-2020 are as follows:
Time Months
SUMMER(Weekdays)
1pm - 7pm*
June
July
August
WINTER(Weekdays)
6pm - 8pm
January
February
March
(Independent Electricity System Operator, Evaluation, Measurement and Verification Protocols and Requirements (Toronto: IESO, 2014) at 84).
29 Environmental Commissioner of Ontario, Conservation: Let’s Get Serious, Annual Energy Conservation Progress Report- 2015/2016 (Toronto: ECO, May 2016) at 117.
30 For a full list of local/regional programs and pilots, see: Environmental Commissioner of Ontario, Every Joule Counts, Ontario’s Energy Use and Conservation Year in Review, Annual Energy Conservation Progress Report 2016/2017 (Volume Two) (Toronto, ECO, August 2017) at 102-103.
31 Ibid at 104-105.
32 To learn more about current cost-effective calculations, see: Ibid at 97.
33 Net Savings and Acquisition Costs of Conservation Potential Scenarios
Conservation Potential Scenarios 2015-2035 Program Net Savings (TWh)
Acquisition Cost ($/MWh)
Achievable Potential- within existing parameters, including constrained budget
17.81 308
Achievable Potential- within existing parameters but no budget constraints
17.91 309
Market Achievable Potential- 100% of incremental program costs are covered
29.05 515
Economic- 100% customer participation for all cost-effective measures
45.57 599
Technical- all technically feasible conservation measures
78.58 18347
The APS does not include potential from behind the meter generation, which was completed in a separate study.
34 Source: Independent Electricity System Operator, Achievable Potential Study: Long Term Analysis by Nexant (Toronto: Nexant, November 2016) at 61 and 81.
35 Ibid.
36 Ibid.
37 Independent Electricity System Operator, “Ontario Planning Outlook Module 3: Conservation Outlook” (presentation, August 2016) slide 21.
38 Ibid slide 22.
39 The ECO participated in the input of this process as an observer in the IESO working group.
40 Some key topics include: • the energy savings target as a whole and individually (which includes
the results of the 2016 Achievable Potential Study discussed earlier in this chapter). It is important to note that the existing Energy Conservation Agreement (ECA) states that the target cannot be increased from the current target of 7 TWh
• overall and individual LDC budgets • exchange of budgets and targets as needed. The IESO has already
been directed to move funding and target from the Industrial Accelerator Program to the LDCs’ provincial target
• individual program performances • lessons learnt on cost recovery and performance incentive mechanisms,
including the calculation of the mid-term incentives for eligible LDCs, and
• alignment with the Climate Change Action Plan.
41 Independent Electricity System Operator, “Discussion Draft: Conservation Framework Mid-Term Review” (presentation, 3 January 2018), online: <www.ieso.ca/-/media/files/ieso/document-library/engage/cf/cf-20180109-presentation-revised.pdf?la=en&hash=91295B03E1014981FBB0CB544E0ED2DEB73F9ED3>. [Accessed 14 March 2018]
42 “Ontario’s Fair Hydro Plan”, online: Government of Ontario <www.ontario.ca/page/ontarios-fair-hydro-plan>. [Accessed 14 March 2018]; “Climate Change Action Plan”, online: Government of Ontario <www.ontario.ca/page/climate-change-action-plan>. [Accessed 14 March 2018]
43 Independent Electricity System Operator, 2016 Conservation Results Report (Toronto: IESO, January 2018) at 1.

320 Making Connections: Straight Talk About Electricity in Ontario
Thanks and Acknowledgements
The Environmental Commissioner would not have been able to produce this report without the invaluable assistance, input and feedback of many individuals and organizations, including those listed below. However, this report represents the views of the ECO and does not imply endorsement from any other individual or organization.
Ontario Government Ministries, Agencies, and Legislative Offices
Environmental Review Tribunal, Financial Accountability Office of Ontario, Independent Electricity System Operator, Ministry of Energy, Ministry of the Environment and Climate Change, Ministry of Health and Long-Term Care, Ministry of Natural Resources and Forestry, Ontario Energy Board, Ontario Financing Authority, Ontario Power Generation, Public Health Ontario
Organizations
AMP Energy, Canadian Association of Physicians for the Environment, Canadian Solar Industries Association, the David Suzuki Foundation, Electricity Distributors Association, Enbridge Gas Distribution, Festival Hydro, FleetCarma, Grasshopper Solar, Greenpeace Canada, International Renewable Energy Agency, MaRs Advanced Energy Center, Northland Power, Nuclear Waste Management Organization, Ontario Clean Air Alliance, Ontario Public Health Association, Ontario Society of Professional Engineers, Pembina Institute, Toronto Hydro, Toronto Public Health
Individuals
Prof. Christine Hoicka, Stephen LeClair, Prof. Warren Mabee, Ken Ogilvie

Acronyms
AQHI Air Quality Health IndexAQI Air Quality IndexCDM conservation and demand managementCNSC Canadian Nuclear Safety CommissionCO2eq carbon dioxide equivalentDR demand responseEA environmental assessmentECO Environmental Commissioner of OntarioEDA Electricity Distributors AssociationERT Environmental Review TribunalEV electric vehicleFAO Financial Accountability Office of OntarioFIT feed-in tariffg gramsGA global adjustmentGEA Green Energy ActGHG greenhouse gasGS generating stationGWP global warming potentialHg mercuryHOEP hourly Ontario electricity priceIESO Independent Electricity System Operatorkg kilograms
LDC local distribution companyLRP Large Renewable ProcurementLTEP Long-Term Energy PlanLUEC levelized unit energy costMNRF Ministry of Natural Resources and ForestryMOECC Ministry of Environment and Climate ChangeMt mega tonne (one million metric tonnes)NEB National Energy BoardNOx nitrogen oxide gasesNUG non-utility generatorO3 ozoneOEB Ontario Energy BoardOPA Ontario Power AuthorityOPG Ontario Power GenerationPM2.5 particulate matter (sized 2.5 microns or less)REA Renewable Energy ApprovalRESOP Renewable Energy Standard Offer ProgramRGGI Regional Greenhouse Gas InitiativeSBG surplus baseload generationSOx sulphur oxide gasesTOU time-of-useTRC total resource cost
Power
kW kilowatt (1,000 watts)MW megawatt (1,000,000 watts)GW gigawatt (1,000,000,000 watts)TW terawatt (1,000,000,000,000 watts)
Energy
kWh (1,000 watt-hours)MWh (1,000,000 watt-hours)GWh (1,000,000,000 watt-hours)TWh (1,000,000,000,000 watt-hours)
kW vs. kWh
A kilowatt (kW) is a measure of power (similar to the speed your car is going). It is also used to describe the potential power of electricity resources (i.e., capacity.)
A kilowatt hour (kWh) is a measure of how much energy you have actually used (or will use). It is similar to the distance your car has travelled.
If you use 5 kW of electricity for 1 hour, you consume 5 kWh of electricity.
321Environmental Commissioner of Ontario 2018 Energy Conservation Progress Report, Volume One

|IS
SN
192
3-22
41 (P
rint)
ISS
N 1
923-
225X
(PD
F)
1075 Bay Street, Suite 605, Toronto, Ontario M5S 2B1
Tel: 416-325-3377 Fax: 416-325-3370 1-800-701-6454
www.eco.on.caDisponible en français