making better spreadsheets
TRANSCRIPT
A B C D E F G H I1
2
3
4
5
6
7
8
9
10
11
12
13
14
15
16
17
18
19
Making better spreadsheets
Why 95% of spreadsheets contain errors,and what we can do about it
www.i-nth.comFebruary 2017
www.i-nth.com
A B C D E F G H I1
2
3
4
5
6
7
8
9
10
11
12
13
14
15
16
17
18
19
Spreadsheets are riddled with errorsTo reduce the risks, our practices must improve
Introduction Stories Why errors happen ConclusionWhat we can do
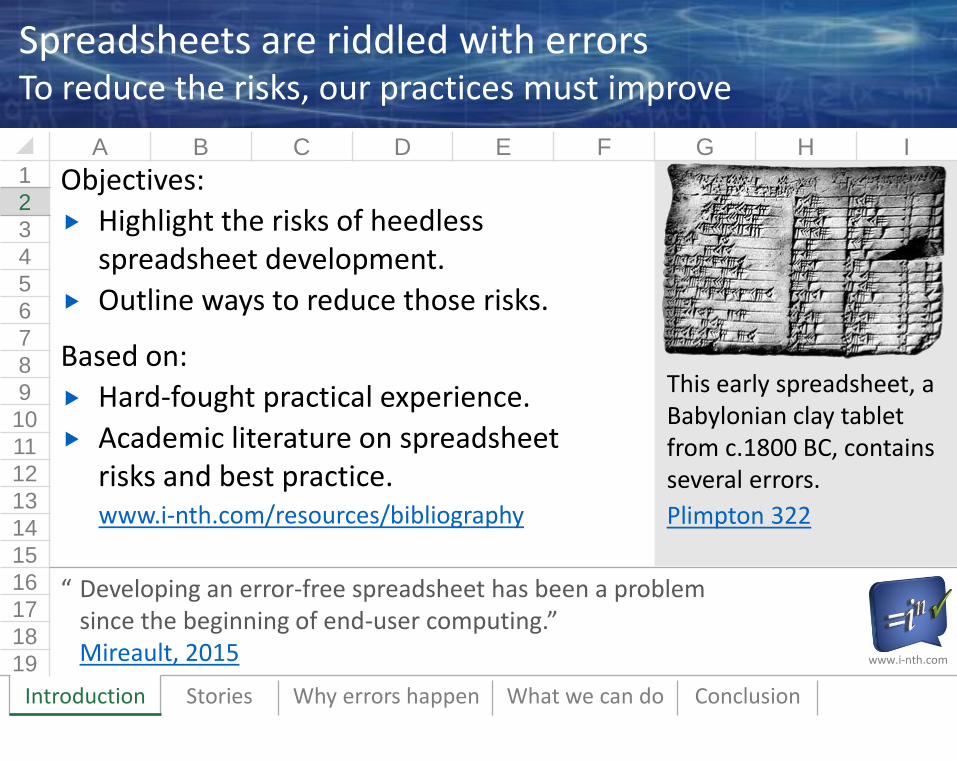
Objectives:
Highlight the risks of heedless spreadsheet development.
Outline ways to reduce those risks.
Based on:
Hard-fought practical experience.
Academic literature on spreadsheet risks and best practice.www.i-nth.com/resources/bibliography
“ Developing an error-free spreadsheet has been a problem since the beginning of end-user computing.” Mireault, 2015 www.i-nth.com
This early spreadsheet, a Babylonian clay tablet from c.1800 BC, contains several errors.
Plimpton 322

A B C D E F G H I1
2
3
4
5
6
7
8
9
10
11
12
13
14
15
16
17
18
19
Spreadsheet risk is real, with substantial impactsThese are actual news stories
Introduction Stories Why errors happen ConclusionWhat we can do
www.i-nth.com
Reinhart, Rogoff, and the Excel error that
changed historyBloomberg, 18 April 2013
$1.5M went missing as staff managed
“monstrous spreadsheets”Metro West Daily News, 15 October 2011
£4.3M spreadsheet error leads to
resignation of Mouchel chief executiveDaily Express, 7 October 2011
Clallam County cashier hides rows in
a spreadsheet to cover up theftPeninsula Daily News, 21 July 2011
$15 million mistake: that representative
doesn't work for the company anymoreTechnology Marketing Corporation, 21 November 2009
Accountant omits minus sign on a net
capital loss of $1.3 billionThe Risks Digest, November 1994
$182M blunder in cashflow forecasting
spreadsheet modelStuff, 1 March 2012
An alarming number of scientific papers
contain Excel errorsWashington Post, 26 August 2016
“ Few incidents of spreadsheet errors are made public and these are usually not revealed by choice.” Kruck & Sheetz, 2001
A B C D E F G H I1
2
3
4
5
6
7
8
9
10
11
12
13
14
15
16
17
18
19
Spreadsheet errors have many causesBut spreadsheets are not to blame – we are
Introduction Stories Why errors happen ConclusionWhat we can do
Why spreadsheet errors happen:
Most of a spreadsheet’s complexity is hidden.
Spreadsheet complexity leads to cognitive overload.
We’re human, so we made mistakes.
Calculations, and errors, cascade from cell to cell.
We’re overconfident, despite complexity & overload.
Management fail to recognise spreadsheet risk.
www.i-nth.com
“ The results given by spreadsheets are often just wrong.” Sajaniemi, 1998

A B C D E F G H I1
2
3
4
5
6
7
8
9
10
11
12
13
14
15
16
17
18
19
Most of a spreadsheet’s complexity is hiddenWe see only one formula and the formatted values
Introduction Stories Why errors happen ConclusionWhat we can do
www.i-nth.com
Consider this simple model:
Looks OK (typically the only assessment we do).
But the formulae in cells F2:F5 exclude column E.
The formula in E6 is also wrong (doesn’t deduct the tax in E5).
The repeated values in Row 5 are suspicious – are some values hard-coded rather than being calculated?
Are the formulae, references, logic, formats, etc. correct?
Even a simple spreadsheet can be wrong in many ways.
“ Even obvious, elementary errors in very simple, clearly documented spreadsheets are... difficult to find.” Galletta et al, 1993

A B C D E F G H I1
2
3
4
5
6
7
8
9
10
11
12
13
14
15
16
17
18
19
Spreadsheet complexity leads to cognitive overloadThe layers of a spreadsheet are hard to understand
Introduction Stories Why errors happen ConclusionWhat we can do
www.i-nth.com
Spreadsheets have multiple layers:
Presentation layer – ie. what you see.
Formulae (one visible at a time).
Logic (Data Formulae Results).
Formatting.
Data types (text, number, date, Boolean).
VBA, charts, PivotTables, Solver, Data Validation, Tables, Slicers, Filters, Queries, Outlines, Protection, Names, Print Range, etc.
Attempting to form a mental model of all the layer interactions can produce cognitive overload, which makes errors more likely.
“ Spreadsheets are often hard, if not impossible, to understand.” Mireault & Gresham, 2015
A B C D E F G H I1
2
3
4
5
6
7
8
9
10
11
12
13
14
15
16
17
18
19
We’re human, so we make mistakesTypical spreadsheets have errors in 1% to 5% of cells
Introduction Stories Why errors happen ConclusionWhat we can do
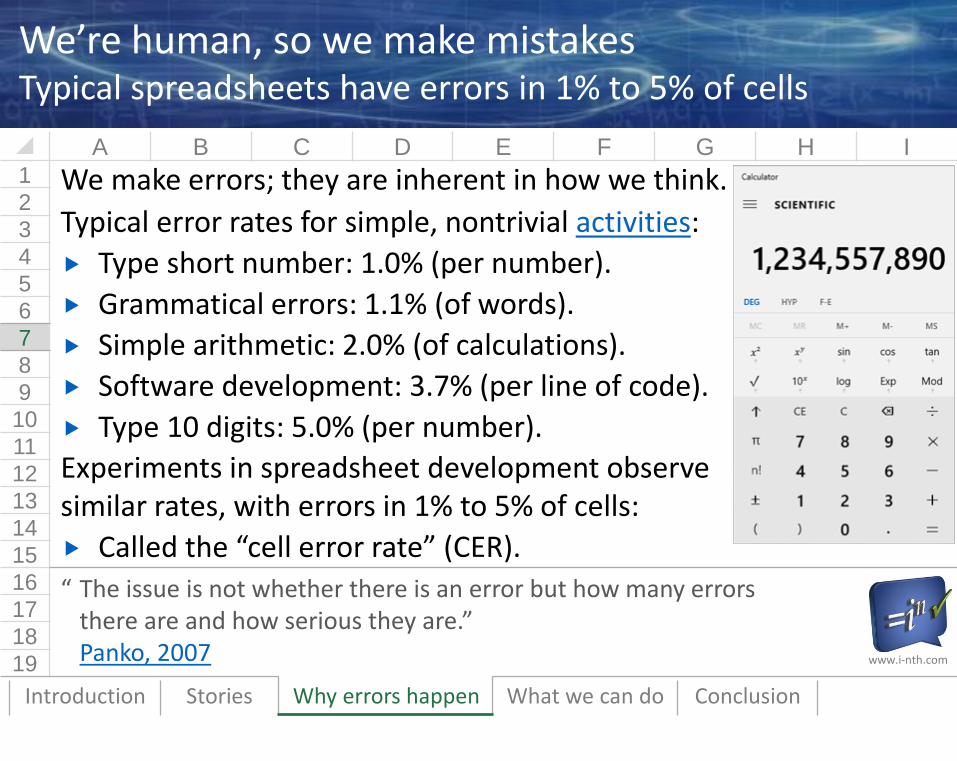
We make errors; they are inherent in how we think.
Typical error rates for simple, nontrivial activities:
Type short number: 1.0% (per number).
Grammatical errors: 1.1% (of words).
Simple arithmetic: 2.0% (of calculations).
Software development: 3.7% (per line of code).
Type 10 digits: 5.0% (per number).
www.i-nth.com
Experiments in spreadsheet development observe similar rates, with errors in 1% to 5% of cells:
Called the “cell error rate” (CER).
“ The issue is not whether there is an error but how many errors there are and how serious they are.” Panko, 2007
A B C D E F G H I1
2
3
4
5
6
7
8
9
10
11
12
13
14
15
16
17
18
19
Calculations, and errors, cascade from cell to cell95% probability of error overall for just 100 cells and 3% CER
Introduction Stories Why errors happen ConclusionWhat we can do
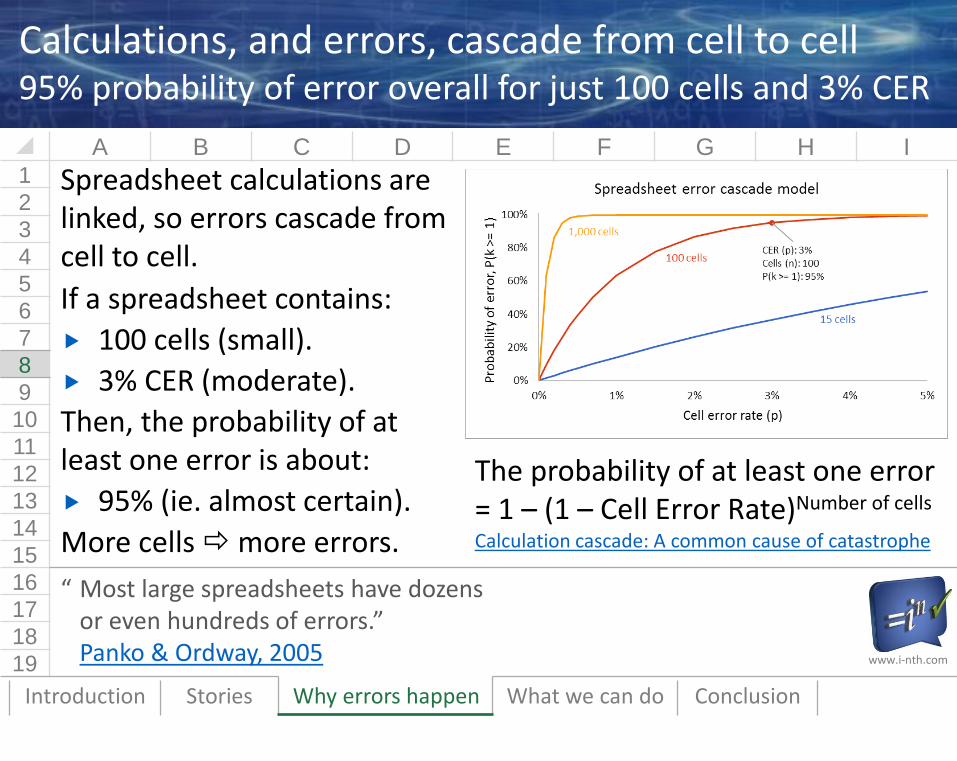
Spreadsheet calculations are linked, so errors cascade from cell to cell.
If a spreadsheet contains:
100 cells (small).
3% CER (moderate).
Then, the probability of at least one error is about:
95% (ie. almost certain).
More cells more errors.
www.i-nth.com
“ Most large spreadsheets have dozens or even hundreds of errors.” Panko & Ordway, 2005
The probability of at least one error= 1 – (1 – Cell Error Rate)Number of cells
Calculation cascade: A common cause of catastrophe

A B C D E F G H I1
2
3
4
5
6
7
8
9
10
11
12
13
14
15
16
17
18
19
We’re overconfident, despite complexity & overloadIgnorance of the risk reinforces our overconfidence
Introduction Stories Why errors happen ConclusionWhat we can do
Our typical approach to spreadsheets creates a vicious cycle:
We underestimate the incidence of spreadsheet errors.
If a spreadsheet produces a result, we assume it is correct.
We see little need to test our spreadsheets.
So we do little or no testing of our spreadsheets.
Consequently, we find few errors.
When we find an error, our inflated perception of our error-finding prowess is reinforced.
With little evidence to the contrary, we are overconfident that our spreadsheets are correct.
www.i-nth.com
“ Overconfidence is one of the most substantial causes of spreadsheet errors.” Sakal et al, 2015

A B C D E F G H I1
2
3
4
5
6
7
8
9
10
11
12
13
14
15
16
17
18
19
Management fail to recognise spreadsheet riskLeading to inadequate training and insufficient oversight
Introduction Stories Why errors happen ConclusionWhat we can do
Managers underestimate the risks of spreadsheets:
It is “just a spreadsheet”.
But actually, spreadsheets can be highly complex analytical applications that are an essential part of decision making.
Because spreadsheet risk is not well understood, managers:
Provide inadequate training, focusing only on software features rather than on good development practices and quality.
Perform insufficient oversight, mistaking proficiency with the tools for robustness of results.
Poor spreadsheet quality leads to poor decision making.
www.i-nth.com
“ Despite overwhelming and unanimous evidence...companies have continued to ignore spreadsheet error risks.” Panko, 2014

A B C D E F G H I1
2
3
4
5
6
7
8
9
10
11
12
13
14
15
16
17
18
19
What we can doThe solutions are well understood, but not well used
Introduction Stories ConclusionWhat we can do
www.i-nth.com
Why errors happen
The prescription for reducing spreadsheet errors is clear:
Learn from our software development colleagues.
Spreadsheet users need to recognise the risk.
Managers need to recognise the risk.
Control development lifecycle of critical spreadsheets.
Adopt good development practices to reduce risk.
Enhance spreadsheet training to focus on quality.
Test, test, test.
“ The software that end users are creating…is riddled with errors.” Burnett & Myers, 2014
A B C D E F G H I1
2
3
4
5
6
7
8
9
10
11
12
13
14
15
16
17
18
19
Learn from our software development colleaguesSpreadsheet development = Software development
Introduction Stories ConclusionWhat we can do
In software development:
Typically 40% to 60% of total time is devoted to testing.
Initial average error rate: 3.7% (per line of code).
Extensive testing reduces errors by 90%, but some bugs remain.
Building a spreadsheet is equivalent to writing software:
Spreadsheet formulae are like program code.
Software development issues of bugs, data integrity, version control, error handling, and testing also apply to spreadsheets.
We wouldn’t accept software built like we build spreadsheets.
www.i-nth.com
Why errors happen
“ The untested spreadsheet is as dangerous and untrustworthy as an untested program.” Price, 2006

A B C D E F G H I1
2
3
4
5
6
7
8
9
10
11
12
13
14
15
16
17
18
19
Spreadsheet users need to recognise the riskAdopt a professional approach to spreadsheet development
Introduction Stories ConclusionWhat we can do
Spreadsheet users need to:
Recognise that spreadsheet error is a real and substantial risk.
Acknowledge and seek to mitigate the effects of overconfidence.
Seek knowledge that goes beyond just the software features.
Learn and apply good development practices.
Recognise and manage factors that increase risk, such as poor development practices and excessive complexity.
Test spreadsheets before releasing them for use.
www.i-nth.com
Why errors happen
“ Never assume a spreadsheet is right,even your own.” Raffensperger, 2001

A B C D E F G H I1
2
3
4
5
6
7
8
9
10
11
12
13
14
15
16
17
18
19
Managers need to recognise the riskSpreadsheet quality requires management action
Introduction Stories ConclusionWhat we can do
Managers need to:
Recognise that spreadsheet error is a real and substantial risk.
Recognise and mitigate the hazard created by overconfidence.
Provide appropriate training for spreadsheet users.
Insist on good development practices.
Recognise and manage factors that increase risk, such as tight deadlines and inadequate processes.
Ensure that spreadsheets are properly tested before being used.
www.i-nth.com
Why errors happen
“ Most executives do not really check or verify the accuracy or validity of the spreadsheets before they use the solutions.” Teo & Tan, 1999

A B C D E F G H I1
2
3
4
5
6
7
8
9
10
11
12
13
14
15
16
17
18
19
Control development lifecycle of critical spreadsheetsFormalise management and control where appropriate
Introduction Stories ConclusionWhat we can do
Spreadsheets generally go through a lifecycle:
Planning Analysis Design Construction Testing Implementation Archive.
Often the emphasis is almost exclusively on the Construction phase, with insufficient time spent in other phases (especially testing).
For most spreadsheets, informal management of the lifecycle, with minimal control, is sufficient.
www.i-nth.com
Why errors happen
“ The principal objective of a structured and disciplined methodology… is to reduce the occurrence of user-generated errors in the models.” Rajalingham et al, 2002
For critical spreadsheets, more formal management and control of the lifecycle may be appropriate – just like for other software.

A B C D E F G H I1
2
3
4
5
6
7
8
9
10
11
12
13
14
15
16
17
18
19
Adopt good development practices to reduce riskMake spreadsheets easier to use, understand, and test
Introduction Stories ConclusionWhat we can do
Spreadsheets are very flexible – that is part of their appeal.
But they are often hard to use, harder to maintain, and have errors.
To minimise risk, adopt good practices such as:
www.i-nth.com
Why errors happen
“ Most practitioners would agree on the basic aims of best practice, as being to make understanding and testing reasonably straightforward.” Murphy, 2007
Include documentation.
Separate data, analysis, and results.
Use consistent structure.
Use short formulae.
Avoid hard-coded values in formulae.
Include self-checks.
Use formatting for a purpose, not decoration.
Setup printing for each sheet.
Use cell protection.
Use Data Validation & Tables.
Always test your spreadsheet.

A B C D E F G H I1
2
3
4
5
6
7
8
9
10
11
12
13
14
15
16
17
18
19
Enhance spreadsheet training to focus on qualityLearn about good practice and mitigating risks
Introduction Stories ConclusionWhat we can do
Most training is about features – eg. how to build a PivotTable.
While such training is necessary, it is not sufficient.
We also need to learn about building good spreadsheets:
Principles of spreadsheet design, including techniques for building robust and reliable spreadsheets.
Being aware of risks and how to mitigate those risks.
Recognising and managing overconfidence.
Methods for testing spreadsheets.
Understanding and using the spreadsheet development life cycle.
www.i-nth.com
Why errors happen
“ Training specifically aimed at teaching spreadsheet design principles… can significantly help to reduce the incidence of spreadsheet errors.” Beaman et al, 2005
A B C D E F G H I1
2
3
4
5
6
7
8
9
10
11
12
13
14
15
16
17
18
19
Test, test, testThere is no substitute for inspecting every cell
Introduction Stories ConclusionWhat we can do
Extensive spreadsheet testing is essential:
Recognise that spreadsheets are like any other software; that is, they contain bugs and need to be tested.
Testing is a formal process, requiring training and practice.
Inspect every cell and object (chart, PivotTable, etc.).
Best done in teams, as different people find different errors.
Testing will find errors, which can be fed back into the development and training process to improve future quality.
As suggested by the Spreadsheet Development Life Cycle, testing typically requires as much time and effort as construction.
www.i-nth.com
Why errors happen
“ To reduce spreadsheet errors... only one technique, cell-by-cell code inspection, has been demonstrated to be effective.” Panko, 2000

A B C D E F G H I1
2
3
4
5
6
7
8
9
10
11
12
13
14
15
16
17
18
19
We know how to make better spreadsheetsImprove our spreadsheets and make better decisions
Introduction Stories Why errors happen ConclusionWhat we can do
The problem:
Spreadsheet quality is poor: 95% contain errors.
The solution:
Recognise that spreadsheet errors are a problem.
Reduce overconfidence through awareness.
Better control of critical spreadsheets.
Use good spreadsheet development practices.
Training to focus on quality.
Greatly increase the amount of testing that we do.
www.i-nth.com
“ Good software (this applies to spreadsheets as well) does not happen by chance, but is engineered/designed.”Sakal et al, 2014
Reinforce better practice through feedback