making appropriate use of fdm information · fdm shows the height where final land flap is set for...
TRANSCRIPT

Making Appropriate Use of
FDM Information
Eddie Rogan
Sales and Marketing Director

2
Traditional FDM Limitations
Extended use of FDM
BA Examples
UKCAA Research for EGPWS
An Integrated SMS Approach for FDM
Any lessons to be learned from Fixed Wing FDM Use?

3
Typical FDM AnalysisFlight Data Simulations (FDS)
Flight Data Traces (FDT)
Flight Data Events (FDE)
4
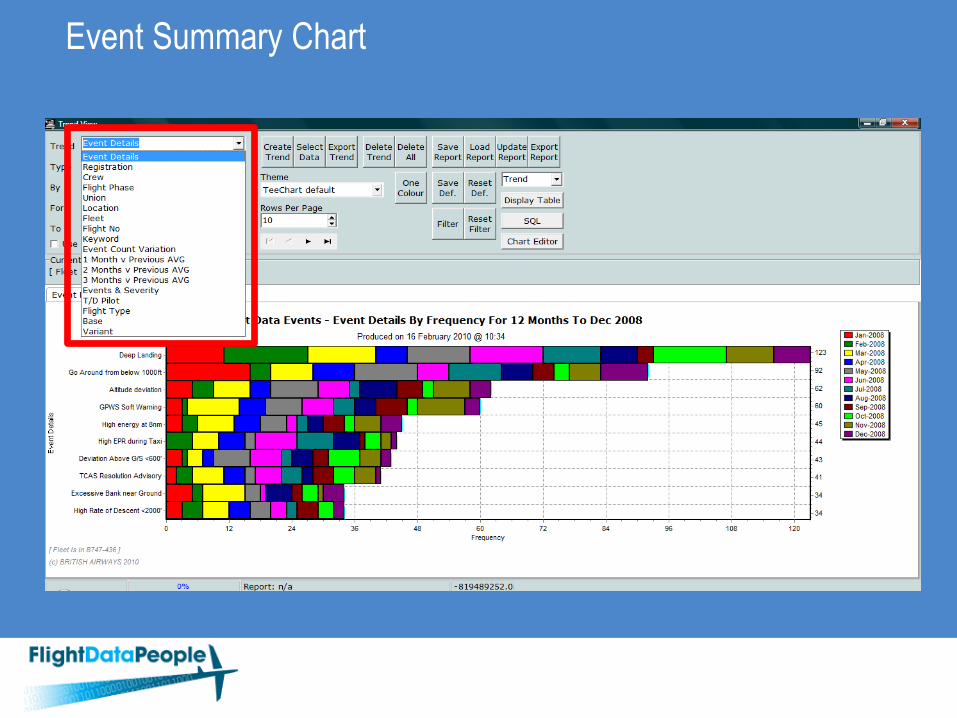
Event Summary Chart

5
Drill-Down on Deep Landing Events (Filter)

Drill-down Capability
Flight Data Traces
Flight Data Events Trends

7
FDS Instrument Animation

8
Reactive – you don’t know what you don’t know
Analysis based on pre-configured Events
Event trends identified manually
Safety analysts need to manually sift through trend charts
Historic Flight data often not kept
Data associated with event often kept but data for historic flights are deleted
Analysis of historic date often not possible
Traditional FDM Limitations

9
NOT Event driven!
Derived parameters (Measurements) recorded for all flights stored
Statistical analysis on historic flights
Analysis based on measurements during all flights
Flight Data Measurements
Flight Data Events (FDE) keeps a record of those occasions when aircraft are flown outside of accepted limits, but it
keeps no record of the majority of flights in which no infringement occurs.
Example: For an event that is triggered when the aircraft is flying at greater than 200 knots within 90 seconds of
touchdown. A more valued judgement on the significance of the number of events triggered could be made if a record
of the speed at 90 seconds to touchdown for 10,000 flights on that fleet. Statistical analysis could support conclusions
on what was happening on average as well as in the extreme.
10
Flight Data Measurements – Used by British Airways
Safety Investigations
Management of change – before/after metrics
ATQP (data driven)
Fuel Efficiency
Emissions Trading
Airport and ATC procedures
Engine and Airframe Manufacturers
CAA’s
What is “the normal operation”?
Extended use of FDM

11
Flight Data Measurements (FDM) – Fixed Wing Examples
Shorthaul Airbus fleet. Height land Flap set: LHR v rest of the network
The flow rate at Heathrow requires aircraft to maintain 160kts to 4 DME. The effect of this is a higher probability of late final
configuration than at other destinations. FDM shows the height where final land flap is set for all A319/320/321 sectors, comparing
LHR arrivals with non-LHR arrivals.

12
Boeing 777 fleet. Landing g and flare times
A scatter graph was produced to depict normal acceleration (g at landing) for the B777 fleet with an additional measure of flare
time (at BA this is ‘seconds from 25 ft to touchdown’). This analysis suggests that a short flare time need not necessarily lead
to a firm landing, but a firm landing is usually accompanied by a shorter than average flare.
Flight Data Measurements (FDM)
Alert Level

13
All fleets. Landing distance at HKG/25
A recent deep landing at HKG/25R was followed by with some analysis to determine how much of an outlier this
particular event was, based on all landings at this destination over a given time period. FDM was used to produce a
scatter graph overlaid on a google earth image which was subsequently used in an internal safety publication. Note
the red dots are displaced from the runway centreline simply to visualise the runway markings.
Flight Data Measurements (FDM)
Alert Level

14
Flight Data MAXVALS (FDM)
Boeing 777 fleet. Height land Flap set: LGW/08
Gatwick was highlighted as an area of concern with respect to achieving BA’s stabilised approach policy, notably landing config
on runway 08R. This FDM bar chart clearly illustrates that in the most recent 24 month period, crews are now achieving final
land flap at an earlier height than in the previous period, and an improvement in our unstable approach figures at this
destination has resulted.

15
• UK offshore helicopters have a basic form of TAWS (Automatic Voice Alerting Device –
AVAD).
• Only adequately addresses one accident scenario – slow inadvertent drift down (e.g.
Scilly Isles 1983).
• Bristows Helicopter’s Eurocopter EC225 FDM data or 800 flights used in study.
• Objective to identify improvements to helicopter TAWS to increase warning times
offshore
Rotary Wing Example:
2012 UKCAA Research - TAWS for Offshore Helicopters

Honeywell Helicopter EGPWS Modes

Honeywell Helicopter EGPWS Mode 2A

18
Warning Envelope Re-design (1)
• Bristow Helicopters EC225 Flight Data Monitoring (FDM) data used to characterise normal operations in terms of EGPWS warning parameters.

19
Warning Envelope Re-design (2)
• Statistical presentation of FDM data:
• Envelopes containing 90%, 99% and 99.9% of all flights drawn for 800 flights.
• Any incursion into warning envelope represents nuisance alert rates > 1 in 10, > 1 in 100 and > 1 in 1000 respectively.

20
Warning Envelope Re-design (3)
• FDM data used to identify additional or alternative parameters to define warning envelopes:
• Use ALTRATE parameter (mainly inertial) instead of RALT below 350ft to eliminate deck edge crossing problem.

Warning Envelope Re-design (4)
• Accident data added to establish existing warning time.

Warning Envelope Re-design (5)
• Warning envelope redefined to maximise warning time without encroaching into ‘normal’ operations.

23
Summary of Warning Time Results
• EGPWS is one way to help address the issue of CFIT but another could be to add LOC
and CFIT envelope protection into the autopilot so that it is countered at the precursor
stage.
• Both approaches benefit from analysis of historical data such as Flight Data Measurements
or other “data mining” techniques to define the envelope or to test the hypotheses.

24
An Integrated SMS360 Approach
Safety Incidents
ASR
GSR
MSR
CSR
OSR
Findings
Investigations
Incident
Management
Risk Management
Audits Actions
BAFDA
F
D
E

Thank YouThanks to:
UKCAA for permission to share the analysis in EGPWS FDP-CAA-Report 120201
British Airways for sharing their examples of Flight Data Measurements