major economic developments and outlooks - bank of thailand · major economic developments and...
TRANSCRIPT
1

Major economic developments and outlooks
2
• Growth projection for 2013 has been revised down substantially, given slowing demand both at home and abroad, the boost from fiscal stimulus that waned off early, and export recovery that appears to be more delayed
• Looking ahead, Thailand’s growth is expected to resume its normal pace on the back of sound fundamentals
• Inflation subsides with softened demand and cost pressure
• The MPC eased its monetary policy stance further in May, aiming to further cushion against downside risks to domestic demand
• Financial stability and supply-side concerns warrant close monitoring
%yoy 2013 2014
As of Apr 13 5.1 5.0
As of Jul 13 4.2 5.0
GDP growth projection

50
100
150
200
250
Jan-10 Jan-11 Jan-12 Jan-13
Durable and semi-durable goods consumption
Durable & Semi Durable index*
Car index
2010 = 100 (SA, 3MMA)
Note: *electrical appliances, furniture, textiles, clothing, footwear, and glass
Source: Sales of motor vehicles from the Federation of Thai Industries; VAT data from Revenue Department; calculations by BOT
• Private consumption slowed down faster than expected: 1) The boost from fiscal stimulus waned
off earlier than expected since the end of Q1
2) Rising household debt started to weigh on other durable purchases
• Consumption will resume its normal pace in the period ahead, thanks to favorable income and employment as well as supportive monetary and fiscal policies
3
100
125
150
175
200
Jan-10 Jan-11 Jan-12 Jan-13
Real non-farm income Real farm income
Non-farm income continued to grow 2005 = 100 (SA, 3MMA)
Source: NESDB, OAE
Household consumption slowed down in 2013 H1 following last year’s surge

• For the U.S. economy, fundamentals continue to improve especially for the housing sector and employment, but sequestration continues to weigh on recovery
• Japan’s growth is expected to recover gradually thanks to stimulus measures
• The euro area economy becomes more stabilized, but structural problems remain to be solved
4
G3 economies have improved overall, but more time is needed for imports to pick up noticeably
Note: Data for Japan and the U.S. as of May 2013; Data for EU as of April 2013 Source: Bank of Japan, CEIC, Eurostat
-5
0
5
10
15
Jan 2011
Apr Jul Oct Jan 2012
Apr Jul Oct Jan 2013
Apr
Japan US EU
3mma, %yoy
G3’s import volume

China’s economic momentum decelerates
5
• The recent slowdown in exports and industrial investment put a drag on the Chinese economy
• Future momentum will gain support from strong household consumption, expedited public investment, and private investment flows supported by businesses’ healthy profits
China: recent macro indicators (2013)
21.4
12.7 9.5
18.3
8.5
2.4
20.8
12.8
9.3
14.6
16.6
2.4
20.5
12.9
9.2
1.0
-0.3
2.1
20.3
13.3
8.9
-3.3 -0.9
2.7
-5
0
5
10
15
20
25
Fixed asset investment
(ytd)
Retail sales Industrial production
Exports Imports Inflation
Q1 Apr May Jun %yoy
Source: CEIC

• The Chinese government announced the growth target for 2013 to be 7.5 percent, and deemed the current pace of domestic demand expansion as appropriate
• Recent measures aiming to undermine shadow banking’s lending to unproductive sectors will benefit economic stability overall
China’s future growth is unlikely to be as high as in the past, given the government’s increased focus on economic stability
6
RMB Tr
%yoy
China: nominal GDP and loan growth (%yoy)
Source: CEIC, BOA
Index (Jan 2011 = 100) sa, 3mma
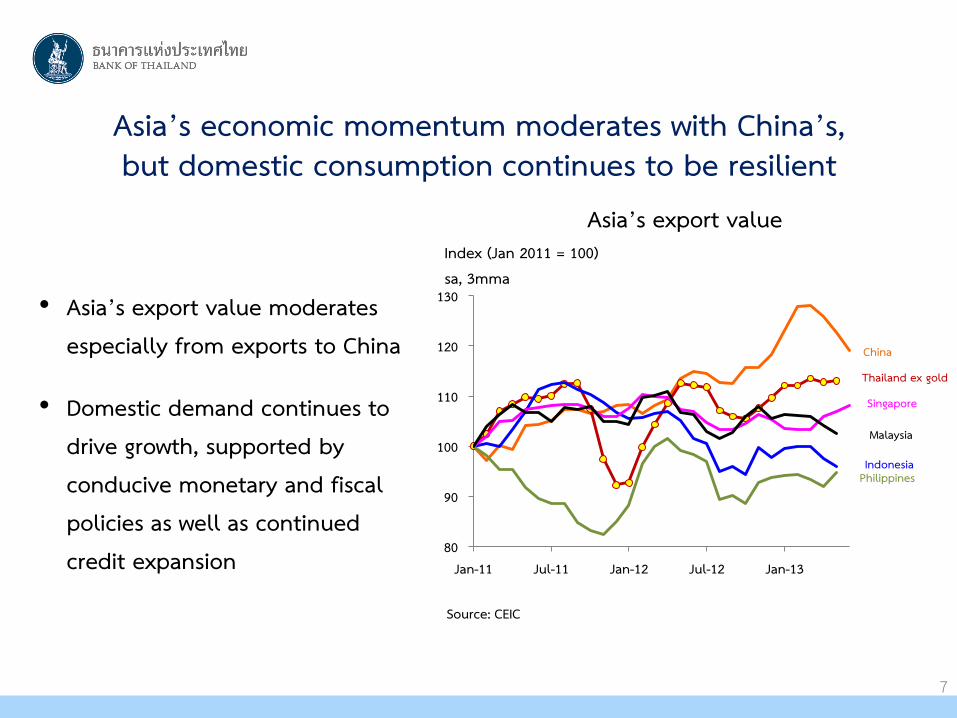
Asia’s export value
Source: CEIC
• Asia’s export value moderates especially from exports to China
• Domestic demand continues to drive growth, supported by conducive monetary and fiscal policies as well as continued credit expansion
Asia’s economic momentum moderates with China’s, but domestic consumption continues to be resilient
80
90
100
110
120
130
Jan-11 Jul-11 Jan-12 Jul-12 Jan-13
China
Thailand ex gold
Philippines
Singapore
Indonesia
Malaysia
7

Thailand’s export projection is revised down accordingly
8
• Thailand’s exports slow down overall in line with regional economies’
• Exports to China and Asia have been slowing down since late Q1, while exports to G3 continue to improve slowly
• Looking ahead, exports are projected to grow at a gradual pace on the back of recovery in G3 economies, broadly in line with leading indicators of Thai exports
%yoy 2013 2014
As of Apr 13 7.5 10.0
As of Jul 13 4.0 8.0
Projected growth for the value of merchandise exports

0
10
20
30
Q1/2005 Q1/2007 Q1/2009 Q1/2011 Q1/2013
Listed companies’ retained earning to total asset
Businesses postponed some investment as the economy slowed down, but remain willing and ready to invest going forward • Investment slowdown has been
more than expected since Q1, both in export- and domestic-oriented industries
• Once economic conditions improve, businesses are likely to resume their investment as planned for the purposes of productivity improvement and labor substitution, unconstrained financially given their overall financial strength
0 200 400 600 800
1,000
Jan Apr Jul Oct
2011 2012 2013
Billion baht
805
406 410
BOI approved project value (cumulative for each year)
Source : BOI
Percent
9 Source : SET; calculations by BOT

Fiscal impetus continues to support the economy, but to a lesser extent due to delayed disbursement
10
• Spending on water management projects is viewed to be more delayed, given the public hearing process required by the Administrative Court’s ruling
• Local administrative organizations’ spending is likely to increase in the second half of the year, but less than expected previously due to limited disbursement efficiency
(Billion baht) 2013 2014
As of Apr 13 54 69 As of Jul 13 19 48
Assumption on the government’s 350-billion-baht water management plan

Thailand’s growth is revised down for 2013, before resuming a normal pace in 2014
%YoY 2012 2013 2014
Apr 13 Jul 13 Apr 13 Jul 13
GDP Growth 6.5 5.1 4.2 5.0 5.0 - Private Consumption 6.7 4.7 3.4 3.7 3.5 - Private Investment 14.4 7.4 2.0 9.4 9.9 - Public Expenditure 7.9 10.2 7.9 5.1 5.2 - Exports of Goods and Services 3.1 7.2 5.8 9.3 8.0 - Imports of Goods and Services 6.2 9.2 5.8 10.3 8.4
11

Annual change (%)
Note: The fan chart covers 90 percent of the probability distribution
GDP growth forecast
Other downside risks:
• Prolonged slowdown in household spending
• Further delay in public spending on water management projects
The growth fan chart is skewed to the downside, reflecting risks from the global economy that continues to be significant
12

Inflation projection 2012* 2013 2014
Core inflation 2.1 1.1 1.4
(1.6) (1.7)
Headline inflation 3.0 2.3 2.6
(2.7) (2.7)
*Outturn ( ) Monetary Policy Report April 2013
Inflation projections are revised down
13
U.S. dollars per barrel 2012* 2013 2014
As of Apr 13 109 110 110
As of Jul 13 104 105
*Outturn
Assumption of Dubai oil price
• Cost pressue subsides slightly, in line with the outlook of oil and commodity prices and the postponed increase of domestic LPG prices
• Demand pressure declines with moderated growth outlook

Inflation fan charts are downward-skewed, in line with risks to growth that are tilted to the downside
Note: The fan charts cover 90 percent of the probability distribution
Core inflation forecast
Annual change (%)
Headline inflation forecast
14
Annual change (%)

Monetary policy has been eased further given increased risks to growth, while inflation remains benign
15
• The MPC reduced the policy rate by 0.25 basis point on May 29, 2013 – Downside risks to domestic demand growth had increased in light of the
weaker-than-expected GDP outturn for 2013 Q1
– Household debt and credit continued to pose risks to financial stability • The MPC then kept the rate unchanged on July 10, 2013
– Global economic and financial conditions were rapidly changing
– Last meeting’s policy rate cut was judged to be adequate for cushioning against near-term risks
– Risks to financial stability still warranted monitoring

Financial stability and supply-side concerns warrant close monitoring by the MPC
16
• On the financial stability front: – Rapid capital flows have contributed to exchange rate volatility
– Given their high debt, households may become more vulnerable to shocks in the future
• Supply-side concerns (e.g. from the total workforce, labor productivity, and logistics) may constrain growth potential in the longer term; meanwhile, demand-side policies can support the economy only in the near term and thus are inadequate

Increased volatility of capital flows
17
Key contributing factors:
• Frequent global shocks due to structural fragility in major economies and governments’ limited capability to provide stimulus
• Larger capital flows relative to the size of the economy
• Increased interconnectedness among countries, which allow spillover effects and self-fulfilling expectations to be more amplified than in the past Notes:
- Volatilities are calculated from the rolling standard deviation of net capital inflows (over 8 quarters) - Asia includes Indonesia, Malaysia, Philippines, Thailand, and South Korea Source: Data from CEIC and IFS; calculations by BOT
0 1 2 3 4 5 6 7 8 9
10
2005 2006 2007 2008 2009 2010 2011 2012
Asia
Thailand
Standard deviation
Volatility of net capital inflows
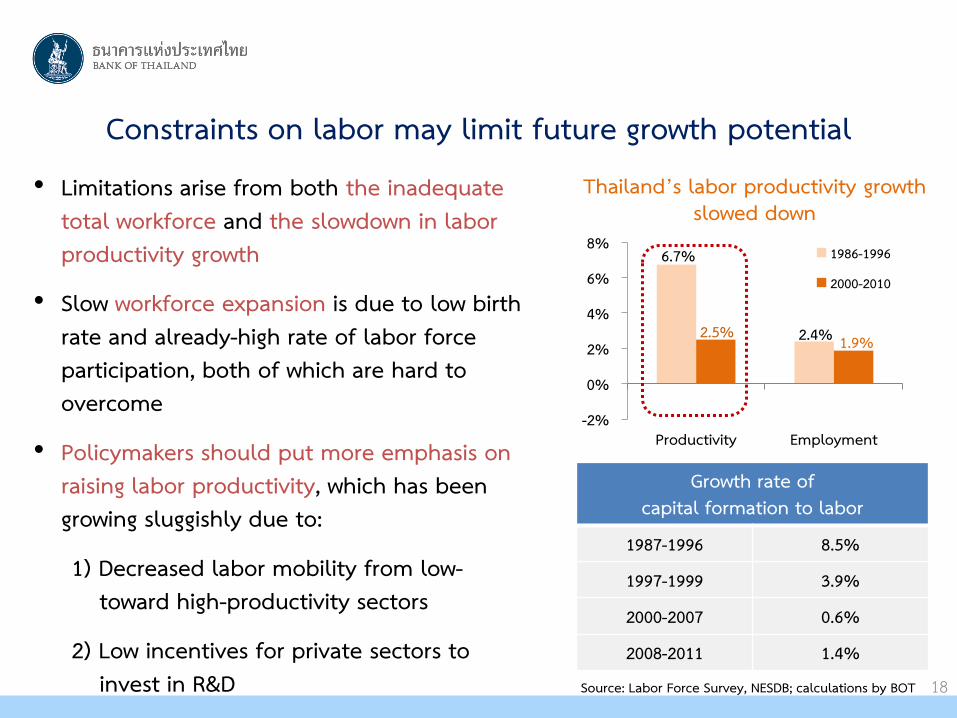
Constraints on labor may limit future growth potential
18
• Limitations arise from both the inadequate total workforce and the slowdown in labor productivity growth
• Slow workforce expansion is due to low birth rate and already-high rate of labor force participation, both of which are hard to overcome
• Policymakers should put more emphasis on raising labor productivity, which has been growing sluggishly due to:
1) Decreased labor mobility from low- toward high-productivity sectors
2) Low incentives for private sectors to invest in R&D
6.7%
2.4% 2.5% 1.9%
-2%
0%
2%
4%
6%
8%
Productivity Employment
1986-1996
2000-2010
Thailand’s labor productivity growth slowed down
Growth rate of capital formation to labor
1987-1996 8.5%
1997-1999 3.9%
2000-2007 0.6%
2008-2011 1.4%
Source: Labor Force Survey, NESDB; calculations by BOT

2012* 2013 2014
GDP Growth 6.5 4.2 5.0
(5.1) (5.0)
Core Inflation 2.1 1.1 1.4
(1.6) (1.7)
Headline Inflation 3.0 2.3 2.6
(2.7) (2.7)
19
Forecast summary
Note: *Outturn ( ) Monetary Policy Report April 2013

Detailed summary of forecasts (Monetary Policy Report July 2013)
20
Attachment
(%YoY) 2012 2013E 2014E
GDP Growth 6.5 4.2 5.0
- Private Consumption 6.7 3.4 3.5
- Private Investment 14.4 2.0 9.9
- Government Consumption 7.5 4.2 3.5
- Public Investment 8.9 15.6 8.3
- Exports of Goods and Services 3.1 5.8 8.0
- Imports of Goods and Services 6.2 5.8 8.4
Current Account Balance (Billion USD)* 2.7 1.7 0.1
Trade Balance (Billion USD)* 8.3 5.4 4.8
- Value of Exports of Goods* 3.2 4.0 8.0
- Value of Imports of Goods* 7.8 5.5 8.5
Note: E = Expected * Data revision according to BPM6 definitions and Ministry of Commerce’s revised database

2012 2013 2014
Apr 13 Jul 13 Apr 13 Jul 13 Dubai oil price (USD per barrel) 109.3 109.7 104.0 110.0 105.0 Non-fuel commodity prices (%yoy) -9.8 1.0 0.0 1.6 0.6 Fresh food prices (%yoy) -1.5 11.4 13.7 6.6 4.1 Minimum wage in the Bangkok Metropolitan Region (baht per day) 279 300 300 300 300
Public expenditure Government consumption (%yoy) 10.4 8.0 7.6 6.6 5.9 Public investment (%yoy) 12.2 27.0 18.8 11.3 14.2 Fed funds rate (% year end) 0.13 0.13 0.13 0.13 0.13 Trading partners’ GDP growth (%yoy) 3.3 3.5 3.3 4.0 3.9 Regional currencies vis-à-vis the USD (Index)* 108.4 106.1 108.6 104.1 107.8
21
Attachment
Forecast assumptions (compared with Monetary Policy Report April 2013)
Note: * Depreciation against the USD indicated by an increase

(% YoY) Weight
(%) 2012
2013 2014
Apr 13 Jul 13 Apr 13 Jul 13
U.S. 14.3 2.2 1.7 1.7 2.5 2.5
Euro area 10.3 -0.5 -0.5 -0.6 1.0 1.0
Japan 14.4 2.0 1.0 1.7 1.3 1.3
Asia* (China)
51.8 (15.2)
4.8 (7.8)
5.5 (8.2)
5.0 (7.7)
5.8 (8.1)
5.7 (7.8)
Total** 100 3.3 3.5 3.3 4.0 3.9
Assumptions on trading partners’ GDP growth
22
Attachment
Note: * Weighted by shares of Thailand’s major trading partners in 2010 (8 Asian countries including China (29.3%), Singapore (12.3%), Hong Kong (17.9%), Malaysia (14.4%), Taiwan (4.4%), Indonesia (10.0%), South Korea (4.9%), and Philippines (6.7%)) ** Weighted by shares of Thailand’s major trading partners in 2010 (13 countries)