maize meal fortification: markets, feasibility and … meal fortification: markets, feasibility and...
TRANSCRIPT

Maize Meal Fortification: Markets, Feasibility and Costs
Evidence from Kenya, Uganda and Zambia
Jack Fiedler, Ronald Afidra, Gladys Mugambi, John Tehinse, Gladys Kabaghe, Keith Lividini, Rodah Zulu, Marc-Francois Smitz, Vincent Jallier,
Christophe Guyondet, Odilia Bermudez
The USAID SPRING Project: Strengthening Partnerships, Results and Innovations in Nutrition Globally
HarvestPlus and PHND, IFPRI
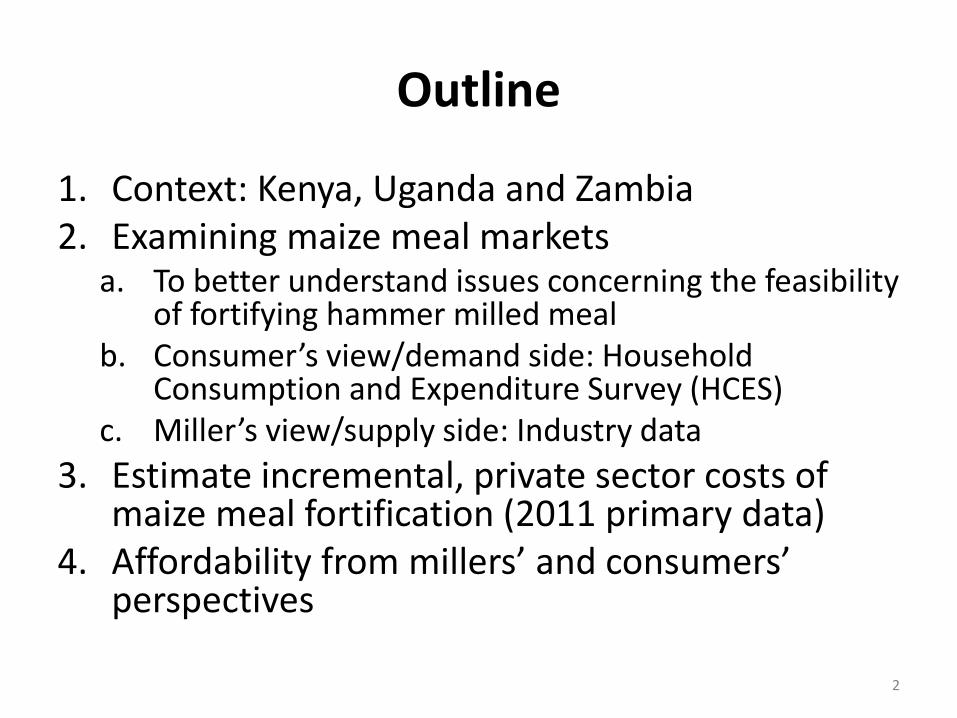
Outline
1. Context: Kenya, Uganda and Zambia 2. Examining maize meal markets
a. To better understand issues concerning the feasibility of fortifying hammer milled meal
b. Consumer’s view/demand side: Household Consumption and Expenditure Survey (HCES)
c. Miller’s view/supply side: Industry data
3. Estimate incremental, private sector costs of maize meal fortification (2011 primary data)
4. Affordability from millers’ and consumers’ perspectives
2

3
Quantity
Country (kg/capita/yr) Ranking
Lesotho 149.3 100% 1
Malawi 133.1 89% 2
Mexico 120.5 81% 3
Zimbabwe 110.4 74% 4
Zambia 110.2 74% 5
South Africa 103.7 69% 6
Timor-Leste 89.3 60% 7
Guatemala 86.2 58% 8
Bosnia and Herzegovina 81.8 55% 9
Honduras 78.6 53% 10
Kenya 77.2 52% 11
Togo 73.7 49% 12
El Salvador 72.8 49% 13
Swaziland 69.7 47% 14
Namibia 68.4 46% 15
Nicaragua 68.1 46% 16
Venezuela 64.3 43% 17
Egypt 60.3 40% 18
Tanzania 58.1 39% 19
Benin 55.4 37% 20
Uganda 22.4 15% 54
Top Maize Consuming Countries
Of the top 20: 12 African, 5 Central American, 3 Others
Relative to
Lesotho

4
46%
30%
24%
50%
33%
20%
61%
47%
54%
Anemia Zinc Vitamin A
Micronutrient Deficiencies Among Children 6-59m
Kenya Uganda Zambia
SOURCES: KN: A=2010 MIS, Z=2008/9 DHS; VA=1999 VMNIS. UG: A=2011 DHS, Z=2011 DHS, VA=2006 DHS. ZM: A=2010 MIS,Z=2010 CSO, VA=2003 NFNC

Current State of Fortification
• Kenya: 2011 a mandate to fortify all packaged maize meal (~roller meal) by July 2012.
• Uganda: 2012 mandate to fortify maize meal in all mills with a capacity of 20MT/d by July 2013.
• Zambia: Has had sugar fortification since 1998. In 2008, a project to voluntarily introduce maize meal fortification was halted mid-steam by the Ministry of Health, and remains suspended. The fortification program still functions, and a reassessment of maize and wheat is underway.
5

The Consumption-Based View of Maize Meal Fortification
1. How many households are consuming maize?
2. How many are consuming maize meal?
3. What types of maize meal are they consuming?
4. Are there maize meal market insights for better understanding fortification policy options?
6

Household Consumption and Expenditure Surveys (HCES)
HCES: A generic label for a family of multi-purpose surveys that capture information on food acquisition and/or consumption, including:
– Household Budget Surveys (HBS)
• Uganda UHBS 2006
– Integrated Household Budget Surveys (HIBS)
• Kenya KIHBS 2006
– Living Conditions Monitoring Surveys (LCMS)
• Zambia LCMS 2006

8
KENYA UGANDA ZAMBIA
1. Sample Size a. Households 13,212 7,421 18,662
b. Persons 66,725 38,543 80,919
2. Statistically Representative Province, n=8 Region, n=4 Province, n=9
3. Recall Period 7 days 7 days 14 days
4. Number of Foods 161 61 39
5. Sources of Food/Acquisition Method
a. PurchasesYes, and consumption
from purchases
Yes, and consumption
from purchasesOnly purchases
b. Consumption from own production Yes Yes Yes
c. Received in-kind Yes Yes Yes
Integrated Household
Budget Survey
(KIHBS 2006)
National Household
Survey
(UNHS 2006)
Living Conditions
Monitoring Survey
(LCMS 2006)
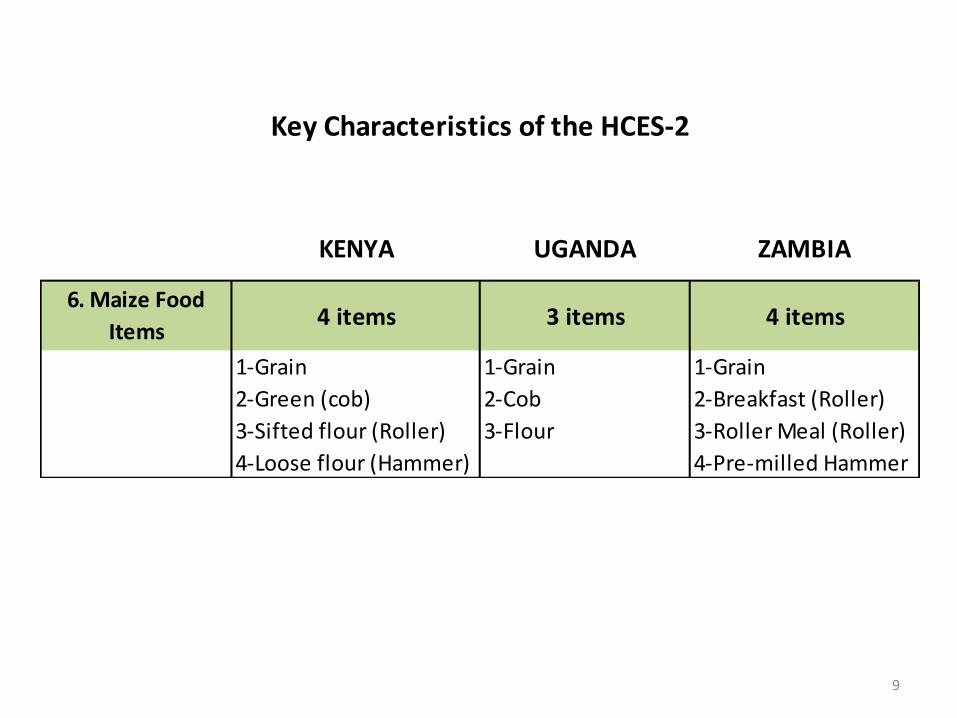
Key characteristics of the household consumption and expenditures surveys
9
6. Maize Food
Items4 items 3 items 4 items
1-Grain 1-Grain 1-Grain
2-Green (cob) 2-Cob 2-Breakfast (Roller)
3-Sifted flour (Roller) 3-Flour 3-Roller Meal (Roller)
4-Loose flour (Hammer) 4-Pre-milled Hammer
Key Characteristics of the HCES-2
KENYA UGANDA ZAMBIA

10
KENYA: Maize Consumption by Maize Form
94%
71%65%
16%
86%
59%
33%
AllMaize
Green +Grain
MaizeGrain -Loose(103)
GreenMaize(104)
AllMaizeFlour
MaizeFlour -Loose(105)
MaizeFlour -Sifted(106)
% o
f K
enya
ns
in H
Hs
Ap
par
entl
y C
on
sum
ing
Mai
ze
Maize From All Sources (Purchases, Own Production & Gifts)
11
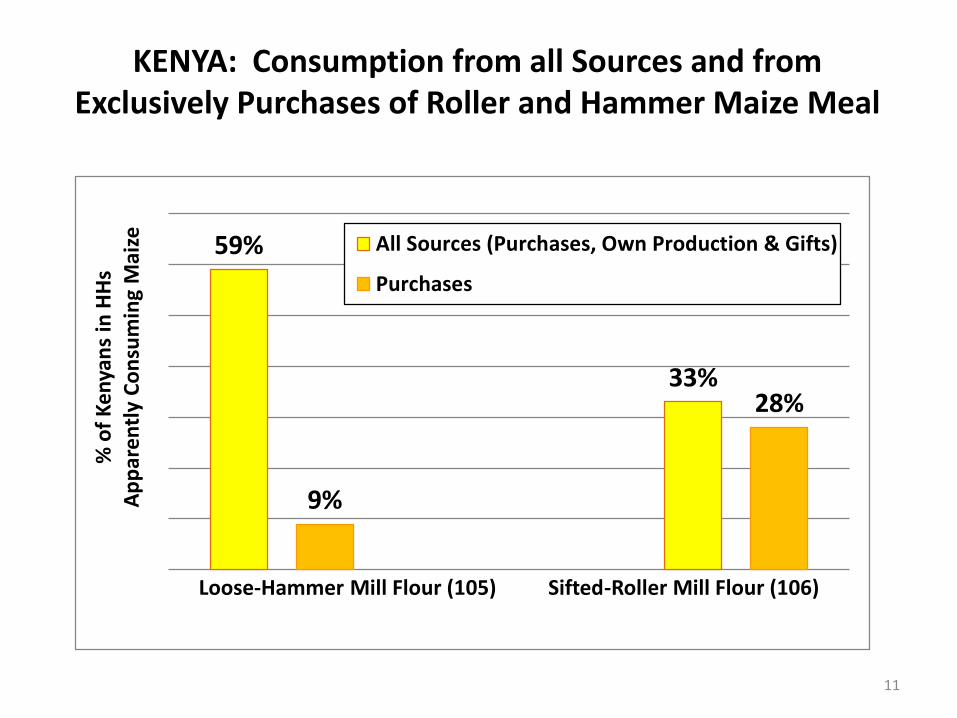
KENYA: Consumption from all Sources and from Exclusively Purchases of Roller and Hammer Maize Meal
59%
33%
9%
28%
% o
f K
enya
ns
in H
Hs
Ap
par
entl
y C
on
sum
ing
Mai
ze
Loose-Hammer Mill Flour (105) Sifted-Roller Mill Flour (106)
All Sources (Purchases, Own Production & Gifts)
Purchases

8,736,815
2,887,511
Roller Meal (96%) Hammer Meal (90%)
Figure 4. KENYA: Maize Meal Market Segmentation
Bought Only This Type of Flour
Bought Other Type of Flour too
Nu
mb
er
of
Pe
rso
ns
in H
ou
seh
old
s th
at
Pu
rch
ase
d in
th
e p
ast
7 d
ays
12

71%
62%
13%
5%
Maize (all forms) Maize Flour Maize Cobs Maize Grain
Pe
rce
nta
ge o
f K
en
yan
s Li
vin
g in
Ho
use
ho
lds
Pu
rch
asin
g/C
on
sum
ing
Mai
ze
Maize Apparent Consumption by Maize Form, Uganda
13

62%
39%
All Sources(Purchases, OwnProduction, Gifts)
Purchases
Pe
rce
nta
ge o
f K
en
yan
s Li
vin
g in
Ho
use
ho
lds
Pu
rch
asin
g/C
on
sum
ing
Mai
ze
Maize Flour Apparent Consumption by Source, Uganda
14
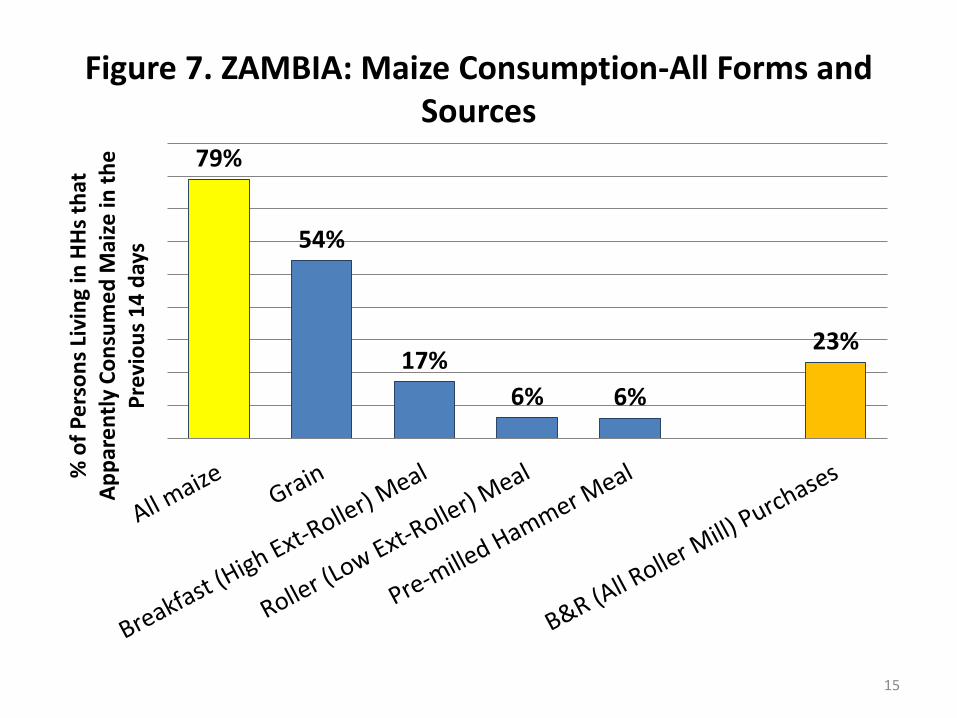
Figure 7. ZAMBIA: Maize Consumption-All Forms and Sources
15
79%
54%
17%
6% 6%
23%
% o
f P
ers
on
s Li
vin
g in
HH
s th
at
Ap
par
en
tly
Co
nsu
me
d M
aize
in t
he
P
revi
ou
s 1
4 d
ays

229,643
674,515
394,896
1,299,054
37,670
40,477
29,626
107,773
-
200,000
400,000
600,000
800,000
1,000,000
1,200,000
1,400,000
1,600,000
Roller: 85.9% Breakfast: 94.3% Hammer: 93.0% Some Meal: 92.3%
Maize Meal Market Segmentation, Zambia 2010Number and Percent of Households Purchasing Only One Type of Maize Meal
Bought Other Meal Too
Bought Only This Type of Meal
Nu
mb
er
of
Ho
use
ho
lds P
urc
ha
sin
g
Maize Meal Type: Percent Purchasing Exclusively this Type16
17
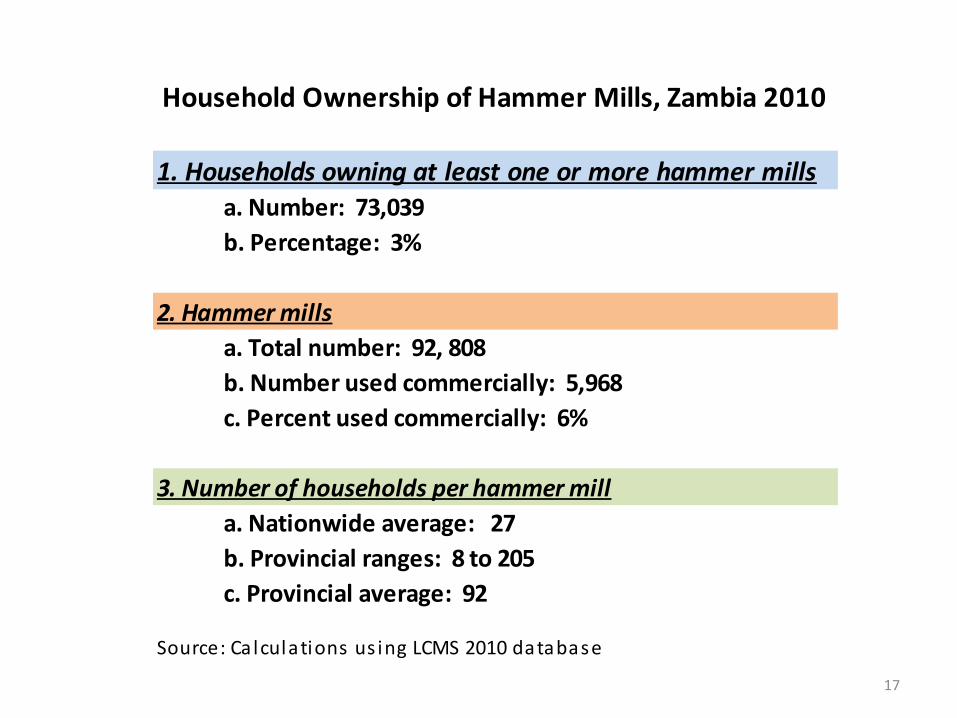
1. Households owning at least one or more hammer mills
a. Number: 73,039
b. Percentage: 3%
2. Hammer mills
a. Total number: 92, 808
b. Number used commercially: 5,968
c. Percent used commercially: 6%
3. Number of households per hammer mill
a. Nationwide average: 27
b. Provincial ranges: 8 to 205
c. Provincial average: 92
Source: Ca lculations us ing LCMS 2010 database
Household Ownership of Hammer Mills, Zambia 2010
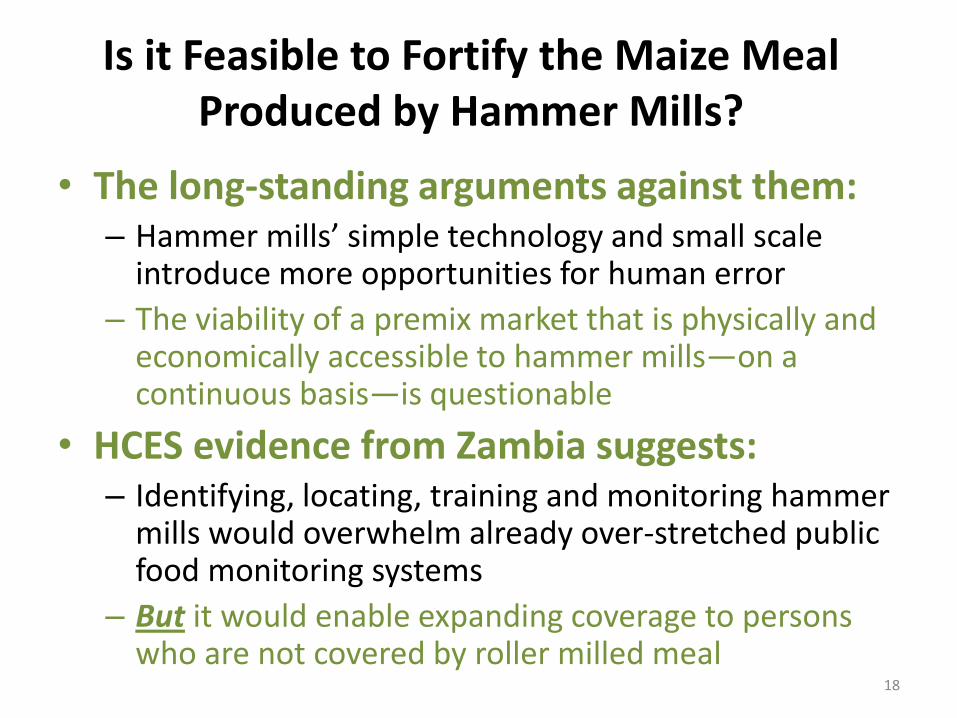
Is it Feasible to Fortify the Maize Meal Produced by Hammer Mills?
• The long-standing arguments against them: – Hammer mills’ simple technology and small scale
introduce more opportunities for human error
– The viability of a premix market that is physically and economically accessible to hammer mills—on a continuous basis—is questionable
• HCES evidence from Zambia suggests: – Identifying, locating, training and monitoring hammer
mills would overwhelm already over-stretched public food monitoring systems
– But it would enable expanding coverage to persons who are not covered by roller milled meal
18
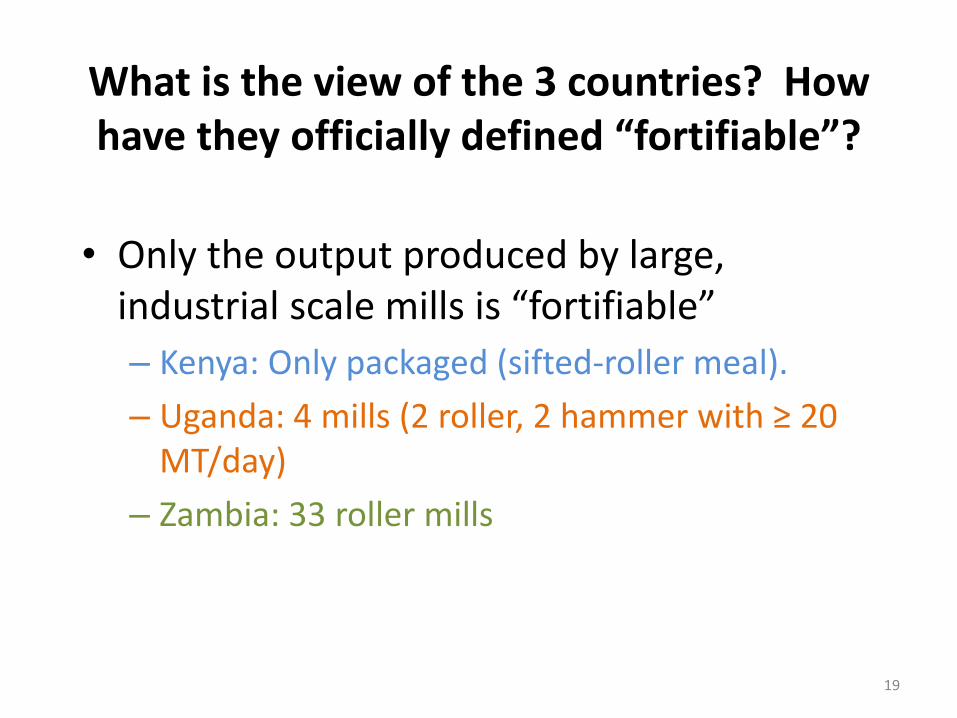
What is the view of the 3 countries? How have they officially defined “fortifiable”?
• Only the output produced by large, industrial scale mills is “fortifiable”
– Kenya: Only packaged (sifted-roller meal).
– Uganda: 4 mills (2 roller, 2 hammer with ≥ 20 MT/day)
– Zambia: 33 roller mills
19
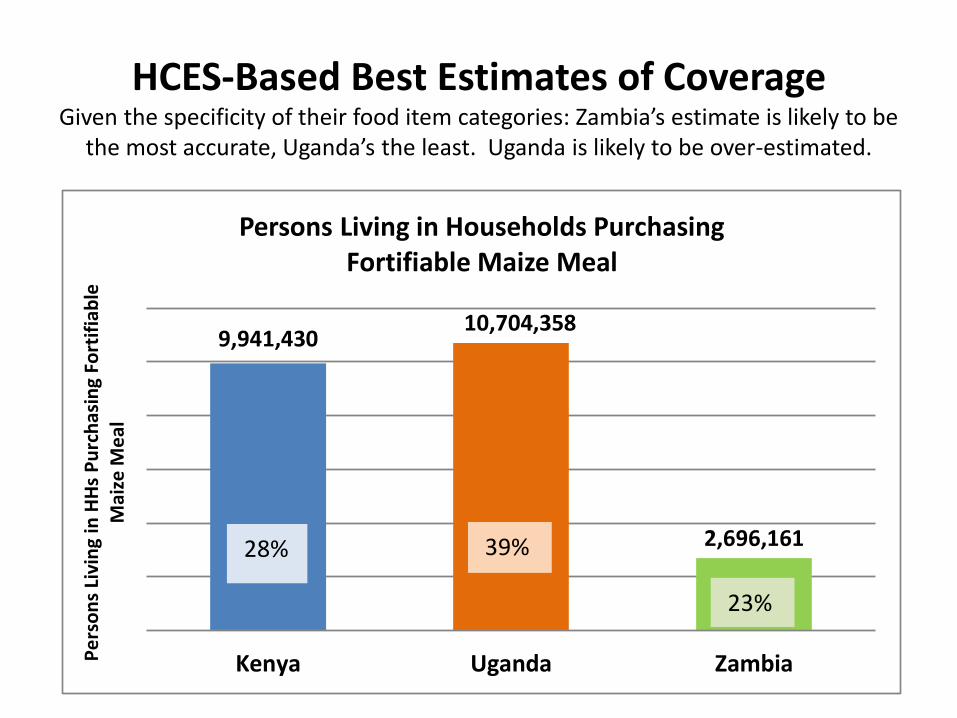
HCES-Based Best Estimates of Coverage Given the specificity of their food item categories: Zambia’s estimate is likely to be
the most accurate, Uganda’s the least. Uganda is likely to be over-estimated.
20
9,941,43010,704,358
2,696,161
Kenya Uganda ZambiaPe
rso
ns
Livi
ng
in H
Hs
Pu
rch
asin
g Fo
rtif
iab
le
Mai
ze M
eal
Persons Living in Households PurchasingFortifiable Maize Meal
28% 39%
23%

The Supply / Production-Based View 1. How many mills are producing fortifiable
maize meal?
2. How much maize meal are they producing?
3. What are the additional costs they incur to fortify?
21

Estimating the Incremental, Private Sector Costs of Fortification: Step 1
1. Identified large scale maize millers a. Kenya: 20 rollers mills b. Uganda: 4 mills; 2 roller, 2 hammer > 20MT/d c. Zambia: 33 roller mills
2. Categorized mills as small, medium and large by output.
a. Size is intended to capture systematic differences in technology and costs (economies of scale)
b. Size categories varied by country
3. Selected 1 or 2 maize millers of each size category: A total of 9 millers in the 3 countries
22

23
Company
Capacity
(MT/Year)
Size
Cateory
1 Ungaa-Nairobi Mill 240,900 Larger
2 Mombasa Maize Millers - Mombasa 222,650 Larger
3 Eldoret Grains 158,775 Larger
4 Mombasa Grain Milling Co 120,450 Larger
5 Pembe-Lunga Lunga Road 98,550 Meduim
6 Mombasa Maize Millers - Nairobi 93,075 Meduim
7 Capwell 87,600 Meduim
8 Kitui Flour Mills 87,600 Meduim
9 United Millers 85,775 Meduim
10 Maize Milling Co Ltd 73,000 Meduim
11 Uzuri Foods 65,700 Meduim
12 TSS Grain 54,750 Meduim
13 Chania Feeds 52,560 Meduim
14 Pembe-Lunga Lunga Road 51,100 Meduim
15 Kitale Industries 47,450 Small
16 Mombasa Maize Millers - Kisumu 43,800 Small
17 Nairobi Flour Mills 43,800 Small
18 Osho Grains 43,800 Small
19 Eastern Flour Mills 43,800 Small
20 Kabansora 36,500 Small
TOTAL CAPACITY: 1,751,635
ESTIMATED OUTPUT: 767,313
Kenya's 20 Largest Maize Mills
Source: Yusufa l i R, Ssa l i W, Ai la F. Kenya flour and edible oi l manufacturing assessment. Confidentia l
technica l report, MOPH&S, Nairobi , 2011.
24
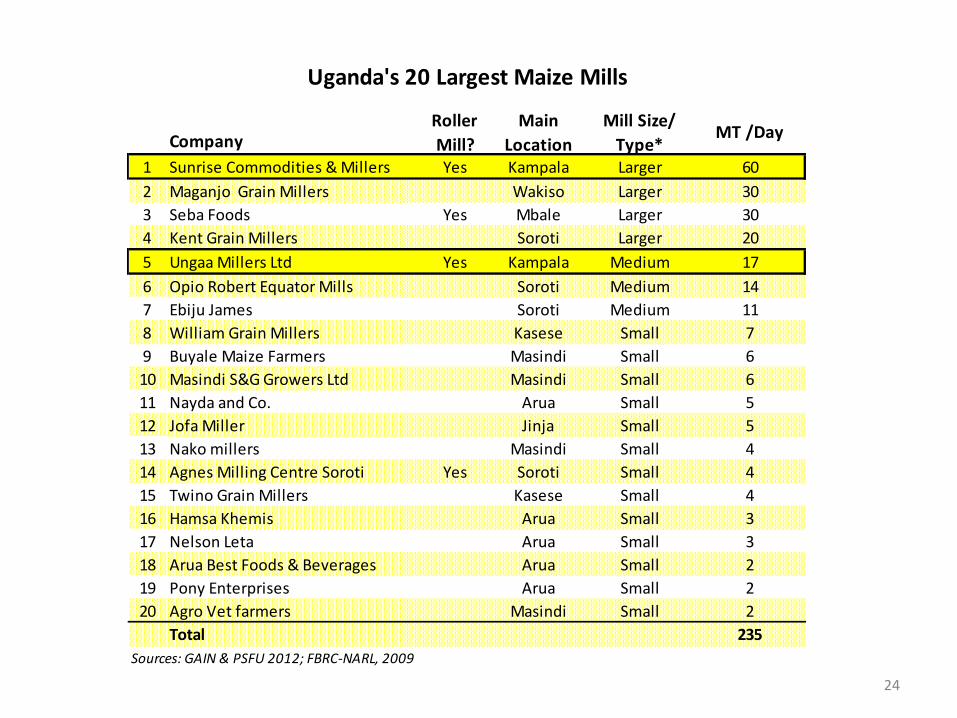
Company
Roller
Mill?
Main
Location
Mill Size/
Type*MT /Day
1 Sunrise Commodities & Millers Yes Kampala Larger 60
2 Maganjo Grain Millers Wakiso Larger 30
3 Seba Foods Yes Mbale Larger 30
4 Kent Grain Millers Soroti Larger 20
5 Ungaa Millers Ltd Yes Kampala Medium 17
6 Opio Robert Equator Mills Soroti Medium 14
7 Ebiju James Soroti Medium 11
8 William Grain Millers Kasese Small 7
9 Buyale Maize Farmers Masindi Small 6
10 Masindi S&G Growers Ltd Masindi Small 6
11 Nayda and Co. Arua Small 5
12 Jofa Miller Jinja Small 5
13 Nako millers Masindi Small 4
14 Agnes Milling Centre Soroti Yes Soroti Small 4
15 Twino Grain Millers Kasese Small 4
16 Hamsa Khemis Arua Small 3
17 Nelson Leta Arua Small 3
18 Arua Best Foods & Beverages Arua Small 2
19 Pony Enterprises Arua Small 2
20 Agro Vet farmers Masindi Small 2
Total 235
Uganda's 20 Largest Maize Mills
Sources: GAIN & PSFU 2012; FBRC-NARL, 2009
25
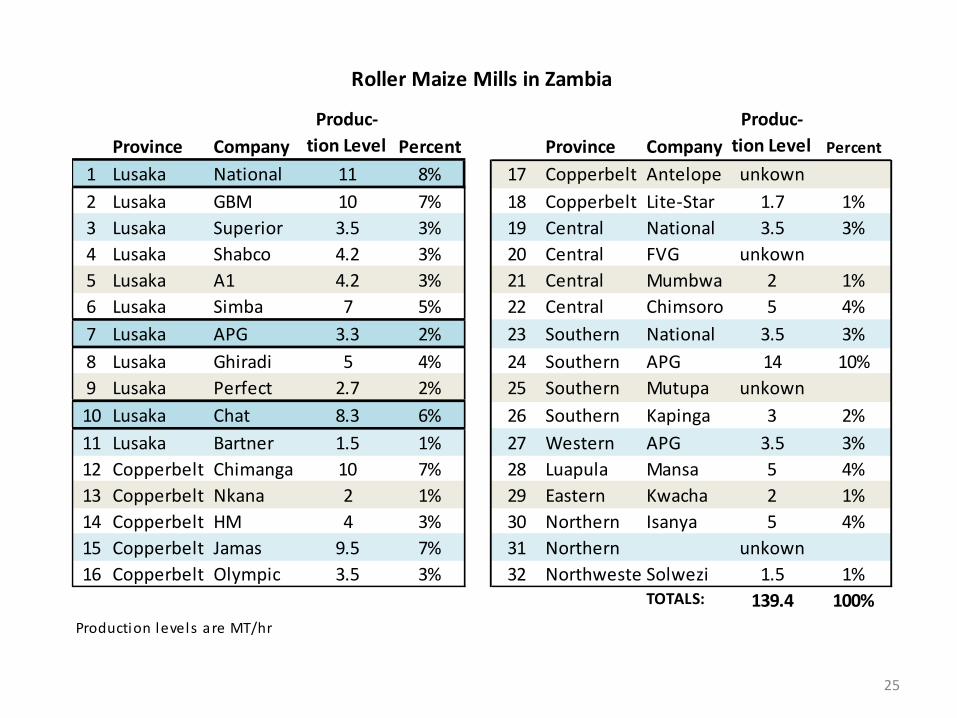
Province Company
Produc-
tion Level Percent Province Company
Produc-
tion Level Percent
1 Lusaka National 11 8% 17 Copperbelt Antelope unkown
2 Lusaka GBM 10 7% 18 Copperbelt Lite-Star 1.7 1%
3 Lusaka Superior 3.5 3% 19 Central National 3.5 3%
4 Lusaka Shabco 4.2 3% 20 Central FVG unkown
5 Lusaka A1 4.2 3% 21 Central Mumbwa 2 1%
6 Lusaka Simba 7 5% 22 Central Chimsoro 5 4%
7 Lusaka APG 3.3 2% 23 Southern National 3.5 3%
8 Lusaka Ghiradi 5 4% 24 Southern APG 14 10%
9 Lusaka Perfect 2.7 2% 25 Southern Mutupa unkown
10 Lusaka Chat 8.3 6% 26 Southern Kapinga 3 2%
11 Lusaka Bartner 1.5 1% 27 Western APG 3.5 3%
12 Copperbelt Chimanga 10 7% 28 Luapula Mansa 5 4%
13 Copperbelt Nkana 2 1% 29 Eastern Kwacha 2 1%
14 Copperbelt HM 4 3% 30 Northern Isanya 5 4%
15 Copperbelt Jamas 9.5 7% 31 Northern unkown
16 Copperbelt Olympic 3.5 3% 32 NorthwesternSolwezi 1.5 1%TOTALS: 139.4 100%
Production levels are MT/hr
Roller Maize Mills in Zambia
Estimating the Incremental Private Sector Costs of Fortification: Step-2
4. Structured interviews with key management and production officials of the selected plants
5. Estimated incremental capital and recurrent costs
26
27
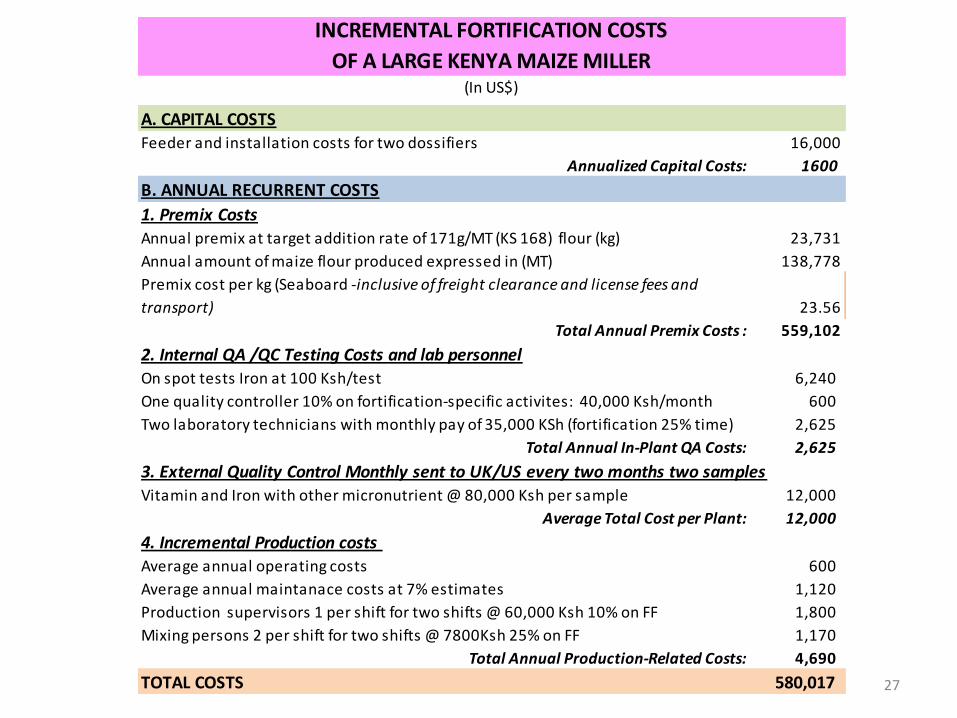
A. CAPITAL COSTSFeeder and installation costs for two dossifiers 16,000
Annualized Capital Costs: 1600
B. ANNUAL RECURRENT COSTS
1. Premix CostsAnnual premix at target addition rate of 171g/MT (KS 168) flour (kg) 23,731
Annual amount of maize flour produced expressed in (MT) 138,778
Premix cost per kg (Seaboard -inclusive of freight clearance and license fees and
transport) 23.56
Total Annual Premix Costs : 559,102
2. Internal QA /QC Testing Costs and lab personnel
On spot tests Iron at 100 Ksh/test 6,240
One quality controller 10% on fortification-specific activites: 40,000 Ksh/month 600
Two laboratory technicians with monthly pay of 35,000 KSh (fortification 25% time) 2,625
Total Annual In-Plant QA Costs: 2,625
3. External Quality Control Monthly sent to UK/US every two months two samplesVitamin and Iron with other micronutrient @ 80,000 Ksh per sample 12,000
Average Total Cost per Plant: 12,000
4. Incremental Production costs Average annual operating costs 600
Average annual maintanace costs at 7% estimates 1,120
Production supervisors 1 per shift for two shifts @ 60,000 Ksh 10% on FF 1,800
Mixing persons 2 per shift for two shifts @ 7800Ksh 25% on FF 1,170
Total Annual Production-Related Costs: 4,690
TOTAL COSTS 580,017
(In US$)
INCREMENTAL FORTIFICATION COSTS
OF A LARGE KENYA MAIZE MILLER

28
Premix96.4%
QA, In-Plant0.5%
QC, External2.1%
Production personnel costs
0.8% Annualised capital0.3%
Annual Incremental Costs of Maize Meal Fortification in a Large Mill in Kenya
Estimating the Incremental, Private Sector Costs of Fortification: Step-3
6. Estimated the additional cost per metric ton for each of the sampled mills
7. Estimated the total cost of fortifying all of the output of each plant size category from the plant size-specific average cost/MT of the sampled mill
8. Total national costs were estimated as the sum of the total cost of each plant size category
9. More than half of the studies were ex ante these estimates provide a general order of magnitude, and not precise, definitive estimates (Most of Kenya’s costs are actuals.)
29

30
Lowest priced premix reduces total incremental fortification costs by 17%.
The highest priced premix adds 26% to total costs.
Small Medium Large Nation-wide,
Cost Item Plant Output (MT / Yr): 10,000-30,000 30,000-70,000 > 70,000 All Plants
1 Average Cost Per Plant 98,716 127,213 453,465 173,673
2 Number of Plants 5 10 3 18
3 Total Output of the Plant Size Category 116,617 320,168 325,528 762,313
4 Premix Cost per kg 18.75 27.00 23.56 24.14
5 Total Annual Cost 493,580 1,272,132 1,360,395 3,126,106
6 Premix Cost Percent of Total Fortif. Cost 89% 97% 96% 95%
a. All Mills Paying Lowest Premix Price 493,580 766,492 1,344,216 2,604,287
b. All Mills Paying Highest Premix Price 685,995 1,272,132 1,984,954 3,943,080
7 Average Cost per MT 4.23 3.97 4.18 4.10
Kenya National Maize Meal Fortification Cost

33
Cost Item US$ % costs US$ % costs US$ % costs
1. Premix 2,979,287 96.4% 169,596 65% 2,741,579 89%
2. QA / In-Plant lab testing 26,841 0.5% 19,714 4% 39,600 1%
3. QC / External lab testing 52,724 2.1% 2,786 3% 0 0%
4. Production-related costs 54,386 0.8% 24,454 24% 205,054 7%
5. Annualized capital costs 12,868 0.3% 3,420 3% 84,546 3%
TOTAL COSTS: 3,126,106 100% 219,971 100% 3,070,779 100%
Comparing Annual Incremental Costs of Fortification
Kenya Uganda Zambia

34
$156,305
$93,054
$54,99342,351
29,201
8,750
$0
$20,000
$40,000
$60,000
$80,000
$100,000
$120,000
$140,000
$160,000
$180,000
Kenya Zambia Uganda
MT/
Yr
and
US$
pe
r M
ill
Average Annual Output and Average Annual Cost per Mill
Average Cost / Mill
Average Output / Mill

35
$3.98
$3.19
$4.41
$0.00
$1.00
$2.00
$3.00
$4.00
$5.00
Kenya Zambia Uganda
Co
st p
er M
T
Average Incremental Cost per MTof Fortified Maize Meal

36
Kenya Uganda Zambia
1 Maize meal consumer price/Kg (Pre-fortification) $0.44 $0.69 R: $0.30
B: $0.44
2Maximum increase in price due to fortification--
assuming full cost is passed onto consumer0.09% 0.07% 0.09%
3 All Households consuming fortified maize meal:0.03% 0.002% 0.2%
4HHs among poorest 40% of HHs consuming
fortified maize meal: 0.07% 0.005% 0.8%
Incremental Private Sector Fortification Costs: The Consumer's Perspective(In US$)
Assuming consumption levels remain constant, fortification will result in at most an
increased expenditure as a percent of household income of:

Conclusions & Observations
1. HCES provide a tool for better understanding coverage and market structures
2. Premix costs comprise the overwhelming share of the total incremental costs of fortifying maize meal
3. Premix costs vary substantially
4. Premix issues are not only price, but quality. What is the role, vision and exit strategy of GAIN’s Pre-Mix Facility?
5. Incremental fortification cost per mill is significant, but is likely to be passed on to the consumer
6. The annual cost per household consuming fortifiable maize meal is relatively modest—even among the poorest 40% 37