maintenance systems and documentation - · pdf filemaintenance systems and documentation...
TRANSCRIPT


Maintenance Systems and Documentation

This page intentionally left blank

Maintenance Systems and Documentation
Anthony Kelly
AMSTERDAM • BOSTON • HEIDELBERG • LONDON • OXFORD •NEW YORK • PARIS • SAN DIEGO • SAN FRANCISCO • SINGAPORE •
SYDNEY • TOKYO

Butterworth-Heinemann is an imprint of Elsevier
Linacre House, Jordan Hill, Oxford OX2 8DP, UK
30 Corporate Drive, Suite 400, Burlington, MA 01803, USA
First Edition 2006
Copyright © 2006, Anthony Kelly.
Published by Elsevier Ltd. All rights reserved
No part of this publication may be reproduced, stored in a retrieval system or
transmitted in any form or by any means electronic, mechanical, photocopying,
recording or otherwise without the prior written permission of the publisher
Permission may be sought directly from Elsevier’s Science & Technology Rights
Department in Oxford, UK; phone: (+44) (0) 1865 843830; fax: (+44) (0) 1865 853333;
e-mail: [email protected]. Alternatively you can submit your request online by
visiting the Elsevier web site at http://elsevier.com/locate/permissions, and selecting
Obtaining permission to use Elsevier material
Notice
No responsibility is assumed by the publisher for any injury and/or damage
to persons or property as a matter of products liability, negligence or otherwise,
or from any use or operation of any methods, products, instructions or ideas
contained in the material herein. Because of rapid advances in the medical
sciences, in particular, independent verification of diagnoses and drug dosages
should be made
British Library Cataloguing in Publication Data
A catalogue record for this book is available from the British Library
Library of Congress control number: 2006921208
ISBN 13: 978 0 75 066994 8
ISBN 10: 0 75 066994 2
Plant Maintenance Management (set of three volumes)
ISBN 13: 978 0 75 66995 5; ISBN 10: 0 75 066995 0
Typeset by Charon Tec Ltd, Chennai, India
www.charontec.com
Printed and bound in Great Britain
For information on all Elsevier Butterworth-Heinemann
publications visit our web site at www.books.elsevier.com
Contents
Preface xi
Acknowledgments xiii
Author’s biography xv
Part 1 Introductory chapters 1
1 A business-centered approach to maintenance systems 31.1 Introduction 41.2 Business-centered maintenance 41.3 An example of the application of BCM: background 61.4 Part A: Audit of the FPP maintenance department 7
1.4.1 Maintenance objectives 81.4.2 Life plans and preventive schedule 91.4.3 Workload 111.4.4 Maintenance organization 121.4.5 Maintenance work planning 161.4.6 Maintenance control system 191.4.7 Maintenance documentation 231.4.8 Audit summary 25
1.5 Part B: An alternative maintenance strategy for continuous operation 25
1.6 Part C: A longer-term view of organizational change 261.7 The strategic thought process 27
2 Introduction to maintenance management systems 332.1 The company expressed as a hierarchic systems model 342.2 Identifying the maintenance systems 36
Part 2 Budgeting and control 39
3 Maintenance budgeting 413.1 Introduction 423.2 Maintenance budgeting 423.3 The budgeting procedure 45
4 Maintenance management control 534.1 Introduction 544.2 The basics of maintenance management control 55
4.3 Principles of maintenance management control 564.4 The control of overall maintenance performance 574.5 The control of maintenance effectiveness
(the control of plant reliability) 614.5.1 Reactive control of plant reliability 614.5.2 Pro-active control of unit reliability 62
4.6 The control of organizational efficiency 634.7 Incorporating systems into the organization 644.8 Published methods for measuring maintenance performance 674.9 The use of indices of maintenance performance for
inter-firm comparisons 674.10 Human factors and data collection 67
Part 3 Work planning and work control 71
5 Short-term work planning and control 735.1 Introduction 745.2 The fundamentals of work planning 745.3 Modeling the operation of a short-term work
planning system 755.3.1 The shift work planning system 795.3.2 The weekend work planning system 815.3.3 Feedback of maintenance data for control 82
5.4 Comments on work planning and work control 835.5 Guidelines for the design of work planning systems 845.6 Safety aspects 88
6 Management of plant turnarounds – Part 1: Network analysis 916.1 Introduction 926.2 Terms, concepts and definitions in network analysis 936.3 The network planning procedure 96
6.3.1 Data collection 976.3.2 Constructing the logic diagram 976.3.3 Establishing the critical path, floats and overhaul time 996.3.4 Deriving a bar chart from the network 1016.3.5 Resource histograms 102
6.4 Comments 103
7 Management of plant turnarounds –Part 2: Turnaround methodology 1097.1 Introduction 1107.2 Phase 1: Initiating the turnaround 110
7.2.1 Forming a policy team and appointing a turnaround manager 110
Contentsvi

7.2.2 Key policy decisions for the initiation phase 1137.2.3 Selecting a preparation team 1147.2.4 Collecting the job lists and other data 114
7.3 Phase 2: Preparing the turnaround 1147.3.1 Analyzing and validating the workscope 1147.3.2 Freezing the worklist 1167.3.3 Preparing task specifications 1167.3.4 Identifying pre-shutdown work 1167.3.5 Defining contractor work packages and
selecting contractors 1207.3.6 Creating the work schedule 1207.3.7 Techniques for creating a schedule 1207.3.8 Optimizing the schedule 1237.3.9 Forming the turnaround organization 1237.3.10 Defining the site logistics 1257.3.11 Formulating a cost estimate 1257.3.12 Formulating a safety plan 1267.3.13 Formulation of the quality plan 1277.3.14 Briefing of all turnaround personnel 127
7.4 Phase 3: Executing the turnaround 1287.4.1 The shutdown of the plant 1287.4.2 Carrying out the turnaround tasks 1297.4.3 Defining and costing the extra work 1297.4.4 Defining and costing additional work 1297.4.5 Monitoring progress, productivity, safety, quality
and expenditure 1297.4.6 Starting up the plant 130
7.5 Phase 4: Terminating the turnaround 130
Part 4 Spare parts management 135
8 Spare parts management 1378.1 Introduction 1388.2 Outline of the stores operation 1398.3 Inventory policy 142
8.3.1 Inventory policy for fast-moving spares 1428.3.2 Inventory policies for the control of slow-
moving spares 1458.4 Management of repairable equipment (rotables) 150
8.4.1 Introduction 1508.4.2 The rotable system 1508.4.3 Rotable inventory policy: the theory 1538.4.4 Rotable inventory policy: in practice 155
8.5 Inventory policy guidelines 1558.6 Stores documentation 156
Contents vii
8.7 Stores organization 1608.8 Stores and rotable performance indices 1618.9 Summary 162
Part 5 Documentation 165
9 Maintenance documentation systems: what they are and how they work 1679.1 Introduction 1689.2 A functional model 1689.3 Plant inventory (Module 1) 1709.4 Information base (Element 2) 1729.5 Preventive maintenance schedule (Module 3) 1779.6 Condition monitoring (Module 4) 1799.7 Short-term work planning (Module 5) 1809.8 Long-term work planning (Module 6) 1829.9 Maintenance control (Module 7) 1859.10 Summary 187
10 Computerized maintenance information systems: their uses and problems 18910.1 Introduction 19010.2 Computerized documentation: historical background 19010.3 The benefits of computerized maintenance information
systems 19310.4 The problems with computerized maintenance information
systems 19510.5 Summary 196
Part 6 Case study 199
11 Case study: Maintenance audit of an agricultural chemical plant 20111.1 Introduction 20211.2 An overview of Fertec A 20211.3 Objectives 203
11.3.1 Comments on objectives 20411.4 Maintenance strategy 206
11.4.1 Plant-operating characteristics 20611.4.2 Ammonia plant maintenance strategy 206
11.5 Maintenance organization 21211.5.1 Introduction 21211.5.2 The maintenance resource structure 21211.5.3 The maintenance administrative structure 215
Contentsviii

11.6 Work planning systems 21711.6.1 Short-term work planning, scheduling and control 21711.6.2 The planning of the major shutdowns 223
11.7 Spare parts management 22511.7.1 Introduction 22511.7.2 Outline of the stores organization and systems 225
11.8 Maintenance control 22611.8.1 The control of overall maintenance performance 22611.8.2 The control of organizational efficiency 22611.8.3 The control of maintenance effectiveness (plant
reliability control) 22711.9 Documentation 227
11.9.1 Comments and recommendations 228
Appendix: Weibull analysis 229A.1 Weibull analysis of item lifetime 229A.2 Weibull probability paper 232A.3 A Weibull analysis of a large and complete sample of
times-to-failure 232
Index 235
Contents ix

This page intentionally left blank
Preface
Maintenance Systems and Documentation is the third of three companion books cov-ering material which has been developed (and updated) from my 1997 publicationsMaintenance Strategy and Maintenance Organization and Systems, which were sub-sequently expanded and converted into distance-learning units which comprised thefirst half of a 2-year Masters program offered by an Australia and a UK university.
The main approach adopted throughout all three books, and which determines thedirection and content of all the material, is that of business-centered maintenance(BCM), the starting point of which is the identification of the business aims. These arethen translated into the maintenance objectives which, in their turn, are used to under-pin the formulation firstly of strategy (the subject of Book 1, Strategic Maintenance
Planning, viz. the planning aspects of maintenance management), secondly of thedesign of the appropriate organization (the subject of Book 2, Managing Maintenance
Resources, viz. the doing aspects of maintenance management), and finally the creationof the necessary systems (the subject of this book, viz. the controlling aspects).
Because the material has come from a distance-learning program all three books con-tain numerous review questions (with answers), exercises and case studies – these lasthaving been selected to ensure coverage of the care of physical assets across a widerange of industries (process, mining, food, power generation and transmission, etc.). Inaddition, every chapter has its own clearly specified objectives and learning outcomes –as well as a route map which enables the reader to see where the chapter is in relationto the rest of the topics covered.
Although the BCM approach integrates all three books into a unified maintenancemanagement methodology, I have tried to ensure that each one can stand alone, i.e. bestudied and understood in isolation from its companion works. It is therefore inevitablethat there is some overlap, viz.:
● To explain the principles and concepts of BCM, the same case study (of a food pro-cessing plant) is used at the beginning of each book.
● To illustrate the linkage between maintenance planning, organization and systems, afull audit of a chemical plant is presented at the end of each book.
The overall aim of each book is to provide managers of physical assets with a betterunderstanding of the operation of the maintenance function, an understanding whichwill enable them to identify problems within their own organization and prescribe effec-tive solutions. As asserted by Henry Mintzberg (Managers Not MBAs, Financial Times,Prentice Hall, 2004):
What managers really need from a course or a book is insight – theories or mod-
els that enable them to make sense of practice, learn from experience and reach
better judgements.
The provision of such insight is the over-riding purpose of these three books.
Managing Systems and Documentation, the third book of the series, addresses the mainsystems that are necessary for the successful operation of a maintenance organization. The

book identifies the key maintenance systems (e.g. performance control, work control, doc-umentation, etc.) and, for each one, shows:
● How it can be mapped and modeled.● Its function and its operating principles.● The main problems encountered in its operation.
Chapter 1 is the key section, setting the maintenance organization within the contextof BCM (the principles and concepts of which are explained via a case study of a foodprocessing plant). Chapter 2 then identifies the main systems and shows them withinthe context of a company organization. Chapter 3 describes maintenance budgeting andits linkages with the costing system. Chapter 4 outlines the main maintenance controlsystems, and deals with the use of performance indices. Chapter 5 covers the key main-tenance information system, viz. work planning and work control, this providing muchof the information for the successful operation of the other systems.
Chapters 6 and 7 describe, respectively, the theory and then the practice of the plan-ning and control of major shutdowns. Chapter 8 provides a comprehensive and detailedcoverage of the management of spare parts. Chapter 9 looks at the function, principlesand concepts of maintenance documentation systems. Chapter 10 reviews the advan-tages and problems of using computerized maintenance documentation systems, and inChapter 11 this book concludes with a case study showing how the maintenance sys-tems of a company can be audited in order to identify their problems.
Anthony Kelly
Prefacexii

Acknowledgments
Firstly, I wish to acknowledge a special gratitude to John Harris who has edited thecomplete text, made a contribution to Chapter 8 and provided Appendix. I also thankTom Lenehan who contributed the major part of Chapter 7.
Thanks also go to the people in industry, most recently: Bill Sugden, Ian Peterson,Gudmunder Bjornason, Leonard Bouwman, Kevin Hardman, Nigel Beard and manyothers who provided access to their plants and without whose help this book could nothave been written.
Finally, I thank Vicky Taylor for typing the text and Denise Jackson for producing theartwork.

This page intentionally left blank

Author’s biography
Dr. Anthony Kelly served a trade apprenticeship before obtaining a first degree inmechanical engineering from the University of Wales and a Masters Degree (in corrosionengineering) from the University of London. He then held several industrial positions, inwhich he was responsible for the management of maintenance resources, before joining,in 1969, the University of Manchester, UK, where he specialized in maintenance man-agement, its teaching and research, and obtained his doctorate for a thesis on mainte-nance organizational design. Dr. Kelly has published numerous technical papers andseven textbooks which have been translated into several languages.
Over the last 15 years Dr. Kelly has run his own consultancy partnership, operatingworldwide and carrying out more than 60 major investigations and audits of a wide vari-ety of industrial activities: mining, power generation and distribution, chemical processing,manufacturing, building services, etc. Over the last 15 years he has also held visiting/indus-trial professorships at Central Queensland University (Australia), University of Stellenbosch(South Africa) and Hogskolen i Stavanger (Norway).

This page intentionally left blank

PART 1
Introductory chapters

This page intentionally left blank
A business-centered approach to maintenance systems1
‘Good plans shape good decisions. That’s why good planning helps to
make elusive dreams come true.’
Lester Bittel (1929)
Chapter aims and outcomes
To explain the business-centered maintenance (BCM) procedure and show how it canbe used to understand, develop and modify (if necessary) the maintenance systemsfor a complex industrial plant.
On completion of this chapter you should be able to:
● understand the methodology of BCM and why it is called ‘business-centered’;● understand that maintenance strategy is concerned with deciding how to maintain
the plant, setting up an appropriate maintenance organization and developing therequired systems;
● understand how the BCM methodology can be used to map and model the main-tenance department of an industrial plant in order to improve the maintenance systems – the strategic thought process.
Chapter route map
Book divisions
Introductory chapters
Budgeting and control
Work planning andwork control
Spare partsmanagement
Documentation
Case study
This chapter in the division
Chapter 1A business-centeredapproach tomaintenance systems
Chapter 2Introduction tomaintenancemanagement systems
Chapter topics
1.2 Business-centered maintenance
1.3 An example of the application of BCM: background
1.4 Part A: Audit of the FPP maintenance department
1.5 Part B: An alternative maintenance strategy for continuous operation
1.6 Part C: A longer-term view of organizational change
1.7 The strategic thought process
1.1 Introduction
1.1 Introduction
As explained in the preface, this is the third of three companion books on maintenancemanagement. In Book 1, Strategic Maintenance Planning, we dealt with the identifica-tion of objectives and the formulation of the maintenance strategy. In Book 2, Man-
aging Maintenance Resources, we dealt with the maintenance organization. Here, weshall examine the documentation and control systems that are needed for carrying outmaintenance management. Before doing so – and for the benefit of those who may nothave read Book 1 or 2, it is important to recall the overall BCM methodology, whichwas described as:
. . . a framework of guidelines for deciding maintenance objectives, formulating
equipment life plans and plant maintenance schedules (Maintenance Planning),
designing the maintenance organisation (Maintenance Doing) and setting up
appropriate systems of documentation and control (Maintenance Control).
and secondly to outline (via a case study) the concepts, procedures and models of allthree of these areas of maintenance management.
1.2 Business-centered maintenance
The structure of a methodology for developing a maintenance strategy – which I callthe business-centered maintenance (BCM) approach – is outlined in Figure 1.1. It isbased on well-established administrative management principles (see Figure 1.2) andprovides a framework for identifying, mapping and then auditing the elements of anymaintenance management system.
In order to better understand the purpose of Figure 1.1 it is useful to put yourselfin the position of a maintenance manager thinking through how he is going toset up a maintenance department for a new plant. Obviously he needs to under-stand the way the plant operates, its relationship with its market and the functionof maintenance within this context. The large circle is his strategic thoughtprocess starting with the plant maintenance objective (which is subordinate tothe business objectives) and proceeding via life plans and organization through
Maintenance Systems and Documentation4
Key words
● Business-centered maintenance● Maintenance systems● Maintenance documentation● Maintenance auditing● Strategic thought process
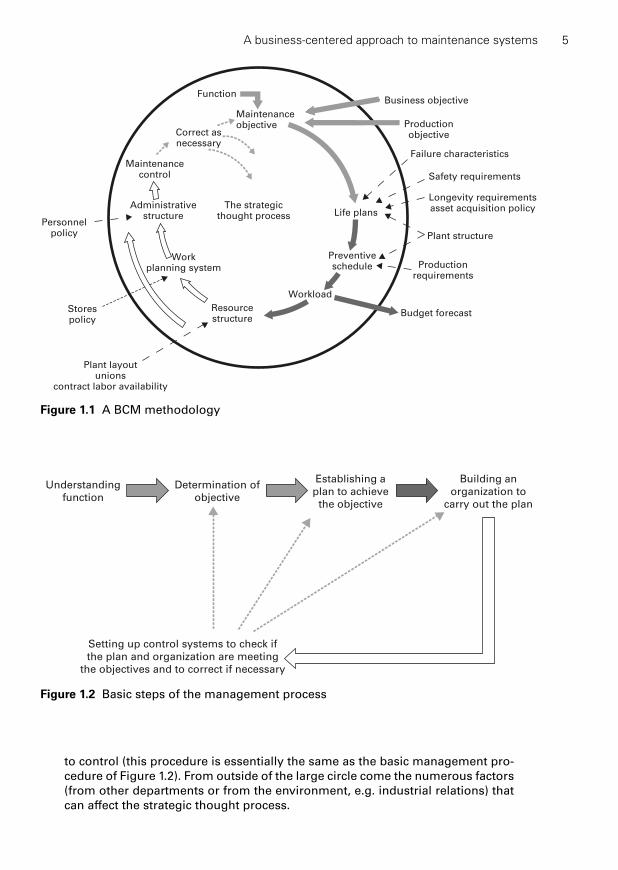
to control (this procedure is essentially the same as the basic management pro-cedure of Figure 1.2). From outside of the large circle come the numerous factors(from other departments or from the environment, e.g. industrial relations) thatcan affect the strategic thought process.
A business-centered approach to maintenance systems 5
Function
Maintenanceobjective
Correct asnecessary
Maintenancecontrol
Administrativestructure
Workplanning system
Resourcestructure
Workload
Preventiveschedule
Life plansPersonnel
policy
Stores policy
Plant layoutunions
contract labor availability
Budget forecast
Productionrequirements
Plant structure
Failure characteristics
Safety requirements
Productionobjective
Business objective
The strategicthought process
Longevity requirementsasset acquisition policy
Figure 1.1 A BCM methodology
Understanding
function
Determination of
objective
Establishing a
plan to achieve
the objective
Building an
organization to
carry out the plan
Setting up control systems to check if
the plan and organization are meeting
the objectives and to correct if necessary
Figure 1.2 Basic steps of the management process

1.3 An example of the application of BCM: background
A more detailed and comprehensive explanation of BCM may be gained by referring toan industrial application, in this case its use in auditing the maintenance department ofa food processing plant (FPP).
The plant layout was shown in Figure 1.3 and an outline process flow diagram beingshown in Figure 1.4. At the time of the audit the production pattern was three shifts perday, 5 days per week, 50 weeks per year. There was also considerable spare capacity.
Maintenance Systems and Documentation6
Four canning linesMechanical
workshop
(c) (d)
Electrical
workshop
(e) (f)
Code:
(a) Shift fitters
(b) Shift electricians
(c) Day fitters, machinists
(d) Welders
(e) Day electricians
(f) Day instrument technicians
Batch conditioning
and mixing
Raw material
processing plant
Main offices
Canning
Hydros (cooking)
Labelling
Packaging
Palletizing
Maintenance
shift
workshop
(a)
Electrical
shift
workshop
(b)
Input goods
store
Main parts
store
A B C D
Finished store
and despatch
Figure 1.3 Layout of FPP
Pattern of operation 50 weeks x 5 days x 3 shifts, Monday/Friday
Raw materialinput andstorage
Raw materialprocessing
Can
nin
g
Hyd
ros
Lab
ellin
g
Packag
ing
Palleti
zin
g
Batchconditioningand mixing
Finishedgoodsstore
Marketdemand for
product
Line A
Line B
Line C
Line D
Figure 1.4 Process flow for FPP

For example, only three lines out of four (see Figure 1.4) were needed to achieve fullcapacity. However, each line had its own product mix to satisfy the market demand.Thus, the availability of any given line for maintenance depended on the marketdemand and the level of finished product stored. Offline maintenance could be carriedout in the weekend windows of opportunity or, by exploring spare capacity, during theweek. In general, the maintenance manager found it easier to carry out most of theoffline work during the weekend.
The relationship between the plant and the market demand for its product(and/or raw material supply) has a considerable influence on maintenance strat-egy. It governs the way production will use the plant, the plant operating pattern.This in turn determines the frequency, duration and cost of scheduling the plantfor offline maintenance, maintenance windows.
The market demand is different across different industries. For example, base-load power stations (stations that provide the cheapest electricity) are requiredto operate for as long as possible because of a constant and continuousdemand. The FPP of this example is a multi-product company where the demandfor each product may well vary with time, often seasonally.
The problem the company faced was that they wanted to increase their output byusing the weekends for production and by operating each line for as long as possible.Experience had led to the feeling that each line could operate continuously for about 4weeks before coming out, for two shifts, for maintenance. The company wanted toknow how this was going to affect their maintenance strategy and the following taskswere requested:
A To audit their existing maintenance department in order to compare it to interna-tional best practice.
B To propose an alternative maintenance strategy that would facilitate the new modeof continuous operation.
C To provide an organizational vision (via models) of where the company should beheading in the next 5 years.
The audit of the FPP (task A above) will be used to provide a detailed and com-prehensive explanation of BCM. This will include descriptions of each of themain elements of BCM, e.g. objectives, and will also introduce a number ofgeneric models that can be used to map and understand the operation of theseelements. You may find it necessary during your progress through the audit torefer back to the master diagram of Figure 1.1. It is important as you progressthrough the audit that you consider how you would modify the organization tocomply with tasks B and C above – the answer to these tasks will be incorporatedinto this section as exercises.
1.4 Part A: Audit of the FPP maintenance department
The audit procedure follows the main elements of the methodology model shown inFigure 1.1.
A business-centered approach to maintenance systems 7

1.4.1 Maintenance objectives
At plant level this could be stated as being:
to achieve the 15-shift operating pattern, product mix and output (cans/week)
within the accepted plant condition for longevity and safety requirements, and at
minimum resource cost.
It is the responsibility of the production, safety, and engineering departments to spec-ify the plant requirements, and the maintenance department to develop the strategy toachieve these requirements at minimum cost.
If the maintenance department were to develop the ‘best way of maintaining the plant’the maintenance objectives needed to be interpreted in a form that is meaningful at alower level of equipment, the plant unit – a hydro, say, or the cooker (see Figure 1.5).This allowed the maintenance life plans for the various units of plant to be established.
The audit established that the FPP were using a management-by-objectives(MBO) procedure. Business objectives were set, and translated into mainte-nance objectives by the chief engineer. These in turn were translated into keyresult areas (KRAs) which, rather than being objectives, were a series of futureactions to achieve the maintenance objectives. The auditors considered the pro-cedure to be excellent but the KRAs were not well enough directed toward main-tenance objectives and were not sufficiently numerical.
Maintenance Systems and Documentation8
Hydro maintenanceobjectives
Plant maintenance objectives
HydrosCanningMixersOtherunits
Unitlevel
Plant level
Corporate objectiveProduction requirements
Safety requirements
Longevity requirements
Compatibility
• To achieve the user requirements (availability, safety, longevity, etc.) at lowest cost
Food processingplant
Figure 1.5 Bringing plant maintenance objectives to unit level
1.4.2 Life plans and preventive schedule
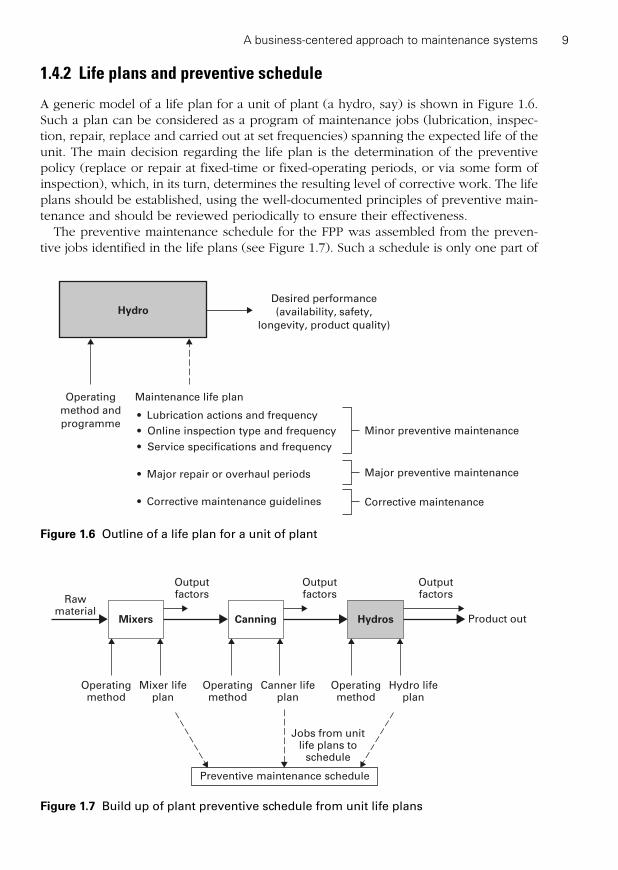
A generic model of a life plan for a unit of plant (a hydro, say) is shown in Figure 1.6.Such a plan can be considered as a program of maintenance jobs (lubrication, inspec-tion, repair, replace and carried out at set frequencies) spanning the expected life of theunit. The main decision regarding the life plan is the determination of the preventivepolicy (replace or repair at fixed-time or fixed-operating periods, or via some form ofinspection), which, in its turn, determines the resulting level of corrective work. The lifeplans should be established, using the well-documented principles of preventive main-tenance and should be reviewed periodically to ensure their effectiveness.
The preventive maintenance schedule for the FPP was assembled from the preven-tive jobs identified in the life plans (see Figure 1.7). Such a schedule is only one part of
A business-centered approach to maintenance systems 9
HydroDesired performance
(availability, safety,
longevity, product quality)
Maintenance life plan
• Major repair or overhaul periods
• Corrective maintenance guidelines Corrective maintenance
Operating
method and
programme• Lubrication actions and frequency
• Online inspection type and frequency
• Service specifications and frequency
Minor preventive maintenance
Major preventive maintenance
Figure 1.6 Outline of a life plan for a unit of plant
Mixers Canning
Outputfactors
Outputfactors
Product out
Rawmaterial
Outputfactors
Operatingmethod
Mixer lifeplan
Operatingmethod
Canner lifeplan
Operatingmethod
Hydro lifeplan
Jobs from unitlife plans to
schedule
Preventive maintenance schedule
Hydros
Figure 1.7 Build up of plant preventive schedule from unit life plans

the maintenance workload and has to be carried out in conjunction with the correctivework which has a shorter scheduling horizon – and often higher priority (sometimesrestricting the maintenance department’s ability to carryout corrective work – an aspectwhich will be discussed in more detail when we come to work planning).
The schedule is influenced by the production plan, which itself is a function of themarket demand (multi-product fluctuating demand requiring a flexible productionplan), operating pattern, plant redundancy, inter-stage and final stage storage, etc. Inthe FPP case the important factor was the operating pattern which gave six-shift-week-end windows and a 2-week annual window that provided enough time to carry out thenecessary preventive (and corrective) work without affecting the production plan.
In spite of the criticism of the objectives the unit life plans investigated weregood, e.g. see Table 1.1 for the life plan for the hydro. The work content of thehydro overhauls (the major maintenance) was based on the monitoring andinspection of condition. The frequency of the overhauls, once every 8 years, wasdetermined only via an experience-based, and approximate, judgment. Never-theless, it did give an indication of the future major workload and its resourcescheduling and budgeting. The preventive schedule was based on the schedulingguidelines outlined in Table 1.2. This meant that most of the second-line work was
Maintenance Systems and Documentation10
Weekly Cleaning, check operation of critical parts, 4 hours Minor worklubrication.
2 weekly/ Lubrication routine. 4 hoursmonthly
3 monthly Inspection of main drive to include oil analysis. 8 hours
6 monthly Inspection of all flights and conveyor drives. 3 shiftsClean hydro internally. Oil analysis of conveyor drives.
12 monthly Fixed time replacement of sprocket bearings. 1 weekOverhaul drive unit and rewind motors.
2 yearly Replace with speed drive belts. 1 week
8 yearly Major rebuild. Exact frequency on condition. 3 weeks Major work
Table 1.1 Outline the hydro life plan
Maintenance philosophy Work type
Monday ‘Keep the plant going’ and ‘Keep an Reactive maintenanceto Friday eye on its condition’ Operator monitoring routines
Trade-force line-patrolling routinesCondition-based routines
Weekends ‘Inspect the plant carefully and Schedule corrective jobs by priorityrepair as necessary in order to Inspect and repair schedulekeep it going until next weekend’ Fixed-time minor job schedule
(services, etc.)
Summer ‘Schedule out the major jobs to see Schedule corrective jobsshutdown us through another year’ Fixed-time major jobs schedule
Table 1.2 Scheduling guidelines for the FPP

carried out at weekends. Little attempt had been made to schedule this latterwork into the weekend, by exploiting spare capacity.
(Life plans and preventive schedules are covered in depth in Strategic Maintenance
Planning, ISBN 07506 69926.)
1.4.3 Workload
The maintenance schedule generates the maintenance workload (see Figure 1.1). Themechanical workload for the FPP is mapped in Figure 1.8 by its scheduling characteris-tics (the electrical workload can be mapped in the same way). First-line work is madeup from emergency jobs (which can be defined as work needing to be carried out inthe shift of its occurrence) and jobs (corrective or preventive) that are small and do notrequire detailed planning – they can be ‘fitted in’.
It can be seen that this work is carried out during the shifts over Monday toFriday. Management had manned up the shift resource to ensure all the emer-gency work received attention during the shift of its occurrence.
Second-line work involves the larger preventive jobs (services, small overhauls, etc.)and corrective jobs that require planning and, via a priority system can be scheduled tobe carried out at weekend (or in some other available window).
A business-centered approach to maintenance systems 11
100
20
10
Fitters
Shift
Day
Weekendinternal capacity
Shift capacity
Minor plannedmaintenance
Corrective
Preventive
Top up withcontract labor
etc.
N M A N M A N M A, etc.
M T W Th F S Su
Plant running Weekendwindow
First-line workload Second-line workload
Emergency Maintenance
Summershutdownwindow
Third-line workload
100
Emergency maintenance
Figure 1.8 Workload profile for fitters

When the weekend workload exceeded the internal weekend resource (two ofthe four shift-groups – 20 fitters) contract labor was used to cover the excess.
Third-line work involves major plant (or parts of the plant) overhauls. It requires theplant to be offline for considerable periods and is carried out at medium or long-termintervals – in the FPP case in the annual 2-week windows. The planning lead time forsuch work can be many months.
A more detailed categorization of a maintenance workload is shown in Table 1.3.
The audit revealed a 50% over-manning on the mid-week shifts, caused by lackof clear definition of emergency work – much of which could have been carriedout at the weekends as planned second-line work.
1.4.4 Maintenance organization
The workload is the biggest single influence in the size and shape of the maintenanceorganization. At the FPP the first-line emergency work required shift cover and theyearly shutdown peak required contract labor. Designing the organization requiresmany interrelated decisions to be made (where to locate manpower, how to extendinter-trade flexibility, who should be responsible for spare parts, how to decide theresponsibilities for plant operation and maintenance), each influenced by various con-flicting factors. Thinking in terms of the methodology of Figure 1.1 reduces the com-plexity of this problem, by categorizing the decisions according to the main elements ofthe organization, viz. its resource structure, its administrative structure, its systems andthen considering each one in the order indicated – the procedure is iterative.
Resource structureThe resource structure is the geographic location of workforce, spares, tools and infor-mation, their function, composition, size and logistics. Figure 1.9, e.g. shows the Mondayto Friday structure that had evolved at the FPP, to best suit the characteristics of a 24-hourfirst-line emergency workload. The emphasis is on rapid response, plant knowledge viaspecialization, shift working and team working with production. In theory, the shift-groups had been sized to match the reactive workload with the lower-priority jobs beingused to smooth the workload. The weekday centralized group carried out second-linework to include weekend preparation, reconditioning and also acted as a first-line workoverspill for the shift-groups.
Figure 1.10 shows the structure that matched the second-line weekend workload. Theshift roster was arranged to ensure that two of the four shift-groups are available for 12hours on Saturdays and Sundays (to include some overtime). Contract labor was used totop-up, as necessary the internal labor force. A similar approach was used for the annualshutdown, but in that case the contracted workforce exceeded the internally availablelabor. The spare parts store and tool store was an integral part of the resource structureand in this case both were centralized, serving the whole site.
The resource structure, e.g. see Figure 1.9, can be regarded as a simple matrix ofplant specialization against work category (first line, second line, etc.). To enable
Maintenance Systems and Documentation12

A business-centered approach to maintenance systems 13
Main Category
category Subcategory number Comments
First line Corrective 1 Occurs with random incidence and little warning
emergency and the job times also vary greatly. A typical
emergency workload is shown in Figure 1.8. This is
a workload generated by operating plant, the pattern
following the production-operating pattern (e.g.
5 days, three shifts per day, etc.). Requires urgent
attention due to economic or safety imperatives.
Planning limited to resource cover and some job
instructions or decision guidelines. Can be offline
or online (in-situ corrective techniques). In some
industries (e.g. power generation) failures can
generate major work, these are usually infrequent
but cause large work peaks.
Corrective 2 Occurs in the same way as emergency corrective
deferred work but does not require urgent attention; it can be
minor deferred until time and maintenance resources are
available (it can be planned and scheduled). During
plant operation some small jobs can be fitted into an
emergency workload such as that of Figure 1.8
(smoothing).
Preventive 3 Short periodicity work, normally involving inspections
routines and/or lubrication and/or minor replacements. Usually
online and carried out by specialists or used to smooth
an emergency workload such as that of Figure 1.8.
Second Corrective 4 Same characteristics as (2) but of longer duration
line deferred major and requiring major planning and scheduling.
Preventive 5 Involves minor offline work carried out at short- or
services medium-length intervals. Scheduled with time
tolerances for slotting and work smoothing purposes.
Some work can be carried out online although most is
carried out online during weekend or other shutdown
windows.
Corrective 6 Similar to deferred work but is carried out away
reconditioning from the plant (second-line maintenance) and
and fabrication usually by a separate trade-force.
Third Preventive 7 Involves overhauls of plant, plant sections of major
line major work units. Work is offline and carried out at medium- or
(overhauls, long-term intervals. Such a workload varies in the
etc.) long term as shown in Figure 1.8. The shutdown
schedule for large multi-plant companies can be
designed to smooth the company shutdown
workload.
Modifications 8 Can be planned and scheduled some time ahead. The
modification workload (often ‘capital work’) tends to
rise to a peak at the end of the company financial
year. This work can also be used to smooth the
shutdown workload.
Table 1.3 Detailed categorization of maintenance workload by organizational characteristics

Maintenance Systems and Documentation14
First-linemaintenance
Partsstore
Production
Area 1(services,
raw materials)
Shift operatingteam 1
Area 2(batching,mixing)
Shift operatingteam 2
Area 3(canning,cooking)
Shift operatingteam 3
Area 4(packaging)
Shift operatingteam 4
Support whole siteOverload viacascade
Shifts � 4
Contractors asnecessary
Toolstore
Second-line weekdaymaintenance
10
Electricians
(e)
4
Instrument
(f)
4
Fitters
(c)
2
Welders
(d)
Support whole site
Days
Support whole site
(a) (a) (a) (a)
2 Fitters 2 Fitters 2 Fitters
2 Electricians2 Fitters2 Riggers
(b)(a)
2 Fitters
Workload cascade
Callout
Reconditioning
Figure 1.9 Weekday resource structure
Toolstore
Partsstore
Internal laborfrom shift-
group(two groups
per weekend)
Plannedmaintenance
group(some plant
modernization)
Area 3(canning,cooking)
Area 2(batching,mixing)
Area 1(services,
raw materials)
Support whole site
Area 4(packaging)
Machine shopsupport
Contract laboras necessary
Figure 1.10 Weekend resource structure (second-line weekend)

the structure to be drawn it is necessary to construct the horizontal axis as theplant line, i.e. the division of the plant into its main process areas, and the verticalaxis as the work-type line, i.e. operations above the plant line and maintenancework categories below the plant line. In this case the complete structure (weekdayand weekend) could have been drawn on the same diagram. It would have thenbeen necessary to explain on the diagram how the shift teams related into theweekend teams. Resource structures provide an outline of the way in which main-tenance resources are used; they need to be supplemented by a description oftrade flexibility, contract usage, shift rostering and human factors, etc.
The aim of any resource structure design (or modification) is to achieve the best resourceutilization for a desired speed of response and quality of work. This, in part, involves thebest match of the resources to the workload. Decisions in a number of other areas (e.g.in shift rostering, the use of contract labor, inter-plant flexibility, inter-trade flexibility andproduction-maintenance flexibility) can influence this matching process. Flexibility isclearly the key factor here. The structure is also influenced by the availability of trade-force skills and by various human factors.
The FPP audit revealed a number of deficiencies in the resource structure. Themost important was the over-manning of the mid-week shifts (see the workloadcomments). The audit was carried out 13 years ago and it is not surprising thatinter-trade flexibility, production-maintenance flexibility and contractor allianceswere not being exploited. Human factors such as morale, motivation and asense of equipment ownership were good.
Administrative structureThis can be considered as a hierarchy of work roles, ranked by their authority andresponsibility for deciding what, when and how maintenance work should be carried out.The FPP structure is shown in Figure 1.11 (which uses the so-called organogram as themodeling vehicle). Many of the rules and guidelines of classical administrative theory canbe used in the design of such structures. The model shows the maintenance administra-tion in the context of the full administration – simplified in this case. The key decisions inthe design of the maintenance administration can be divided between its upper and lowerstructures. Regarding the former the audit must identify how the responsibilities for plantownership, operation, maintenance have been allocated. In the FPP case, production hadresponsibility for the operation of the plant, and in a sense its ownership, since they dic-tated how it was to be used and when it could be released for maintenance. Maintenancehad responsibility for establishing and carrying out the maintenance strategy, and engi-neering for plant acquisition and plant condition standards. These responsibilities have tobe clearly defined and overlapping areas identified.
Initially, the lower structure has to be considered separately from the upper becauseit is influenced – indeed, almost constrained – by the nature of the maintenance resourcestructure which, as explained, is in turn a function of the workload. Lower structure deci-sions are concerned with establishing the duties, responsibilities and work roles of theshop floor personnel and of the first level of supervision.
The FPP was using the traditional supervisor – planner – trade-force structure.This needs to be compared with the more recent structures of self-empowered
A business-centered approach to maintenance systems 15

operator–maintainer shift teams and self-empowered second-line maintenanceteams (see Chapter 11).
(Maintenance organization is covered in depth in Managing Maintenance Resources,ISBN 07506 69934.)
1.4.5 Maintenance work planning
Figure 1.12 outlines a maintenance work planning system for the FPP resource andadministrative structure previously shown. The design of this should aim to get the rightbalance between the cost of planning the resources and the savings in direct and indi-rect maintenance costs that result from use of such resources.
It can be seen that the planning system is designed around the resource structure ithas a shift planning system (first line), a weekend planning system (second line) and anannual shutdown planning system (third line – not shown in detail). The audit mustidentify how well each level of planning is being carried out. At each level there are keyprocedures to verify, e.g. at FPP’s second level:
● How good is the information base in terms of standard job procedures, spare partlist, history?
● Who identifies the job method for monitoring jobs?
Maintenance Systems and Documentation16
Plant manager
Chief engineer
Project section
Storemen Electricians (10) (e)
Instrument (4) (f)
Production manager
[Operators]
Shift team
Maintenance planning
supervisor
Electrical
supervisor
Workshop
supervisor
Shift
supervisors
(�4)
Shift
product
managers
(�4)
Maintenance
manager
Stores
foreman
Mechanical
planning
officer
Electrical
planning
officer
Electrical
foreman
Control
technician
Workshop
foreman
(e) (d)
Shift
managers
(�3)
Foremen
(many)
Fitters
Electricians
Riggers
(�4)
(10)(a)
(2)(b)
(3)(a)
Figure 1.11 Administrative structure
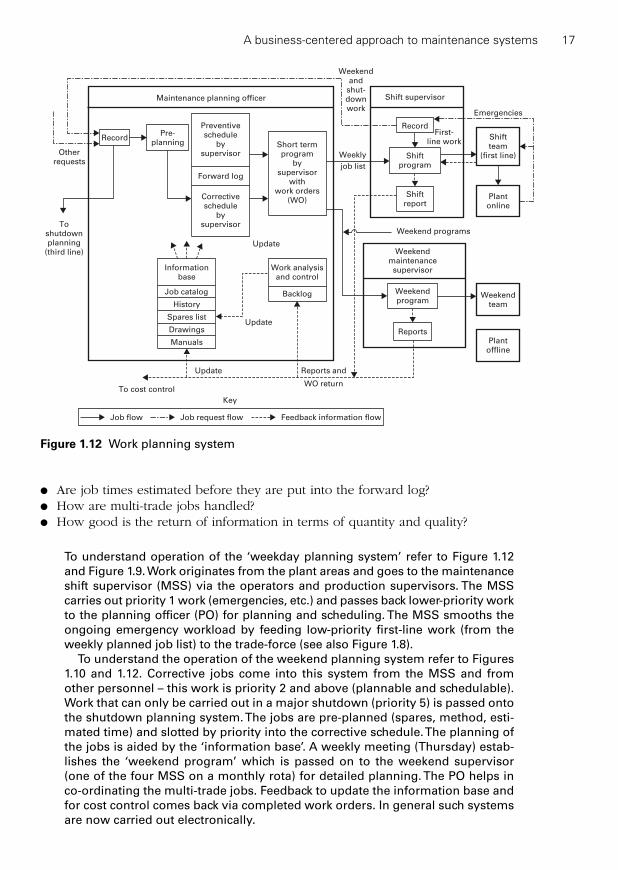
● Are job times estimated before they are put into the forward log?● How are multi-trade jobs handled?● How good is the return of information in terms of quantity and quality?
To understand operation of the ‘weekday planning system’ refer to Figure 1.12and Figure 1.9. Work originates from the plant areas and goes to the maintenanceshift supervisor (MSS) via the operators and production supervisors. The MSScarries out priority 1 work (emergencies, etc.) and passes back lower-priority workto the planning officer (PO) for planning and scheduling. The MSS smooths theongoing emergency workload by feeding low-priority first-line work (from theweekly planned job list) to the trade-force (see also Figure 1.8).
To understand the operation of the weekend planning system refer to Figures1.10 and 1.12. Corrective jobs come into this system from the MSS and fromother personnel – this work is priority 2 and above (plannable and schedulable).Work that can only be carried out in a major shutdown (priority 5) is passed ontothe shutdown planning system. The jobs are pre-planned (spares, method, esti-mated time) and slotted by priority into the corrective schedule. The planning ofthe jobs is aided by the ‘information base’. A weekly meeting (Thursday) estab-lishes the ‘weekend program’ which is passed on to the weekend supervisor(one of the four MSS on a monthly rota) for detailed planning. The PO helps inco-ordinating the multi-trade jobs. Feedback to update the information base andfor cost control comes back via completed work orders. In general such systemsare now carried out electronically.
A business-centered approach to maintenance systems 17
Key
Maintenance planning officer
Pre-planning
RecordShort termprogram
bysupervisor
withwork orders
(WO)
Work analysisand control
Backlog
Informationbase
Job catalog
History
Spares list
Drawings
Manuals
Toshutdownplanning
(third line)
Otherrequests
Update
Weekendmaintenancesupervisor
Weekendprogram
Reports
Emergencies
Weekend programs
Weekly
job list
Update Reports and
WO return
Weekendand
shut-downwork
To cost control
Update
Preventiveschedule
bysupervisor
Forward log
Correctiveschedule
bysupervisor
Shiftteam
(first line)
Plantonline
Weekendteam
Plantoffline
Shift supervisor
Record
Shiftreport
Shiftprogram
First-line work
Job request flowJob flow Feedback information flow
Figure 1.12 Work planning system

Figure 1.13 shows the work control system, which is complementary to the workplanning system, its main function being to control the flow of work (preventive andcorrective) via a job priority procedure and via the feed-forward of information aboutfuture resource availability. At the FPP a number of performance indices were beingused to assist this process, viz.:
● Total man-days in the forward log.● Man-days in the forward log by priority.● Man-days in the backlog.● Percent planned work completed per period.● Percent of preventive work completed per period.
The audit revealed that the FPP’s work planning system was satisfactory for whatwas essentially a weekly planning system, the work is planned during the weekfor the weekend. It was my opinion that the work planning system (and the asso-ciated software) would have to be up-rated if major jobs were to be planned atshort notice during the week (see Section B of this case study).
(Work planning is covered in depth in Chapters 5–7.)
Maintenance Systems and Documentation18
Outstandingwork list
by supervisor or work groups
(man hours/man-days, etc.)
Workcontrol
Contractlabor
Labormarket
Weekendplanned
Workcompleted
Weekend
planned
work
Weekendmaintenance
crews
Update
Temporary
labor
adjustment
Information on
resource available less
holidays and sickness
Preventiveschedule(job time
estimated)
Second-line job input(job times estimated)
(Corrective jobs)
5
2
Increasingpriority
Information on:
• Total outstanding workload by priority (5, 4, 3 and 2)
• Workload profile (workload against time) Note: Average weekly
input of correctiveand modification jobs
�
Average %scheduled
preventive jobs
Average weekendoutput of jobs
Increase internal labor force
Current level(total man-days)5
4
3
2
Key
Feedback on work complete
Labor controlWork input and output
Figure 1.13 Principles of work control
1.4.6 Maintenance control system
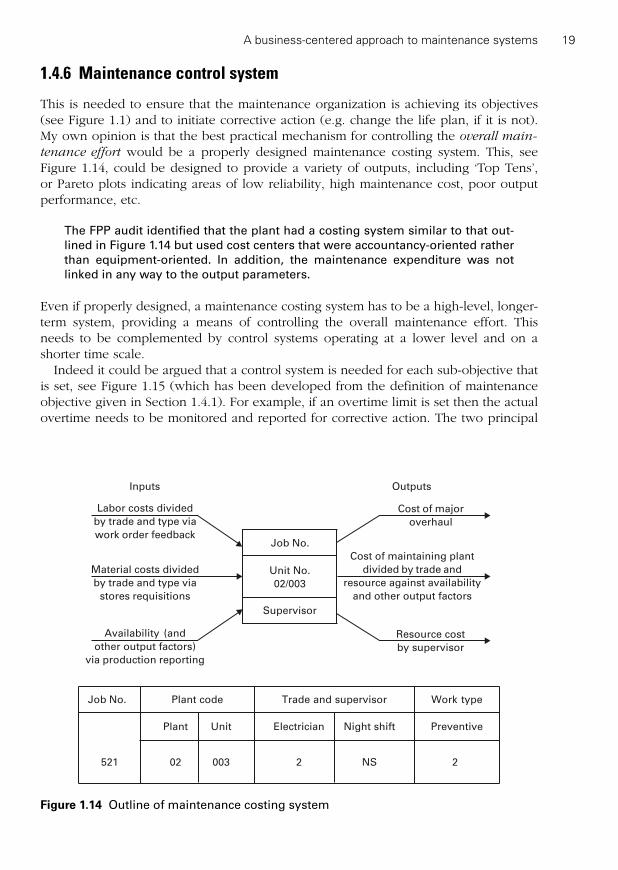
This is needed to ensure that the maintenance organization is achieving its objectives(see Figure 1.1) and to initiate corrective action (e.g. change the life plan, if it is not).My own opinion is that the best practical mechanism for controlling the overall main-
tenance effort would be a properly designed maintenance costing system. This, seeFigure 1.14, could be designed to provide a variety of outputs, including ‘Top Tens’, or Pareto plots indicating areas of low reliability, high maintenance cost, poor outputperformance, etc.
The FPP audit identified that the plant had a costing system similar to that out-lined in Figure 1.14 but used cost centers that were accountancy-oriented ratherthan equipment-oriented. In addition, the maintenance expenditure was notlinked in any way to the output parameters.
Even if properly designed, a maintenance costing system has to be a high-level, longer-term system, providing a means of controlling the overall maintenance effort. Thisneeds to be complemented by control systems operating at a lower level and on ashorter time scale.
Indeed it could be argued that a control system is needed for each sub-objective thatis set, see Figure 1.15 (which has been developed from the definition of maintenanceobjective given in Section 1.4.1). For example, if an overtime limit is set then the actualovertime needs to be monitored and reported for corrective action. The two principal
A business-centered approach to maintenance systems 19
Plant code
Plant
02
Unit
003
Trade and supervisor
Electrician
2
Night shift
NS
Work type
Preventive
2
Job No.
521
Job No.
Supervisor
OutputsInputs
Cost of major
overhaul
Unit No.
02/003
Cost of maintaining plant
divided by trade and
resource against availability
and other output factors
Resource cost
by supervisor
Availability (and
other output factors)
via production reporting
Material costs divided
by trade and type via
stores requisitions
Labor costs divided
by trade and type via
work order feedback
Figure 1.14 Outline of maintenance costing system

Maintenance Systems and Documentation20
Main
ten
an
ce p
rod
ucti
vit
y
(rati
o o
f to
tal m
ain
ten
an
ce
co
st
to m
easu
red
ou
tpu
t fa
cto
rs)
Main
ten
an
ce e
ffecti
ven
ess
Ho
w e
ffecti
ve is t
he p
lan
t m
ain
ten
an
ce l
ife
pla
n in
pro
vid
ing
th
e u
ser
req
uir
em
en
t?
(rati
o o
f p
reven
tive c
ost
to m
easu
red
ou
tpu
t fa
cto
rs)
Ma
inte
na
nce
org
an
iza
tio
n e
ffic
ien
cy
Ho
w o
rga
niz
ati
on
ally
eff
icie
nt
is t
he
ma
inte
na
nce
de
pa
rtm
en
t in
ca
rry
ing
ou
t th
e w
ork
loa
d a
t o
pti
ma
l co
st?
(ra
tio
of
lab
or
co
st
to p
lan
t re
pla
ce
me
nt
va
lue
)
Availability
Failures per period
Injuries per period (safety)
Equipment integrity index (safety)
Wastage due to product quality
Plant condition
Index (related to age)
Preventive
man-hours
per period
(%) Unplanned work
Utilization
(%) Rework
Material cost
labor cost
Prod-Main flexibility index
Inter-trade flexibility index
Index internal vs contract
hours per period
Total labor
cost per period
Performance
Overtime
Absenteeism
Sickness
etc.
etc.
etc.
Trade-force
efficiency
Stores
efficiency
Turnover (%)
Stock level
etc.
Stockout costs
Planned work
Total work
Job delay ratio
Forward log (man weeks)
Average weekly trade-force size
Work planning
efficiency
Percent planned work
completed per period
Fig
ure
1.1
5H
iera
rch
y o
f m
ain
ten
an
ce p
erf
orm
an
ce in
dic
es
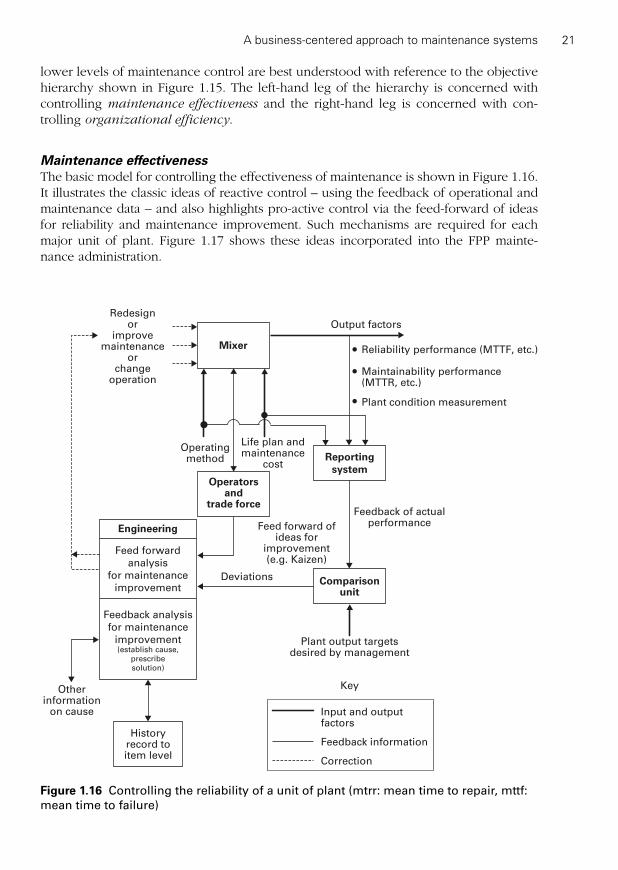
lower levels of maintenance control are best understood with reference to the objectivehierarchy shown in Figure 1.15. The left-hand leg of the hierarchy is concerned withcontrolling maintenance effectiveness and the right-hand leg is concerned with con-trolling organizational efficiency.
Maintenance effectivenessThe basic model for controlling the effectiveness of maintenance is shown in Figure 1.16.It illustrates the classic ideas of reactive control – using the feedback of operational andmaintenance data – and also highlights pro-active control via the feed-forward of ideasfor reliability and maintenance improvement. Such mechanisms are required for eachmajor unit of plant. Figure 1.17 shows these ideas incorporated into the FPP mainte-nance administration.
A business-centered approach to maintenance systems 21
Key
Redesignor
improvemaintenance
orchange
operation
Output factors
Reliability performance (MTTF, etc.)
Maintainability performance(MTTR, etc.)
Plant condition measurement
Feedback of actualperformance
Comparisonunit
Plant output targetsdesired by management
Historyrecord toitem level
Otherinformation
on cause
Deviations
Feedback analysis
for maintenance
improvement(establish cause,
prescribe
solution)
Feed forward
analysis
for maintenance
improvement
Engineering Feed forward ofideas for
improvement(e.g. Kaizen)
Reportingsystem
Life plan andmaintenance
cost
Operatingmethod
Operatorsand
trade force
Mixer
Input and outputfactors
Feedback information
Correction
Figure 1.16 Controlling the reliability of a unit of plant (mtrr: mean time to repair, mttf:mean time to failure)

Main
tenance S
yste
ms a
nd D
ocum
enta
tion
22
Plant manager
Chief engineer Production manager
Maintenance
managerProject section
Plant
history
Shift managers
(�3)
Shift product
managers
(4)
Packaging
foremen
Packaging
operatives
Identify cause
and
prescribe solution
Planning
supervisor
(maintenance
support)
Identify cause
and
prescribe solution
Area 4
packaging
Packaging
fitters
Feedback o
f
relia
bility
pro
ble
ms
Second-level
reliability
control
Third-level
reliability
control
Feedback of major
reliability problems
Linkage to original
equipment manufacturer
First-level
reliability
control
(design out
problems)
Feedback ofreliability problems
Maintenance
shift supervisor
Identify cause
and
prescribe solution
First-level control Second-level control Third-level control
Figure 1.17 A model of plant reliability control in the FPP organization
The audit showed that the first-level system was not working well. In the 1980sfew companies had incorporated the ideas of continuous improvement andequipment ownership at the trade-force/operator level of an organization.Considerable design-out maintenance effort was in evidence at the second levelthrough the project engineers although they were not helped by the poor history/data recording.
Maintenance organizational efficiencyThe prime organizational objective is outlined in Figure 1.15 and can be defined inmore detail as:
to carry out a given plant maintenance workload (governed by the life plans) atminimum cost, by using maintenance resources (man, spares, tools) in the mostefficient way.
However, a single objective for organizational efficiency is somewhat fanciful. The bestapproach is through a series of sub-objectives (or performance indices) as shown inFigure 1.15.
The auditors could find no such objectives/indices in use on the FPP.
(Maintenance control is discussed in depth in Chapter 4.)
1.4.7 Maintenance documentation
Figure 1.1 indicated that some forms of formal documentation system – for the collection,storage, interrogation, analysis and reporting of information (schedules, manuals, draw-ings or computer files) – are needed to facilitate the operation of all the elements of main-tenance management. Figure 1.18, a general functional model of such a system (whethermanual or computerized), indicates that it can be seen as comprising seven principalinterrelated modules (performing different documentation functions). Considerable cleri-cal and engineering effort is needed to establish and maintain certain of these functions(e.g. the plant maintenance information base). The control module, in particular, relies onan effective data collection system. Almost all of the companies that I now audit havecomputerized maintenance documentation systems.
The best way of understanding the generic functional documentation model ofFigure 1.18 is to start with the plant inventory (Module 1). This is a coded list ofthe equipment that has to be maintained, e.g. a mixer (see Figure 1.4). The essen-tial maintenance information needed to maintain the mixer (and the other unitslisted in the inventory) is held in the information base (Module 2), e.g. life plans,history, spares lists, etc. The preventive work listed in the life plans of the variousequipment is carried out via the preventive and inspection schedules (Modules 3and 4). This work and the corrective and modification work are fed into the ‘short-term work planning system’ (Module 5) and where there are major shutdowns intothe ‘long-term work planning system’ (Module 6). The feedback of informationfrom the work planning system provides maintenance control (Module 7) andalso updates the information base.
A business-centered approach to maintenance systems 23

The large double arrows in Figure 1.18 indicate the possible linkages between the main-tenance documentation system and other company information systems viz.:
● Maintenance costing to financial management.● Spare parts list to stores management.● Work planning to shutdown scheduling (e.g. Primavera).● Work planning to condition monitoring.
The majority of the systems I have audited have these functions connected, i.e. electronically – in fact, the most recent audit involved an integrated package – all thefunctions are on the same database. An audit needs to investigate each of the mainmodules of Figure 1.18, and also the sub-functions within each module, e.g. the spareparts list. In addition, it needs to identify the level and degree of integration with theother company functions.
Maintenance Systems and Documentation24
Inspectionschedule (4)
(condition monitoring)
Trade forceperformance
control
Cost
control
Maintenancecontrol (7)
Plantreliabilitycontrol
Sparesusagehistory
Maintenance information base (2)for plant units
Modifications
Correctivemaintenance
(some via inspections)
Maintenanceschedule (3)
Plantinventory
(1)
Trade forcehistory
Cost andavailability
history
Planthistory
Plantspares
list
Planttechnicalrecords
Plant manualsand drawings
Stores system
Long-termplanning (6)(networks)
Short-termwork planning(5) (work order
system)
Execution
Reports
Allocation
Work
Work
order out
order in
Life plans
Standardjob catalog
Operatingprocedures
Key
Control informationInformation flowJob flow
Figure 1.18 A functional model of a maintenance documentation system

The maintenance package at the FPP was a stand-alone computerized system.The audit revealed that this was satisfactory for the weekend planning systemthat was then being used (i.e. 13 years ago). For its time the plant informationbase was good and was being kept up to date (history excepted).
(The basics of maintenance documentation are covered in depth in Chapter 9 and com-puterized documentation in Chapter 10.)
1.4.8 Audit summary
A business-centered methodology, in conjunction with models and procedures thatdescribes in more detail each of its elements, has been used as a framework to audit themaintenance department.
The audit revealed a number of problems, in particular, shift over-manning caused bylack of clear definition and measurement of the shift emergency maintenance work. Inaddition, the organization needed modification – improved inter-trade flexibility, thecreation of operator–maintainer self-empowered teams, closer production-maintenanceintegration – to bring it up to international benchmark levels.
Review Questions
R1.1 You have been asked by your Managing Director to explain in a conciseway what exactly is BCM. Write down an explanation-keep it as short aspossible.
R1.2 Define maintenance strategy.R1.3 Consider how the ‘market demand for the product/service’ and/or the
‘supply of raw materials’ can affect the maintenance strategy for the fol-lowing physical asset systems:(a) A sugar refinery.(b) A petroleum refinery.(c) A local passenger bus fleet.
1.5 Part B: An alternative maintenance strategy for continuousoperation (see Table 1.4)
The existing maintenance strategy at the FPP was based on carrying out offline mainte-nance during the weekend windows of opportunity and during the once-per-year hol-iday window.
Little attempt had been made to exploit the excess capacity of the plant, or spareplant to schedule offline work while the plant was operating. The new, continuous,operating pattern meant that offline maintenance would have to be carried out in thisway. Indeed, the life plans and schedule would have to move in the direction indicatedin Table 1.4. This, in turn, would change the workload pattern as indicated in Table 1.4.
A business-centered approach to maintenance systems 25

Exercises
E1.1 From the above comments it will be realized that immediate organizationalchanges are needed to match the new mode of operation (continuousoperations for up to 4 weeks before a three shift shutdown of one line foressential maintenance).
Outline a revised resource structure to match the new plant operatingpattern and workload (the existing resource structure is shown in Figures1.9 and 1.10). Modify the administrative structure to cope with anychanges made to the resource structure (at this stage limit the changes toonly those necessary to cope with the changed operating pattern).
E1.2 How would the new mode of operation affect the work planning system?Advise management on any changes required.
1.6 Part C: A longer-term view of organizational change
(This section uses the guideline solutions to Exercise E1.1 therefore it is advisable toanswer Exercise E1.1 before reading this section.)
The organization outlined in the guideline solution to Exercise E1.1 (see Figures 1.20and 1.21) – or in your own solutions – incorporated the immediate changes necessaryfor continuous operation. Their purpose was to allow the company to increase the plantavailability (and output) while holding the resource costs steady. It may well be that
Maintenance Systems and Documentation26
● The first-line work would extend to 21 shifts per week. However, investigation of themechanical emergency workload had revealed considerable over-manning.
When the first-line work was defined as the work that must be carried out during the
shift of its occurrence and subsequently activity sampled, it was shown that it could becarried out by five fitters.
● The second-line work (line shutdowns, unit shutdown, preparation for shutdown,services, inspection) was more difficult to forecast in terms of pattern and size. Themain peaks would come during line shutdowns at a frequency of about once per weekfor two shifts. The size of the workload was unlikely to decrease (even with betterpreventive maintenance) because the plant was going to be more heavily utilized.
● The third-line major work could still be carried out during the holiday window.● A movement toward shutdowns of complete sections of plant based on the longest
running time of critical units (e.g. the hydros – about 4 weeks). The frequency of theseshutdowns will, as far as possible be based on running hours or cumulative output.However, for critical items, inspection and condition monitoring routines may be usedto indicate the need for shutdowns, which will provide more flexibility about shutdowndates.
● All plant designated as non-critical, e.g. as a result of spare capacity, will continue tobe scheduled at unit level (e.g. the smaller mixers).
● A much greater dependence on formalized inspections and condition monitoringroutines, for reasons given in (a) and also to detect faults while they are still minor andbefore they become critical.
● A concerted effort either to design out critical items (short life or poor reliability) or toextend their effective running time.
Table 1.4 Changes in maintenance strategy to accommodate continuous operation

with the experience of operation the size of the day-group of artisans will be reduced.However, in the medium and long term, when this organization is benchmarked againstthe best of international standards within the food processing industry, further improve-ments can also be identified (see Exercise E1.3).
Exercise
E1.3 Provide the management of the FPP with a model of a maintenance organ-ization (a resource structure and administrative structure) that will bringthem up to international benchmark levels.
In order to answer this question you may need to carry out a literaturesearch of FPP maintenance organizations (or use your own experience).
1.7 The strategic thought process
The case study has shown that the maintenance department requires managerial strate-gic analysis in the same way as any other department. The thought process that wasinvolved is indicated in Figure 1.19. It starts with the sales–production reaction to mar-ket demand, the resulting change in the plant operating pattern and the increased plantoperation time. This, in turn, requires amended maintenance life plans and a modifiedmaintenance schedule. Thus, the maintenance workload changes, which brings in trainthe need to modify the maintenance organization and systems.
A business-centered approach to maintenance systems 27
Maintenancecontrol systems
Administrativestructure
Workplanningsystem
Resourcestructure
Productionrequirements
change
Production objective
Business objectives
Maintenanceobjective
Maintenancefunction
Maintenancelife plan and
schedule
Maintenanceworkload
Salesrequirements
change
The strategic
thought process
Figure 1.19 The influence of the market demand on maintenance strategy
Understanding and applying this type of strategic through process is the cornerstone
of effective and fruitful maintenance management analysis [1,2].
Review Questions
R1.4 The sales department of the FPP wanted to increase output and the pro-duction department agreed to this. Can you explain the effect this had onthe following:● unit life plans;● preventive maintenance schedule;● maintenance workload;● maintenance organization.
R1.5 From your answer to R1.4 and using Figure 1.19 explain the concept of the‘strategic maintenance management though process’.
References
1. Wilson, A., Asset Maintenance Management, Conference Communication, Farnham,2000.
2. Mather, D., The Maintenance Scorecard, Industrial Press, New York, 2005.
Maintenance Systems and Documentation28
Review Questions Guidelines
R1.1 Any decision involving the way maintenance is carried out should take into con-sideration its effect on the company’s bottom line. For example, a reorganiza-tion might influence company profitability through changes in plant availabilityand maintenance resource costs.
R1.2 A maintenance strategy involves the complete maintenance management pro-cedure which includes setting maintenance objectives, determining the pre-ventive maintenance schedule and setting up the maintenance organization.
R1.3 (a) The supply of raw cane sugar is seasonal lasting about 6 months over theSummer/Autumn period. Sugarcane has a short storage life and has to beprocessed shortly after cutting. The maintenance strategy of a sugar refineryis based on maintaining the plant over the 6-month sugarcane growing sea-son to ensure high plant availability over the 6-month plant-refining period.
(b) Petroleum refineries are mostly production limited, and involve high capitalcost plant. The maintenance strategy is concerned with maintaining theplant during agreed shutdowns to achieve the longest possible production-operating period.
(c) A local passenger bus fleet provides a service rather than a product. Majormaintenance is carried out using the ‘spare buses in the fleet’. Minor mainte-nance is carried out in the low bus demand periods (the maintenance windows).
R1.4 This is explained clearly in the notes in Section 1.7.R1.5 See Section 1.7 and Figure 1.19.

A business-centered approach to maintenance systems 29
Figure 1.20 Maintenance resource structure for continuous operation
Exercise Guideline Solutions
E1.1 To match the new workload pattern the maintenance organization would alsoand have to change. The most likely resource structure (see Figure 1.20) would beE1.2 based on a first-line, 21 shift-group (the mechanical manning per shift being
reduced to five fitters) and a second-line day-group of 15 fitters operating 5days per week. This, in turn, would require a change the administrative struc-ture as shown in Figure 1.21.
Because of the changes in the way the work would be scheduled (the mid-week work peaks would occur at relatively short notice via the condition moni-toring of the lines) it was also necessary to advise management that their workplanning system would need to be improved, in order to be far more flexibleand dynamic.
Parts
store
Production Shift operating
team 1
Shift operating
team 2
Shift operating
team 3
Shift operating
team 4
1 Fitter 1 Electrician
Support whole site
Shifts � 5
4 Fitter/Mach.2 Welders4 Lubricators4 Apprentices
13 Electricians4 Instrumenttechnicians7 Apprentices
Support whole site
Contractors for
shutdowns
as necessary
Tool
store
First-line
maintenance
Second-line weekday
maintenance
Days Days
Support whole site
1 Fitter 1 Fitter 1 Fitter 1 Fitter
Area 1
(services,
raw materials)
Area 2
(batching,
mixing)
Area 3
(canning,
cooking)
Area 4
(packaging)
15 Fitters2 Riggers

Maintenance Systems and Documentation30
Production and
First-line
maintenance(shifts x 5)
SEPOT 1(self-empowered
plant-oriented
team 1)
Area 1
SEPOT 2
Area 2
SEPOT 3
Area 3
SEPOT 4
Area 4
Elect. Team X
Mech. Team X
Elect. Team Y
Mech. Team Y
Workshop
team
Support whole site
Some first-line maintenance
second-line maintenance
Days Days Days
Contractors for shutdown and
reconditioning as required
Support whole site
Parts
store
Tool
store
Figure 1.22 Organizational vision: resource structure
E1.3 A proposed improved maintenance organization is shown in Figure 1.22(resource structure) and Figure 1.23 (administrative structure). The proposalsincorporate the following actions:● The introduction of self-empowered plant-oriented operator–maintainer
teams.● The introduction of self-empowered trade teams.● Increase in the number of engineers, plant located for maintenance support.
Chief engineer
Project section
Production manager
Electricalsupervisor
Mechanicalsupervisor
Maintenancemanager
Controltech
Shift managers
Plant manager
Storesforeman
Maintenance supportsupervisor
Schedulers(Elect � Mech)
Instrument(4) tech.
Electrical(13)
PlantEngineers
(2)
Electricalforeman
Filters (15)Riggers (2)
Plantmaint.
foreman
Shiftforeman
Shiftteams �5
Welders (2)Machinists (4)Lubricators (4)
Workshopforeman
Foremen(many)
Areamanagers
Second-lineworkshop
maintenance
First-linemaintenance
Second-line plant maintenance
Filters 1Electricians 1
Operators
Figure 1.21 Maintenance administrative structure for continuous operation

A business-centered approach to maintenance systems 31
Chief engineer
Project section
Production manager
Maintenance supportsupervisor
Maintenancemanager
Storesteam
SchedulersElect./Mech.
E/IMaint.
Team X
Shift managers
Plant manager
PlantEng.
Area 1
(to improve life plans,reliability improvement
and systems)
PlantEng.
Area 2
PlantEng.
Area 3
PlantEng.
Area 4
E/IMaint.
Team Y
(Self-empowered teamsoperating on a staggered
day shift)
Mech.Maint.
Team X
Mech.Maint.
Team Y
WorkshopTeam
Area 1Manager
Area 1Self-
empoweredplant-oriented
teams (to include40% trade skilled)
Area2
Area3
Area4
As Area 1
Shifts � 5
Operation andfirst-line maintenance
Second-line maintenance
Figure 1.23 Organizational vision: administrative structure

This page intentionally left blank

Introduction to maintenance management systems 2
‘Always design a thing by considering it in its next larger context –
a chair in a room, a room in a house, a house in an environment,
an environment in a city.’
Eliel Saarinin
Chapter aims and outcomes
To show how an industrial company can be modeled as an open system made up ofnumerous interacting subsystems.
On completion of this chapter you should be able to:
● understand how all management systems, and subsystems, need a control function;● understand that the maintenance department is a subsystem of the company
system;● identify the other key company level subsystems, e.g. stores, that can have a direct
affect on the performance of the maintenance subsystem;● identify the key ‘maintenance systems’, e.g. work planning, that are needed to
enable the maintenance department to perform its function.
Chapter route map
Book divisions
Introductory chapters
Budgeting and control
Work planning andwork control
Spare parts management
Documentation
This chapter in the division
Case study
Chapter 1A business-centeredapproach tomaintenance systems
Chapter 2Introduction to maintenancemanagement systems
Chapter topics
2.1 The companyexpressed as a hierarchic systemsmodel
2.2 Identifying themaintenance systems

2.1 The company expressed as a hierarchic systems model
A better understanding of organizations may be obtained through the so-called systems
approach. In this, organizations can be viewed as open systems taking inputs from theirenvironments and transforming them – by a series of activities and with some objectivein view – into outputs (see Figure 2.1) [1].
Open system: An open system is in continual interaction with its environmentand achieves a steady state whilst still retaining the capacity for work (transfor-mation). The system is open in the sense it can react not only to the direct ‘inputsand outputs’ but also changes in the environment surrounding it.
Maintenance Systems and Documentation34
Key words
● System control● Hierarchic systems model● Holism● General systems theory
Management system
Government
Customers
Demand for product
Skills availability
Unions
Financial climate
New technology
Inputs Outputs
External influences
Raw material(meat, cereal, etc.)Financeinformation
Pet-food (multi-tinsize, multi-product)Waste productSafetyVariable marketdemand for eachproduct
Physical assetsManpowerSpares
Food processing plant
Figure 2.1 An organization producing pet-food, viewed as an open system
Figure 2.2 shows an extension of this systems model of a company to include a controlelement, the purpose of which is to monitor the system output, compare it to what isexpected and to redirect the company’s effort as necessary.
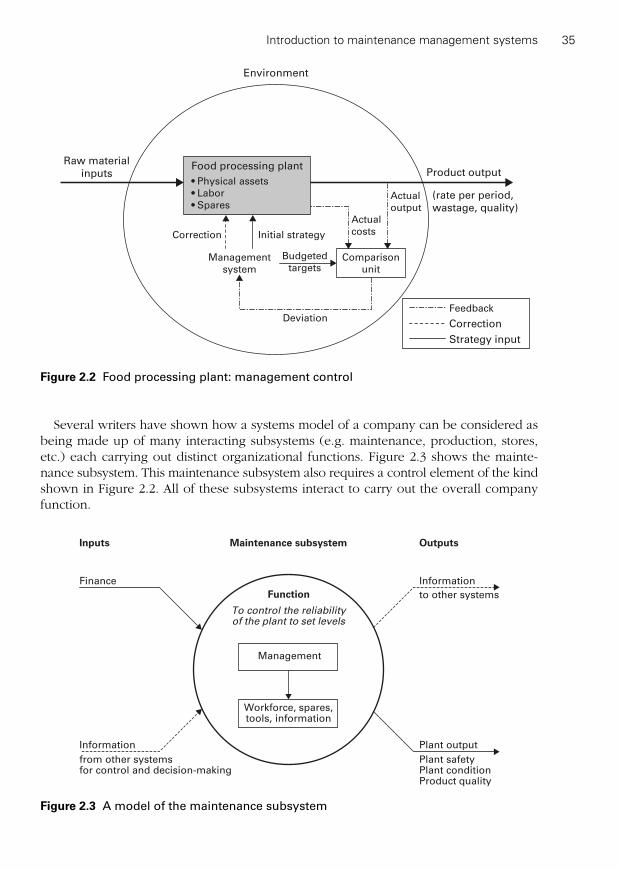
Several writers have shown how a systems model of a company can be considered asbeing made up of many interacting subsystems (e.g. maintenance, production, stores,etc.) each carrying out distinct organizational functions. Figure 2.3 shows the mainte-nance subsystem. This maintenance subsystem also requires a control element of the kindshown in Figure 2.2. All of these subsystems interact to carry out the overall companyfunction.
Introduction to maintenance management systems 35
Raw material
inputs Product output
Management
system
Budgeted
targets
Initial strategyCorrection
Actual
costs
Actual
output
Deviation
(rate per period,
wastage, quality)
Environment
Feedback
Correction
Strategy input
Comparison
unit
• Physical assets
• Labor
• Spares
Food processing plant
Figure 2.2 Food processing plant: management control
Management
Function
To control the reliabilityof the plant to set levels
Workforce, spares,tools, information
Inputs Maintenance subsystem Outputs
Finance
from other systemsfor control and decision-making
Information
to other systems
Plant output
Plant safetyPlant conditionProduct quality
Information
Figure 2.3 A model of the maintenance subsystem
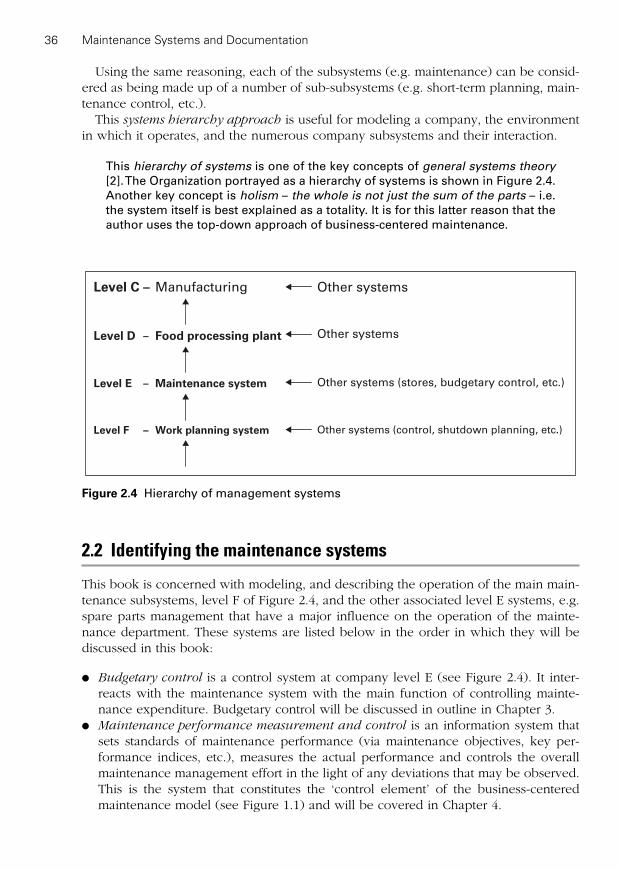
Using the same reasoning, each of the subsystems (e.g. maintenance) can be consid-ered as being made up of a number of sub-subsystems (e.g. short-term planning, main-tenance control, etc.).
This systems hierarchy approach is useful for modeling a company, the environmentin which it operates, and the numerous company subsystems and their interaction.
This hierarchy of systems is one of the key concepts of general systems theory
[2]. The Organization portrayed as a hierarchy of systems is shown in Figure 2.4.Another key concept is holism – the whole is not just the sum of the parts – i.e.the system itself is best explained as a totality. It is for this latter reason that theauthor uses the top-down approach of business-centered maintenance.
Maintenance Systems and Documentation36
Level C – Manufacturing Other systems
Other systems (stores, budgetary control, etc.)
Other systems (control, shutdown planning, etc.)
Other systemsLevel D Food processing plant–
Level E Maintenance system–
Level F Work planning system–
Figure 2.4 Hierarchy of management systems
2.2 Identifying the maintenance systems
This book is concerned with modeling, and describing the operation of the main main-tenance subsystems, level F of Figure 2.4, and the other associated level E systems, e.g.spare parts management that have a major influence on the operation of the mainte-nance department. These systems are listed below in the order in which they will bediscussed in this book:
● Budgetary control is a control system at company level E (see Figure 2.4). It inter-reacts with the maintenance system with the main function of controlling mainte-nance expenditure. Budgetary control will be discussed in outline in Chapter 3.
● Maintenance performance measurement and control is an information system thatsets standards of maintenance performance (via maintenance objectives, key per-formance indices, etc.), measures the actual performance and controls the overallmaintenance management effort in the light of any deviations that may be observed.This is the system that constitutes the ‘control element’ of the business-centeredmaintenance model (see Figure 1.1) and will be covered in Chapter 4.

● Plant reliability control is concerned with identifying equipment ‘hot spots’ (areas ofhigh maintenance cost or of low reliability), establishing root causes of problems andprescribing solutions to them. This system was outlined in Chapter 1 and will be cov-ered in detail in Chapter 4.
● Maintenance organizational efficiency control is an information system that is usedto measure and control the efficient use of the key maintenance resources (men,spares and tools), to be covered in Chapter 4.
● Short-term maintenance work planning and work control has the function of plan-ning, scheduling, allocating and controlling the execution of the short-term mainte-nance workload. This topic is covered in detail in Chapter 5.
● Long-term maintenance work planning and control (turnaround management) hasthe function of planning, scheduling, allocating and controlling the execution of themajor plant shutdowns (discussed in detail in Chapters 6 and 7).
● Equipment spares management is often managed outside the maintenance department(it can be regarded as a level E system of Figure 2.4) but is included in this bookbecause spare parts are the key maintenance resource. This is covered as one of themain topics of this book (Chapter 8).
● Maintenance documentation is an information system that can be regarded as thevehicle that allows the other maintenance systems to operate and interact and as suchis covered in detail in Chapters 9 and 10.
Exercise
E2.1 For your own company (or a company you can access), see how many ofthe systems listed in Section 2.2 you can identify?
References
1. Ackoff, R.L., Towards a system of systems concepts. Management Science, July 1971,pp. 661–671.
2. Kast, F.E. and Rosenzweig, J.E., Organisations and Management (3rd Ed), McGrawHill, Singapore, 1974.
Introduction to maintenance management systems 37

This page intentionally left blank

PART 2
Budgeting and control

This page intentionally left blank
Maintenance budgeting
3‘Annual income £20, annual expenditure £19.95, result happiness.
Annual income £20, annual expenditure £20.05, result misery.’
Charles Dickens
Chapter aims and outcomes
To explain the concepts and ideas of maintenance budgeting and the linkagesbetween the maintenance budget and the company budget.
On completion of this chapter you should be able to:
● understand that the company budget is a financial statement of its long- and short-termplans and that budgetary control is an integral part of the company’s managementcontrol process;
● appreciate that the maintenance budget is an essential element of the companybudget and that there is a need for a long-term maintenance budget (covering majorwork) and a maintenance expenditure budget;
● understand an outline procedure for building the maintenance budget and how theprocedure needs modification to suit different administrative structures.
Chapter route map
Book divisions
Introductory chapters
Budgeting and control
Work planning andwork control
Spare partsmanagement
Documentation
Case study
This chapter in the division
Chapter 3Maintenance budgeting
Chapter 4Maintenancemanagement control
Chapter topics
3.1 Introduction
3.2 Maintenance budgeting
3.3 The budgeting procedure
Maintenance Systems and Documentation42
3.1 Introduction
A systems model of an industrial company was shown in Figure 2.2. It incorporates themanagement control element, the function of which is to monitor the system outputs,compare these with what was expected, identify any deviation and then redirect thecompany’s effort as necessary. At company level ‘budgetary control’ is one of the keymanagement control mechanisms.
The preparation of a company budget can be regarded as an integral part of the com-pany planning process. Management are required to plan for production volumes tomeet forecasted sales demand (see Figure 2.2). This in turn requires a sales, productionand maintenance budget.
The budget can be regarded as the end point of the company’s planning process in asmuch as it is a ‘statement of the company’s objectives and plans in revenue and/or costterms’. It is a baseline document against which actual financial performance is measured.
In control terms, budgets are based on standard costs, which provide the expected(or planned) yearly expenditure profile. This expected expenditure is compared to theactual expenditures (cost control) and the variances (over- or under-budget) noted.Management then have information on which to base corrective action.
Usually, the word budget is taken to refer to a particular financial year. However, theannual budget is often the first year of a rolling long-term budget. For example, if acompany has a strategic 5-year plan it will normally align with a 5-year rolling financialbudget.
3.2 Maintenance budgeting
The need for a maintenance budget arises from the overall budgeting need of corpo-rate management and involves estimation of the cost of the resources (labor, spares,etc.) that will be needed in the next financial year to meet the expected maintenanceworkload. This is best explained via Figure 3.1 (which is extracted from the method-ology diagram of Figure 1.1). The maintenance life plans and schedule have been laid down to achieve the maintenance objective (which incorporates the productionneeds, e.g. operating pattern and availability) and in turn generates the maintenanceworkload.
Key words
● Budgeting● Zero-based budgeting● Standard costs● Profit center● Variance● Capital budget● Company revenue budget● Cost center

Maintenance budgeting 43
Typical examples of maintenance workloads are shown in Figures 3.2(a) and 3.2(b).A detailed categorization of the maintenance workload is shown in Table 3.1. Essentially,maintenance budgeting is the expression of this forecasted workload in terms of thecost of internal labor, contract labor and materials needed to deal with it.
It will be appreciated from Figure 3.2(a) that maintenance budgeting involves boththe ongoing workload and also the major workload (overhauls, equipment replacementand modifications).
Maintenanceobjective(start here)
Maintenancecontrol
Maintenanceorganization
Workload
Preventiveschedule
Life plans
Budget forecast
Corrective work(controlled by the preventive work)
Production requirements
(operating pattern, output, etc.)
Safety requirements
Production objective
Business objective
Longevity requirements
ControlInfluencing factorsStrategic thought process
Figure 3.1 Relationship between maintenance strategy and budgeting
100
1 3
Main
ten
an
ce r
eso
urc
es
Shutdown work
2
Years
First line Second line Third line(a)
First and Second-line work
Figure 3.2(a) Power station workload

Maintenance Systems and Documentation44
�250
Main
ten
an
ce r
eso
urc
e
1 3 4 5 50
Weekend-planned
maintenance
Weekday first-line maintenance
via shift coverEmergency
maintenance
Summer
shutdown
maintenance
10 on
each shift
Weeks
2
First line Second line Third line(b)
Figure 3.2(b) Food processing plant workload
It is important that the maintenance budget is set up to reflect the nature of the main-tenance strategy/workload. There is a need for a longer-term strategic maintenance
budget that covers Work Categories 7 and 8 of Table 3.1. Much of this major work involvescapital expenditure that can subsequently be depreciated by corporate management inthe revenue budgets. In the shorter term there is a requirement for an annual maintenance
expenditure budget that covers Work Categories 1–6 of Table 3.1. These costs feed intothe company revenue budget that operates over the financial year.
In plants requiring major shutdowns there is also the need for specific turnaround
budgets which are an integral part of the turnaround planning procedure (these will bediscussed in Chapter 7).
Review Question
R3.1 During his auditing experience the author has come across many compa-nies where maintenance budgeting is based on last year’s expenditureplus an allowance for inflation. What are the potential problems with thisapproach, and when can it be justified?
The maintenance budgeting procedure is facilitated by identifying plant cost centersand, where necessary, continuing the identification down to unit level. A cost center inan alumina refinery might be coded as follows:
Cost center Unit Unique unit numberDigestion area Bauxite mills
6 C 02
Over the designated financial period the actual maintenance cost (labor, spares,tools) are collected against these cost centers to enable cost monitoring andcontrol viz. ‘cost control’. Cost control is complimentary to budgeting and is dis-cussed in Chapter 4.
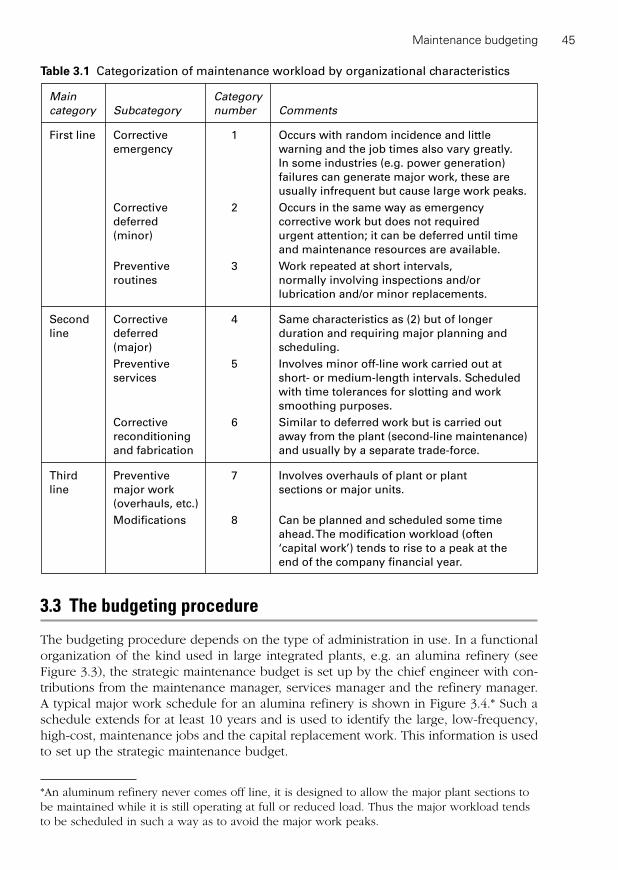
Maintenance budgeting 45
3.3 The budgeting procedure
The budgeting procedure depends on the type of administration in use. In a functionalorganization of the kind used in large integrated plants, e.g. an alumina refinery (seeFigure 3.3), the strategic maintenance budget is set up by the chief engineer with con-tributions from the maintenance manager, services manager and the refinery manager.A typical major work schedule for an alumina refinery is shown in Figure 3.4.* Such aschedule extends for at least 10 years and is used to identify the large, low-frequency,high-cost, maintenance jobs and the capital replacement work. This information is usedto set up the strategic maintenance budget.
*An aluminum refinery never comes off line, it is designed to allow the major plant sections tobe maintained while it is still operating at full or reduced load. Thus the major workload tendsto be scheduled in such a way as to avoid the major work peaks.
Main Category
category Subcategory number Comments
First line Corrective 1 Occurs with random incidence and little emergency warning and the job times also vary greatly.
In some industries (e.g. power generation)failures can generate major work, these areusually infrequent but cause large work peaks.
Corrective 2 Occurs in the same way as emergency deferred corrective work but does not required (minor) urgent attention; it can be deferred until time
and maintenance resources are available.
Preventive 3 Work repeated at short intervals, routines normally involving inspections and/or
lubrication and/or minor replacements.
Second Corrective 4 Same characteristics as (2) but of longer line deferred duration and requiring major planning and
(major) scheduling.
Preventive 5 Involves minor off-line work carried out atservices short- or medium-length intervals. Scheduled
with time tolerances for slotting and worksmoothing purposes.
Corrective 6 Similar to deferred work but is carried out reconditioning away from the plant (second-line maintenance) and fabrication and usually by a separate trade-force.
Third Preventive 7 Involves overhauls of plant or plant line major work sections or major units.
(overhauls, etc.)
Modifications 8 Can be planned and scheduled some timeahead. The modification workload (often‘capital work’) tends to rise to a peak at theend of the company financial year.
Table 3.1 Categorization of maintenance workload by organizational characteristics
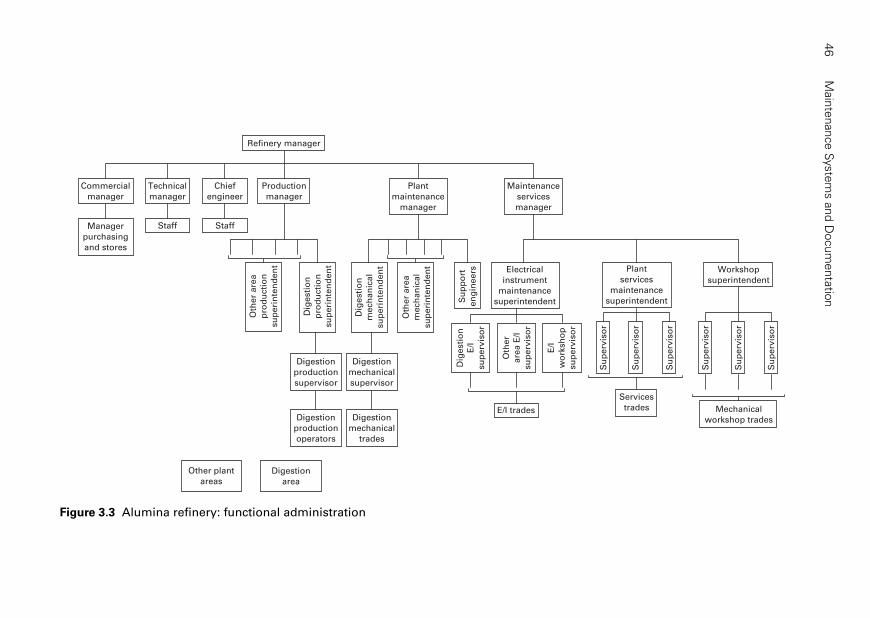
Main
tenance S
yste
ms a
nd D
ocum
enta
tion
46
Refinery manager
Commercial
manager
Manager
purchasing
and stores
Staff
Technical
manager
Staff
Chief
engineer
Production
manager
Dig
esti
on
pro
du
cti
on
su
peri
nte
nd
en
t
Dig
esti
on
mech
an
ical
su
peri
nte
nd
en
t Electrical
instrument
maintenance
superintendent
Plant
services
maintenance
superintendentSu
pp
ort
en
gin
ee
rs
Oth
er
are
a
pro
du
cti
on
su
peri
nte
nd
en
t
Oth
er
are
a
mech
an
ica
l
su
peri
nte
nd
en
tDigestion
production
operators
Other plant
areas
Digestion
mechanical
trades
Plant
maintenance
manager
Dig
esti
on
E/I
su
perv
iso
r
E/I
wo
rksh
op
su
perv
iso
r
Oth
er
are
a E
/I
su
perv
iso
r
Services
tradesE/I trades
Workshop
superintendent
Mechanical
workshop trades
Digestion
area
Su
perv
iso
r
Su
perv
iso
r
Su
perv
iso
r
Su
perv
iso
r
Su
perv
iso
r
Su
perv
iso
r
Digestion
production
supervisor
Digestion
mechanical
supervisor
Maintenance
services
manager
Figure 3.3 Alumina refinery: functional administration
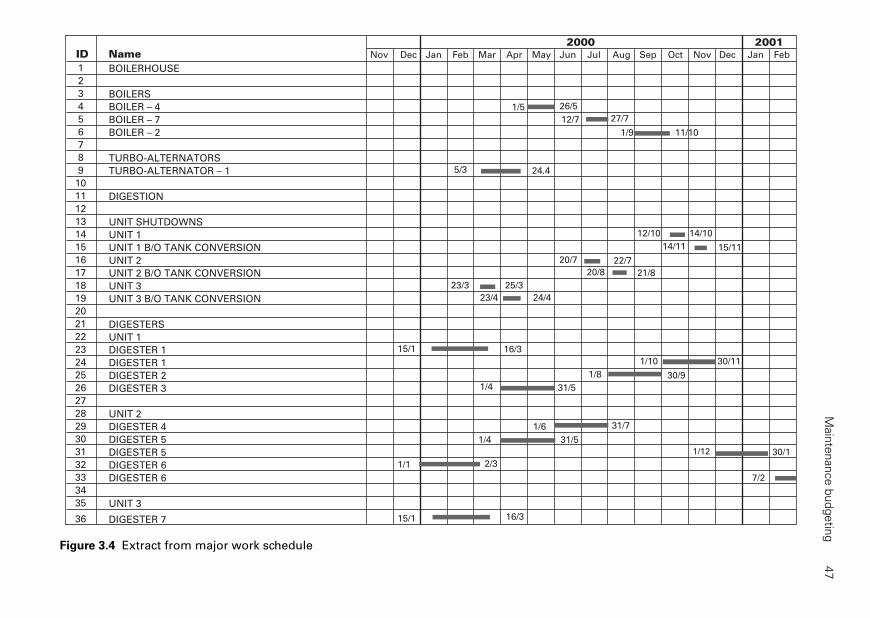
Main
tenance b
udgetin
g47
1
2
3
4
5
6
7
8
9
10
11
12
13
14
15
16
17
18
19
20
21
22
23
24
25
26
27
28
29
30
31
32
33
34
35
36
Nov Dec Jan Feb Mar Apr May Jun Jul Aug Sep Oct Nov Dec Jan FebID Name
BOILERHOUSE
BOILERS
BOILER – 4
BOILER – 7
BOILER – 2
TURBO-ALTERNATORS
TURBO-ALTERNATOR – 1
DIGESTION
UNIT SHUTDOWNS
UNIT 1
UNIT 1 B/O TANK CONVERSION
UNIT 2
UNIT 2 B/O TANK CONVERSION
UNIT 3
UNIT 3 B/O TANK CONVERSION
DIGESTERS
UNIT 1
DIGESTER 1
DIGESTER 1
DIGESTER 2
DIGESTER 3
UNIT 2
DIGESTER 4
DIGESTER 5
DIGESTER 5
DIGESTER 6
DIGESTER 6
UNIT 3
DIGESTER 7
2000 2001
1/5 26/5
12/7 27/7
1/9 11/10
5/3 24.4
12/10 14/10
14/11 15/11
20/7 22/7
20/8 21/8
23/3 25/3
23/4 24/4
15/1 16/3
1/10 30/11
1/8 30/9
31/51/4
1/6 31/7
1/4 31/5
1/12 30/1
1/1 2/3
15/1 16/3
7/2
Figure 3.4 Extract from major work schedule

Main
tenance S
yste
ms a
nd D
ocum
enta
tion
48
Stores
budget
Production
budgetOther budget
inputs
From
other areas
Maintenance budget
(plant maintenance
manager)
Mechanical
maintenance budget
(plant maintenance
manager)
E/I budget
(services manager)
Workshop and
services budget
(services manager)
Refinery budget
(refinery manager)
Clarification area
mechanical budget
(clarification mechanical
superintendent)
Digestion area
mechanical budget
(digestion mechanical
superintendent)
Electrical
maintenance budget
(E/I superintendent)
Instrument
maintenance
budget (E/I
superintendent)
Plant services
budget
(services
superintendent)
Mechanical
workshop budget
(workshop
superintendent)
Figure 3.5 Build up of refinery expenditure budget

The author has observed that most large process plants use some form of strate-gic maintenance budgeting which matches their long-term preventive schedule(e.g. see the power station workload of Figure 3.2(a)). He has also noticed thatsome food processing plants/breweries do not use strategic maintenance budgets.This is because their maintenance strategies are based on simple routines andinspections (a ‘wait and see’ maintenance policy) – they do not schedule long-term major maintenance or, in some cases, the replacement of capital equip-ment. To say the least, the author is surprised.
The major work schedule of Figure 3.4 also includes some of the shorter frequencymaintenance work which, in conjunction with the maintenance routines and services,is also covered in the annual maintenance expenditure budget. The annual budget isbuilt up from the budget for each plant and workshop. For example, the mechanicalmaintenance for the digestion area can be estimated, from the expected area workload,by the digestion mechanical superintendent, translated into resources needed, and addedto similar estimates from other plant areas and disciplines (see Figure 3.5).
Budgeting for the preventive work (Categories 3 and 5) is relatively straightforward.Corrective work (Categories 1, 2, 4 and 6) presents a more difficult problem. Nevertheless,if a history record is available it is often possible to estimate, with acceptable accuracy,the level of corrective work to be expected for a given level of preventive effort (seeFigure 3.1). Without such experience little confidence can be placed in the estimate andthis must be made clear in the budget statement.
The workshops and services areas needed to be tackled differently, in as much astheir workload originates from each of the plant areas.
This approach is sometimes called zero-based budgeting (ZBB) in as much as themaintenance budget is built up from scratch each year in the light of the mainte-nance schedule for that year.
Exercise
E3.1 Carry out a brief Internet search for literature on ZBB.
Review Question
R3.2 Use information found in Exercise E3.1 in conjunction with Figure 3.1 toexplain the concept of ZBB applied to maintenance work.
The above budgeting procedures need modification for an administrative structurebased on manufacturing units (see Figure 3.6). Each manufacturing unit becomes a‘profit center’, and a combined production/maintenance budget is required at opera-tions manager level. The centralized maintenance functions become cost centers andbudgets for the service they provide to the manufacturing units. These centralized main-tenance functions are concerned with efficiency of resource usage rather than plantavailability, they act like internal contractors and the costing system is designed to reflectthis situation.
Maintenance budgeting 49

Main
tenance S
yste
ms a
nd D
ocum
enta
tion
50
Refinery
manager
Shift managers (Monday to Friday cover)
Commercial
manager
Staff Staff Plant
officer
A
Plant
officer
B
Plant
officer
C
Me
ch
an
ica
l
su
pe
rvis
or A
Me
ch
an
ica
l
su
pe
rvis
or B
Me
ch
an
ica
l
su
pe
rvis
or C
Similar in principle to digestion Ma
inte
na
nce
su
pp
ort
en
gin
ee
r
T/A
pla
nn
ing
su
pe
rvis
ion
E/ I
en
gin
ee
rs
CB
M
en
gin
ee
r(s)
Pla
nt s
erv
ice
su
pe
rinte
nd
en
t
Staff
Co
ntra
cts
su
pe
rinte
nd
en
t
Wo
rksh
op
su
pe
rinte
nd
en
t
Staff
Technical
manager
Staff
Plant
engineer
Digest
process
support
engineerProduct
shift
supervisor(s)
Shift
teams
Maintenance
resource
engineer
Digestion
planner
Digestion
support
engineer
Clarification
operations
manager
Precipitation
operations
manager
Calcination
operations
manager
Utilities
operations
manager
Maintenance
manager
Digestion
operations
manager
Second-line
mechanical
resource, area
specialisation with
flexibility
E
Teams
I
Teams
E/I
su
pe
rvis
or
Digestion manufacturing unit Centralized shift team
MEI first-line maintenance
Figure 3.6 Administrative structure based on manufacturing units

Maintenance budgeting 51
Review Question
R3.3 Discuss the advantages of the ‘manufacturing unit’ administrative structureof Figure 2.6 in terms of maintenance budgeting.
In practice, maintenance budgeting is rarely as rational as above. Senior managementsee maintenance only as a cost. The linkage between maintenance expenditure andproduction output indicated in Figure 3.1 is often ignored. Maintenance budgeting thenbecomes an exercise based on last year’s costs plus an allowance for inflation (at bestlow-frequency major work may be included). This is a poor form of budgeting, it is anattempt to forecast what is likely to be spent in the absence of any management inten-tion to deviate from what has gone before.
Exercise
E3.2 Establish the maintenance budgeting procedure in use in your company andcompare it against the key concepts and ideas presented in this section.
Review Questions Guidelines
R3.1 One of the main problems is that the budgeted expenditure may not reflect thechanges in the maintenance workload.
The approach can be justified where a company is in a stable operating situ-ation and the maintenance workload is also relatively stable.
R3.2 Company objectives and plans change with time to suit market demand andother external factors. This affects the production requirements and objectives,which in turn affects the equipment life plans, preventive maintenance sched-ule and therefore the maintenance workload. A ZBB is built up from scratchbased on this forecasted workload.
R3.3 The digestion operation manager is responsible for production and mainte-nance and budgets for both. He is far more likely to appreciate the relationshipbetween maintenance expenditure and the plant output factors that affectdigestion plant performance. In other words he will be concerned about main-tenance organizational efficiency but he will also appreciate that more effectivemaintenance (and thus perhaps more maintenance expenditure) might improveavailability, output and net profit.

This page intentionally left blank

Maintenance management control
4‘Look after the lower level performance indices and the higher indices will
look after themselves.’
Anthony Kelly
Chapter aims and outcomes
To explain the principles and concepts of maintenance management control systems,and how their practical operation may be informatively modeled.
On completion of this chapter you should be able to:
● draw a conceptual model that illustrates the principles of maintenance managementcontrol;
● appreciate that a maintenance costing system that is appropriately designed mayoffer the best way of controlling overall maintenance performance;
● understand the need for, and operation of, a plant reliability control system and anorganizational efficiency control system;
● understand how maintenance control systems may be incorporated into an organization;
● appreciate how objectives can be modified and used as performance indices (PIs)and how PIs can be used for inter-firm comparison.

Maintenance Systems and Documentation54
Chapter route map
Key words
● Paradigm● Hierarchy of objectives● Control principles● Feedback and feed-forward● Benchmarks● Maintenance performance indices● Maintenance effectiveness indices● Maintenance organizational efficiency indices● Key performance indices● Inter-firm comparison indices
Book divisions
Introductory chapters
Budgeting and control
Work planning andwork control
Spare partsmanagement
Documentation
Case studies
This chapter in the division
Chapter 3.0Maintenancebudgeting
Chapter 4.0Maintenancemanagement control
Chapter topics
4.1 Introduction
4.2 The basics of maintenance management control
4.3 Principles of maintenance management control
4.4 The control of overall maintenance performance
4.5 The control of maintenance effectiveness (the control of plant reliability)
4.6 The control of organizational efficiency
4.7 Incorporating systems into the organization
4.8 Published methods for measuring maintenance performance
4.9 The use of indices of maintenance performance for inter-firm comparisons
4.10 Human factors and data collection
4.1 Introduction
The previous chapter showed that maintenance budgeting is an integral part of thecompany budgetary control procedure. Maintenance expenditure is controlled as a partof this procedure. The weakness of traditional company budgetary control procedures
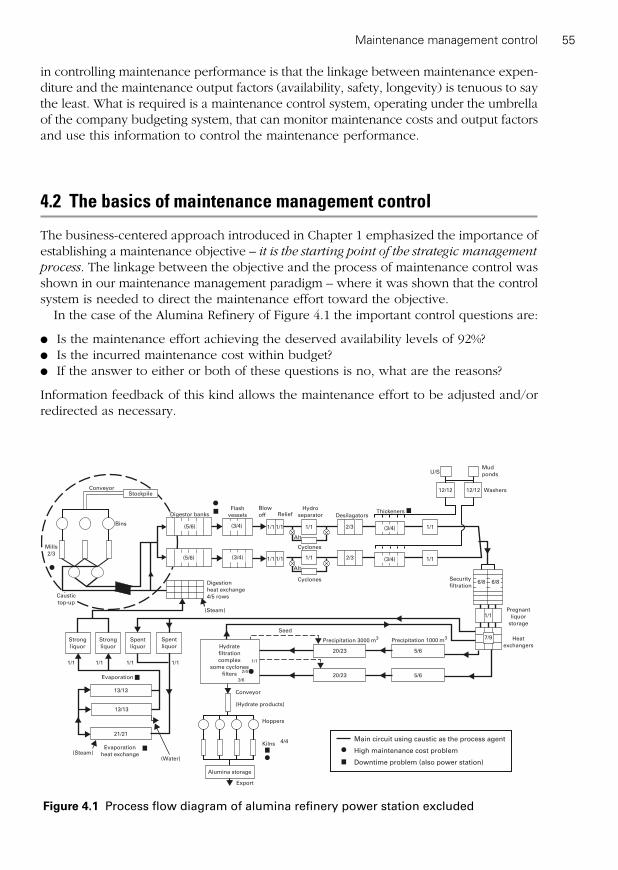
in controlling maintenance performance is that the linkage between maintenance expen-diture and the maintenance output factors (availability, safety, longevity) is tenuous to saythe least. What is required is a maintenance control system, operating under the umbrellaof the company budgeting system, that can monitor maintenance costs and output factorsand use this information to control the maintenance performance.
4.2 The basics of maintenance management control
The business-centered approach introduced in Chapter 1 emphasized the importance ofestablishing a maintenance objective – it is the starting point of the strategic management
process. The linkage between the objective and the process of maintenance control wasshown in our maintenance management paradigm – where it was shown that the controlsystem is needed to direct the maintenance effort toward the objective.
In the case of the Alumina Refinery of Figure 4.1 the important control questions are:
● Is the maintenance effort achieving the deserved availability levels of 92%?● Is the incurred maintenance cost within budget?● If the answer to either or both of these questions is no, what are the reasons?
Information feedback of this kind allows the maintenance effort to be adjusted and/orredirected as necessary.
Maintenance management control 55
Strong
liquor
Strong
liquor
Spent
liquor
Evaporation
13/13
(Water)(Steam)
Hydrate
filtration
complex
some cyclones
filters
13/13
21/21
Hoppers
Kilns
Export
Precipitation 3000 m3 Precipitation 1000 m
3
2/4
3/6
Conveyor
(Hydrate products)
20/23
20/23 5/6
5/6
Conveyor
Bins
Mills
2/3
(5/6)
(5/6)
(3/4)
(3/4)
Digestion
heat exchange
4/5 rows
(Steam)
Cyclones
Alt
Cyclones
Alt
2/3
2/3
(3/4)
(3/4)
12/12 12/12
U/SMud
ponds
Washers
Thickeners
1/1
4/4
Seed
6/8 6/8Security
filtration
Pregnant
liquor
storage
Heat
exchangers
Flash
vessels Desilagators
Hydro
separator
Blow
off Relief
1/1 1/1 1/1 1/1
1/1
1/11/11/11/1
1/11/1 1/1 1/1
7/9
High maintenance cost problem
Downtime problem (also power station)
Evaporation
heat exchange
Main circuit using caustic as the process agent
Caustic
top-up
Stockpile
Digestor banks
Spent
liquor
Alumina storage
Figure 4.1 Process flow diagram of alumina refinery power station excluded

Maintenance Systems and Documentation56
Reportingsystem
Plant
Otherdepartments
Maintenancemanagement
(establish andmodify strategy as
necessary)
Maintenancedepartment
Comparisonunit
Disturbing factors
Point 1
Point 2Production operating
Strategy
Actual maintenanceperformance
Plant output factors
Maintenance costs
Maintenance performancetargets
Deviations
Maintenance objectives set withthe agreement of the plant-users
and financial management
Initial strategy Corrected strategy
Management inputs
Feedback and control
Correction
Outputs
(product output and quality,longevity, safety)
Point 3
Point 4
Figure 4.2 Maintenance management control: theoretical model
4.3 Principles of maintenance management control
The key relationships and processes of maintenance management control are delineatedin Figure 4.2. The strategy (life plans, organizational policy, etc.) is established by main-tenance management in order to achieve the objective (the agreed plant-user requirementat the budgeted cost). Management budgets for – and uses – resources (men, spares,tools) to implement the strategy.
The reporting system has the following principal data collection functions:
● checking whether the maintenance strategy is being carried out to specification(Point 1);
● checking whether the production operating practice is being carried out to specifi-cation (Point 2);
● measuring the parameters of maintenance output (Point 3);● measuring the maintenance resource costs (Point 4).
The cause of any detected deviation from intent can then be determined and the nec-essary corrective action taken.
The above would seem to be a straightforward enough process. In practice, however,there are many complicating factors, viz.:● A deterioration in some measured output (Point 3), e.g. availability, could have causes
other than maintenance, e.g. maloperation. So the root-causes of the deviation mustbe pinpointed before any control measure is taken.

In some situations it may be possible to define the output factor to be specific toMaintenance, e.g. identifying downtime due to maintenance causes only, allowsthe definition of a maintenance availability index. Thus changes in this index isdirectly related to maintenance effort.
● Once set, maintenance objectives may not be unchanging; they will often have to beamended in the light of new needs of other departments, and before the overall strat-egy has had time to ‘take effect’.
● Although the direct maintenance costs are relatively easy to measure some of theparameters of maintenance output, such as longevity or safety, are not.
● It is frequently the case that requirements relating to product output or quality willvary in the short and medium term, those relating to plant longevity and safety in themuch longer term. Indeed, the maintenance strategic effort as regards plant longevityand safety is often quite divorced from that regarding product output and quality.These two aspects may well need separate objectives and control systems.
● The direct maintenance costs are a function both of maintenance policy and of orga-nizational efficiency. These two functions may well need separate objectives and control systems (see Figure 4.3).
For these reasons, any overall maintenance control system based on the model ofFigure 4.2 will have its limitations. Although it will be possible to identify deviations –from targets for output parameters and for maintenance resource costs – it will be verymuch more difficult to identify the causes. For this to be possible it may well be necessaryto have a hierarchy of objectives and corresponding control systems.
A hierarchy of performance indices (PIs) (objectives by another name) was shown inChapter 1 (see Figure 1.15). For convenience this is reproduced here as Figure 4.3. Eachof the PIs could be monitored, compared to actual performance and used to control themaintenance effort.
The remainder of this section will discuss the practical interpretation of the mainte-nance management control principles outlined above.
Review Question
R4.1 Explain the limitations of the model shown in Figure 4.2 for controllingmaintenance performance.
4.4 The control of overall maintenance performance
The best practical mechanism for controlling the overall maintenance performance wouldbe a properly designed maintenance budgeting and costing system incorporating the ideasof Figure 3.1. This would mean the traditional accountancy designed costing system dis-cussed in Chapter 3 would need some modification to move its center of gravity moretoward maintenance needs.
A maintenance costing system (see Figure 4.4) could be designed which would facil-itate determination – for each unit of plant (for a bauxite mill, say) of the relationships
Maintenance management control 57
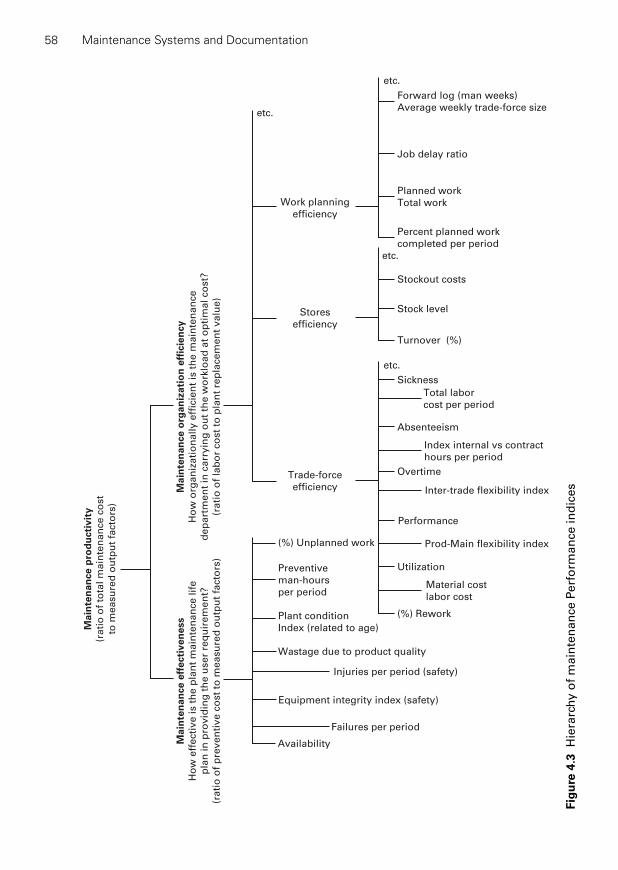
Maintenance Systems and Documentation58
Main
ten
an
ce p
rod
ucti
vit
y
(rati
o o
f to
tal m
ain
ten
an
ce
co
st
to m
easu
red
ou
tpu
t fa
cto
rs)
Main
ten
an
ce e
ffecti
ven
ess
Ho
w e
ffecti
ve is t
he p
lan
t m
ain
ten
an
ce l
ife
pla
n in
pro
vid
ing
th
e u
ser
req
uir
em
en
t?
(rati
o o
f p
reven
tive c
ost
to m
easu
red
ou
tpu
t fa
cto
rs)
Ma
inte
na
nce
org
an
iza
tio
n e
ffic
ien
cy
Ho
w o
rga
niz
ati
on
ally
eff
icie
nt
is t
he
ma
inte
na
nce
dep
art
me
nt
in c
arr
yin
g o
ut
the
wo
rklo
ad
at
op
tim
al co
st?
(ra
tio
of
lab
or
co
st
to p
lan
t re
pla
ce
me
nt
va
lue
)
Availability
Failures per period
Injuries per period (safety)
Equipment integrity index (safety)
Wastage due to product quality
Plant condition
Index (related to age)
Preventive
man-hours
per period
(%) Unplanned work
Utilization
(%) Rework
Material cost
labor cost
Prod-Main flexibility index
Inter-trade flexibility index
Index internal vs contract
hours per period
Total labor
cost per period
Performance
Overtime
Absenteeism
Sickness
etc.
etc.
etc.
Trade-force
efficiency
Stores
efficiency
Turnover (%)
Stock level
etc.
Stockout costs
Planned work
Total work
Job delay ratio
Forward log (man weeks)
Average weekly trade-force size
Work planning
efficiency
Percent planned work
completed per period
Fig
ure
4.3
Hie
rarc
hy o
f m
ain
ten
an
ce P
erf
orm
an
ce in
dic
es

Maintenance management control 59
Job No.
Supervisor
OutputsInputs
Cost of major overhaul
Unit No.
06–M02
Cost of maintaining plant
divided by trade and resource against
availability and other output factors
Resource cost by supervisorAvailability (and other output
factors) via production reporting
Material costs divided by trade and
type via stores requisitions
Labor costs divided by trade and
type via work order feedback
Plant code
Plant
Refinery
Unit
No.2 Mill
06 M02
Trade and supervisor
Electrician Night shift
Work type
Preventive
22 NS
Job No.
521
Figure 4.4 Outline of a maintenance costing system
between the rates of expenditure on maintenance and the relevant output parameters.The maintenance costs could be categorized by resource type (men, spares, etc.), main-tenance type (preventive, corrective, etc.), trade (mechanical, electrical, etc.), budgettype (short term for, say, availability or quality; long term for plant longevity). In addition,costs could be assigned against supervisor, trade group or major job (i.e. an overhaul).Traditionally, such a system relies on coding the plant units, work groups, work types,etc. (see Figure 4.4). All works are therefore recorded on work order (or time) cards –against unit, type and work group – and all spares usage similarly recorded on storesrequisition orders, etc.
The system could be designed to provide a variety of outputs, either automatically oron demand – especially if the processing is computerized. The main outputs and theirpossible uses are as follows:
(i) Actual maintenance costs (separated into labor and material costs and, if required,divided according to work type and trade) and recorded levels of relevant outputparameters (availability, product quality losses) – which can be compared againstbudgeted costs and targeted levels of performance (per period, per unit and perplant).
(ii) Identified areas (plants or units) of high maintenance cost or low availability, per-haps presented via Pareto plots or ‘top ten’ ranking lists).
(iii) Plots of output performance vs maintenance costs, per unit or per plant.(iv) Actual maintenance costs per cost center per trade group or per supervisor – for
comparison with budget (a part of company budgetary control).(v) Actual cost of major overhauls – again for comparison with budget (a part of the major
overhaul procedure, see Chapter 7).

The above, although not ideal, should satisfy most of the requirements of an overall main-tenance performance control system, facilitating:
● the setting of objectives/PIs (or key performance indices, KPIs*)● the monitoring of output parameters (such as availability) and of inputs (such as
resource cost relative to budget) which can influence the levels achieved;● the diagnosis of deviations from intent and the prescription of appropriate remedial
action.
Most company budgeting and costing systems are designed by accountants for corpo-rate financial control and are not sufficiently equipment-oriented to shed light on theproblems of maintenance control, e.g. cost centers may not be plant-specific and, evenwhen they are, each one may encompass too large an area of plant to be of any use inmaintenance management. In addition, only rarely do such systems have the facility ofcomparing maintenance costs against the various parameters of output.
Even if properly designed, a maintenance costing system has to be a high level, longer-term one, providing a means of controlling the overall maintenance performance. It willbe appreciated from Figure 4.3 that it needs to be complemented by control systems oper-ating at a lower level (and on a shorter time scale). Indeed, it could be argued that a con-trol system is needed for each objective that is set. For example, if an overtime limit is setthen the actual overtime needs to be monitored and reported to the supervisor for nec-essary corrective action. In other words, control systems are integral to the operation oforganizations.
The two principal maintenance control systems are those which deal with effectiveness
and organizational efficiency, respectively (see Figure 4.3). The former is concernedwith ensuring the effectiveness of the plant maintenance life plans and preventiveschedule as regards achieving desired outputs and meeting cost targets, the latter withensuring that maintenance work is being carried out in the most efficient way.
Review Questions
R4.2 With reference to Figure 4.3 define ‘maintenance effectiveness’ and ‘main-tenance organizational efficiency’ and explain how they contribute to‘maintenance cost effectiveness’.
R4.3 Explain why conventional budgetary control and costing systems (seeChapter 3) are not effective in controlling overall maintenance perform-ance. What are the essential differences between such traditional companycosting systems and the maintenance costing system outlined in Section 4.4.
R4.4 List the ideal requirements from a system set up to control overall main-tenance performance.
Exercise
E4.1 Map and compare the costing system in use in your own company againstFigure 4.4 and the concepts discussed in this section.
Maintenance Systems and Documentation60
* A limited or important number of higher-level indices.
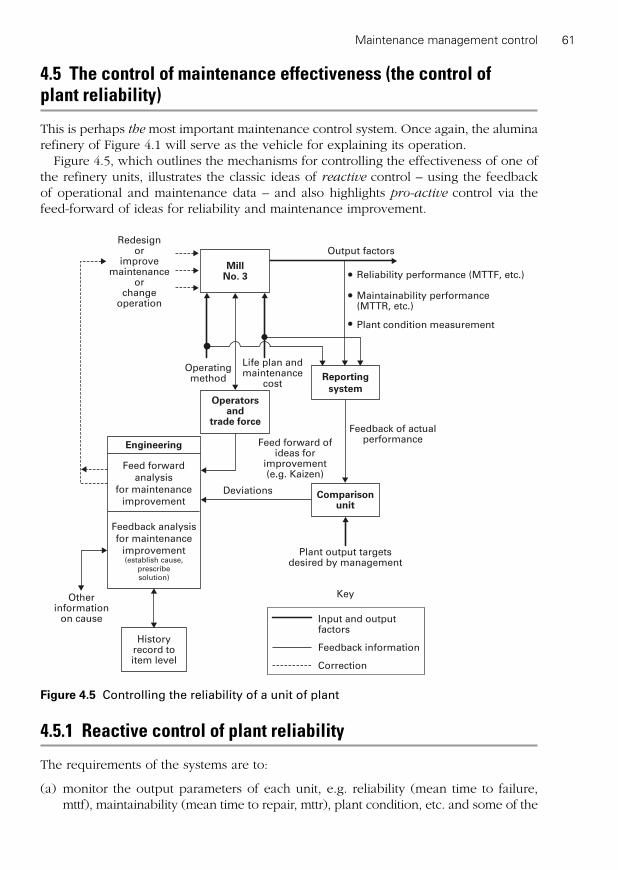
4.5 The control of maintenance effectiveness (the control of plant reliability)
This is perhaps the most important maintenance control system. Once again, the aluminarefinery of Figure 4.1 will serve as the vehicle for explaining its operation.
Figure 4.5, which outlines the mechanisms for controlling the effectiveness of one ofthe refinery units, illustrates the classic ideas of reactive control – using the feedback of operational and maintenance data – and also highlights pro-active control via thefeed-forward of ideas for reliability and maintenance improvement.
Maintenance management control 61
Key
Redesignor
improvemaintenance
orchange
operation
Output factors
Reliability performance (MTTF, etc.)
Maintainability performance(MTTR, etc.)
Plant condition measurement
Feedback of actualperformance
Comparisonunit
Plant output targetsdesired by management
Historyrecord toitem level
Otherinformation
on cause
Deviations
Feedback analysis
for maintenance
improvement(establish cause,
prescribe
solution)
Feed forward
analysis
for maintenance
improvement
Engineering Feed forward ofideas for
improvement(e.g. Kaizen)
Reporting
system
Life plan andmaintenance
cost
Operatingmethod
Operatorsand
trade force
MillNo. 3
Input and outputfactors
Feedback information
Correction
Figure 4.5 Controlling the reliability of a unit of plant
4.5.1 Reactive control of plant reliability
The requirements of the systems are to:
(a) monitor the output parameters of each unit, e.g. reliability (mean time to failure,mttf), maintainability (mean time to repair, mttr), plant condition, etc. and some of the

input conditions, e.g. whether the unit life plan is being carried out to specificationand at anticipated cost;
(b) determine the root cause of any failure;(c) prescribe the necessary corrective action.
A control system for this must encompass several departments because thecause could originate in production (maloperation), in engineering (poor design)or in maintenance.
At refinery level, control can be envisaged as in Figure 4.6, i.e. each unit having its owncontrol system. Once again, the difficulty is caused by the multiplicity of units whichmake up a major industrial plant, and therefore of control systems needed. The conse-quent data processing has been made manageable by modern computer technologywhich can easily handle the many independent control mechanisms. The difficulty,however, usually lies not in the processing but in the acquisition of the data. Companymanagement may therefore need to concentrate control effort on selected units, thosewhich they deem critical; for the rest they may use the maintenance costing system toidentify the most troublesome, e.g. those of highest high maintenance cost, poorestproduct quality, highest downtime, and so on.
Maintenance Systems and Documentation62
Hydrate out
Some 500 units in all
Mud out
Etc.
Evaporator 1DigestersMills
ControlControl Control
Product flow
and output
Feedback of
performance data
Correction
Figure 4.6 Controlling the reliability of a plant
4.5.2 Pro-active control of unit reliability
Figure 4.5 also illustrates the pro-active approach, which differs from the reactive in thatit does not wait for failures or for high cost problems to occur before taking action. Thebasic idea is that all members of the organization – but especially the shop floor –should continuously seek ways of improving unit reliability, and hence output, safety,and so forth. The Japanese call this kaizen. The shop floor form small inter-disciplinary,but plant-oriented, teams to improve the reliability of selected units.
Preventive maintenance is interpreted literally – to prevent the need for anymaintenance, by design-out and other actions.
4.6 The control of organizational efficiency
The concept of organizational efficiency was discussed in outline in Chapter 1 where itwas stated that the prime organizational objective is:
to carry out a given plant maintenance workload at minimum cost by using
maintenance resources (men, spares, tools) in the most efficient way.
It was also pointed out that a single objective for organizational efficiency is somewhatfanciful. A hierarchy of sub-objectives was therefore developed (as shown in Figure 4.3).
For trade-force efficiency the objective might be stated as:
to minimize the trade-force cost per period for carrying out a given plant main-
tenance workload.
The extent to which this was being achieved could be measured via labor efficiencyindices such as:
For this, one or more of the techniques of maintenance work measurement and/orwork sampling would have to be used. Work measurement is expensive and can bringindustrial relations problems in its wake. However control that is based on standardtimes is superior to control based on estimated times because it can measure labor effi-ciency against universal standards.
Other things being equal, it is in the interest of maintenance management to pursue orga-nizational actions – encouraging inter-trade flexibility, accelerating the introduction of self-empowered teams, making more use of contract labor, etc. – that will lead to improvementsin the indices obtained from such efficiency measurements. The idea being that if the lowerlevel indices move in the right direction so will the higher level indices, see Figure 4.3.
In other words: ‘look after the lower indices and the higher indices will look afterthemselves’
In the case of spare parts the objective is:
to minimize the sum of stockout costs and holding costs.
An appropriate index of stores efficiency might therefore be one which involved holdingcosts vs number or cost of stockouts. Other sub-measures of stores efficiency could bederived via the monitoring of such parameters as percent stock turnover, average trade-force waiting time for parts, staffing costs vs stockholding costs (see Chapter 8.8).
Trade-force performanceStandard hours in w
�oorkload
Actual hours paid
Trade-force utilizaation Percent of time active per period�
Maintenance management control 63
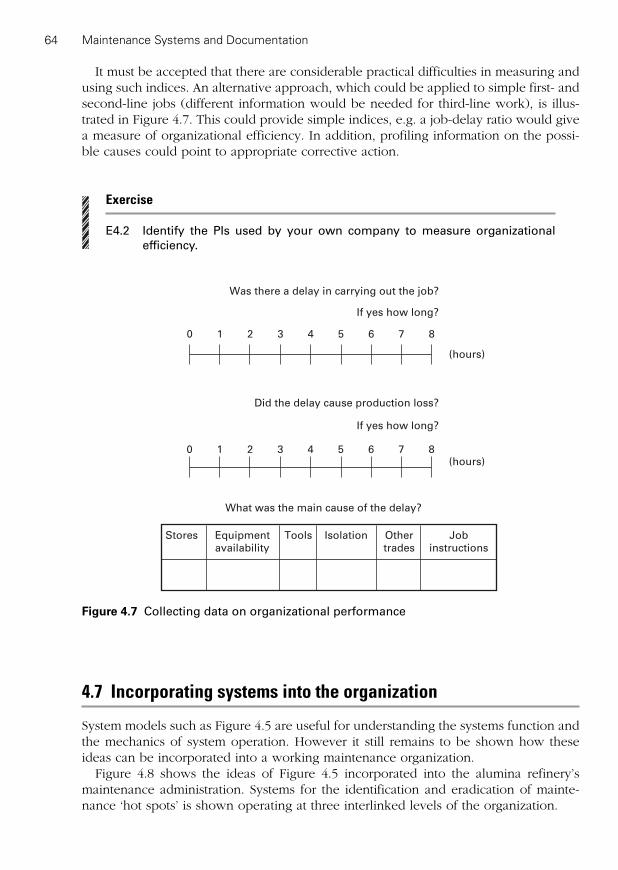
It must be accepted that there are considerable practical difficulties in measuring andusing such indices. An alternative approach, which could be applied to simple first- andsecond-line jobs (different information would be needed for third-line work), is illus-trated in Figure 4.7. This could provide simple indices, e.g. a job-delay ratio would givea measure of organizational efficiency. In addition, profiling information on the possi-ble causes could point to appropriate corrective action.
Exercise
E4.2 Identify the PIs used by your own company to measure organizational efficiency.
Maintenance Systems and Documentation64
20 1 3 654 7 8
20 1 3 654 7 8
Was there a delay in carrying out the job?
If yes how long?
Did the delay cause production loss?
If yes how long?
Stores Tools Job
instructions
Other
trades
Equipment
availability
What was the main cause of the delay?
(hours)
(hours)
Isolation
Figure 4.7 Collecting data on organizational performance
4.7 Incorporating systems into the organization
System models such as Figure 4.5 are useful for understanding the systems function andthe mechanics of system operation. However it still remains to be shown how theseideas can be incorporated into a working maintenance organization.
Figure 4.8 shows the ideas of Figure 4.5 incorporated into the alumina refinery’smaintenance administration. Systems for the identification and eradication of mainte-nance ‘hot spots’ is shown operating at three interlinked levels of the organization.
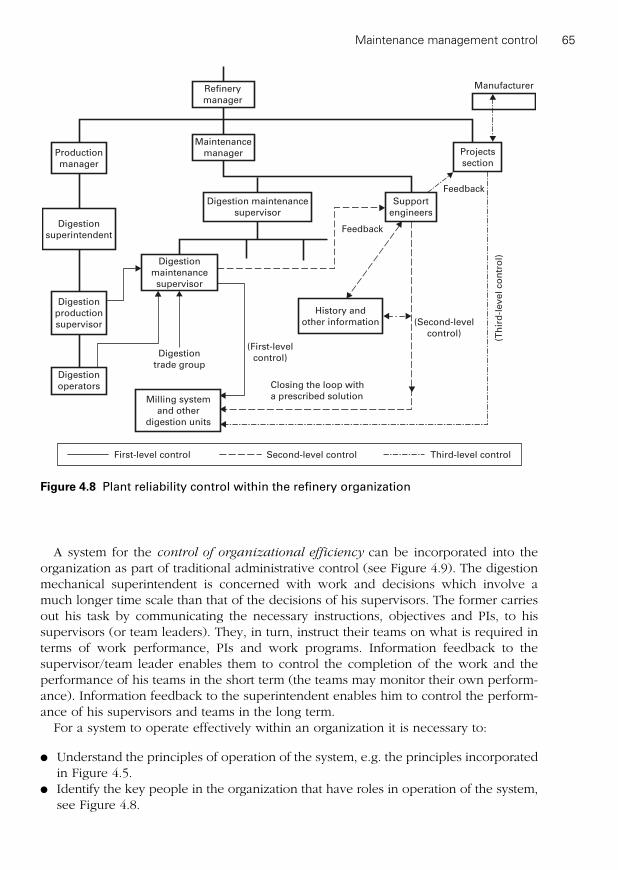
Maintenance management control 65
A system for the control of organizational efficiency can be incorporated into theorganization as part of traditional administrative control (see Figure 4.9). The digestionmechanical superintendent is concerned with work and decisions which involve amuch longer time scale than that of the decisions of his supervisors. The former carriesout his task by communicating the necessary instructions, objectives and PIs, to hissupervisors (or team leaders). They, in turn, instruct their teams on what is required interms of work performance, PIs and work programs. Information feedback to thesupervisor/team leader enables them to control the completion of the work and theperformance of his teams in the short term (the teams may monitor their own perform-ance). Information feedback to the superintendent enables him to control the perform-ance of his supervisors and teams in the long term.
For a system to operate effectively within an organization it is necessary to:
● Understand the principles of operation of the system, e.g. the principles incorporatedin Figure 4.5.
● Identify the key people in the organization that have roles in operation of the system,see Figure 4.8.
First-level control Second-level control Third-level control
Digestion
trade group
Manufacturer
Feedback
(Th
ird
-level
co
ntr
ol)
(Second-level
control)
Feedback
(First-level
control)
Closing the loop with
a prescribed solution
Digestion
maintenance
supervisor
Digestion
production
supervisor
Digestion
operators
Production
manager
Digestion
superintendent
History and
other information
Milling system
and other
digestion units
Projects
section
Support
engineers
Maintenance
manager
Digestion maintenance
supervisor
Refinery
manager
Figure 4.8 Plant reliability control within the refinery organization
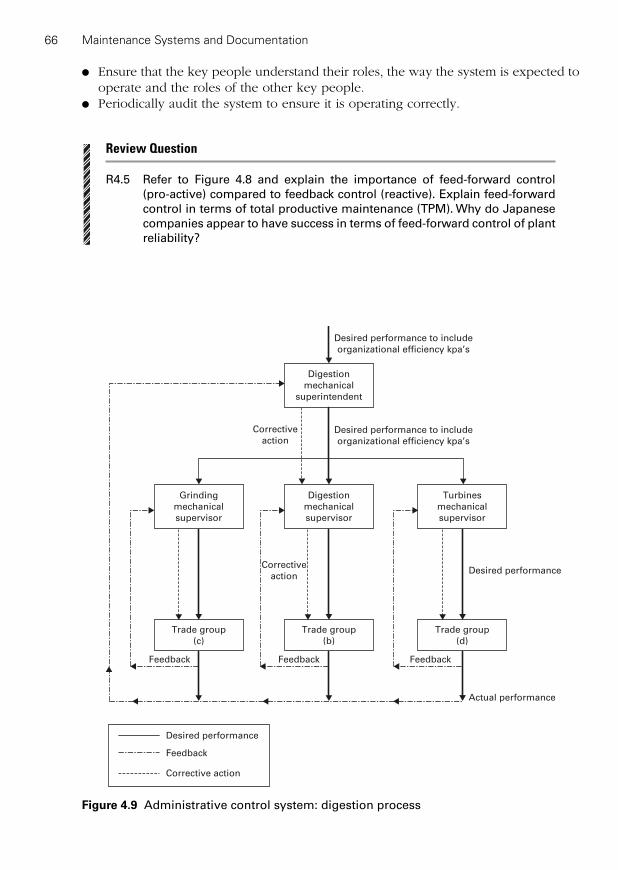
● Ensure that the key people understand their roles, the way the system is expected tooperate and the roles of the other key people.
● Periodically audit the system to ensure it is operating correctly.
Review Question
R4.5 Refer to Figure 4.8 and explain the importance of feed-forward control (pro-active) compared to feedback control (reactive). Explain feed-forwardcontrol in terms of total productive maintenance (TPM). Why do Japanesecompanies appear to have success in terms of feed-forward control of plantreliability?
Maintenance Systems and Documentation66
Digestion
mechanical
supervisor
Corrective
action
Corrective
action
Desired performance
Feedback
Corrective action
Feedback Feedback Feedback
Grinding
mechanical
supervisor
Turbines
mechanical
supervisor
Digestion
mechanical
superintendent
Trade group
(b)
Trade group
(d)
Trade group
(c)
Actual performance
Desired performance
Desired performance to include
organizational efficiency kpa’s
Desired performance to include
organizational efficiency kpa’s
Figure 4.9 Administrative control system: digestion process

Exercise
E4.3 (a) Use Figure 4.8 as a template to draw the ‘plant reliability control’ sys-tem in your own organization (or an organization you can get accessto). Can you identify all three levels of control? What are the main prob-lems associated with each level? Is there a pro-active system at the firstlevel of control?
(b) How would you improve your plant reliability control system?
4.8 Published methods for measuring maintenance performance
Various index-based methods for measuring maintenance performance [1], and hencefor controlling maintenance effort, have been developed but examples of industrialorganizations which have used them are hard to find. Exceptions to this are theJapanese methods [2] that have been incorporated into their concept of TPM.
4.9 The use of indices of maintenance performance for inter-firm comparisons
So far we have used objectives and PIs to help control the maintenance performance ofa specific company i.e. set PIs, monitor them to see if they are getting better or worseand take corrective action as necessary [3,4].
A different use of indices is for comparing the maintenance performance across var-ious companies. It is within such a context that the maintenance indices of Figure 4.3could be used. They may well need extending or developing further for particularindustries. The idea is that a series of indices categorized as shown (many of which maybe being used for control purposes) could be profiled (perhaps into KPIs) in order tocompare the maintenance performance between plants of similar technology and size –say e.g. alumina refineries. The value of doing this is not obvious, however. Even whencomparing alumina refineries there are many differences – in detailed design, size, tech-nology, manufacturer, etc. – that exercise greater influence on the indices than do suchaspects as the maintenance life plan or organization.
Review Question
R4.6 Explain the limitations of using maintenance PIs (see Figure 4.3) to comparethe performance of maintenance departments across different companies.
4.10 Human factors and data collection
The success of pro-active control, one of the cornerstones of TPM, depends on thequality, goodwill and motivation of the shop floor; that of reactive control on the
Maintenance management control 67

quality of data returned from that level. With regard to the latter, the author’s own studies have shown that data collection systems rarely operate well and that human fac-tors problems and lack of training feature as the most important reasons for this (see Table 4.1).
Many of the companies investigated had sophisticated computer systems for controlbut had put little effort into defining terms such as symptom, root cause of failure, defec-
tive part, etc. It is not surprising, therefore, that the quality of data feedback was poor,especially concerning the cause of any problem. Perhaps the alternative means of datacollection on cause, shown in Figure 4.10, would help in overcoming this problem.
Maintenance Systems and Documentation68
Senior managers Use an open approachSell the ideaIntroduce the system graduallyDo not use the system to assess the data inputterShow commitment to the system
Foremen Must be committed to the systemMust be convinced the system will benefit them
Artisans Handle simple paperwork or user-friendly softwareAre allowed ample time for information input between jobsHave access to the systemAppreciate what the data is used for
System designers Make effective use of the data and ensure that this is seen to be the case
Collect data in the easiest mannerLimit the data collected to only that which is needed
Table 4.1 Factors conducive to good data collection
First-line maintenance
Fitter removes item and returns
to workshop for repair
Ask for
Workshop fitter repairs
before returning to stores
Ask for
NWT MaloperationPoor
design
Poor
maintenance
Tick
Plus comment on why box ticked
Date (running hours)1
Symptoms2
Component(s) that caused
loss of function1
Probable cause of failure
(as before)2
Probable cause of failure3
Figure 4.10 Controlling the reliability of a unit of plant

References
1. Jardine, A.K.S., Operation Research in Maintenance, Manchester University Press,1970, pp. 214–221.
2. Hibi, S., How to measure maintenance performance, Asian Productivity Organization,1977.
3. Mather, M., The Maintenance Scorecard, Industrial Press, New York, 2004.4. Wireman, T., Benchmarking Maintenance Management, Industrial Press, New York,
2005.
Maintenance management control 69
Review Questions Guidelines
R4.1 The deviation of some of the output parameters, e.g. availability, could havecauses other than maintenance, e.g. maloperation. To overcome this problem(partly at least) it may be possible to be more specific in the definition of theoutput parameters, e.g. record downtime due to maintenance causes onlyresulting in a ‘maintenance availability index’.
R4.2 Maintenance effectiveness is concerned with establishing life plans that aim toachieve the required level of plant availability/safety/longevity.Maintenance organizational efficiency is concerned with carrying out the nec-essary work at least cost.Maintenance cost effectiveness is concerned with achieving the plant outputfactors at least cost.
R4.3 Tradition budgetary control and costing systems regard maintenance as anexpenditure. There is no clear link between maintenance expenditure and plantavailability/safety/longevity. In addition accountancy ‘cost centers’ are not alwaysequipment oriented. The maintenance costing system outlined in Figure 4.4overcomes these limitations (in part).
R4.4 The ideal requirements are as follows:(i) The setting up of objectives as PIs.(ii) The monitoring of output indices (such as availability) and the input param-
eters (such as resource costs) which can influence the levels achieved.(iii) The diagnosis of deviations from intent and the prescription of appropriate
remedial action.R4.5 Feed-forward, or pro-active, control of plant reliability is concerned with identify-
ing potential high-cost/low-reliability equipment before it becomes a problem. Itrelies on excellent human factors, e.g. a sense of equipment ownership at oper-ator and artisans level. Feed back, or reactive, control is concerned with identify-ing and eradicating high-cost/low-reliability equipment after it becomes a problem.The advantages of pro-active control of reliability is therefore self-evident.
A key organizational area of TPM is the idea of autonomous operator-main-tenance teams. The teams are carefully selected and trained to operate, carryout essential first-line maintenance and to be involved in the ‘continuousimprovement’ of the process and equipment, i.e. pro-active reliability control.
R3.6 Even when comparing companies within the same industrial sector, e.g. alu-mina refineries the plant process, equipment manufacturer, size and technologymay be different. These factors often exercise a greater influence on the mainte-nance indices (especially cost effectiveness) than do maintenance strategy.

This page intentionally left blank

PART 3
Work planning and work control

This page intentionally left blank

Short-term work planning and control
5‘Measure twice, cut once.’
Anon
Chapter aims and outcomes
To explain the principles of operation of a short-term work planning, scheduling andwork control system.
On completion of this chapter you should be able to:
● appreciate the differences between the short-term planning procedure used for firstand second-line maintenance work and the turnaround planning procedure usedfor major overhauls (third-line work);
● understand the work planning function and objectives;● draw a schematic work planning model based around the operation of a mainte-
nance resource structure;● understand the principles of work planning and work control;● appreciate the linkage between work planning and the safety of plant and
personnel.
Chapter route map
Book divisions
Introductory chapters
Budgeting and control
Work planning andwork control
Spare partsmanagement
Documentation
Case studies
This chapter in the division
Chapter 5Short-term workplanning and control
Chapter 6Management of plantturnaroundsPart 1: Networkanalysis
Chapter 7Management of plantturnaroundsPart 2: Turnaroundmethodology
Chapter topics
5.1 Introduction
5.2 The fundamentals of work planning
5.3 Modeling the operation of a short-term work planning system
5.4 Comments on work planning and work control
5.5 Guidelines for the design of work planning systems
5.6 Safety aspects
5.1 Introduction
Perhaps the key maintenance information system is the system for work planning
which, for the purposes of this book, we shall take also to encompass work scheduling
and controlling. It is this that provides much of the information for the other mainte-nance management control systems.
Chapter 1 depicted a work planning system as an information and decision-makingstructure. The accompanying text stressing the need to design the system around theresource structure. The text also emphasized the need to visualize the work planningsystem as an integral part of the overall organization.
5.2 The fundamentals of work planning
The work planning system defines the way in which the maintenance workload – shortterm (first and second line) and long term (major third line) – is planned, scheduled,allocated and controlled. In companies where the third-line work involves major peaks(see Figure 3.2(a)), it is normal to have a short-term planning system for the ongoingwork (first and second line) linked to a turnaround planning system (shutdown plan-ning) for the major work. Short-term planning will be discussed in this chapter andturnaround planning in Chapters 6 and 7.
In simple terms the function of work planning is:
● to ensure that the right resources,● arrive at the right place,● at the right time,● to do the right job,● in the right way.
The design of the work planning system should aim to get maximum leverage from thecost of setting up and running the work planning system over the savings (in terms of theindirect and direct maintenance costs) that result from the use of the planning system.
Maintenance Systems and Documentation74
Key words
● Work planning● Work scheduling● Work control● Work planning systems● Work order● Work request● Job priority● Job method● Job list
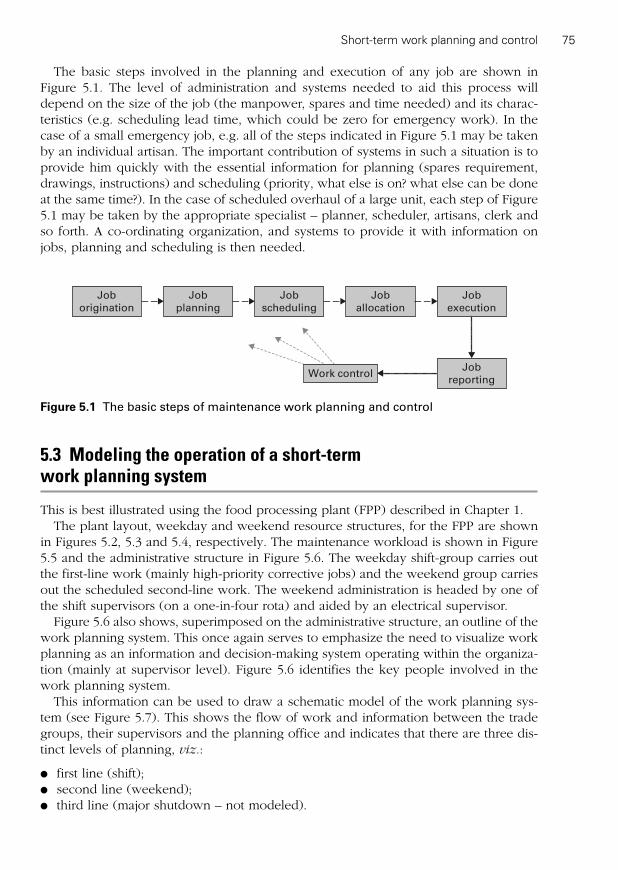
The basic steps involved in the planning and execution of any job are shown inFigure 5.1. The level of administration and systems needed to aid this process willdepend on the size of the job (the manpower, spares and time needed) and its charac-teristics (e.g. scheduling lead time, which could be zero for emergency work). In thecase of a small emergency job, e.g. all of the steps indicated in Figure 5.1 may be takenby an individual artisan. The important contribution of systems in such a situation is toprovide him quickly with the essential information for planning (spares requirement,drawings, instructions) and scheduling (priority, what else is on? what else can be doneat the same time?). In the case of scheduled overhaul of a large unit, each step of Figure5.1 may be taken by the appropriate specialist – planner, scheduler, artisans, clerk andso forth. A co-ordinating organization, and systems to provide it with information onjobs, planning and scheduling is then needed.
Short-term work planning and control 75
Job
origination
Job
planning
Job
scheduling
Job
allocation
Job
execution
Job
reportingWork control
Figure 5.1 The basic steps of maintenance work planning and control
5.3 Modeling the operation of a short-term work planning system
This is best illustrated using the food processing plant (FPP) described in Chapter 1.The plant layout, weekday and weekend resource structures, for the FPP are shown
in Figures 5.2, 5.3 and 5.4, respectively. The maintenance workload is shown in Figure5.5 and the administrative structure in Figure 5.6. The weekday shift-group carries outthe first-line work (mainly high-priority corrective jobs) and the weekend group carriesout the scheduled second-line work. The weekend administration is headed by one ofthe shift supervisors (on a one-in-four rota) and aided by an electrical supervisor.
Figure 5.6 also shows, superimposed on the administrative structure, an outline of thework planning system. This once again serves to emphasize the need to visualize workplanning as an information and decision-making system operating within the organiza-tion (mainly at supervisor level). Figure 5.6 identifies the key people involved in thework planning system.
This information can be used to draw a schematic model of the work planning sys-tem (see Figure 5.7). This shows the flow of work and information between the tradegroups, their supervisors and the planning office and indicates that there are three dis-tinct levels of planning, viz.:
● first line (shift);● second line (weekend);● third line (major shutdown – not modeled).

Maintenance Systems and Documentation76
Figure 5.2 Layout of FPP (reproduced from Chapter 1)
First-linemaintenance
Partsstore
Production
Area 1(services,
raw materials)
Shift operatingteam 1
Area 2(batching,mixing)
Shift operatingteam 2
Area 3(canning,cooking)
Shift operatingteam 3
Area 4(packaging)
Shift operatingteam 4
Support whole siteOverload viacascade
Shifts � 4
Contractors asnecessary
Toolstore
Second-line weekdaymaintenance
10
Electricians
(e)
4
Instrument
(f)
4
Fitters
(c)
2
Welders
(d)
Support whole site
Days
Support whole site
(a) (a) (a) (a)
2 Fitters 2 Fitters 2 Fitters
2 Electricians2 Fitters2 Riggers
(b)(a)
2 Fitters
Workload cascade
Callout
Reconditioning
Figure 5.3 Weekday resource structure (reproduced from Chapter 1)
Four canning linesMechanical
workshop
(c) (d)
Electrical
workshop
(e) (f)
Code:
(a) Shift fitters
(b) Shift electricians
(c) Day fitters, machinists
(d) Welders
(e) Day electricians
(f) Day instrument technicians
Batch conditioning
and mixing
Raw material
processing plant
Main offices
Canning
Hydros (cooking)
Labelling
Packaging
Palletizing
Maintenance
shift
workshop
(a)
Electrical
shift
workshop
(b)
Input goods
store
Main parts
store
A B C D
Finished store
and despatch

Short-term work planning and control 77
Toolstore
Partsstore
Internal laborfrom shift-
group(two groups
per weekend)
Plannedmaintenance
group(some plant
modernization)
Area 3(canning,cooking)
Area 2(batching,mixing)
Area 1(services,
raw materials)
Support whole site
Area 4(packaging)
Machine shopsupport
Contract laboras necessary
Figure 5.4 Weekend resource structure (reproduced from Chapter 1)
100
20
10
Fitters
Shift
Day
Weekendinternal capacity
Shift capacity
Minor plannedmaintenance
Corrective
Preventive
Top up withcontract labor
etc.
N M A N M A N M A, etc.
M T W Th F S Su
Plant running Weekendwindow
First-line workload Second-line workload
Emergency Maintenance
Summershutdownwindow
Third-line workload
100
Emergency maintenance
Figure 5.5 Workload profile for filters (reproduced from Chapter 1)

Main
tenance S
yste
ms a
nd D
ocum
enta
tion
78
Electricians (10) (e)Instrument (4) (f)
Production manager
Shift team
Weekend work
Maintenance manager
Stores
foreman
Mechanical
planning
officer
Second-line
work planning
First-line
work
planningElectrical
planning
officer
Corrective
job file
Weekend
program
and work
orders
Plant
offline
Plant
online
Preventive
job file
Electrical
foreman
Control
technician
Workshop
foreman
(e) (d)
Fitters
Feedback
Emergency
jobs
Electricians
(�4)
Riggers
(10)(a)
(2)(b)
(3)(a)
Plant manager
Chief engineer
Weekendsupervisorand crew
Workshop
supervisorJob
request
Electrical
supervisor
Maintenance
planning supervisor
Shift
product
managers
(�4)
Foremen
(many)
Project section
OperatorsStoremen
Shift
managers
(�3)
Shift
supervisors
(�4)
First-line
planning
Second-line
planning
Plantfailures
Figure 5.6 Administrative structure

5.3.1 The shift work planning system
The function of the shift trade group is to carry out the emergency maintenance and someminor scheduled tasks during the normal weekly shifts. It requires what is essentially areactive planning system centered around the shift supervisor. The main problem is toidentify priorities, especially for those jobs that should be passed back to the planningoffice for weekend execution. A simple way of doing this is to define all jobs that needto be started within twenty four hours of their shift occurrence as first line and to priori-tize them on safety and economic criteria into 1(a)s and 1(b)s. The shift crew will alsodeal with the minor preventive, 1(c), jobs. In general these will be sent through on a sim-ple list from the planning office and fitted into the program as convenient. The major shiftplanning requirement is to quickly obtain information on spares, drawings, safety and jobmethods, hence the usefulness of a computerized maintenance information base.
The work request/work order (e.g. see Figure 5.8) is the main vehicle for conveyinginformation/instructions through this system. In practice this function can be carried outin a number of ways:
● Separate documents for requesting work (the job request) and instigating work (thework order).
● A combined document for both requesting and ordering (see Figure 5.8).
Short-term work planning and control 79
Key
Maintenance planning officer
Pre-planning
RecordShort termprogram
bysupervisor
withwork orders
(WO)
Work analysisand control
Backlog
Informationbase
Job catalog
History
Spares list
Drawings
Manuals
Toshutdownplanning
(third line)
Otherrequests
Update
Weekendmaintenancesupervisor
Weekendprogram
Reports
Emergencies
Weekend programs
Weekly
job list
Update Reports and
WO return
Weekendand
shut-downwork
To cost control
Update
Preventiveschedule
bysupervisor
Forward log
Correctiveschedule
bysupervisor
Shiftteam
(first line)
Plantonline
Weekendteam
Plantoffline
Shift supervisor
Record
Shiftreport
Shiftprogram
First-line work
Job request flowJob flow Feedback information flow
Figure 5.7 Work planning system

● A master work order for larger jobs with numerous linked sub-work orders (linkedvia a common work order number).
● A standing work order per shift artisan to cover the numerous small first-line jobsthat occur across a typical shift.
Maintenance Systems and Documentation80
Maintenance request No. D 0353 Week no. Classification
Plant description
Plant location
Date
Time a.m.p.m.
Requested by Required By
Defect/work required Is production stopped? YesNo
Cause
Action taken
Tradesman'ssignature
DateClockno.
Timeon
Timeoff
Total hours
HRS DECRate
Amount
£ p
Analysis Plant No
Tool BDN
M/c running
M/c breakdown
Not applicable
Wear and tear
Accident andmisuseComponentfailure
Job report
Not applicable
1
2
3
4
1
2
3
4
5
Maintenance foreman's signature
For office use only
HRS DEC
Repair time
Down time
Tic
k o
ne b
ox
Tic
k o
ne b
ox
Figure 5.8 Typical work order
The document can be hard copy or electronic or a combination of both.One of the main difficulties on shifts is collecting good quality failure and repair data.
At worst, it is totally lost and at best the more important events are captured on someform of individual or group shift log. Paperless computerized information systems arebecoming increasingly used in these situations.
The author has observed that in many cases the work order is used mainly toprovide costing data rather than to co-ordinate work and indicate job methods.

One of the planning difficulties in the case of shift-groups is the co-ordination of resources,across shifts, for emergency jobs which take longer than a single shift. One obvious wayof facilitating this task is to allow the shift supervisors a short overlap for updating eachother. Some companies frown on this practice, however, if it increases overtime.
5.3.2 The weekend work planning system
The link between the planning systems for shift work and for weekend work is theplanning office. Any job which, in the shift supervisor’s judgment, meets the priorityand planning guidelines for second-line work – mainly weekend work – is referredback to that office. Modification and corrective work from other sources, e.g. from theproduction or engineering departments, that needs maintenance resources for its exe-cution is similarly referred.
The usual procedure is that any incoming job has to be notified on a maintenancework request order (indicating such basic information as requester, job description, pri-ority and so on). Such jobs can be requested by telephone with hard paper back up, viaplanning meetings or by direct input into a computer system. The information on pre-ventive jobs will already be held by the planning office system as part of the previouslyagreed preventive schedule.
The main function of the weekend planning system is planning and scheduling theweekend work. Part of the initial job-recording activity is to identify those jobs that are bestcarried out within the shutdown plan and to enter them into the job list for this (see nextsection), all other work being entered into the weekend system. The main function of pre-planning is to ensure that any long lead-time resources required, e.g. spares, are identifiedand ordered before the relevant job is entered into the schedule of outstanding tasks. This,in turn, requires an understanding of the job procedure – in outline at least. It is important,therefore, that the system identifies who is responsible for specifying the job method. Inthe case of the FPP this was done jointly by the planner and the supervisor, some pro-cedures being already recorded in the job catalog (part of the plant information base).
Identification of the job procedure is a key part of the planning process and canbe accomplished in a number of ways:
● In the case of standard jobs (jobs that occurred previously and the job methodhas been recorded in the job catalog) the procedure already exists.
● The supervisor/planner may be familiar with the equipment and be able tospecify the job method (this is the case in particular with simple jobs).
● Where there is uncertainty as in the case of an equipment malfunction the ini-tial job may go out as a ‘trouble shoot’.
● For modification work/construction work a separate planning group may beresponsible for setting up the drawings, job procedures and spares, etc.
After pre-planning, the corrective jobs, with estimates of their durations and trade-forcerequirements, can be entered into the job schedule, where they are filed according tosupervisor, plant unit and status (online, offline, etc.), priority and approximate weekof execution.
It can be seen that Figure 5.7 separates the preventive from the corrective schedules.Modern software packages, however, are based on a combined job list and schedule –each job being identified, categorized and scheduled via a code. It will be appreciated
Short-term work planning and control 81

that the job list is a record of all the outstanding work and that it can be presented as ahistogram of future resource demand (categorized by job priority) and compared withthe forecast of weekend completion of such work. This is an essential part of mainte-
nance work control.
At each planning level there is a need for an appropriate work planning meeting. Theshift maintenance system supervisors should, therefore, participate in the daily produc-tion meeting which, among its other activities, should review plant availability and anyfailures over the previous 24 hours. Similarly, there is a need for a weekly maintenanceplanning meeting (involving supervisors and manager) which liaises with the weeklyproduction planning meeting (which should include a maintenance representative).The function of the weekly maintenance meeting is to review outstanding work andplant priorities and to decide on a weekend program.
In the FPP the designated weekend supervisor – responsible for the allocation, qual-ity and control of the weekend work – would be a member of the weekly maintenanceplanning meeting, the weekend program having been agreed by the preceding Thursday.It would be his responsibility to carry out the secondary planning and job allocation,i.e. to check spares, drawings, work orders, methods, safety permits, co-ordination withother trades (electrical, production, cleaners), etc. – the necessary manpower, includingcontract labor, being agreed in conjunction with the planner.
The point that is being made here is that the key function of the planner is to carryout all the planning tasks that are necessary but could not be carried out (easily) bythe supervisor (who is on shifts). In particular this will involve the pre-weekendplanning of multi-resource jobs (requiring different trades, cranes, spares, scaf-folding, etc.). The supervisor is left to do the weekend planning (co-ordinating, oftrades, allocation of jobs, etc.) and reporting.
5.3.3 Feedback of maintenance data for control
One of the responsibilities of the maintenance supervisor (shift and weekend) is thefeedback of maintenance information. Such data can be captured on work orders,weekend or shift logs, or event reports – perhaps via direct computer input. The typi-cal requirement might be for information on:
● additional work needed, or work not completed;● resource usage (trades – with job times, spares usage, etc.);● work carried out;● causes of failures or potential failures, etc.
Some of this is needed for work control, some for updating the information base andsome for other purposes such as control of maintenance cost, of plant reliability, ofwork planning effectiveness, etc. (see Chapter 4). It is for these reasons that the author
describes work planning as the key maintenance system. This chapter will restrict itselfto the use of such data for work planning and control purposes, viz.:
● For the information base (see Figure 5.7), an essential aid to work planning, theeffectiveness of this database depending, however, on its continuous update – i.e. on
Maintenance Systems and Documentation82

the input of new standard jobs into the job catalog, plant history update, update ofdrawings and manuals after modifications have been carried out, etc.
● For work control, achieved via the feedback of information on jobs completed, timetaken, jobs deferred, etc. This allows the main job lists/schedules to be updated, aview obtained of the outstanding work – forward log and backlog – compared to thecompletion rate (see Figure 5.9) and extra resources (contract or in-house) to bebrought in if needed.
Short-term work planning and control 83
Outstandingwork list
by supervisor or work groups
(man hours/man-days, etc.)
Workcontrol
Contractlabor
Labormarket
Weekendplanned
Workcompleted
Weekend
planned
work
Weekendmaintenance
crews
Update
Temporary
labor
adjustment
Information on
resource available less
holidays and sickness
Preventiveschedule(job time
estimated)
Second-line job input(job times estimated)
(Corrective jobs)
5
2
Increasingpriority
Information on:
• Total outstanding workload by priority (5, 4, 3 and 2)
• Workload profile (workload against time) Note: Average weekly
input of correctiveand modification jobs
�
Average %scheduled
preventive jobs
Average weekendoutput of jobs
Increase internal labor force
Current level(total man-days)5
4
3
2
Key
Feedback on work complete
Labor controlWork input and output
Figure 5.9 Principles of work control
Work control should also include the de-briefing procedure necessary after any unitoverhaul, or even after the weekend program, the purpose being to ask ‘Did we do itright?’, ‘Could we do it better?’
5.4 Comments on work planning and work control
The FPP was chosen to discuss maintenance work planning because it has several fea-tures that render the operation of its work planning system straightforward, viz.:
● The first-line work is done by shift teams, and the second-line work by weekendteams, so the chance of the first-line work interfering with the execution of the
scheduled work is minimized. Where a single group carries out both categories ofwork, the planning becomes considerably more difficult. Questions arise concerninghow much planned work should be committed into the weekly program. This issometimes estimated as follows:
This might then allow the program to have both a committed and a flexible work element, in which case priority rules must be clearly stated.
The author has also noted in such situations that it is usual for the preventivework not to be prioritized. On asking the reason for this he is often told ‘it isbecause it must be carried out’. Unfortunately the pressure of the high-prioritycorrective work often means that it is not carried out (especially the routines).The comment then is ‘we will make sure to do it next time’ and sometimes‘the routine is not important anyway’. My response to this is ‘if the routine is not important it should have been sorted out during the assessment of thelife plan and should not be there’. If the routine is important it should have apriority and, if missed once should be top priority next time.
● The role of the planners can be clearly defined, and their use justified, as regards theweekend work. This is because the shift supervisors cannot carry out the planningrole as part of their main responsibilities. They act as weekend supervisors on onlyonce in 4 weeks – they need the ongoing planning back up. Situations do occur,however, where the supervisor acts as ‘planner’, the leading hand as ‘supervisor’ andthe planner as ‘clerk’. In other words, there may be second-line situations, especially
where good computerized maintenance systems are in use, where a specialized plan-
ner may not be required.
Review Questions
R5.1 The work planning system used in the case study of Chapter 11 (ammoniaplant) was not working well. List the main reasons for this and identify thekey problem.
R5.2 Management are aware that the success of the maintenance control sys-tems will depend, in part, on successful collection of data from the workplanning systems. List some of the difficulties that may be encounteredwhen trying to achieve this.
R5.3 A company operates an open computer controlled stores as part of theirmaintenance work planning. Artisans are expected to computer locatetheir own parts and computer record their withdrawal. Discuss the advan-tages and disadvantages of this system.
5.5 Guidelines for the design of work planning systems
Figure 5.10 shows a resource structure for an alumina refinery. Figure 5.10 shows three resource levels corresponding to the centralized shift crews (five crews in total,
Scheduled workloadfor the next period
�
Workload capacityof trade group
for thee next period
Average level of
�
non-plannable work likely
in the next periood
Maintenance Systems and Documentation84

Short-te
rm w
ork
pla
nnin
g a
nd c
ontro
l85
Plant services crew
(cranes, descale, etc.)
(days)
Shutdown crew
machinist (days)
Shutdown crew
electrician (days)
Workshop services
(days)
Similar to digestion
Work flow
Second-line
corrective and
modification work
Cover all site
First-line cascade on
call out or to
dayshift
Similar to digestion
Shutdown and major
modification workContract reconditioning,
fabrication work
Contract
as necessary
Contract reconditioning,
fabrication
Precipitation
area
Calcination
area
Digestion
areaBoiler
houseRaw
materials
Calcination
area
Raw materials
second-line
crew (days)
Boiler house
second-line
crew (days)
Digestion
second-line
crew (days)
Calcination
second-line
crew (days)
Precipitation
second-line
crew (days)
Calcination
second-line
crew (days)
Centralized
first-line crew
7 day � 3 shift
cover
Figure 5.10 Simplified version of proposed resource structure for alumina refinery
one per shift covering 7 days first line), plant located decentralized day crews (six crewsin total – second line) and centralized shutdown and plant service crews (third line).
Figure 5.11 shows a schematic work planning model which has been designedaround this resource structure. The model includes the first-line planning, one area(digestion) to represent second- and third-line planning (shutdowns).
Each of the crews has its own area supervisor. Various decentralized plant-basedplanning offices, e.g. for the digestion plant, have been set up within an area planner toassist the area maintenance supervisors. There is also a shutdown planner centrally locatedin a shutdown planning office.
The planning system is fully computerized having a comprehensive maintenanceinformation base and an information analysis and control module. The software is fullyintegrated with the other company functions, e.g. stores, general ledger, etc.
This example draws attention to several important aspects regarding the design ofwork planning systems, viz.:
(i) The work planning system should be designed around the resource structure tak-ing into consideration the levels of resource and the characteristics of the work-load. If, as in the present example, there are three levels of resource then it isnecessary to have three corresponding levels of work planning.
The scheduling lead time of the emergency work dealt with by the shift crews isshort and planning centers around the supervisor and artisans. The main require-ment from the documentation system is to provide the necessary informationquickly.
With the second-line crews scheduling lead times vary from 24 hours to severalweeks and the jobs are tackled by priority. Planning should center around therespective planners, e.g. the planner of Figure 5.11, who provides a weekly list ofcommitted work taking into account the first-level spillover. His main function isto assist in the planning of individual jobs and to keep the schedules and work listsup to date. In addition he assists in the co-ordination of multi-trade jobs and pro-vides general clerical back up. In Figure 5.11, example planning and scheduling isa joint planner–supervisor effort. It must be emphasized that with the most up-to-date computerized planning system the area planning is often carried out by thesupervisor or team leader (i.e. no planner) especially if the areas have becomeself-empowered.
Shutdown planning for major parts of the refinery exploits the presence ofredundancies, which enable plant (a boiler, kiln, etc.) or a process channel (e.g. adigester stream) to be taken offline – perhaps reducing capacity but never shuttingdown the complete refinery. The centralized shutdown crews and the service
crews then go to the area concerned and supplement the local resource, the plan-ning center of gravity being close to the shutdown planning office.
The function of the shutdown planner is to ensure that the shutdowns arescheduled so as to smooth the workload of the centralized resource. This requiresclose co-operation with the production planners. In addition, he ensures that thejobs are properly planned (in particular, long lead-time spares are identified) andthe resources properly co-ordinated. The planning lead time for shutdown work isoften in excess of 3 months (see the next chapter).
Maintenance Systems and Documentation86

Short-te
rm w
ork
pla
nnin
g a
nd c
ontro
l87
Digestion planner
Preventiveschedule bysupervisor
Record andpre-plan
Correctiveand modificationwork scheduledby supervisor
Short-termprograms
bysupervisor
withwork orders
Work analysisand
work control
Shutdownpreventiveschedule
Correctivejob list by
unit
Short-termtask relatedbar charts
Shutdown planner
Masternetwork Shutdown
supervisionShutdown
crews
Digestionmaintenancesupervision
Shift maintenancesupervision
Barchartschedules
Feedback,
WO return, etc.
UpdateWO's,
programsand task related
bar charts
Feedback
Day to day
via WO return
Weekly program
and WO's
Feedback
Feedback
Routines
Direct requestfor
correctivemaintenance
andmodification
work
Centralizedfirst-line
shift crew
Digestionsecond-line
crewWO
WO
Plantoffline
Plantonline
only
Corrective work (all priorities)Corrective work (second and third line)
Area planningCentral planning
Direct requestfor correctivework (days)and first-line
cascade
Firstline
Third-line
Informationbase
Work flow
Feedback on work statusand information flow
Job requests
Weeklyprogram
Shiftprogram
Figure 5.11 Work planning system for an alumina refinery

(ii) The design of the overall planning system should allow job requests to flow to thebest level for planning, scheduling and controlling them, e.g. shift supervisor levelfor emergency work. In the example, jobs specific to the digestion stream that do
not require the plant to be offline should be handled at the digestion planninglevel, those that do at shutdown level. By ‘best’ is meant where it is easiest todecide on priorities, plant status and job methods.
(iii) A set of job priority rules – which should indicate the initial planning level (e.g.emergency maintenance to be planned at first-line supervisor level) – should bedefined and clearly understood by maintenance planning and supervision and byproduction.
(iv) The function, responsibility and lines of communication between each of the plan-ning levels must be clearly defined.
(v) The right information about the workload and the resources must be available tothe designated planner of the job at the right time.
(vi) The planner must have the authority (or access to it) to take the decisions (e.g. allo-cation of priorities) which affect the workload and resources.
Exercise
E5.1 Use Figure 5.7 and/or Figure 5.11 (which ever is the most appropriate) asa template to draw a work planning model for your own company.Remember that you will need to draw the resource structure and admin-istrative structure before you draw the work planning system.
5.6 Safety aspects
There are many aspects of the maintenance work planning system that are important tothe safety of personnel and of plant operation:
● Plant isolation procedures, including safety permits and the isolation tagging system,are essential in a hazardous area and must be incorporated into the work planningsystem.
● Standard job procedures, including methods, spares used, tools and safety proce-
dures, should be mandatory in hazardous plants.● All major overhauls should be preceded by a discussion of safety procedures and
requirements.● All contract labor coming on to site should be subject to job quality checks and
should go through a safety induction program appropriate to the site and to each ofits areas.
● All spare parts, whether new or reconditioned (internally or externally), should besubjected to a quality assurance program. This is, especially if they are destined forhazardous areas or functions.
● Formal procedures must be established for updating drawings and manuals afterplant modification – and for communicating manufacturers’ requirements or modifi-cations to the holders of such information.
Maintenance Systems and Documentation88

Review Questions
Answer the following review questions by referring to Figure 5.11.R5.4 Explain why each of the following statements is probably correct:
(a) For the shift crews the center of gravity of maintenance work planninglies well toward the shift supervisor.
(b) Both for the shutdown crew and the workshop-based crews the cen-ter of gravity of work planning lies well towards the shutdown plan-ning office.
R5.5 Some of the planning and scheduling for the second-line decentralizedarea crews is carried out by the area supervisors and some by the areaplanners:(a) Identify the work that, on the one hand, is best planned and scheduled
by the area supervisors and, on the other, by the area planner.(b) Should jobs that go to the area supervisors via the area planners be
planned and scheduled completely by the planners? Should this goso far as the allocation of jobs to specific artisans?
(c) Explain some of the key difficulties that an area planner might have inplanning a multi-trade, multi-resource job for his area crew.
(d) Explain the importance, for the second-line area supervisors, of a jobpriority system.
(e) Why is it important to estimate job times before adding the jobs to thecomputerized job lists and schedules?
(f ) Explain why it is important that all jobs are entered into the planningsystem (before their execution where possible, but perhaps after-wards in the case of emergency work).
R5.6 Describe what is required from the work planning system if it is to ensurethat the plant will operate safely and that maintenance will be carried outsafely.
Short-term work planning and control 89
Review Questions Guidelines
R5.1 ● Software said to be user-unfriendly.● Poor training in the use of the computerized work planning system.● Pedantic isolation procedures that needed streamlining.
The key problem was that the shift operator–maintainer teams refused tocarry out first-line maintenance. This work cascaded to the day teams anddisrupted their scheduled work.
R5.2 ● Artisans’s resistance to providing data (habitual reluctance to co-operate,lack of time, dislike of writing, etc.).
● Poor quality of data (due to insufficient understanding of data needs, poordefinition of requirement, etc.).
● Trade union insistence that data collection must be financially rewarded.● Lack of training in the use of the documentation system.● Poorly designed documentation systems which do not facilitate effective use
of data and which, therefore, inhibit any enthusiasm for its collection.● Lack of commitment on the part of supervisors and other managerial staff to
data collection.
Maintenance Systems and Documentation90
R5.3 Advantages – low cost of operating the stores. Disadvantages – includes theuse of artisans’s time, parts withdrawal not being recorded.
R5.4 First-level work planning deals with jobs that are of high priority (planning leadtime less than 24 hours) or are small jobs that are not subject to planning inputfrom outside (financial, the ordering of spares, etc.). The shift supervisor, there-fore, plans and schedules such work.
In the case of shutdown work (and also of work undertaken by the workshop-based crews) the planning lead time may be as long as a year, so a great dealof financial and work planning is essential. Most of the planning and resourc-ing decisions can only be taken with information which is not readily availableto the crew.
R5.5 (a) Area supervisors: jobs that do not require information or resources fromoutside, or are not subject to external financial constraints. As long as suchjobs are entered into the system they are adequately visible to the areaplanner.Area planner : jobs that call for co-ordination with other departments(including operations or production), that involve the use of a centralized,resource, or are subject to financial constraints.
(b) No. The area planner should always leave detailed and shorter-term plan-ning and allocation to the area supervisors who are much more aware of thecapability of their resources and of the short-term planning characteristics.
(c) Communication with other supervisors and contract resources. Co-ordinationof resources to arrive at the right place at the right time.
(d) It ranks the jobs according to their importance to production and/or safety,which facilitates estimation of their scheduling horizons.
(e) Because it enables the workload to be profiled and compared with theavailable resources. This is an essential part of work control. Estimates of
job times also promotes better short-term planning.(f ) In order to ensure the capture of data – on man-hours needed and expended,
on cost of materials and on plant history.R5.6 ● Plant isolation procedures.
● Standard procedures for hazardous jobs.● Safety review meetings before major overhauls.● Safety inductions for new workers and for contract.● Quality assurance review of all new and reconditioned parts.● Updates of drawings and manuals after a plant modification.● Plant history recording and analysis to anticipate potential safety problems.

Management of plant turnarounds –Part 1: Network analysis6
‘If seven maids with seven mops
Swept it for half a year,
‘Do you suppose,’ the Walrus said,
‘That they could get it clear?’
I doubt it,’ said the Carpenter,
And shed a bitter tear.’
Lewis Carrol
Chapter aims and outcomes
To explain the principles, concepts and procedure of network analysis.
On completion of this chapter you should be able to:
● draw a network for a small overhaul and identify the critical path and the task floats;● convert the network into a bar chart and draw manpower loading histograms;● appreciate how the network and bar charts can be used as the main planning and
control vehicle for major shutdowns.
Chapter route map
Book divisions
Introductory chapters
Budgeting and control
Work planning andwork control
Spare partsmanagement
Documentation
Case studies
This chapter in the division
Chapter 5Short-term workplanning and control
Chapter 6Management of plantturnarounds – Part 1:Network analysis
Chapter 7Management of plantturnarounds – Part 2:Turnaroundmethodology
Chapter topics
6.1 Introduction
6.2 Terms, concepts and definitions in network analysis
6.3 The network planning procedure
6.4 Comments

6.1 Introduction
Major plant turnarounds1 pose problems of work planning and scheduling that arequite different from those presented by the ongoing work. The principal organizationalcharacteristics of the typical third-line workload that they generate are as follows:
● A large peak in resource requirement, which has to be met by an influx of labor fromelsewhere.
● A multiplicity of interrelated jobs, all of which have to be co-ordinated if the work isto be completed on time and to cost.
● A long lead time (often many months) for scheduling the work.● Large cost penalties should, the planned duration of the shutdown2 itself, be exceeded.
Planning and controlling the work for a major shutdown is therefore an exercise whichis quite separate from the corresponding task for the ongoing work (although it relatesto it). This can be seen from Figure 5.7, which models the complete work planning sys-tem for an alumina refinery. All jobs originating in the ongoing planning system (or fromelsewhere) that can only be undertaken during the major shutdown are transferred intothe shutdown corrective job list. The sum total of these (which can be many thousandsfor a large overhaul3) may require many months of planning and scheduling in order tobuild them into a shutdown program. Initially such a program is expressed as a masternetwork (the master network is assembled using the ideas of network analysis). This net-work is then broken down into a series of short-time-frame bar charts (see Figure 6.1)with accompanying task specifications. It can be seen from Figure 5.7 that a number of
Maintenance Systems and Documentation92
Key words
● Critical path analysis● Network analysis● Project planning● Program evaluation and review techniques● Turnaround planning● Shutdown planning● Task-on-arrow● Task-on-node● Bar chart
1Turnaround: An engineering event that takes place during a plant shutdown and involves theinspection, overhaul and, where necessary, the modification of existing equipment and theinstallation of new equipment.
2Shutdown: The period of time from the moment the plant is take offline to the moment it isbrought back online.
3Overhaul: A comprehensive examination of a plant, or a major part of it, and its restoration toan acceptable (or desired) condition.

planning functions are common to both the ongoing and the shutdown work planningsystems, viz. information base, work analysis, work order system, cost control.
Before discussing turnaround management in any detail it is necessary first to under-stand the concepts, principles and procedure of network analysis. Network analysis is ageneric name given to graphic techniques, e.g. critical path analysis (CPA), program eval-uation and review techniques (PERT), etc., used for studying the interrelationship betweentasks/jobs in complex projects, e.g. a major plant overhaul. Computerized network analy-sis methods have long superceded the traditional bar chart, see Figure 6.1, for establish-ing the master networks for plant turnarounds. However, bar charts are still computergenerated from the master network for monitoring and controlling the progress of theturnaround.
6.2 Terms, concepts and definitions in network analysis4
Task: An operation consuming time only, or time and resources. A task may be physi-cal (such as the fabrication of an element of a structure) or it may be abstract (such asthe accomplishment of a particular stage in a design calculation).
Event: A state of the project when all preceding activities have been completed andbefore any succeeding activity has started.
Management of plant turnarounds – Part 1 93
Hours
1 2 3 4 5 6 7 8 9 10 11 12
Erect scaffolding
Remove pipework
Inspect vesselinternals
Repair vessel lining
Overhaul relief valve
Figure 6.1 Bar chart
4This method of representation, which has been adopted throughout this section, is known as‘task-on-arrow (TOA)’, as opposed to the alternative ‘task-on-node (TON)’ method. An expla-nation of TON, with worked examples, was given in Kelly, A., Maintenance Planning and
Control (pp. 232 et seq.), Butterworths, 1984.

Graphic representation of tasks and events: Each task in the project is represented bya directed line which forms a link in the network. The direction and length of the linehas no particular significance in representing the flow of time. Events are representedby circles at each end of a task line. The arrowhead on the line identifies the eventsimmediately preceding and following the task (see Figure 6.2). The identity of the taskis given by a label inside each circle, and so the line shown in Figure 6.2 denotes the‘ij’ task, linking the prior event ‘i’ with the following event ‘j’.
Interrelationship between tasks: The interrelationship between tasks is embodied inthe convention that a task may not begin until all preceding tasks in the same path arecomplete. Thus, in the example shown in Figure 6.3 the event 3 is not regarded as hav-ing been reached until both the tasks 1–3 and 2–3 have been completed, and until thatstage has been reached the event 3–4 may not begin.
Start event: Is an event with succeeding but no preceding activities.End event: Is an event with preceding but no succeeding activities.Network: Is a graphic representation of the tasks necessary for achieving the objec-
tives of a project and showing their interrelationships. The nodes of the network areformed by those events which are common to two or more tasks, and the terminals ofthe network are provided by the start event and the end event (see Figure 6.4).
A useful convention in the construction of networks is to treat time as flowing fromleft to right, and to number the events so that for each task the succeeding event has ahigher number than the preceding event.
Maintenance Systems and Documentation94
i j
Figure 6.2 Two events linked by an activity
1
2
3 4
Figure 6.3 Interrelated activities
1
2
3 4 5
Figure 6.4 A network
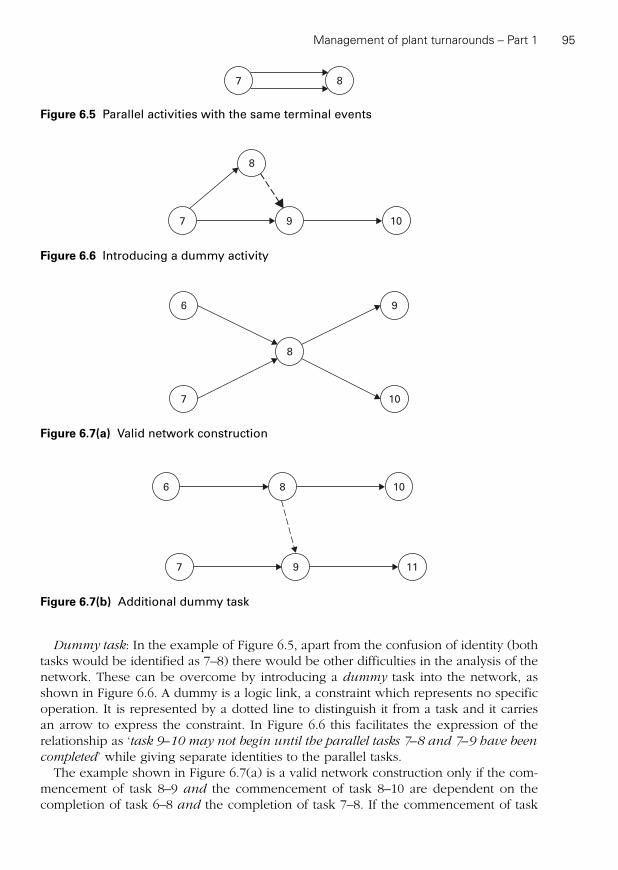
Dummy task: In the example of Figure 6.5, apart from the confusion of identity (bothtasks would be identified as 7–8) there would be other difficulties in the analysis of thenetwork. These can be overcome by introducing a dummy task into the network, asshown in Figure 6.6. A dummy is a logic link, a constraint which represents no specificoperation. It is represented by a dotted line to distinguish it from a task and it carriesan arrow to express the constraint. In Figure 6.6 this facilitates the expression of therelationship as ‘task 9–10 may not begin until the parallel tasks 7–8 and 7–9 have been
completed’ while giving separate identities to the parallel tasks.The example shown in Figure 6.7(a) is a valid network construction only if the com-
mencement of task 8–9 and the commencement of task 8–10 are dependent on thecompletion of task 6–8 and the completion of task 7–8. If the commencement of task
Management of plant turnarounds – Part 1 95
7 8
Figure 6.5 Parallel activities with the same terminal events
7 9
8
10
Figure 6.6 Introducing a dummy activity
8
6 9
7 10
6 8 10
7 9 11
Figure 6.7(a) Valid network construction
Figure 6.7(b) Additional dummy task
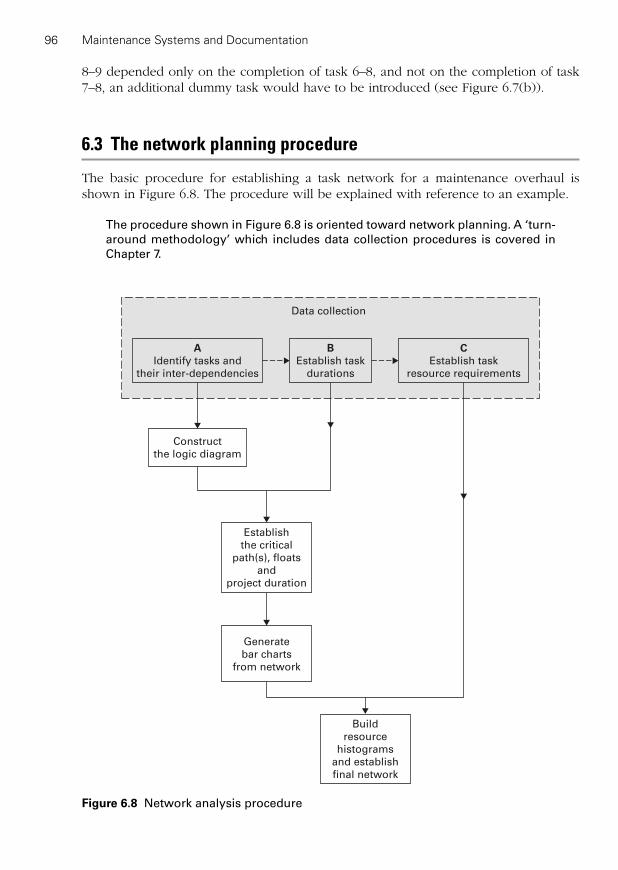
8–9 depended only on the completion of task 6–8, and not on the completion of task7–8, an additional dummy task would have to be introduced (see Figure 6.7(b)).
6.3 The network planning procedure
The basic procedure for establishing a task network for a maintenance overhaul isshown in Figure 6.8. The procedure will be explained with reference to an example.
The procedure shown in Figure 6.8 is oriented toward network planning. A ‘turn-around methodology’ which includes data collection procedures is covered inChapter 7.
Maintenance Systems and Documentation96
Data collection
AIdentify tasks and
their inter-dependencies
CEstablish task
resource requirements
BEstablish task
durations
Construct
the logic diagram
Establish
the critical
path(s), floats
and
project duration
Build
resource
histograms
and establish
final network
Generate
bar charts
from network
Figure 6.8 Network analysis procedure
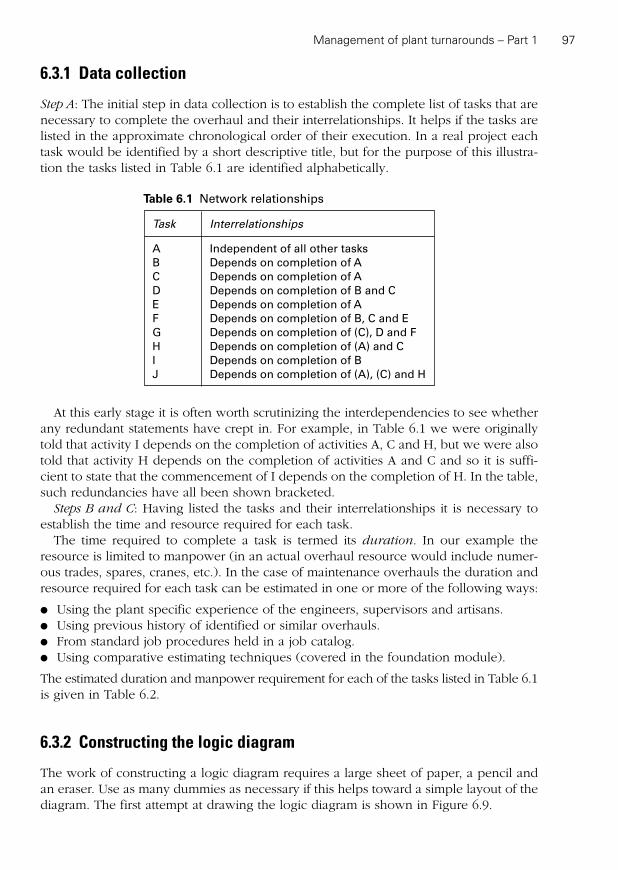
At this early stage it is often worth scrutinizing the interdependencies to see whetherany redundant statements have crept in. For example, in Table 6.1 we were originallytold that activity I depends on the completion of activities A, C and H, but we were alsotold that activity H depends on the completion of activities A and C and so it is suffi-cient to state that the commencement of I depends on the completion of H. In the table,such redundancies have all been shown bracketed.
Steps B and C: Having listed the tasks and their interrelationships it is necessary toestablish the time and resource required for each task.
The time required to complete a task is termed its duration. In our example theresource is limited to manpower (in an actual overhaul resource would include numer-ous trades, spares, cranes, etc.). In the case of maintenance overhauls the duration andresource required for each task can be estimated in one or more of the following ways:
● Using the plant specific experience of the engineers, supervisors and artisans.● Using previous history of identified or similar overhauls.● From standard job procedures held in a job catalog.● Using comparative estimating techniques (covered in the foundation module).
The estimated duration and manpower requirement for each of the tasks listed in Table 6.1is given in Table 6.2.
6.3.2 Constructing the logic diagram
The work of constructing a logic diagram requires a large sheet of paper, a pencil andan eraser. Use as many dummies as necessary if this helps toward a simple layout of thediagram. The first attempt at drawing the logic diagram is shown in Figure 6.9.
Management of plant turnarounds – Part 1 97
Task Interrelationships
A Independent of all other tasksB Depends on completion of AC Depends on completion of AD Depends on completion of B and CE Depends on completion of AF Depends on completion of B, C and EG Depends on completion of (C), D and FH Depends on completion of (A) and CI Depends on completion of BJ Depends on completion of (A), (C) and H
Table 6.1 Network relationships
6.3.1 Data collection
Step A: The initial step in data collection is to establish the complete list of tasks that arenecessary to complete the overhaul and their interrelationships. It helps if the tasks arelisted in the approximate chronological order of their execution. In a real project eachtask would be identified by a short descriptive title, but for the purpose of this illustra-tion the tasks listed in Table 6.1 are identified alphabetically.
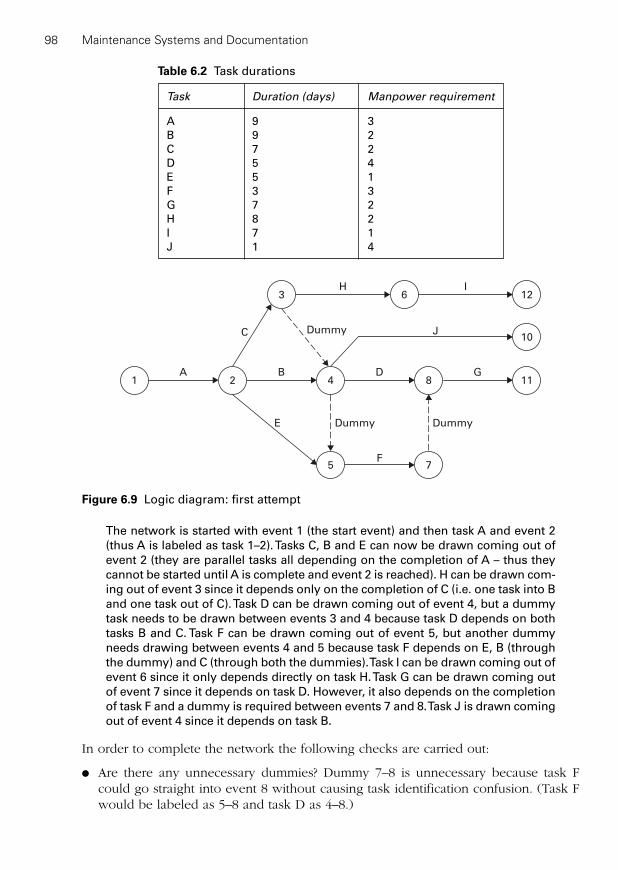
The network is started with event 1 (the start event) and then task A and event 2(thus A is labeled as task 1–2). Tasks C, B and E can now be drawn coming out ofevent 2 (they are parallel tasks all depending on the completion of A – thus theycannot be started until A is complete and event 2 is reached). H can be drawn com-ing out of event 3 since it depends only on the completion of C (i.e. one task into Band one task out of C). Task D can be drawn coming out of event 4, but a dummytask needs to be drawn between events 3 and 4 because task D depends on bothtasks B and C. Task F can be drawn coming out of event 5, but another dummyneeds drawing between events 4 and 5 because task F depends on E, B (throughthe dummy) and C (through both the dummies). Task I can be drawn coming out ofevent 6 since it only depends directly on task H. Task G can be drawn coming outof event 7 since it depends on task D. However, it also depends on the completionof task F and a dummy is required between events 7 and 8. Task J is drawn comingout of event 4 since it depends on task B.
In order to complete the network the following checks are carried out:
● Are there any unnecessary dummies? Dummy 7–8 is unnecessary because task Fcould go straight into event 8 without causing task identification confusion. (Task Fwould be labeled as 5–8 and task D as 4–8.)
Maintenance Systems and Documentation98
Task Duration (days) Manpower requirement
A 9 3B 9 2C 7 2D 5 4E 5 1F 3 3G 7 2H 8 2I 7 1J 1 4
Table 6.2 Task durations
A
C
B
F
Dummy
Dummy
Dummy
H
D
I
G
J
E
1 2 4
5 7
8
63
11
10
12
Figure 6.9 Logic diagram: first attempt

● Are there any tasks dangling? i.e. not connected to an end event. Tasks I, J and G areall dangling. This makes event 9 the end event and connects tasks J and G straightinto it.
● Is the logic correct? This is checked by using Table 6.1 and starting at the end task.– Is task I dependent directly only on task H? The diagram is correct since only task
H comes into event 6.– Is task J dependent directly only on task B? The logic is incorrect because the net-
work shows task J dependent directly on task B and through the dummy on taskC. The network diagram has to be redrawn to correct this. The rest of the logic ischecked out correctly.
The completed logic diagram is shown in Figure 6.10.
Management of plant turnarounds – Part 1 99
A
C
B
D
F
J
H
I
GE
1 2
3
4
5
6
14
10
12
Figure 6.10 Completed logic diagram
6.3.3 Establishing the critical path, floats and overhaul time
Any uninterrupted sequence of events traced through a network, from the start event tothe finish event, constitutes at path, e.g. A(1–2), B(2–4) and J(4–14) of Figure 6.10. Inany network there is always one path, from the start event to the finish event, which isof particular interest, the total duration of it being not less than that of any other pathbetween the same two events. This is termed the critical path. The total duration of thecritical path is the duration of the overhaul, and the duration of the overhaul is gov-erned by the critical tasks on this path.
To determine the critical path in a network it is necessary to examine the earliest pos-
sible and the latest allowable times for each event, after considering all possible routesthrough the network. The estimated durations, for the example whose network hasalready been drawn, are given in Table 6.2.
The earliest possible times are now calculated (see Figure 6.11). Within each event cir-cle the event ordinal number is given at the top, the earliest possible time at bottom-left,

and the latest allowable time at bottom-right. The time of the start (event 1) is set to zero,and the times for other events determined by addition of the task times. Thus:
Earliest time to event 2 � 0 � 9 � 9 daysEarliest time to event 3 � 9 � 7 � 16 daysEarliest time to event 4 � 9 � 9 � 18 days
There are two alternative routes to 5, i.e.:
Time to node 5 via event 3 � 16 � 0 � 16 daysTime to node 5 via event 4 � 18 � 0 � 18 days
Clearly the route via event 4 determines the earliest time at which event 5 can bereached, if both paths have to be completed (which, from the network definitions, theymust), so the earliest time for event 5 is taken as 18 days. After working through thewhole network in this way it is found that the earliest time for the end event (event 14)is 30 days. We now know that the duration of the overhaul will be 30 days, but the crit-ical path has yet to be determined.
The latest allowable times for each event are found by taking the latest time for theend event (event 14) to be equal to the earliest time and then working back through thenetwork to the other nodes, subtracting the task times. Thus:
Latest time to event 10 � 30 – 7 � 23 daysLatest time to event 6 � 23 – 3 � 20 days
There are two routes connecting event 10 with event 5:
By direct route, latest time for event 5 � 23 – 5 � 18 daysBy route via event 6 latest time for event 5 � 20 – 0 � 20 days
Clearly, event 5 must be reached by the 18th day if the overhaul is not to be delayed.Working through the whole network in this way the latest allowable times of all theevents are determined. The latest time for the start event should be found to be zero.
Maintenance Systems and Documentation100
3 12
4 14
6 10
5
2A(9)
C(7)
B(9)
D(5)
F(3)
J(7)
H(8)
I(1)
G(7)
18 29
18 30
20 23
18
9
16 24
18 30
18 23
18
9
E(5)
1
00
Figure 6.11 Completed representation of the network
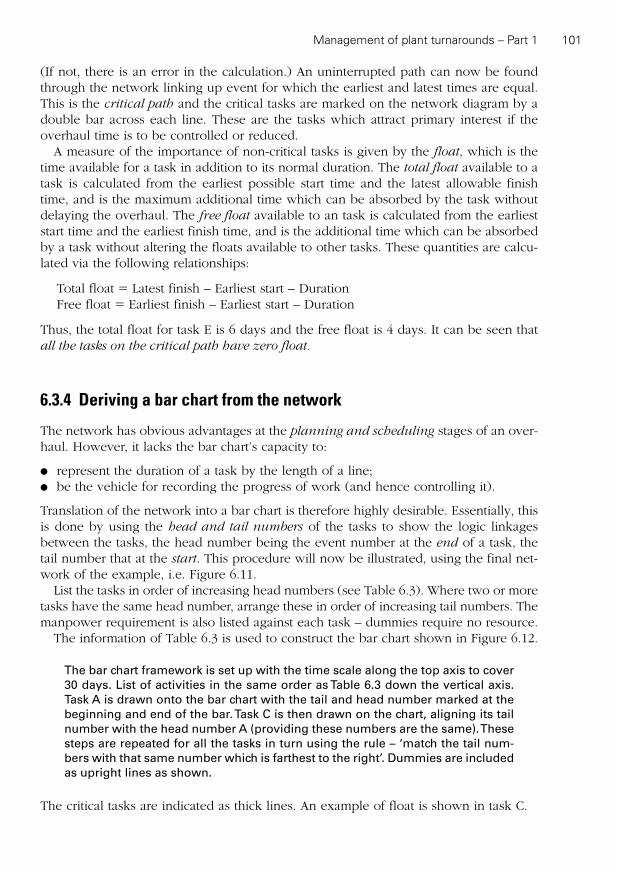
(If not, there is an error in the calculation.) An uninterrupted path can now be foundthrough the network linking up event for which the earliest and latest times are equal.This is the critical path and the critical tasks are marked on the network diagram by adouble bar across each line. These are the tasks which attract primary interest if theoverhaul time is to be controlled or reduced.
A measure of the importance of non-critical tasks is given by the float, which is thetime available for a task in addition to its normal duration. The total float available to atask is calculated from the earliest possible start time and the latest allowable finishtime, and is the maximum additional time which can be absorbed by the task withoutdelaying the overhaul. The free float available to an task is calculated from the earlieststart time and the earliest finish time, and is the additional time which can be absorbedby a task without altering the floats available to other tasks. These quantities are calcu-lated via the following relationships:
Total float � Latest finish – Earliest start – DurationFree float � Earliest finish – Earliest start – Duration
Thus, the total float for task E is 6 days and the free float is 4 days. It can be seen thatall the tasks on the critical path have zero float.
6.3.4 Deriving a bar chart from the network
The network has obvious advantages at the planning and scheduling stages of an over-haul. However, it lacks the bar chart’s capacity to:
● represent the duration of a task by the length of a line;● be the vehicle for recording the progress of work (and hence controlling it).
Translation of the network into a bar chart is therefore highly desirable. Essentially, thisis done by using the head and tail numbers of the tasks to show the logic linkagesbetween the tasks, the head number being the event number at the end of a task, thetail number that at the start. This procedure will now be illustrated, using the final net-work of the example, i.e. Figure 6.11.
List the tasks in order of increasing head numbers (see Table 6.3). Where two or moretasks have the same head number, arrange these in order of increasing tail numbers. Themanpower requirement is also listed against each task – dummies require no resource.
The information of Table 6.3 is used to construct the bar chart shown in Figure 6.12.
The bar chart framework is set up with the time scale along the top axis to cover30 days. List of activities in the same order as Table 6.3 down the vertical axis.Task A is drawn onto the bar chart with the tail and head number marked at thebeginning and end of the bar. Task C is then drawn on the chart, aligning its tailnumber with the head number A (providing these numbers are the same). Thesesteps are repeated for all the tasks in turn using the rule – ‘match the tail num-bers with that same number which is farthest to the right’. Dummies are includedas upright lines as shown.
The critical tasks are indicated as thick lines. An example of float is shown in task C.
Management of plant turnarounds – Part 1 101
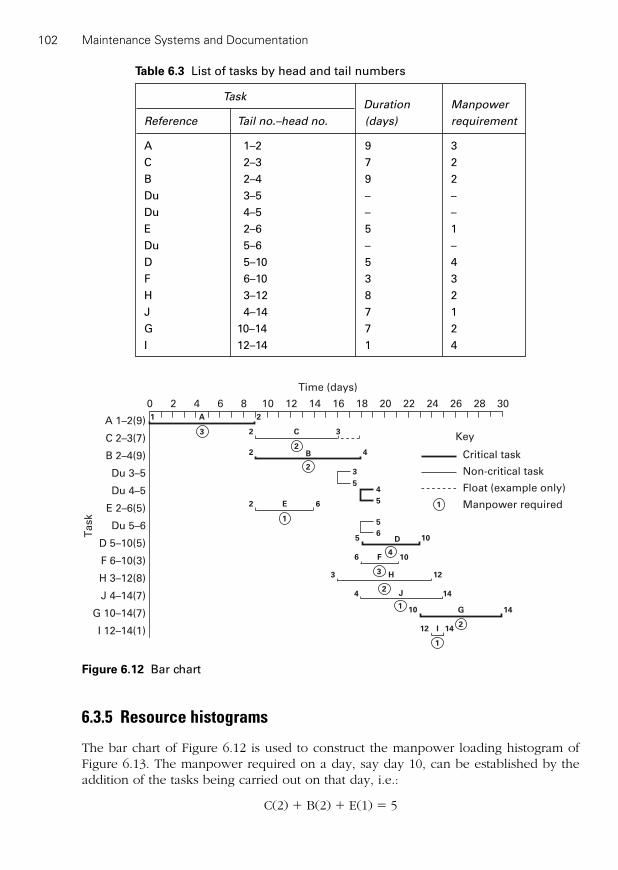
6.3.5 Resource histograms
The bar chart of Figure 6.12 is used to construct the manpower loading histogram ofFigure 6.13. The manpower required on a day, say day 10, can be established by theaddition of the tasks being carried out on that day, i.e.:
C(2) � B(2) � E(1) � 5
Maintenance Systems and Documentation102
TaskDuration Manpower
Reference Tail no.–head no. (days) requirement
A 1–2 9 3
C 2–3 7 2
B 2–4 9 2
Du 3–5 – –
Du 4–5 – –
E 2–6 5 1
Du 5–6 – –
D 5–10 5 4
F 6–10 3 3
H 3–12 8 2
J 4–14 7 1
G 10–14 7 2
I 12–14 1 4
Table 6.3 List of tasks by head and tail numbers
A 1–2(9)
C 2–3(7)
B 2–4(9)
Du 3–5
Du 4–5
E 2–6(5)
Du 5–6
D 5–10(5)
F 6–10(3)
J 4–14(7)
G 10–14(7)
I 12–14(1)
0 2 30
Task
Time (days)
4 6 8 10 12 14 16 18 20 22 24 26 28
H 3–12(8)
1 A
C
B
E
D
F
H
J
G
I
2
2
2
2 6
5
6
4
5
3
5
3
4
5 10
106
3 12
14
14
1412
10
4
Key3
2
2
1
4
3
2
1
1
2
Critical task
Non-critical task
Float (example only)
Manpower required1
Figure 6.12 Bar chart

The histogram of critical task loading is shown superimposed on the main chart. Histo-grams of this kind in conjunction with float can be used to smooth the workload. In ourexample, the capacity of the workshop is indicated as five men – by floating the tasks itmay be possible to bring the peak loading below this capacity level without affecting theoverhaul duration.
6.4 Comments
This section has described the principles and procedure of network analysis. There arenow numerous network analysis software packages available for assisting maintenancemanagers with the planning, scheduling and control of major shutdowns (e.g. microsoftproject, Primavera, etc.). All that would be required is the information provided in Table 6.2to be fed into a computer to enable the computer to provide completed networks/barcharts and also to carry out sophisticated analysis of the following kind:
● Multi-resource smoothing of type illustrated in Figure 6.13.● Cost-effective reduction of project times (see Exercise E6.2).
A major advantage of computerized network analysis is the ability to control theprogress and cost against budget via the feedback of task completion and actual taskcosts. The schedule/bar charts can be updated quickly (on a daily basis) and problemareas identified and corrected.
Management of plant turnarounds – Part 1 103
0 2 4 6 8 10 12 14 16 18 20 24 26 28 30
0
1
2
3
4
5
6
7
8
9
10
Time (days)
Workshop capacity
(five men)
All tasks
Critical tasks
Nu
mb
er
of
pers
on
s r
eq
uir
ed
22
Figure 6.13 Histogram of manpower requirement

Exercise
E6.1 A maintenance overhaul consisting of 12 tasks shown in the table has to
be completed in not more than 30 days. The restrictions on each task andprovisional estimates of task duration are also shown in the table.
Establish the following:
(a) The project time.(b) The total float and free float of task G.(c) The critical path.
Note: You will need to:
● complete the logic diagram,● establish the earliest times and latest times,● establish the critical path.
E6.2 The cost for each of the tasks is shown in the table below and additionalinformation is given about ways of reducing the overhaul time. You arerequired to establish the most economical way of reducing the overhaultime by selecting the best combination of the listed actions.
Maintenance Systems and Documentation104
Task Interrelations Duration (days)
A None 6B None 10C None 8D Not until C complete 10E Not until C complete 3F Not until D complete 9G Not until E complete 2H Not until A and D complete 8I Not until B and G complete 9J Not until H and I complete 3K Not until H and I complete 4L Not until K complete 2
Activity Cost (£)
A 450B 1200C 2100D 3500E 1000F 400G 700H 3000I 2000J 750K 1000L 900

Action 1: The duration of task D could be halved but this would double the cost.Action 2: The duration of task F could be shortened by a third at a 50% cost
increase.Action 3: The duration of task H could be halved, but this would double
the cost.Action 4: The duration of task I could be reduced to 8, 7, 6 or 5 days at a cost
increase of £250 for each day saved.
Note: For each day the overhaul time is reduced below 30 days £1000 is saved.
E6.3 Use the information from E5.2 to draw a modified network. Convert themodified network into a bar chart.
E6.4 The estimated manpower for each task is given in the table below.Construct a manpower loading histogram from this information and thebar chart. There are seven men in the workshop that can be used to com-plete this overhaul. Are these going to be sufficient? If not, suggest waysof improving the situation.
Management of plant turnarounds – Part 1 105
Exercise Guideline Solutions
E6.1 The completed network is shown in Figure 6.14. The answers are as follows:(a) 32 days.(b) Total float on task G � LF – ES – D
� 17 – 11 – 2 � 4 daysFree float on task G � EF – ES – D
� 13 – 11 – 2 � 0 days(c) Critical path is
C(1–2), D(2–3), Dummy(3–4), H(4–7), K(7–8), L(8–9)
Activity Men
A 4B 2C 2D 6E 3F 4G 5H 2I 4J 3K 4L 5

Maintenance Systems and Documentation106
E6.2 The most economical method of reducing the project time is:● Reduce D by 5 days in conjunction with reducing I by 1 day.● This involves a total penalty of £750.
E6.3 The modified network is shown in Figure 6.15. It will be noticed that there arenow two critical paths.● C, D, dummy, H, K, L.● C, E, G, I, K, L.
The bar chart for the modified network is shown in Figure 6.16.E6.4 The histogram for the modified network/bar chart is shown in Figure 6.17. It can
be seen that the area above the workshop capacity exceeds the area below thecapacity line. Thus contract labor will have to be used.
4
8
A(6)
F(9)
H(8)
J(3)
L(2)
K(4)
I(9)
G(2)
E(3)
B(10)
C(8) D(10)
18
30
18
30
7
2626
5
1511
6
1713
1
00
3
1818
2
88
9
3232
4
8
A(6)
F(9)
H(8)
J(3)
L(2)
K(4)
I(8)
G(2)
E(3)
B(10)
C(8) D(5)
13
25
13
25
7
2121
5
1111
6
1313
1
00
3
1313
2
88
9
2727
Figure 6.14 Completed network before modification
Figure 6.15 Network after modification

Management of plant turnarounds – Part 1 107
C 1–2
D 2–3
A 1–4
3–4
E 2–5
B 1–6
G 5–6
H 4–7
I 6–7
F 3–9
J 7–9
L 8–9
0 2 30
Task
Time (days)
4 6 8 10 12 14 16 18 20 22 24 26 28
K 7–8
1 C(8)
D(5)
A(6)
B(10)
E(3)
2
2
1
1
3
4
3
4
6
2 5
G(2)5 6
H(8)4 7
I(8)6 7
F(9)3 9
K(4)7 8
J(3)7 9
L28 9
Non-critical
Critical path 1
Critical path 2
0 2 4 6 8 10 12 14 16 18 20 22 24 26 28 30
0
1
2
3
4
5
6
7
8
9
10
11
Time (days)
Workshop capacity
Men
req
uir
ed
Critical tasks loading
Figure 6.16 Modified network drawn as a bar chart
Figure 6.17 Manpower histogram for modified network

This page intentionally left blank
Management of plant turnarounds – Part 2:Turnaround methodology7
‘The six stages of a major turnaround:
Enthusiasm.
Disenchantment.
Panic.
Search for the guilty.
Punishment of the innocent.
Decoration of those who took no part.’
Comment by a disillusioned Shutdown Manager
Chapter aims and outcomes
To describe a methodology and associated procedures that can be followed to plan,schedule and control major plant turnarounds.
On completion of this chapter you should be able to:
● describe the four main phases of a generic turnaround methodology and under-stand the associated strategic issues involved;
● understand the sub-steps within each of the four phases and the key issues arising(e.g. you should be able to delineate a typical turnaround organization and under-stand the principles of its operation).
Chapter route map
Book divisions
Introductory chapters
Budgeting and control
Work planning andwork control
Spare partsmanagement
Documentation
Case studies
This chapter in the division
Chapter 5Short-term workplanning and control
Chapter 6Management of plantturnarounds – Part 1:Network analysis
Chapter 7Management of plantturnarounds – Part 2:Turnaroundmethodology
Chapter topics
7.1 Introduction
7.2 Phase 1: Initiating the turnaround
7.3 Phase 2: Preparing the turnaround
7.4 Phase 3: Executing the turnaround
7.5 Terminating the turnaround

Maintenance Systems and Documentation110
7.1 Introduction
A general methodology for managing turnarounds is outlined in Figure 7.1 (contributedby T. Lenahan with additions by A. Kelly). The key strategic decisions and their timingrelative to the four principal phases (each of which is divided into sub-steps) are indi-cated along the top of the figure.
Many variations of this methodology have been observed. For example, Figure 7.2, is aturnaround schedule for a small agro-chemical plant. In this case the planning lead time(i.e. the total planning time required up to the start of execution of the work) is about 2 months. A turnaround for a 500MW boiler-turbo-generator might well demand a planninglead time of a year. The magnitude of the planning lead time and effort depend on the sizeand complexity of the turnaround and of the previous experience of similar or identicalexercises. Major plant overhauls are usually much the same in 1 year as in another and this,therefore, makes the initiation and preparation phases that much more straightforward; thisis the principal difference between turnarounds (where most of the work is maintenance)and major plant projects which involve the building and installation of new plant.
Exercise
E7.1 Use the turnaround methodology shown in Figure 7.1 as a template tomap the turnaround procedures for your own company. Comment on anydifferences and make suggestions for improvement.
7.2 Phase 1: Initiating the turnaround
7.2.1 Forming a policy team and appointing a turnaround manager
It is the responsibility of the senior management of the company to form a policy teammade up of the managers who have a stake in the turnaround and the ability to makedecisions. This team must ensure that constraints, objectives and policy for the turn-around are well defined. Arguably, the most important decision made by the team willbe the appointment of a turnaround manager to act as their agent because, onceappointed, this individual will control all phases of the task, while the team will assumethe tripartite role of facilitation, monitoring and endorsement.
Key words
● Turnaround methodology● Turnaround organization● Contractor work packages● Shutdown duration● Work scope● Key data bar chart
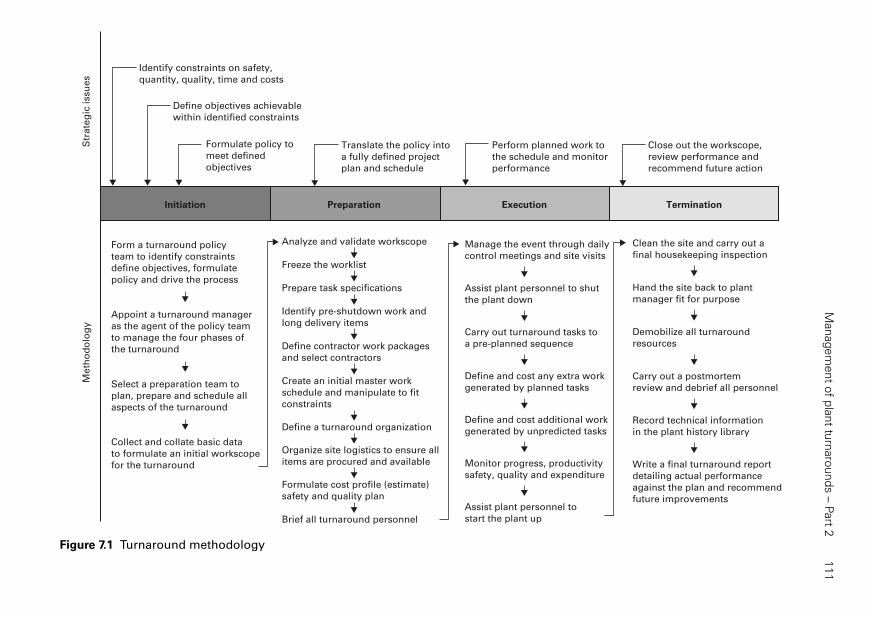
Managem
ent o
f pla
nt tu
rnaro
unds –
Part 2
111
Identify constraints on safety,
quantity, quality, time and costs
Define objectives achievable
within identified constraints
Formulate policy to
meet defined
objectives
Translate the policy into
a fully defined project
plan and schedule
Perform planned work to
the schedule and monitor
performance
Close out the workscope,
review performance and
recommend future action
Initiation Preparation Execution Termination
Form a turnaround policy
team to identify constraints
define objectives, formulate
policy and drive the process
Appoint a turnaround manager
as the agent of the policy team
to manage the four phases of
the turnaround
Select a preparation team to
plan, prepare and schedule all
aspects of the turnaround
Collect and collate basic data
to formulate an initial workscope
for the turnaround
Analyze and validate workscope
Freeze the worklist
Prepare task specifications
Identify pre-shutdown work and
long delivery items
Define contractor work packages
and select contractors
Create an initial master work
schedule and manipulate to fit
constraints
Organize site logistics to ensure all
items are procured and available
Formulate cost profile (estimate)
safety and quality plan
Brief all turnaround personnel
Manage the event through daily
control meetings and site visits
Assist plant personnel to shut
the plant down
Carry out turnaround tasks to
a pre-planned sequence
Define and cost any extra work
generated by planned tasks
Define and cost additional work
generated by unpredicted tasks
Monitor progress, productivity
safety, quality and expenditure
Assist plant personnel to
start the plant up
Clean the site and carry out a
final housekeeping inspection
Hand the site back to plant
manager fit for purpose
Demobilize all turnaround
resources
Carry out a postmortem
review and debrief all personnel
Record technical information
in the plant history library
Write a final turnaround report
detailing actual performance
against the plan and recommend
future improvements
Str
ate
gic
issu
es
Me
tho
do
log
y
Define a turnaround organization
Figure 7.1 Turnaround methodology

Main
tenance S
yste
ms a
nd D
ocum
enta
tion
112
Working days prior to shutdown Days into shutdown
Management
agree extent and
timing for
shutdown
(a) mech. work
(b) elec. work
(c) inst. work
Preliminary
networks
complete
Network
finalizedInform unions of
shutdown details
(as necessary)
Prelim
program
available
All work
schedules
issuedAgree shifts
to be worked
Complete
arrangements for
accommodation,
canteens, etc.
Last orders placed
50 40 30 20 10 0 10
Prepare work schedules and shutdown/startup sequences
Prelim schedules available for:
(d) minor project work
(e) shutdown/startup sequences
Prepare detailed job lists and estimate job times and resource loadings
Draw networks Monitor and review progress
Computer network analysis and resource allocation
Negotiate with maintenance contractor(s) for necessary manpower
Prepare and issue clearance certificates, etc.
Carry out preparatory work
Assemble special tools, protective clothing, etc.
Final
program
issued and
agreed by
management
Computer updates
Management decide
whether or not to
update program
Figure 7.2 Overhaul program, agro-chemical plant
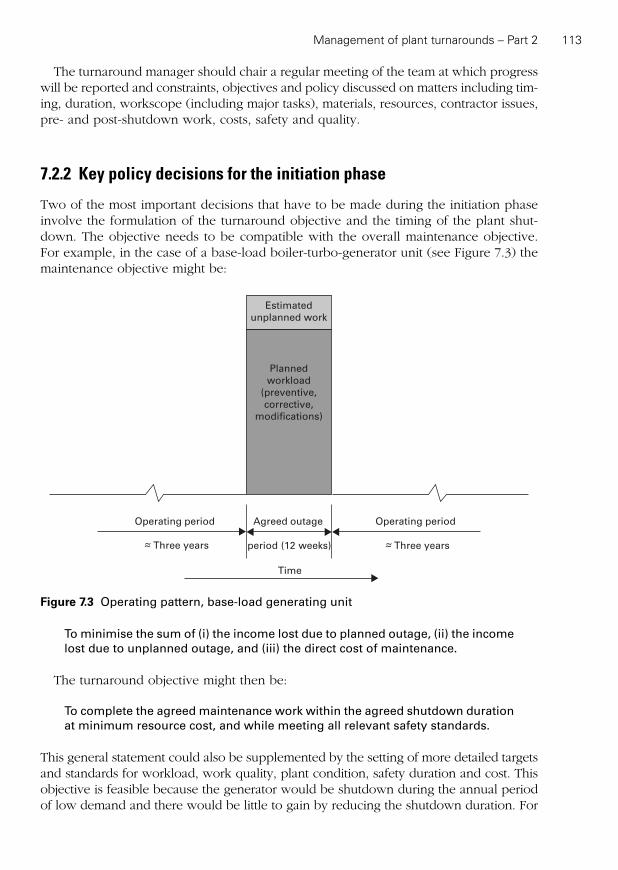
Management of plant turnarounds – Part 2 113
The turnaround manager should chair a regular meeting of the team at which progresswill be reported and constraints, objectives and policy discussed on matters including tim-ing, duration, workscope (including major tasks), materials, resources, contractor issues,pre- and post-shutdown work, costs, safety and quality.
7.2.2 Key policy decisions for the initiation phase
Two of the most important decisions that have to be made during the initiation phaseinvolve the formulation of the turnaround objective and the timing of the plant shut-down. The objective needs to be compatible with the overall maintenance objective.For example, in the case of a base-load boiler-turbo-generator unit (see Figure 7.3) themaintenance objective might be:
Estimated
unplanned work
Planned
workload
(preventive,
corrective,
modifications)
Operating period Agreed outage
period (12 weeks)
Operating period
~ Three years~ ~ Three years~
Time
Figure 7.3 Operating pattern, base-load generating unit
To minimise the sum of (i) the income lost due to planned outage, (ii) the incomelost due to unplanned outage, and (iii) the direct cost of maintenance.
The turnaround objective might then be:
To complete the agreed maintenance work within the agreed shutdown durationat minimum resource cost, and while meeting all relevant safety standards.
This general statement could also be supplemented by the setting of more detailed targetsand standards for workload, work quality, plant condition, safety duration and cost. Thisobjective is feasible because the generator would be shutdown during the annual periodof low demand and there would be little to gain by reducing the shutdown duration. For

production-limited chemical plant on the other hand the objective might be very different,putting the emphasis on the reduction of turnaround duration – at the expense of highmaintenance cost. Clearly, the turnaround objective must be established at an early stage.
The timing of major plant shutdowns (e.g. whether they should occur at some fixedinterval or should be usage or condition based) and their preventive work content aredetermined to a large extent by the maintenance strategy. Base-load boiler-turbo-generator plant, e.g. typically come off every 3 years or so as part of a station schedulewith a 20-year planning horizon. The exact timing of the shutdown will be a functionof the annual fluctuation in electricity demand, and other factors such as the need forgrid maintenance. Although the frequency of the shutdown is time based (inevitably soin this extensive planning context) the preventive work content is determined in partvia inspections, inspection history and previous shutdown history.
7.2.3 Selecting a preparation team
The turnaround manager is responsible for selecting a preparation team comprising:
● A preparation engineer: managing the team on a day-to-day basis, validating theworkscope and delegating other work to the planners.
● A planning officer: supervising the planning team, assisting the preparation engineerto validate the workscope and creating the initial turnaround plan.
● A planning group: gathering basic data on the plant (e.g. drawings, specifications,plant standards), specifying tasks and providing all supporting documentation suchas specifications of welding and pressure test procedures.
● A site logistics officer: organizing storage, supply and distribution of materials, equip-ment, carnage, transportation, services, utilities, accommodation and facilities.
● A site logistics team: of storemen, drivers and other semi-skilled personnel who workunder the supervision of the logistics officer.
7.2.4 Collecting the job lists and other data
In order to prepare the turnaround work schedule the preparation team will need to gathera substantial amount of data from a number of sources – the workscope. To this end, themanager should set up a series of meetings, see Figure 7.4 which will run through thepreparation phase until all relevant tasks and associated data has been obtained.
7.3 Phase 2: Preparing the turnaround
7.3.1 Analyzing and validating the workscope
The worklists supplied by the plant team will be raw data containing elements ofunnecessary and duplicated work (which must be eliminated), incorrectly specifiedwork (which must be corrected) and errors in material specification etc. During a series
Maintenance Systems and Documentation114
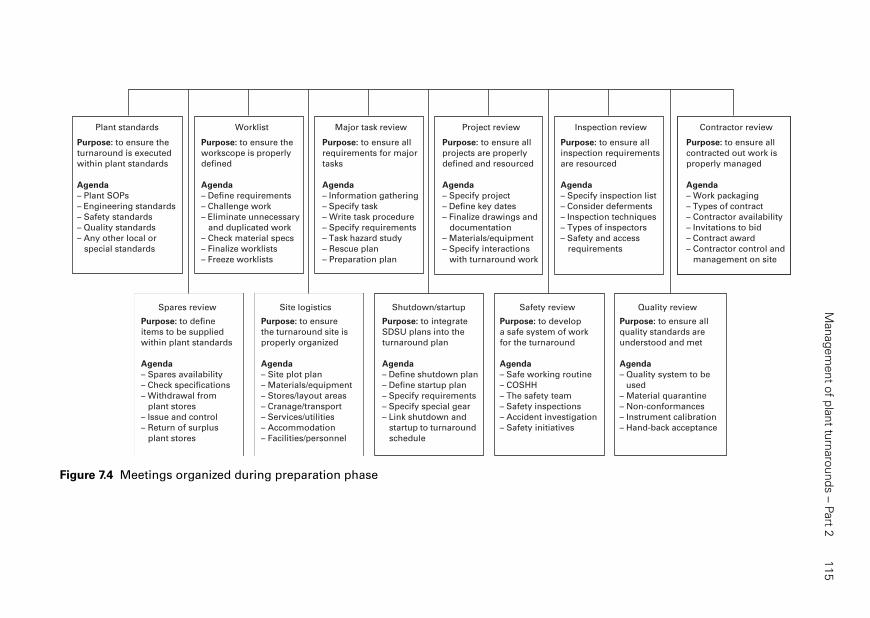
Managem
ent o
f pla
nt tu
rnaro
unds –
Part 2
115
Plant standards
Purpose: to ensure the
turnaround is executed
within plant standards
Agenda
– Plant SOPs
– Engineering standards
– Safety standards
– Quality standards
– Any other local or
special standards
Contractor review
Purpose: to ensure all
contracted out work is
properly managed
Agenda
– Work packaging
– Types of contract
– Contractor availability
– Invitations to bid
– Contract award
– Contractor control and
management on site
Inspection review
Purpose: to ensure all
inspection requirements
are resourced
Agenda
– Specify inspection list
– Consider deferments
– Inspection techniques
– Types of inspectors
– Safety and access
requirements
Project review
Purpose: to ensure all
projects are properly
defined and resourced
Agenda
– Specify project
– Define key dates
– Finalize drawings and
documentation
– Materials/equipment
– Specify interactions
with turnaround work
Major task review
Purpose: to ensure all
requirements for major
tasks
Agenda
– Information gathering
– Specify task
– Write task procedure
– Specify requirements
– Task hazard study
– Rescue plan
– Preparation plan
Worklist
Purpose: to ensure the
workscope is properly
defined
Agenda
– Define requirements
– Challenge work
– Eliminate unnecessary
and duplicated work
– Check material specs
– Finalize worklists
– Freeze worklists
Spares review
Purpose: to define
items to be supplied
within plant standards
Agenda
– Spares availability
– Check specifications
– Withdrawal from
plant stores
– Issue and control
– Return of surplus
plant stores
Site logistics
Purpose: to ensure
the turnaround site is
properly organized
Agenda
– Site plot plan
– Materials/equipment
– Stores/layout areas
– Cranage/transport
– Services/utilities
– Accommodation
– Facilities/personnel
Shutdown/startup
Purpose: to integrate
SDSU plans into the
turnaround plan
Agenda
– Define shutdown plan
– Define startup plan
– Specify requirements
– Specify special gear
– Link shutdown and
startup to turnaround
schedule
Safety review
Purpose: to develop
a safe system of work
for the turnaround
Agenda
– Safe working routine
– COSHH
– The safety team
– Safety inspections
– Accident investigation
– Safety initiatives
Quality review
Purpose: to ensure all
quality standards are
understood and met
Agenda
– Quality system to be
used
– Material quarantine
– Non-conformances
– Instrument calibration
– Hand-back acceptance
Figure 7.4 Meetings organized during preparation phase

of meetings (see Figure 7.4) the preparation team should set out to validate theworkscope and define all requirements by analyzing every major, minor and bulkworkrequest on the worklist to ensure that it needs to be done, it is correctly specified, andthat all requirements are specified.
7.3.2 Freezing the worklist
The validated workscope will be the foundation upon which every other aspect of theturnaround rests. Therefore, at a pre-determined date (normally between 2 and 6months before the event) the worklist should be frozen and no further work accepted.The frozen worklist can then be transformed into the workscope that will be used toaccurately calculate key indicators such as cost, duration and resourcing of the event.In reality, work will usually requested up to and even beyond the start date of the turn-around. If the worklist is not frozen it would be impossible to accurately calculate thesekey indicators. Any work requested after the freeze date should be handled by a ‘latework’ routine which should be costed and resourced separately.
7.3.3 Preparing task specifications
The raw worklist will consist basically of three categories of work, each of which willneed to be treated differently as regards planning and specification, viz.:
● Major tasks (e.g. overhauling a switchboard): Large packages of work that are char-acterized by long-duration, high-technical content, unfamiliarity or high risk. Thepreparation engineer should be responsible for planning and specifying both thetechnical and safety content of these and for producing a critical path network (seeFigure 7.5).
● Minor tasks (e.g. washing and inspecting a small heat exchanger): Small packages ofwork of medium duration which still require individual planning and specification.These tasks are planned and specified by a planner, on a task sheet (see Figure 7.6).
● Bulkwork (e.g. replacement of many similar valves): Numerous small jobs with iden-tical or similar requirements that can be packaged by type and listed on a bulkworkroute card (see Figure 7.7).
7.3.4 Identifying pre-shutdown work
During the analysis of the worklist some jobs, spares or materials will be identified which,because of their special nature, need to be dealt with as early as possible, namely:
● Long delivery spares and materials, which must be ordered at the earliest possibledate if they are to be available when required (e.g. delivery of a replacement main-compressor rotor can take up to 18 months).
Maintenance Systems and Documentation116

Managem
ent o
f pla
nt tu
rnaro
unds –
Part 2
117
Board busbars
B.F.P.A.C.B.
I.E. to all
circuit spouts
Station board no. 2
to clean switchboard
busbars, circuit
spouts, V.T’s cable
boxesClean off
top of board
E1103102 1E 1N 4
All 110 v sockets on switchboard
L/T switchroom
1E 2
1E 3
Remove covers
from V.T. connections
at switchboard top
front
E1103103 1E 1N 7
Clean and inspect
V.T. connections
E1103104 1E 1N 32Remove covers from circuit
connections and C.T’s front
and rear of each cubicle
except IB S/S B.F.P.A.C.B.
Issue P.T.W. on unit board no. 3 feeder 3 A.C.B.
Issue P.T.W. on unit board no. 4 feeder and A.C.B.
Issue P.T.W. on bus section isolator A.C.B.
Issue P.T.W. on inductor feeder A.C.B.
O/H unit board no. 3 feeder
A.C.B. at station board 2
O/H 11 kV station board 1/2 bus section isolator
O/H inductor feeder A.C.B. at station board no. 2
Protection tests on A.C.B.
Protection tests on A.C.B.
Cancel P.T.W.
Protection tests on A � C.B.
Refit covers
to 28 S/S
B.F.P.A.C.B. cubicle
Cancel P.T.W. remove
busbar earth from
10 S/S cubicle and
re-earth busbars via
28 S/S B.F.P.A.C.B.
cubicle
Clean all busbars and busbar
spouts except 10 S/S B.F.P.A.C.B
Cancel P.T.W.
issue S.F.T. for
I.R. and ductor testI.R. test and ductor
test busbars
Cancel S.F.T.
issue P.T.W.
to refit covers Refit covers
Cancel P.T.W.
issue S.F.T. for
final I.R. test
Carry out
final I.R. test
Clean and inspect busbars and busbar spouts
at 18 S/S B.F.P.A.C.B. cubicle
Clean and inspect
C.T’s and circuit
connections at 18 S/S
B.F.P.A.C.B. cubicle
Clean and inspect
circuit spouts at 18 S/S
B.F.P.A.C.B. cubicle
Remove covers
to C.T’s on 10 S/S
B.F.P.A.C.B. cubicle
O/H unit board no. 4 feeder
A.C.B. at station board 2
I.P. test
on feeder
Cancel P.T.W. issue
S.F.T. on outgoing
circuits for I.R. test
Ops statement E1103119
Please change over supplies and take board O.O.S. for
____Hours__/__/__ to enable elect. routine maint.
to be carried out on board busbars. Earth board via
___A.C.B. and attach M.C.S.H.E.S. to all other circuit
spouts 115 sets of H.C.S.H.E.S. prior to isolating board
ensure that all -B.F�P‘s supplied by 11 kV station board
No___ is proven and available to run when required.
Resources
Electrician
Mate
Man shifts
25.25
24.75
Plant to be available
S/S Boiler feed pumps
1A, 2A, 3A, 4A
G.T's 1.2.3. and 4
all M.B.F.P‘s
Unavailable
E.R. Feed pumps
28, 38, 48
ScaleD.B. 18.6.79
E1103201
E1103201
E1103301
E1103201
1E 1H 9
1E 1H 9
1E 1H 9
1E 1H 9
1E 1H 6
1E 1H 6
E1103502
E1103502
E1103502
E1103118
E1103115 1E 1H 12 1E 1H 33E1103116 E1103117
E1103110 1E 1H 4
Clean and inspect
circuit spouts and
V.T. spoutsClean and inspect C.T's
and all circuit connections
incl. cable links except
1B S/S B.F.P.A.C.B.
E1103105 1E 1H 29 E1103106 1E 1H 57
Remove covers from busbars at rear
of switchboard lift busbars shutters
E1103107 1E 1H 29 E1103108 1E 1H 86
E1103109 1E 1H 32
Figure 7.5 Critical path network, 11 kV switchboard overhaul
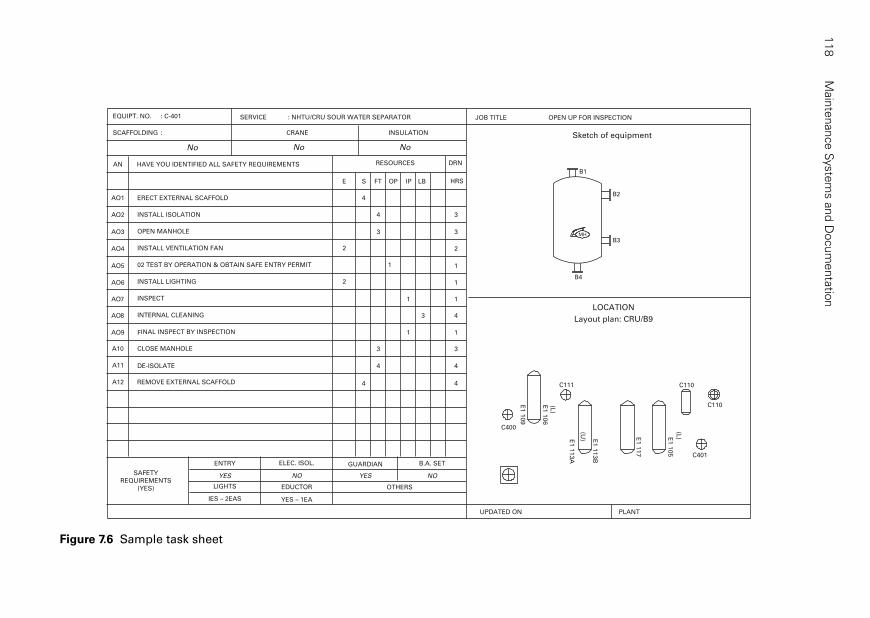
Main
tenance S
yste
ms a
nd D
ocum
enta
tion
118
MH
Sketch of equipment
B1
B2
B3
B4
C110
C400
C111
E1
10
5
E1
11
7
E1
11
3B
E1
11
3A
(U)
(L)
E1
10
9
E1
10
6
(L)
C110
C401
LOCATION
Layout plan: CRU/B9
HAVE YOU IDENTIFIED ALL SAFETY REQUIREMENTS
ERECT EXTERNAL SCAFFOLD
INSTALL ISOLATION
OPEN MANHOLE
INSTALL VENTILATION FAN
02 TEST BY OPERATION & OBTAIN SAFE ENTRY PERMIT
INSTALL LIGHTING
INSPECT
INTERNAL CLEANING
FINAL INSPECT BY INSPECTION
CLOSE MANHOLE
DE-ISOLATE
REMOVE EXTERNAL SCAFFOLD
EQUIPT. NO. : C-401
SCAFFOLDING :
No
SERVICE : NHTU/CRU SOUR WATER SEPARATOR
CRANE INSULATION
No No
AN RESOURCES DRN
HRSSE FT OP IP LB
AO1
AO2
AO3
AO4
AO5
AO6
AO7
AO8
AO9
A10
A11
A12
2
2
4
4
4
3
3
4
1
1
1
3
3
3
2
1
1
1
4
1
3
4
4
SAFETY
REQUIREMENTS
(YES)
ENTRY
YES
LIGHTS
IES – 2EAS
ELEC. ISOL.
NO
EDUCTOR
YES – 1EA
GUARDIAN
YES
B.A. SET
NO
OTHERS
UPDATED ON PLANT
JOB TITLE OPEN UP FOR INSPECTION
Figure 7.6 Sample task sheet

Managem
ent o
f pla
nt tu
rnaro
unds –
Part 2
119
YEAR PLANT UNIT/AREA ITEMS
BULKWORK ROUTE CARD No
REMOVED DECONTAMITEMNUMBER
ASSOCIATEDPLANT NUMBER
INST/ELECDISCONNECTION
(IF REQUIRED)
SENT TO W/SHOPFOR OVERHAUL
RETURNED FROMWORKSHOP
OVERHAULEDITEM FITTED
SPARE ITEMFITTED
INST/ELECRECONNECTED(IF REQUIRED)
TESTED ANDCOMMISSIONED
Figure 7.7 Bulkwork route card

Maintenance Systems and Documentation120
● Spares which have to be prefabricated and tested before they can be installed in theplant.
● Specialist sub-contractors and equipment – the more specialized, the longer theirwaiting list, so their availability should be checked and orders placed on them early.
● General services and utilities – such as temporary electrical and telephone cables, waterand gas pipelines, etc. – must be laid well in advance of the turnaround start date.
7.3.5 Defining contractor work packages and selecting contractors
The decision must be taken as to what work will be contracted out, how it will be pack-aged and what mix of contractors will be used.
7.3.6 Creating the work schedule
Once tasks have been specified (and, where necessary, networked) to the appropriatestandard – and all necessary materials, equipment, resources and services identified –they must be assembled into a master schedule which will meet the current constraintson workload, money, time and resources. Figure 7.8 shows the elements of the masterschedule and the steps that need to be taken to prepare and finalize it. The logic registerreferred to is simply the working patterns which are initially set up in the schedule, e.g.:
● bulkwork to be executed on an 8-hour shift, 5 days per week, only;● minor tasks and some major tasks on 12-hour shifts, 7 days per week;● nominated major tasks (including the critical path task) to be accomplished on a con-
tinuous 24 hour cycle).
The start date and time of any given task will be dependent on when the job is releasedby the plant shutdown program and the resources available at that time. All tasks thatdo not lie on the critical path will have a certain amount of float time and this will betranslated into earliest and latest start and finish times for each significant element of thetask. This allows a measure of flexibility in the plan.
If a turnaround is large and complex it is customary to produce networks at two lev-els. For example, Figure 7.9 is a ‘key date network’ for a boiler-turbo-generator over-haul. At the level of this network an arrow represents a major section of the overhaul.Such major sections of work can be themselves represented by a detailed computer-generated network (see Figure 7.5); at this level the arrow represent a single task. Themaster network can be regarded as a route map of the complete turnaround, showinghow all the tasks are logically related. As already indicated, the networks are best con-verted to bar charts for the execution phase.
7.3.7 Techniques for creating a schedule
These have been covered in Chapter 6 and are as follows:
● For small overhauls it may be possible to use bar charted shuffle boards on whichtasks can be moved back and forth along time lines.
● Using computerized network planning software such as microsoft project or Primavera.
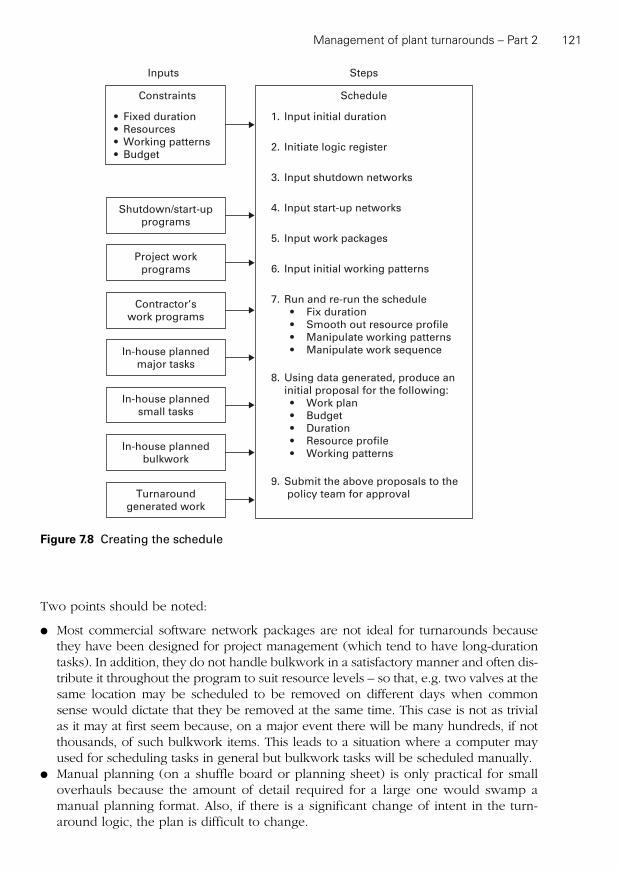
Management of plant turnarounds – Part 2 121
Two points should be noted:
● Most commercial software network packages are not ideal for turnarounds becausethey have been designed for project management (which tend to have long-durationtasks). In addition, they do not handle bulkwork in a satisfactory manner and often dis-tribute it throughout the program to suit resource levels – so that, e.g. two valves at thesame location may be scheduled to be removed on different days when commonsense would dictate that they be removed at the same time. This case is not as trivialas it may at first seem because, on a major event there will be many hundreds, if notthousands, of such bulkwork items. This leads to a situation where a computer mayused for scheduling tasks in general but bulkwork tasks will be scheduled manually.
● Manual planning (on a shuffle board or planning sheet) is only practical for smalloverhauls because the amount of detail required for a large one would swamp amanual planning format. Also, if there is a significant change of intent in the turn-around logic, the plan is difficult to change.
Inputs
Schedule
Steps
1. Input initial duration
2. Initiate logic register
3. Input shutdown networks
4. Input start-up networks
5. Input work packages
6. Input initial working patterns
7. Run and re-run the schedule
• Fix duration
• Smooth out resource profile
• Manipulate working patterns
• Manipulate work sequence
8. Using data generated, produce an
initial proposal for the following:
• Work plan
• Budget
• Duration
• Resource profile
• Working patterns
9. Submit the above proposals to the
policy team for approval
Shutdown/start-up
programs
Project work
programs
Contractor’s
work programs
In-house planned
major tasks
In-house planned
small tasks
In-house planned
bulkwork
Turnaround
generated work
Constraints
• Fixed duration
• Resources
• Working patterns
• Budget
Figure 7.8 Creating the schedule

Main
tenance S
yste
ms a
nd D
ocum
enta
tion
122
1985 March April May June July August Sept
Week
commencing11/3 18/3 25/3 1/4 8/4 15/4 22/4 29/4 6/5 13/5 20/5 27/5 3/6 10/6 17/6 24/6 1/7 8/7 15/7 22/7 29/7 5/8 12/8 19/8 26/8 2/9
Commission
fans
Hy
dra
uli
c 5
/8/8
5
Re
mo
ve
in
tern
al
sca
ffo
ld
Bo
ile
r a
cid
cle
an
Float safety
valves
Synchronize
18-19/8O/H fans – Clean gas passes and air ducts
Bottom dead space
Bo
ile
r o
fflo
ad
30
/5/8
5
Commission
controls
to nox
Leak
test oil
burners
Nox burner external ducting
Dampers, electrics and controls
Nox burners fixing
Boiler furnace repairs
Internal
scaffoldNox burners internal
Access to boilers
hang new burners in
position
Refit safety VVS
Second stage reheater
Including access from
top dead spaces
Hangers and top dead space casing and
NDT. of headers
RMV. safety VVS.
O/H stop VVS.
erect
tent RMVESecond stage
R/HTR. top
pass access
Scaffold top passes
and floor out at third
stage S/HTR
7 10 8
7 3 7
Asbestos top
dead space29
Figure 7.9 Key date bar chart

7.3.8 Optimizing the schedule
An optimum schedule balances out the constraints of workload, duration, cost andresources. The first run of the schedule will be based on raw data. For instance, it maybe that the duration required by business needs is not realistic for the required work-load and the available resources and if the resources were to be increased the costwould overrun the budget. A first-run schedule often exhibits an erratic manpower pro-file, i.e. a requirement for significantly different levels of resource on consecutive days(e.g. mechanical fitters required might number 189 on day 1, 66 on day 2, 12 on day 3,82 on day 4, 29 on day 5 and so on). This would have to be evened out by reorganiz-ing the work schedule.
The turnaround manager is responsible for optimizing the schedule and then pre-senting it to the policy team for discussion. It may well be that this process would haveto be reiterated several times before the policy team’s final approval is obtained and barcharts produced showing the sequence of tasks on a daily and weekly basis. Thesecharts will need to be updated daily during the execution phase.
Review Question
R7.1 Outline the key differences between ongoing planning (for the first- andsecond-line workload) and the planning and scheduling of the major work(third line) – see, e.g. the complete work planning model of Figure 5.11.
7.3.9 Forming the turnaround organization
The form of the organization will be dictated by current constraints and policy teamdecisions. For example, Figure 7.10 outlines an organization, managed by a consultantturnaround manager, which dealt with three areas: one which involved a large projecthandled by the company’s project department, another which was handled by a con-tractor and yet another which was handled by company personnel (both of the latterbeing covered by a single co-ordinator). The control electrical work was treated as aseparate ‘area’. The plant team handled the shutdown and startup phases and the com-pany supplied a team to control work quality (and who signed off tasks when theywere satisfactorily completed).
A typical organization would comprise the following:
● plant personnel with local knowledge;● turnaround personnel with planning;● co-ordination and management skills;● technical personnel with engineering, design and project management skills;● contractors with the skills and knowledge to carry out the work.
Throughout the organization, control would be maintained by the practice of singlepoint responsibility, which requires that, at any given stage of every task there will beone person who has been nominated as responsible for accepting the task from the
Management of plant turnarounds – Part 2 123

Maintenance Systems and Documentation124
previous stage, ensuring that the current stage of the task will be completed to therequired standard and handing the task on to the next stage.
An organization that has been employed for carrying out turnarounds of certain powerplants is shown in Figure 7.11. Plant-specialized core teams were set up for each majorplant area (e.g. for the boilers). Supplementation of these, as necessary, from a central-ized trade pool created an organization which was essentially an area (trade matrix).
Exercise
E7.2 Map the turnaround organization used in your own company. How does itcompare to the organization shown in Figures 7.10 and 7.11. Make sugges-tions for improvement.
Review Question
R7.2 The matrix structure shown in Figure 7.11 is a typical structure used in carrying out major turnarounds.
List the main advantages of this structure for carrying out major turn-arounds.
Technical
manager
Area 1 Team
Vessel inspectors
Radiographers
I.M.I. Inspectors
Metallographers
Inspection team
Site mods team
Designer
Draughtsmen
Process team
(SDSU)
Permit to
work team
Quality team
(Acceptance)
Start up
team
Turnaround
policy team
Engineer
Co-ordinator
Trade
supervisors
Artisans
and
semi-skilled
Plant
manager
Planning
team
Logistics
team
Safety
team
Turnaround
manager
Contractor
manager
Engineer
Trade
supervisors
Area 2 Team
Artisans
and
semi-skilled
Engineer
Trade
supervisors
Area 3 Team
Projects
manager
Artisans
and
semi-skilled
Figure 7.10 An example of a turnaround organization

Management of plant turnarounds – Part 2 125
7.3.10 Defining the site logistics
Turnaround logistics are concerned with the procurement, location and movement ofall items and services required. The site logistics are concerned with identifying theturnaround resources and services and their current location and organizing their move-ment around the site. A team under the leadership of a logistics officer (e.g. see Figure7.10) should be responsible for providing all turnaround requirements.
One method of displaying much of the information required for logistic decision-making is to draw up a plan of the site that shows the plant and its available surround-ing land, and to overlay this with the locations of such things as stores, lay-down areas,water-washing bays, turnaround offices, accommodation, etc. Vital safety informationcan be recorded in the form of locations of non-load-bearing surfaces, prohibited orhazardous areas, fire assembly points, toxic refuges, emergency showers and eye baths.Such a plan ensures that everyone involved has a general understanding of the logisticarrangements.
7.3.11 Formulating a cost estimate
As soon as the main features of the workscope are known, an estimate of the cost – towithin plus or minus 20% – could be generated by calculating the approximate numberof man-hours required to carry out each major job, each minor job and all of the bulk-work, and then multiplying this figure by an average hourly rate. If this manpower costwere then taken to represent approximately 30–35% of the total cost, then trebling itwould give the total cost of the turnaround, to within the tolerance stated. (Obviously,
Policy
team
Trade supervisors
Trade teams
(including contract)
to supplement
core trade-force
as necessary
Turbine
engineer
Ancillary
plant
Other
areas
similar
Resource
superintendent
Decommissioning
and
recommissioning
teams
Core
trade-force
Core
trade-force
Core
trade-force
Supervisor(s) Supervisor(s)
Boiler
engineer
Station
manager
Boiler
planner Supervisor(s)
Turnaround
manager
Outage planning and
co-ordination team
Figure 7.11 A typical power plant turnaround organization

if any accurate cost information were to be available at this time it should be used inthe calculations.) This figure (the ball-park estimate) should be calculated early on inorder to give the policy team some confidence that the estimated costs are of the cor-rect order, or to give them the opportunity to make changes if they are wildly differentfrom the budgeted sum which has been set aside for the turnaround in the strategicbudget. As harder information becomes available the estimate can be recalculated, itsaccuracy increasing until a stage is reached when all significant costs are either knownor can be assessed very accurately (resulting in the refined estimate). This stage can bereached after the turnaround plan has been approved.
7.3.12 Formulating a safety plan
During a turnaround the normal routine of a plant is breached, many more people thanusual will be concentrated in its limited area, many will be strangers to the plant and itshazards, and most will be working under pressures of time – all of which has the poten-tial to make the plant a much more hazardous place than usual. A ‘safe system of work’must, therefore, be implemented – to safeguard personnel, property and the environ-ment – and should consist of five major elements, viz.:
The safety team: Led by a safety officer, the team is responsible for a number of safetyfunctions including, but not limited to:
● developing a safety strategy for the turnaround;● briefing all personnel on safety before the event commences;● providing help, advice and assistance on safety to all personnel during the event;● providing and controlling guardians for tasks requiring entry permits;● co-ordinating emergency marshals and controllers.
Safe working routine: This should contain safety guidelines for ensuring that theworkplace and surrounding environment are safe, materials used are not hazardous andthat people are competent and well-briefed on the requirements and hazards of thetasks they are required to perform. The routine should be driven on a day-to-day basisby the supervisors.
Task hazard assessment: A process for analyzing and dealing with the hazardsinvolved in performing a specific task, this has four stages:
(i) defining the main steps of the task,(ii) for each step, identifying any hazards involved,(iii) specifying what type of loss is attached to each hazard,(iv) specifying action to either eliminate or guard against the hazard.
The assessment should be carried out on all major tasks and on a selection of minor andbulkwork tasks. Also, if any member of the team should have reservations about any
task it is essential that it be subjected to a hazard assessment.Safety inspections: The working site must be continuously monitored in order to ensure
that the safe system of work is adequate and that personnel comply with it. Two formalinspection routines are vital elements in the monitoring program. The first is general safety
Maintenance Systems and Documentation126

inspection carried out on a daily basis by a team of managers who should be invited bythe safety officer to take part; they should look for unsafe acts, unsafe conditions andinstances of untidiness and bad housekeeping around the site in general. The second isrecurrent spot checks carried out on randomly selected tasks by a team who should beinvited by the safety officer to answer the following three questions:
1. Are the safety measures specified for the tasks adequate?2. Are they understood by those performing the task?3. Are they being complied with?
Information gathered via both routines should be fed back, for possible action, to thedaily turnaround control meeting.
Accident investigation: If, in spite of the safety measures taken, an accident shouldoccur it should be the responsibility of the turnaround manager to convene an investi-gation to ascertain the:
● type and extent of loss inflicted on people, property or the environment;● nature of the specific incident that caused the loss;● immediate reasons for the incident;● root causes underlying the accident.
7.3.13 Formulation of the quality plan
Every task should be properly specified, and executed to specification. Critical tasksshould be checked, on completion, by qualified and plant-based quality teams to ensurethat the work has complied with plant quality standards. All tasks should be signed offby a plant-based person. The quality plan should define the critical tasks and identify theplant-based personnel who have the authority to sign off tasks.
7.3.14 Briefing of all turnaround personnel
The purposes of briefing are to:
● provide accurate general information;● alert everyone to the rules governing the turnaround;● create a common understanding among – and to gain commitment from – all those
involved.
Typically, it will provide information about:
● timing, duration and work patterns;● local manpower and contractors;● workscope and schedule;● the turnaround organization;● accommodation and facilities;● the safety system of work and the quality plan.
Management of plant turnarounds – Part 2 127

Maintenance Systems and Documentation128
7.4 Phase 3: Executing the turnaround
Once preparation is complete and all personnel have been briefed, the turnaroundmanager should take charge of the event. Figure 7.12 outlines his daily routine.
• Chair the turnaround control meeting – Safety officer reports on safety issues and any incidents
– Area engineers report on area work progress and problems
– Project managers report on progress of projects
– Plant manager reports on any plant issues
– Maintenance manager reports on any engineering issue
– Quality team leader reports on quality issues
– Quantity surveyor reports on expenditure and cost issues
– Chairman sums up/issues instructions/delegates tasks
• Meet with the plant and engineering manager – Resolve technical problems
– Discuss and approve/reject request for extra/additional work
– Formulate strategies to keep the turnaround on program
– Resolve industrial relations problems
– Resolve interface conflicts
– Define consequences of any change of intent
• Check previous 24 hours progress with the planning officer
• Check cost control and forecast with the quantity surveyor
• Visit the safety cabin and check on safety issues
• Visit the stores and check on delivery and issue problems
• Visit the workshops and check on daily progress
• Tour the site to check on safety and housekeeping – talk to people
• Take part in any scheduled safety inspection or spot check
• Visit permit to work issues to discuss any issues
• Visit the quality team and discuss quality issues
• Vet overtime requests and approve/modify reject
• Write a daily turnaround report and issue it
Figure 7.12 Turnaround manager’s daily routine
7.4.1 The shutdown of the plant
The shutdown of the plant should normally be controlled by the plant manager and histeam. The turnaround manager should supply the resources to perform the civil,mechanical, electrical and instrumentation work of the shutdown. From ‘product off’the plant would be taken through run down of stock, cleaning, cooling, sweetening ofthe atmosphere inside vessels and equipment, and isolation of all equipment – to thepoint when the safety team would carry out atmospheric tests in vessels and equipmentto ensure the absence of noxious, toxic or volatile substances. The plant could said tobe ‘dead’, i.e. safe to work on.

Management of plant turnarounds – Part 2 129
7.4.2 Carrying out the turnaround tasks
The first few days of this phase should be devoted to opening up large items of equip-ment (vessels, columns, rotating machinery, etc.) and stripping out small items (valves,small pumps, motors, etc.). After stripdown the main activities would be plant inspec-tion, repair, refurbishment and equipment cleaning. At this point large specialized tasks,such as catalyst renewal, column re-traying and compressor overhaul would be started.
7.4.3 Defining and costing the extra work
Inspection of equipment will often reveal faults which were not predicted and whichrequire the carrying out of work which is extra to that which has been planned.
Inspections undertaken during previous shutdowns, inspections undertaken online,and effective planning should minimize the occurrence of this ‘extra work’.
Such work should be specified, costed and submitted for approval to the plant andturnaround managers on a daily basis. If the work required is going to have a negativeimpact on any of the turnaround objectives it should be submitted to the policy teamfor action. Should the work be approved it should be entered on an extra worklist andadded to the work schedule. Occasionally, a fault could be revealed which could havesuch a serious impact on turnaround objectives that it could require decisions to bemade by management at the very highest level.
7.4.4 Defining and costing additional work
During the event, work may be exposed which was not on the worklist because it waseither not considered necessary or was overlooked by the plant team. This additional
work should be treated in exactly the same way as extra work except that it should berecorded on a separate worklist. After the turnaround this should be investigated toascertain the reasons why it was not included in the original worklist.
Review Question
R7.3 A guideline for major shutdowns is that at least 80% of the completedshutdown workload should be preplanned. List some of the key actionsthat need to be taken to accomplish this guideline.
7.4.5 Monitoring progress, productivity, safety,quality and expenditure
The main monitoring vehicle should be the daily control meeting. Figures 7.13(a) and7.13(b) is a comprehensive checklist of the subject matter that should be covered. This
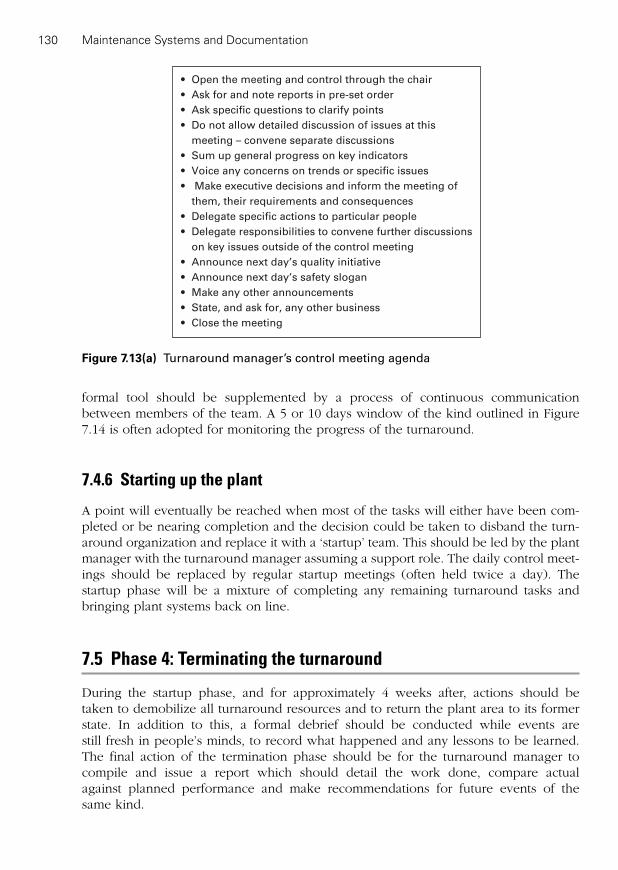
Maintenance Systems and Documentation130
• Open the meeting and control through the chair
• Ask for and note reports in pre-set order
• Ask specific questions to clarify points
• Do not allow detailed discussion of issues at this
meeting – convene separate discussions
• Sum up general progress on key indicators
• Voice any concerns on trends or specific issues
• Make executive decisions and inform the meeting of
them, their requirements and consequences
• Delegate specific actions to particular people
• Delegate responsibilities to convene further discussions
on key issues outside of the control meeting
• Announce next day’s quality initiative
• Announce next day’s safety slogan
• Make any other announcements
• State, and ask for, any other business
• Close the meeting
Figure 7.13(a) Turnaround manager’s control meeting agenda
formal tool should be supplemented by a process of continuous communicationbetween members of the team. A 5 or 10 days window of the kind outlined in Figure7.14 is often adopted for monitoring the progress of the turnaround.
7.4.6 Starting up the plant
A point will eventually be reached when most of the tasks will either have been com-pleted or be nearing completion and the decision could be taken to disband the turn-around organization and replace it with a ‘startup’ team. This should be led by the plantmanager with the turnaround manager assuming a support role. The daily control meet-ings should be replaced by regular startup meetings (often held twice a day). Thestartup phase will be a mixture of completing any remaining turnaround tasks andbringing plant systems back on line.
7.5 Phase 4: Terminating the turnaround
During the startup phase, and for approximately 4 weeks after, actions should be taken to demobilize all turnaround resources and to return the plant area to its formerstate. In addition to this, a formal debrief should be conducted while events are still fresh in people’s minds, to record what happened and any lessons to be learned.The final action of the termination phase should be for the turnaround manager to compile and issue a report which should detail the work done, compare actual against planned performance and make recommendations for future events of the same kind.

Management of plant turnarounds – Part 2 131
Area engineer’s report
• Progress on major tasks including any
technical problems and solutions
• Tasks completed, boxed up and handed
back and percentage completion of other
major tasks
• Progress on small tasks and bulkwork
• Any hold-ups or shortages on manpower,
materials, equipment or services
• Any conflicts with other areas of work
• Whether the area is on schedule or behind –
and, if behind, the strategy for getting back
on target
• Assessment of unavoidable overrun,
how many hours or days, and why it is
unavoidable
Quality team leader’s report
• Quality trends in the last 24 hours
• Any specific quality problems
• Any recurring quality problems
• Any recommendations for quality
improvement
Safety officer’s report
• Details of accidents/incidents in last 24 hours
• Details of any recurring accidents/incidents
• Findings of daily site inspection and spot
check
• Summary of site safety level and details of
any particular safety concerns
• Recommendations for safety improvements
• Details of any safety initiatives or awards
• Tomorrow’s safety slogan
Plant manager’s report
• Current ability of permit to work issuers to
issue permits on time and strategy to
eliminate any delays
• Any handover quality issues
• General view of on site performance
• General view of on site housekeeping
• Any upcoming on site problems
• Warning of any system coming back online
early
• Warning of any process activity that could
impact turnaround progress or safety
Project manager’s report
• Progress to date on project including any
technical problems and solutions
• Progress on any ‘break ins’
• Any ‘bad fit’ problems due to poor design
• Any hold-ups or shortages on manpower,
materials, equipment or services
• Any conflicts with other areas of work
• Whether the area is on schedule or behind –
and, if behind, the strategy for getting back
on target
• Assessment of unavoidable overrun, how
many hour or days, and why it is unavoidable
Maintenance manager’s report
• Any concerns on turnaround progress
• Any engineering concerns
• Any quality performance concerns
• Any upcoming engineering problems
• Any questions on turnaround engineering
work being done
• Actual expenditure to date vs. planned
expenditure
• Expenditure trends in each area
• Specific examples of cost overrun
• General forecast on final turnaround cost
• Any recommendations for tighter cost control
or cost saving initiatives
Quantity surveyor’s report
Figure 7.13(b) The daily control meeting: information and actions

Maintenance Systems and Documentation132
Friday Saturday Sunday Monday Tuesday
HP. diaph
others
follow
Scaffold
I.P. 21/
Clean I.P.
joints21/
Joint
Covers
Lift ext.
pump motor
To pump
from loading bay
RMV. various lUB. oil motors to EMD
RMV. various seal oil motors to EMD
O/H Hz board LUB. oil board and contractors
Open HP. strainers for inspection
Stop V.V.S. and throttle V.VS. – strip – net – dimens
E.V.V.S. – NDT chests and seats – 1 side at a time
ETG quill and muff @ works
RMV. remaining E.V.V.
Fit new no. 10 BRG
Bolt heat to loosen BOT. I.VV.
Send
remaining
E.V. to barton
clearance checks
I.P. cylinder – fit and
Nozzle box NDT
Distortion checks
M/C S.E.P. spherical – G.E.C.
S.E.P. foundation bolts repairs and clean
Grind out HP. diaph blade cracks
HP. diaphs. distortion checks
New no. 2 bearing to fit
Nozzle plate securing studs G.E.C.
O/H extraction pumps
Figure 7.14 Bar chart for a 5-days window for shutdown control

Management of plant turnarounds – Part 2 133
Review Questions Guidelines
R7.1 The planning and scheduling of major shutdowns has a much longer planninghorizon – in the case of power stations it is up to 1 year. A major shutdowninvolves a multitude of interrelated tasks requiring some form of network analy-sis. In addition it generates a major resource peak which can involve employinghundreds of contract trades.
R7.2 The main advantages are as follows:● The turnaround manager provides single point control for the duration of the
turnaround.● There is a dedicated planning team the core of which came from the initiation
phase preparation team.● Each plant area, e.g. turbine has its own specialized engineer and specialized
core trade-force.● During the turnaround the demand for labor varies across each of the core
teams and is supplied from the centralized resource pool.R7.3 In order to ensure that at least 80% of the shutdown work is planned it is nec-
essary to:● have excellent plant and maintenance history from previous shutdowns, e.g.
what was replaced? What was worn but left to the current shutdown? etc.● have excellent offline condition monitoring (non-destructive testing during
shutdowns) and online condition monitoring and condition monitoring history.R7.4 Fertec suffered badly over a number of years as a result of poorly executed
shutdowns. In order to overcome this problem they set up a permanent shut-down planning team with a shutdown manager. This group was responsible forplanning the shutdown for the two sites. They were shutdown planning special-ists and acquired state of the art shutdown planning knowledge and techniques.In general they followed the shutdown methodology outlined in Figure 7.12.
The main problems identified during the audit are listed in the case study andcan be summarized as follows:● Improvement needed in shutdown/startup plans, site logistics and shutdown
history of the large machines.● Lack of standard job procedures with inspection test plans.● Software links required across the main maintenance software and Primavera
to enable cost control.R7.5 The petroleum refinery would have built up considerable planning and plant his-
tory from previous shutdowns. This information is invaluable when planningfuture shutdowns. Such information would not be available for a new installation.
Review Questions
R7.4 This question refers to the agricultural chemical plant of the case study inthis book (see Chapter 11).
List the main reasons why Fertec carried out major work planning successfully.
List the main problems in major work planning that were identifiedduring the audit.
R7.5 Explain why the planning and scheduling of a major overhaul of a 20-year-old petroleum refinery should be easier than the planning and schedulingof the installation of a new petroleum refinery.

This page intentionally left blank

PART 4
Spare parts management

This page intentionally left blank
Spare parts management
8‘A place for everything, everything in its place.’
Anon
Chapter aims and outcomes
To model and describe the operation of a maintenance stores system and to explainthe techniques, principles and concepts necessary for its cost effective performance.
On completion of this chapter you should be able to:
● model and describe the operation of the stores system and the rotable system;● define the stores function and objective;● understand how to set inventory levels for fast moving parts, slow-moving parts
and rotables;● model a stores documentation system and explain its operation;● understand the alternative ways, with advantages and disadvantages, of allocating
the responsibility for stores management;● identify the main stores and rotable performance indices.
Chapter route map
Book divisions
Introductory chapters
Budgeting and control
Work planning andwork control
Spare partsmanagement
Documentation
Case studies
This chapter in the division
Chapter 8.0Spare partsmanagement
Chapter topics
8.1 Introduction
8.2 Outline of the stores operation
8.3 Inventory policy
8.4 Management of repairable equipment (rotables)
8.5 Inventory policy guidelines
8.6 Stores documentation
8.7 Stores organization
8.8 Stores and rotable performance indices
8.9 Summary

8.1 Introduction
Most companies tend to manage the purchasing, storage and supply of spare parts andmaterials as a separate department to the management of the maintenance department(see Figure 8.1). The management of spare parts and materials is a company level sys-tem (Level E of Figure 2.3), supplying the maintenance system with one of its essentialresources. The maintenance department can be regarded as the main customer of thestores department that reports (with purchasing) to the commercial manager.
The theory and practice of stores management is a subject in its own right, quite afew textbooks having been solely devoted to stores management in general and stores
Maintenance Systems and Documentation138
Key words
● Spare parts management● Spares inventory policy● Spares lead time● Stock control● Closed-stores policy● Purchasing policy● Consignment stock● Rotables● Insurance spares● Required level of service
Chief engineer
Project
section
Commercial
manager
General manager
Production
manager
Production staff
for A, B and CMaintenance
manager
Workshop
superintendent
and staff
Plant
engineer (A)
Stock
controller
Stores
superintendent
Purchasing
section
Storemen for
A, B and C stores
Storeman
main stores
(Similar
for B and C)
Figure 8.1 Administrative structure showing centralized responsibility for stores
inventory control in particular. This section will concentrate on those areas of storesmanagement that are particular or unique to maintenance management (e.g. slow-moving spares).
8.2 Outline of the stores operation
A model that describes the operation of the stores system is shown in Figure 8.2. Spareparts and materials are one of the essential resources (the others being labor, tools andinformation) necessary to carry out maintenance work.
The basic function of the maintenance stores can be defined as:
to act as a buffer (or reservoir) between the uncertainties of the supply from the
manufacturers (or from the reconditioning workshop – external or internal) and
the inherent variability of the maintenance demand.
The rational objective of running a spare stores and controlling its inventory is to min-imize the sum of the associated direct costs (of obtaining and holding the spares) andthe indirect costs (of loss of production or repair time due to waiting for spares).
In other words if large numbers of every conceivable spare were to be held thedowntime would be minimal, but the costs of obtaining and holding the stock wouldbe excessive and it is unlikely the stores objective would be achieved.
For ease of identification and retrieval maintenance parts are coded (e.g. by type,size, and type and make of bearing) and given a description/name, cataloged and givena stores locator. Each ‘stores item’ requires an inventory policy, a set of rules for decid-ing how the number of parts held in store is to be controlled so that the stores objec-tive will be met, see Figure 8.2. For example one simple inventory policy for a storesitem would be to determine a maximum number of parts to hold and a minimum levelat which parts type should be re-ordered. (There are a number of different inventorypolicies suitable for different types of part usage rate.) Stock control monitors the usage(and delivery) of each stores item in conjunction with the designated inventory policyin order to control part replenishment, i.e. it uses the inventory policy to decide whenthe part should be re-ordered. This information is passed to purchasing which placesan order with a manufacturer. It will be appreciated that it is essential that all partscrossing the stores boundary are recorded and entered into stock control.
Figure 8.2 shows that the stores system also has a major part to play in the storageand control of internal and external reconditioned parts, mainly complex replaceableitems. An additional source of spare parts can come from ‘cannibalizing’ old and unwantedunits, however these are unlikely to be controlled by stores.
If there were only one type of part in stores and the demand for it was high thenstores management would be easy, although Figure 8.2 would still describe the opera-tion of the system. The practice, however, is much more difficult – the main complicat-ing factors are:
● Multiplicity of parts and material types: Stores in even a small plant might well holdover a thousand different ‘stores item’ – hence the need for cataloging. The onus
Spare parts management 139
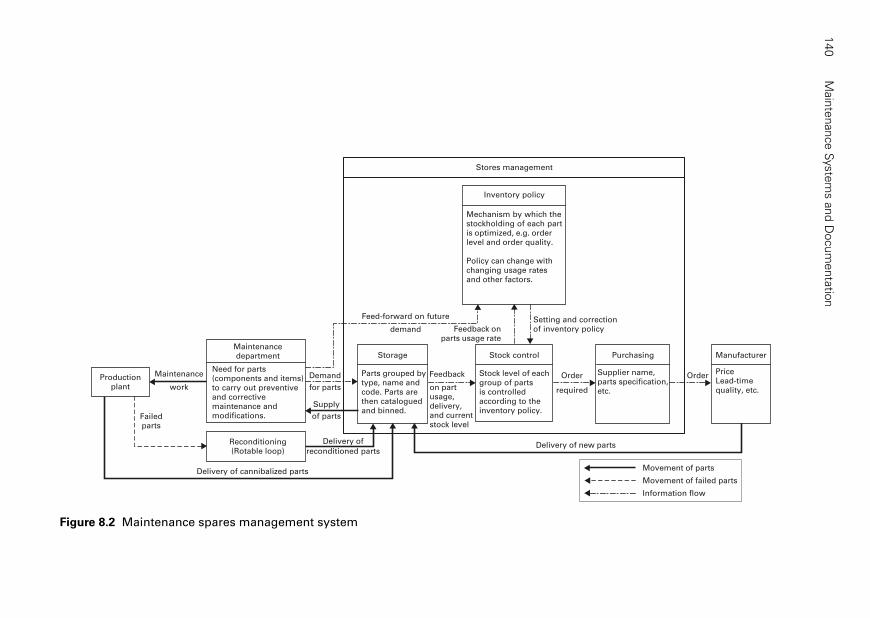
Main
tenance S
yste
ms a
nd D
ocum
enta
tion
140
Stores management
Purchasing
Supplier name,parts specification,etc.
Stock control
Stock level of eachgroup of partsis controlledaccording to theinventory policy.
Storage
Parts grouped bytype, name andcode. Parts arethen cataloguedand binned.
Reconditioning(Rotable loop)
Productionplant
Maintenancedepartment
Need for parts(components and items)to carry out preventiveand correctivemaintenance andmodifications.
Maintenance
work
Failedparts
Demand
for parts
Supply
Delivery of
reconditioned parts
Delivery of cannibalized parts
Feedback
on partusage,delivery,and currentstock level
Order
required
Order
Delivery of new parts
Inventory policy
Mechanism by which thestockholding of each partis optimized, e.g. orderlevel and order quality.
Policy can change withchanging usage ratesand other factors.
Feed-forward on future
demand Feedback onparts usage rate
Setting and correctionof inventory policy
of parts
Movement of parts
Information flow
Movement of failed parts
Manufacturer
PriceLead-timequality, etc.
Figure 8.2 Maintenance spares management system
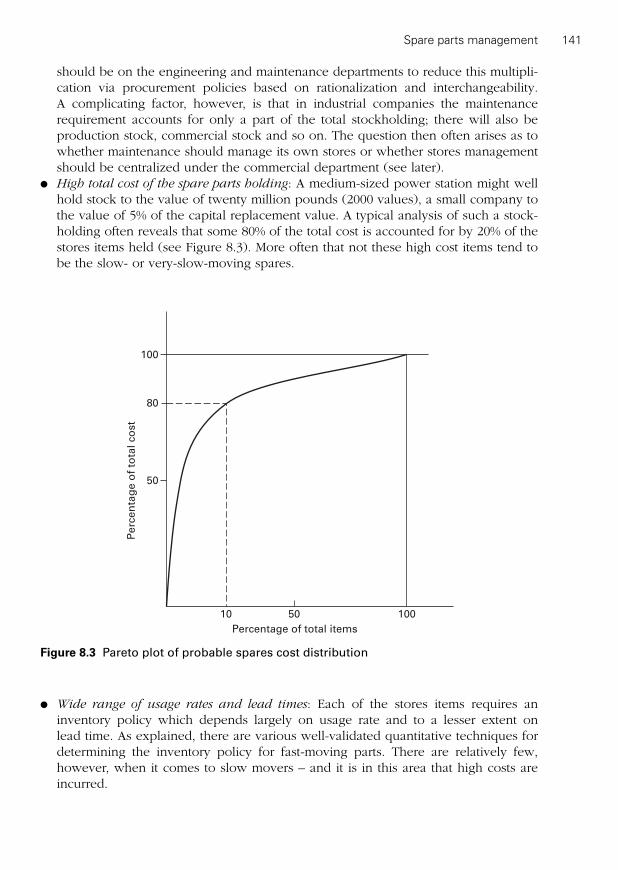
should be on the engineering and maintenance departments to reduce this multipli-cation via procurement policies based on rationalization and interchangeability. A complicating factor, however, is that in industrial companies the maintenancerequirement accounts for only a part of the total stockholding; there will also be production stock, commercial stock and so on. The question then often arises as towhether maintenance should manage its own stores or whether stores managementshould be centralized under the commercial department (see later).
● High total cost of the spare parts holding: A medium-sized power station might wellhold stock to the value of twenty million pounds (2000 values), a small company tothe value of 5% of the capital replacement value. A typical analysis of such a stock-holding often reveals that some 80% of the total cost is accounted for by 20% of thestores items held (see Figure 8.3). More often that not these high cost items tend tobe the slow- or very-slow-moving spares.
Spare parts management 141
10 50 100
100
80
50
Percentage of total items
Perc
en
tag
e o
f to
tal co
st
Figure 8.3 Pareto plot of probable spares cost distribution
● Wide range of usage rates and lead times: Each of the stores items requires an inventory policy which depends largely on usage rate and to a lesser extent on lead time. As explained, there are various well-validated quantitative techniques fordetermining the inventory policy for fast-moving parts. There are relatively few,however, when it comes to slow movers – and it is in this area that high costs areincurred.

Review Questions
R8.1 Define the objective associated with the storage of maintenance.R8.2 A typical company administration is shown in Figure 8.1. The manage-
ment of maintenance spares is the responsibility of the commercial man-ager. The maintenance manager has the responsibility for deciding on thespares to be held for new equipment. Explain how this division of respon-sibilities influences the achievement of the maintenance objective.
Exercise
E8.1 Carry out a Pareto analysis of your own company’s spare parts stores inorder to understand the spares/cost distribution (see Figure 8.3).
8.3 Inventory policy
To facilitate the setting of inventory control policies spare parts can be classified accord-ing to their usage rates into fast moving (where the demand is greater than, say, threeitems per year) and slow moving (demand less than that figure).
8.3.1 Inventory policy for fast-moving spares
Inventory control policies for fast-moving spares have been covered fairly extensivelyin various textbooks (including the authors’) [1]. Just one such policy will therefore bepresented here, and then only in sufficient outline to illustrate the basic principles, themain effort of this section being directed at the problem of slow-moving spares.
As already explained, the task is to balance the cost of holding stock against the costof running out. In general, inventory control theory attempts to determine those proce-dures which will minimize the sum of the cost of:
● running out of stock (production loss due to stoppage, cost of temporary hire, etc.);● replenishing stock (which in part depends on the quantity ordered);● holding stock (interest on capital, depreciation, insurance, etc.).
There are two basic categories of control policy for fast movers, viz.:
1. Re-order level: replenishment prompted by stock falling to a pre-set re-order level;2. Re-order cycle: stock reviewed, and replenishment decided, at regular intervals.
Lewis, in his concise and readable textbook [2] on this topic, further subdivides thesecategories into five policy types (a classification which, he states, is exhaustive, othertypes usually being further elaborations on one or more of these basic schemes). Forillustration this section will describe a re-order level policy.
A re-order level policy – the so-called ‘two-bin’ system (see Figure 8.4): The inventorypolicy is set in terms of a re-order level M and a re-order quantity q. The stock is
Maintenance Systems and Documentation142

continuously monitored and a replenishment order for a fixed quantity q is placed whenstock on-hand (stock held plus stock on order) falls to or below a pre-set re-order level M(i.e. storage in two bins, order placed when first bin empty, service from second bin untilorder received). The re-order level stock (i.e. the contents of the second bin) thus actsas a reservoir which diminishes the risk of running out of stock arising from the randomvariability of demand and the uncertainty of the lead time. The resulting pattern of stockholding is shown in Figure 8.4 where the solid line represents the stock held, and thebroken line the stock on-hand (as defined above).
In the two-bin system a fixed quantity is ordered at variable intervals of time; in gen-eral to operate such a method needs continual monitoring of all stock transactions andit is only with the advent of the computer that it has become at all widely used.
The re-order quantity q can be evaluated from the expression
whereD is the mean demand for the part per unit time,CO is the cost of the replenishment order,CH is the cost, per item, of holding the part.
The re-order level M can be calculated from the expression:
M � DL � k�DL1/2
whereL is the mean lead time,�D is the standard deviation of demand per unit time,k is the standard normal variate.
qDC
C�
2 O
H
1/2
Spare parts management 143
50
20
Time
Re-o
rder
qu
an
tity
(q
)
Sto
ck l
eve
l
Re-order level
M
Order placed
Lead
time
Stockout
Figure 8.4 Variation of stock level under a re-order level regime
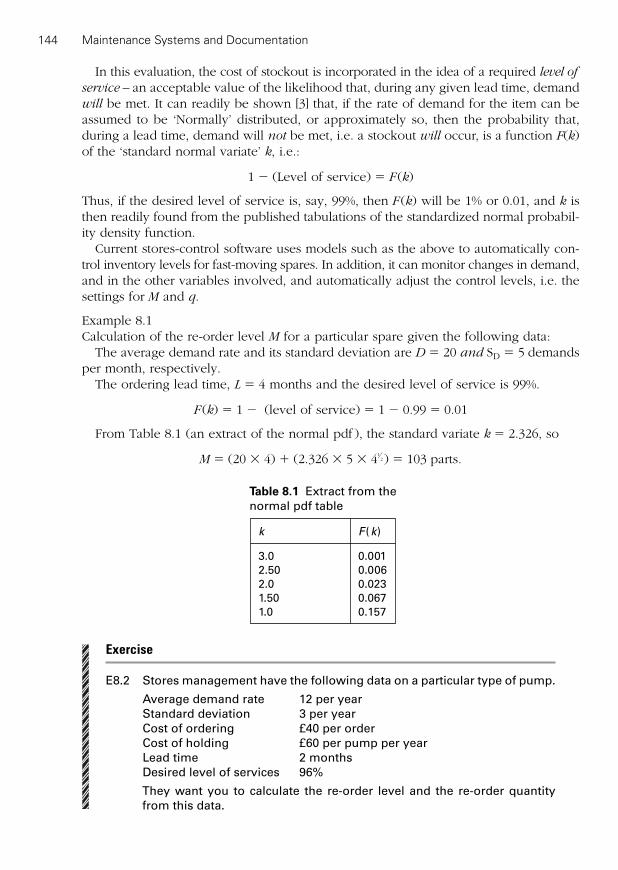
In this evaluation, the cost of stockout is incorporated in the idea of a required level of
service – an acceptable value of the likelihood that, during any given lead time, demandwill be met. It can readily be shown [3] that, if the rate of demand for the item can beassumed to be ‘Normally’ distributed, or approximately so, then the probability that,during a lead time, demand will not be met, i.e. a stockout will occur, is a function F(k)of the ‘standard normal variate’ k, i.e.:
1 � (Level of service) � F (k)
Thus, if the desired level of service is, say, 99%, then F (k) will be 1% or 0.01, and k isthen readily found from the published tabulations of the standardized normal probabil-ity density function.
Current stores-control software uses models such as the above to automatically con-trol inventory levels for fast-moving spares. In addition, it can monitor changes in demand,and in the other variables involved, and automatically adjust the control levels, i.e. thesettings for M and q.
Example 8.1Calculation of the re-order level M for a particular spare given the following data:
The average demand rate and its standard deviation are D � 20 and SD � 5 demandsper month, respectively.
The ordering lead time, L � 4 months and the desired level of service is 99%.
F (k) � 1 � (level of service) � 1 � 0.99 � 0.01
From Table 8.1 (an extract of the normal pdf ), the standard variate k � 2.326, so
M � (20 � 4) � (2.326 � 5 � 41⁄2) � 103 parts.
Maintenance Systems and Documentation144
k F (k)
3.0 0.0012.50 0.0062.0 0.0231.50 0.0671.0 0.157
Table 8.1 Extract from the normal pdf table
Exercise
E8.2 Stores management have the following data on a particular type of pump.
Average demand rate 12 per yearStandard deviation 3 per yearCost of ordering £40 per orderCost of holding £60 per pump per yearLead time 2 monthsDesired level of services 96%
They want you to calculate the re-order level and the re-order quantityfrom this data.

8.3.2 Inventory policies for the control of slow-moving spares
It was noted earlier that the greater part of the value, and hence the dominant controlproblem, of a spares inventory lies in the expensive slow-moving parts, where over-stocking is not quickly corrected by subsequent consumption. The decision that is thenrequired is whether to hold none, one or – at the very most – two of a given part.Mitchell, working for the National Coal Board of the UK, developed a technique fordealing with this problem [4]. The way the technique is used depends on whether theparts fail randomly or by wear-out.
Random failure parts: If demands for a part, although infrequent, occur quite ran-domly (i.e. they are equally likely to occur at any time) then the probability P (n) ofreceiving n demands in any given lead time can be assumed to be given by the Poissondistribution, i.e.:
where m is the mean demands per lead time(LD)For a re-order level system where only one item is ordered at a time (which would
probably be the case with a very high-cost item) and non-captive demand (i.e. stock-out would be met from another source, egg by making – at known extra expense – thespare in the workshop; with captive demand stockout would be met by earlier deliveryof a spare on order), Mitchell derived the decision chart shown in Figure 8.5. It indi-cates the value of N, the number of items on hand (i.e. in stock plus on order), whichwill minimize CN, the average total cost per unit time (of holding and stockout, the costof ordering being assumed negligible). For points on the line C0 � C1 equal cost arisesif N � 0 or 1; along C1 � C2 equal cost arises if N � 1 or 2 (unlike the curve C0 � C1, theposition of this latter curve is a function of L – and is therefore plotted for various val-ues of this).
So, for a given spare, for which L, D, CH and CS (the stockout cost) are known, thechart is used as follows. If CS /CH and D give a point lying:
(a) below C0 � C1 then no spare should be held,(b) between C0 and C1 � C2 then one spare should be held,(c) above C1 � C2 then two spares should be held.
Example 8.2Estimation of the optimum stockholding for an electric motor, given the following information:
1. Estimated cost of holding the motor, CH � £100 per annum.2. Estimated cost of not being able to replace from stock in the event of an unexpected
failure, CS � £1000.
3. Average lead time for re-ordering, L � 12 months.4. Motor failures occur randomly with an average incidence, D � 0.20 failures per
annum.5. Thus, average interval between demands � 1/D � 1/0.20 � 5 years and CS /CH �
1000/100 � 10.
P nm m
n
n
( )exp
��( )
!
Spare parts management 145
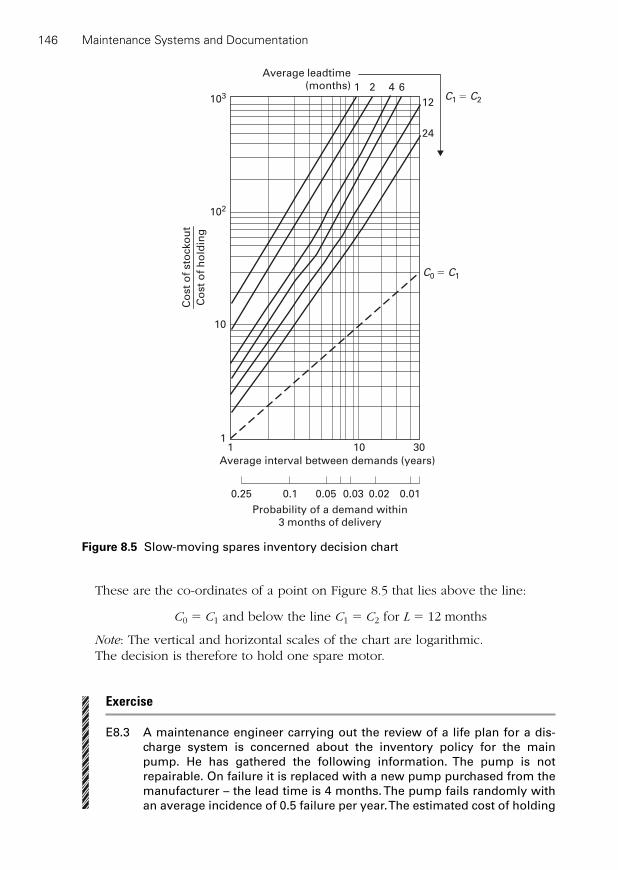
These are the co-ordinates of a point on Figure 8.5 that lies above the line:
C0 � C1 and below the line C1 � C2 for L � 12 months
Note: The vertical and horizontal scales of the chart are logarithmic.The decision is therefore to hold one spare motor.
Exercise
E8.3 A maintenance engineer carrying out the review of a life plan for a dis-charge system is concerned about the inventory policy for the mainpump. He has gathered the following information. The pump is notrepairable. On failure it is replaced with a new pump purchased from themanufacturer – the lead time is 4 months. The pump fails randomly withan average incidence of 0.5 failure per year. The estimated cost of holding
Maintenance Systems and Documentation146
1 10 30
Average interval between demands (years)
Co
st
of
sto
cko
ut
Co
st
of
ho
ldin
g
10
1
102
103
Average leadtime
(months)C1 � C2
C0 � C1
1 2 4 6
12
24
0.25 0.1 0.05 0.03 0.01
Probability of a demand within
3 months of delivery
0.02
Figure 8.5 Slow-moving spares inventory decision chart

the pump is £200 per year. The estimated cost of not being able to replacethe pump from stock is £4000.
Use the slow moving decision chart to recommend an inventory policyfor the pump?
Wear-out failure parts: The same chart can be adapted for deciding stock levels forslow moving wear-out items. The chart’s bottom scale is replaced by one showing theprobability that, for a given part, a demand will occur within the first 3 months follow-ing its delivery (given that no demand has occurred while it has been on order). If, fora particular spare, the assessment of this probability, and of CS /CH, give a point on thechart:
(a) below C0 � C1 then ordering is deferred,(b) above C0 � C1 then one spare is ordered immediately.
It is recommended that each such decision problem should be re-evaluated approx-imately every 3 months.
Example 8.3Estimation of the optimal stockholding for a gearbox given the following information:
1. Estimated cost of holding the gearbox, CH � £100 per annum.
2. Estimated cost of not being able to replace from stock in the event of an unexpectedfailure, CS � £500.
3. Average lead time for re-ordering, L � 6 months.
Failure data have been extracted from the maintenance records of a user with manysuch gearboxes and are prepared as shown in the following table, for plotting on Weibull*probability paper:
Spare parts management 147
* The Weibull probability distribution is outlined in Appendix 1.
Time t from Cumulative percent f(t) new (weeks) of gearboxes failed
120 0.00160 2.50200 12.50240 27.50280 70.00320 90.00360 97.50400 100.00
The straightest plot is produced (see Figure 8.6) if the guaranteed life t0 is taken tobe about 120 weeks and gives a gearbox mean life of about 260 weeks, or 5 years (i.e.this is a slow-moving item) and a b-value of about 3.2 (indicating a wear-out mecha-nism of failure).
For this sort of item the second of the decision chart (Figure 8.5) procedures – involving reference to the scale on the lower of the two horizontal axes – is followed,
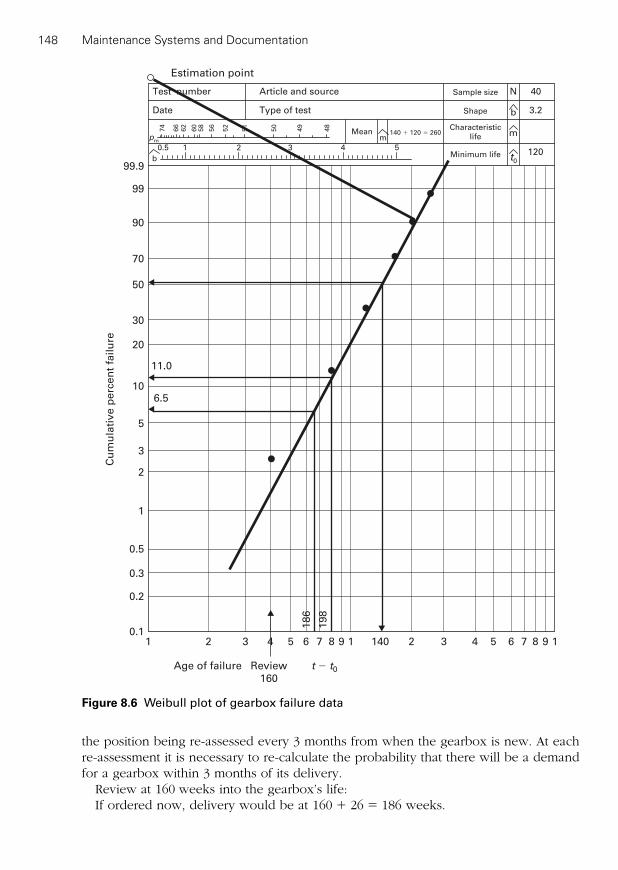
the position being re-assessed every 3 months from when the gearbox is new. At eachre-assessment it is necessary to re-calculate the probability that there will be a demandfor a gearbox within 3 months of its delivery.
Review at 160 weeks into the gearbox’s life:If ordered now, delivery would be at 160 � 26 � 186 weeks.
Maintenance Systems and Documentation148
Estimation point
Test number
Date
Article and source
Type of test
Mean 140 � 120 � 260
Sample size
Shape
Characteristiclife
Minimum life
40
3.2
120
99.9
99
90
70
50
30
20
11.0
106.5
5
Cu
mu
lati
ve p
erc
en
t fa
ilu
re
3
2
1
0.5
0.3
0.2
0.11 2 3 4 5 6 7 8 9
186
198
140 2 3 4 5 6 7 8 9 1
Age of failure Review
160
t � t0
0.5 1 2 3 4 5
74
66
62
60
58
56
52
51
50
49
48
pm m
b
N
t0
b
m
1
Figure 8.6 Weibull plot of gearbox failure data
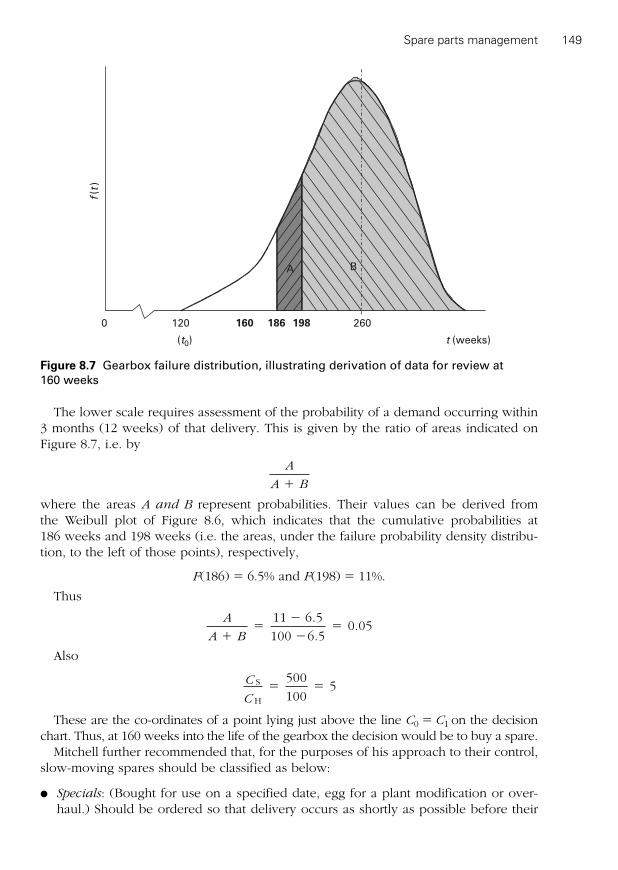
The lower scale requires assessment of the probability of a demand occurring within3 months (12 weeks) of that delivery. This is given by the ratio of areas indicated onFigure 8.7, i.e. by
where the areas A and B represent probabilities. Their values can be derived from the Weibull plot of Figure 8.6, which indicates that the cumulative probabilities at 186 weeks and 198 weeks (i.e. the areas, under the failure probability density distribu-tion, to the left of those points), respectively,
F(186) � 6.5% and F(198) � 11%.
Thus
Also
These are the co-ordinates of a point lying just above the line C0 � C1 on the decisionchart. Thus, at 160 weeks into the life of the gearbox the decision would be to buy a spare.
Mitchell further recommended that, for the purposes of his approach to their control,slow-moving spares should be classified as below:
● Specials: (Bought for use on a specified date, egg for a plant modification or over-haul.) Should be ordered so that delivery occurs as shortly as possible before their
S
H
500
1005C
C� �
A
A B��
�
��
11 6.5
100 6.50.05
A
A B�
Spare parts management 149
0 120 186 198
A B
t (weeks)
f(t
)
260160
(t0)
Figure 8.7 Gearbox failure distribution, illustrating derivation of data for review at 160 weeks

use. Clearly, the ‘safe’ prior interval will be a function of the confidence with whichthe date for the part’s use and the lead time for its ordering are known.
● Adequate warning items: Condition monitoring (or some other indication of impend-ing failure) can provide adequate notice, relative to the lead time of failure. The partis therefore not held in stock.
● Inadequate warning items: For technical or economic reasons no inspection or othertechnique is available for providing notice of failure. Such parts can be subdivided,as already discussed, into those that fail randomly (controlled via the first procedurefor Figure 8.5 explained above) and those that wear out (controlled via the second).
The author has noted during his auditing experience that many companies identifywhat they call insurance spares (or sometimes strategic spares). These are high-costspares that are not expected to fail during the life of the unit to which they belong (theyhave a very low failure rate). However the economic consequences of failure (if such apart was not available after a failure) is so high (CS/CH value would be off the scale ofFigure 8.5) that the part is held and capitalized. A number of companies have enteredinto ‘inter-company sharing arrangements’ to spread the cost of holding such parts.
Review Question
R8.3 With reference to Figure 8.7 (which shows the failure distribution for agearbox failing due to some form of wear-out mechanism) explain theprocedure for establishing the inventory policy for such parts.
8.4 Management of repairable equipment (rotables)
8.4.1 Introduction
It is often more economic to repair or recondition certain types of equipment (mostlycomplex replaceable items, e.g. gearboxes, electric motors) within the company work-shops (or via contractors) rather than purchase new equipment. Parts that are recondi-tioned in this way are sometimes called rotables. The ‘rotable loop’ was shown as onemeans of supplying parts on the stores model of Figure 8.2. The rotables go round thein ‘use–reconditioning–in stores–maintenance–in use’ loop until they are worn out,scrapped and replaced by a new part.
8.4.2 The rotable system
The rotable system is shown in more detail via the example of Figure 8.8. We are con-cerned with the management of the rotable loop and its linkage with the stores ratherthan the economies of repair vs replace.
Figure 8.8 shows that most functions within the loop are the responsibility of themaintenance department and Figure 8.1 shows how these have been allocated. The keyfunction is the planning and scheduling of the workshop workload. The function of the stores is to provide a buffer between the maintenance demand and the workshopsupply. It can be seen that stores holds both the rotables and the parts required for
Maintenance Systems and Documentation150
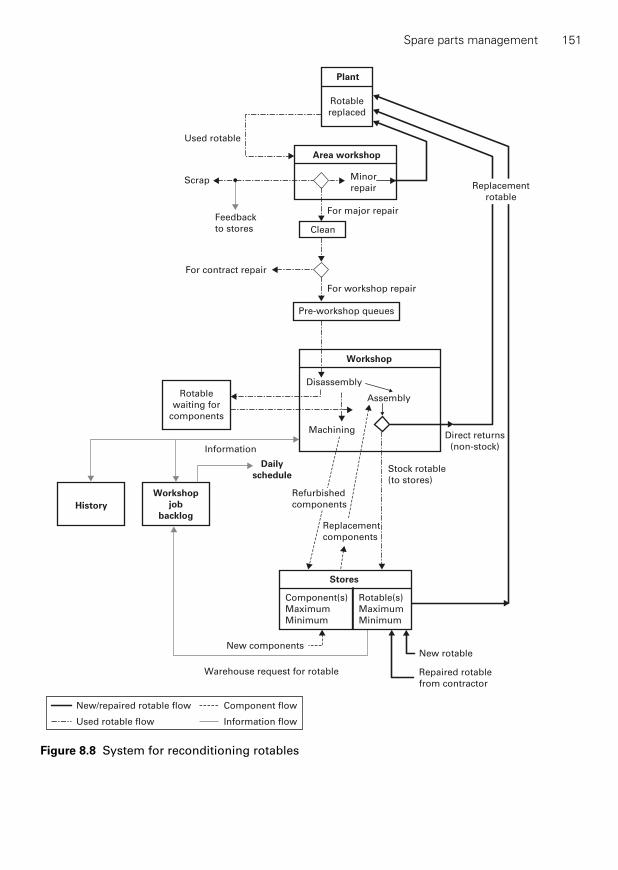
Spare parts management 151
Pre-workshop queues
Workshop
Stores
History
Workshop
job
backlog
Rotable
waiting for
components
Disassembly
Assembly
MachiningDirect returns
(non-stock)
Component(s)
Maximum
Minimum
Rotable(s)
Maximum
Minimum
Plant
Rotable
replaced
Area workshop
Minor
repair
Clean
Used rotable
For workshop repair
For contract repair
Replacement
components
Daily
scheduleStock rotable
(to stores)
New componentsNew rotable
Repaired rotable
from contractor
Warehouse request for rotable
For major repairFeedback
to stores
Scrap
Information
Replacement
rotable
Refurbished
components
New/repaired rotable flow
Used rotable flow
Component flow
Information flow
Figure 8.8 System for reconditioning rotables

internal rotable reconditioning and/or repair. Rotables need to be described and cata-loged in the same way as other parts. An extension of the stores code can also be usedto give each rotable a unique identification number (some times referred to as its ‘birthcertificate number’). This is illustrated in Figure 8.9 for the gearbox of a discharge unit:
● 03/F/002 is the location number of the discharge unit; it can be used to identify theunit on site; as well as in the maintenance management system.
Maintenance Systems and Documentation152
01
03
02
04 05
001 003002
004
A
B
C
D
E
F
Plant 03 made up of six streams
Company made up
of five plants
Stream F made
up of many units
Functional location of
gearbox 03/F/002/03
(computer has information
about what is in this
location)
Unit 002 made
up of five items05 Pump04
0301
02 Coupling
Gearbox
fails
Gearbox
reconditioned
Gearbox identifier
G . XX . X . 23
Make Type Unique number
Gearbox
in stores
Gearbox
required for
a replacement
WorkshopStores
Figure 8.9 Identification of rotables

● 03/F/002/03 is the functional location of the discharge unit gearbox; it can beregarded as a ‘pigeon hole’ within the information system where information on thegearbox resides.
● G.XX.X.23 is the unique rotable identification number.
The gearbox identifier enables it to be tracked around the loop. It also provides work-shop management with the means to collect failure, costs and repair history.
The cost of reconditioning a rotable is established from the workshop planning/cost-ing system and is passed into the company costing system when the rotable is taken outof stores for maintenance (see Figure 4.4).
8.4.3 Rotable inventory policy: the theory
Most rotables in industrial plant tend to be slow movers. It is possible to use the ideasof Figure 8.5 to estimate the maximum/minimum rotable levels to be held in stores. Insuch a situation the lead time is a function of the workshop repair rate which in turndepends on:
● the number of rotables in the system,● workshop planning efficiency,● workshop job priority systems, etc.
An alternative technique that can be used for the determination of a rotable inventorypolicy has been described by Hodges [5]. He assumes that a rotable fails randomly witha failure rate of p per year. Thus if there are N assets using rotables the combinedrotable failure rate is Np. He shows that if the mean time to repair is T years (equivalentof a lead time) then the savings in downtime D if one rotable is held in stores (max 1,min 0) is given by:
D � 1 � e�NpT years per year
If two rotables are held (the second rotable providing cover while the first rotable isbeing reconditioned – a policy of max 2, min 1) then
D � 1 � (1 � NpT )e�NpT unit years per year
And so on to x rotables:
The relationship between the value of NpT and the annual downtime savings in unityears per year is shown in Figure 8.10.
Example 8.4An underground copper mine has 20 identical front end loaders. Gearboxes have beencausing a problem in as much as there has been a number of stockouts. The presentinventory policy for this type of gearbox is to hold a maximum of 2.
D NpT NpTx
NpTNpT x� � � � ��
� �1 11
2
1
12 1e
( ) !( )( )
unit years per year
Spare parts management 153

(a) Use the following information in conjunction with Figure 8.10 to calculate the aver-age downtime cost of the loaders caused by gearbox stockouts.● The average repair time for the gearbox is 10 weeks.● The average life to the reconditioning of a gearbox is 4 years.● Lost profit due to loader downtime averages £30 per hour.● The loaders have an 80% usage factor.
(b) Calculate the reduction in downtime losses if management increases the stores gear-box holding to 4.
(c) Explain how you would establish which of (a) or (b) is the best policy. What addi-tional information would you require?
Solution(a) N � 20, p �
1–4
� 0.25 per year, T �10—52
� 0.20 yearsNpT � 1
Using Figure 8.10 with x � 2 gives an annual loader downtime D of 0.3 loader years.The annual cost of downtime is 365 � 24 � 30 � 80% � £210,240.Thus the annual lost production cost � £210,240 � .3 � £63,072.
(b) Using Figure 8.10 for x � 4 gives an annual average loader downtime of 0.02 loaderyears.
The annual lost production cost is £210,240 � 0.02 � £4205.(c) The following additional information would be needed to compare the alternative
policies:● Average cost of reconditioning the gearboxes.● The company’s policy with regard to investment decisions, e.g. payback period
or return on investment.● The discount factor.
A representative time is selected to compare the alternative policies, say 6 years. Lifecycle costing analysis could then be carried out to compare the extra investment in twogearboxes compared to the discounted saving over the 5 years.
Maintenance Systems and Documentation154
1 2 3 4 5 6 7 8 9
Value of NrT
Mean
savin
gs D
in
un
it y
ears
per
year
0
0.1
0.2
0.3
0.4
0.5
0.6
0.7
0.8
0.9
1.0
x � 1 x � 2 x � 3 x � 4 x � 5 x � 6 x � 7
Figure 8.10 Rotable spares inventory decision chart

Exercise
E8.4 In the worked Example 8.4 establish the downtime losses of the front endloader if 20 extra loaders were purchased and the stores inventory policyremained unchanged.
8.4.4 Rotable inventory policy: in practice
It is the authors’ experience that in practice the rotable inventory policy tends to beguesstimated and subsequently adjusted via usage history and experience. It should benoted that the stores/workshop management have considerable flexibility in terms ofsupply. If the workshop becomes overloaded, i.e. excessive rotable waiting time in thepre-workshop queues (the herding problem) it is possible to use external recondition-ing or purchase new rotables. The workshop priority rules can also be used to allowurgently required rotables (with nil stock) to jump the queue. If this happens as the rulerather than the exception it results in severe workshop disruption (the bypass problem).
It should be emphasized that when the rotable loop is operating normally new rota-bles are only purchased when a failed rotable is deemed non-repairable and scrapped.It is important that there is a linkage between the stores and maintenance informationsystem to flag up scrapped rotables – failure to do this will allow ‘the loop to run dry’!(The loss problem.)
8.5 Inventory policy guidelines
Gathering the information on inventory policy together from Sections 8.3 and 8.4 enablesthe categorization of inventory policy as shown in Figure 8.11.
Other actions/policies that can be carried out/adopted for optimizing the sparesinventory are as follows:
● Spares criticality analysis – all new equipment should be subjected to a spares criti-cality analysis as a part of the establishment of a unit life plan.
● Establish where possible ‘consignment stock agreements’ (suppliers maintains stockon behalf of the client which are only paid for when used).
● Establish rationalization procedures to reduce the number of different part typesstocked. This can be achieved via standardization of equipment used, interchange-ability and modularization.
Some time ago the author was involved in a research project concerning busfleet maintenance. The maintenance strategy used for a bus fleet in a UK city wascompared with that for a USA city. One of the major differences was that the UKfleet used many different kinds of buses and even a greater variety of enginesand gearboxes, while the USA fleet had one type of bus and relatively few typesof engines and gearboxes. This meant that the stockholding for spare parts androtables was much smaller and far less complex in the USA city bus fleet thanthe UK city bus fleet.
Spare parts management 155

Review Questions
R8.4 One of the main difficulties of managing a maintenance stores is associ-ated with the multiplicity of parts and the wide range of usage rates. Listthe main actions that can be taken to eliminate this problem.
R8.5 Draw a simple diagram to illustrate how spare parts inventory policy canbe categorized by the parts usage rate.
8.6 Stores documentation
To manage a stores and rotable system of the kind outlined in Figures 8.1 and 8.9, someform of documentation system is essential. Although these are now almost always fullycomputerized, the principles underlying their operation can be most clearly explainedby reviewing the various activities of a traditional paper-based system (see Figure 8.12).
All stores items must be given a description, a stores code number (see Table 8.2) and a ‘bin’ location number (see Table 8.3) – bin being used in a general sense for any
Maintenance Systems and Documentation156
Fast movers
(see Section 8.3.1)
Specials
Adequate
warning of
failure
Inadequate
warning of
failure
Random
failure
Age-related
failure
Insurance
spares
Use re-order level policy
or re-order cycle policy
Order for delivery
as late as possible
before date of use
Monitor – do not
hold in stock
Use decision
chart – top axis
Use Mitchells decision
chart – top axis to play
safe and bottom axis if
data available for
optimal solution
Use Hodges decision chart
and/or estimate initial levels
and adjust on experience
(see Section 8.4.3)
Use Hodges decision chart
and/or estimate initial levels
and adjust with experience
Slow movers
(see Section 8.3.2)
Rotables
(see Section 8.4.3)
Figure 8.11 Guidelines for spares control policy

Spare parts management 157
Storekeeper Stock control
Catalog
Bin card perpart with
movementsand balance
• Order cards and stock cards for each part
• Record all movements and balance and re-order as necessary
• Modify inventory policy as required
Copy of purchase orders to check delivery
Order to purchasing section
Communication with maintenance department
Stores requisitions and stores receipt
vouchers to accounts for cost control
Artisansquery
Information
Storerequisitioncompleted
Part issued
Copy of
purchase
orders to
check
deliveries
Stores receipt voucher completed
Part delivered Movement of stores requisition/receipt vouchers
Purchase order movement
Stores maintenance communication
Parts movement
Figure 8.12 A paper-based stores documentation system
Two digits to identify major groups, e.g.
01 Abrasives05 Bearings and accessories06 Belting and accessories09 Chain, rope and wire14–17 Fasteners19–20 Hose and fittings34 Packing36–38 Pump parts50–53 Piping56 Valves60–79 Electrical and electronic80–99 Plant-specific spares
Two digits to identify sub-groups, e.g.
06-35 Belt – timing06-40 Belt – transmission06-45 Belt – variable speed
Three digits to assign unique part numbers, e.g.
06-45-255 Belt – variable speed, Dayeo 46V26
Table 8.2 Extract from a simple coding system for spare parts
Valves, Unit of Re-order Re-order
Group number issue Cost point level Bin no.
56-01-150: 1/8 cock, each 2.26 2 4 2/04Air BR 125 SE56-01-166: 1/8 cock, each 1.75 2 4 2/02Pet BR 125 SE
Table 8.3 Extract from spare parts catalog

storage arrangement (shelf, drawer, pigeon hole, box, drum, sack, marked floor spaceor whatever) that isolates a stores item. These are basic essentials for the elimination ofduplication, for simpler parts ordering and faster part location.
Figure 8.12 models a stores system in which no part can be delivered or withdrawnwithout the transaction being recorded. The issue of a part to the trade-force is coveredby a stores requisition document (see Figure 8.13) on which data (plant or unit number,job number, work type, etc.) are also recorded for the maintenance costing system. Alldeliveries (which should be checked for conformity to specification) are covered by astores receipt voucher (see Figure 8.14).
Maintenance Systems and Documentation158
ENGINEERING STORES REQUISITION S.R. No. 0003
Plant description
Location
Date
Description
Artisan‘s
signature
Foreman's
signature
Storekeeper's
signature
Stock control entered
Part
number
Plant/Job number
Cost code number
Number
Quantity
Req'd Issued
Price
Unit Total
Bin
location
Figure 8.13 Stores requisition
For each ‘stores item’ the storeman keeps a bin card on which he records all trans-actions (receipts and issues) and the stock balance – many stores also attach a simplepart label to atleast one part as an identification check. This is particularly important inthe case of rotables – the label should include its identification number, when it wasreceived in stores and the date reconditioned. All requisitions and receipts pass throughstock control on their way to the accounts department and the stock controller recordsthem, and also the various stock levels, on stock control record cards. This informationis in turn required for the operation of the inventory control policy (see Figure 8.4) andfor monitoring changes in demand rates, lead times and so on. Stock replenishmentorders are handled by the purchasing department.
In most companies the computerized system for stores control is integrated with thesystems for general purchasing, invoicing and maintenance activities. The store system

is ‘paperless’, even down to the use of bar-code readings for registering parts requestsand issues. Most stores catalogs facilitate searching for parts under various standardcodings and verbal descriptions; parts may also be identified and ordered by artisansoperating from their own terminals.
Some of the common problems with stores documentation are as follows:
● The trade-force find difficulty in finding a part in the catalog because of poor partdescriptions. This can be overcome by using colloquial names linked to standarddescriptions.
● The computer system indicates the part is in stock but in fact it is found to be ‘nilstock’. This is mostly caused by the trade-force (or somebody!!) taking parts out with-out booking – perhaps on nights when there is no storeman, or as a result of anopen stores policy.
Case study 1 (see Chapter 11) involves two similar chemical plants, Fertec A andFertec B, operated by the same company. Fertec A were experimenting with an‘open stores policy’ – the trade-force could locate the part on the computer andthen ‘self-serve’ signing off when the part was taken. In spite of system safeguards ‘parts’ were still ‘going missing’. Fertec A used a strict ‘closed-stores pol-icy’. It seemed to the author the chief storeman ‘rode shotgun’ outside the storesdoor and the trade-force were not allowed to pass – certainly not if they wereunaccompanied by a storeman. His view was that he had learned from longexperience ‘that artisans were not to be trusted in the stores’.
Spare parts management 159
ENGINEERING STORES RECEIPT VOUCHER S.R.V. No. 0003
Re-order date
Supplier
Order number
Description
Received by Checked by stores Checked by supervisor Stock control entered
Part
number
Plant/Job number
Cost code number
Number
Quantity
Ordered Received
Bin
locationBalance
Note number
Figure 8.14 Stores receipt voucher

● Parts are not checked properly on receipt and it is not until they are withdrawn that it is discovered that they are the wrong specification (in particular a problemwith electronic parts). It is important for quality assurance that a proper inspectionprocedure is set up for incoming parts – in particular for complex, expensive assemblies.
● Equipment can deteriorate in the stores. It is important to set up effective inspectionand maintenance procedures for stored parts, e.g. motor shafts should be periodi-cally turned.
● The inventory control policy for parts can be disrupted through the setting up ofunofficial stores. Supervisors often distrust computerized stores and withdraw partsto hold in their own ‘unofficial stores’ – the ‘magpieing problem’.
An alumina refinery brought in a centralized computer controlled stores system.The decentralized stores were all brought within the closed boundaries of thenew stores system. The ‘unofficial stores’ were also located and closed. In spiteof this the area supervisors built up a number of new ‘unofficial stores’ becausethey said ‘they could not rely on the new stores’. Their actions were contributingto the stores problems – I call this the ‘magpieing problem’.
Review Question
R8.6 With reference to the rotable system of Figure 8.8 explain the following:● Herding problem● Bypass problem● Loss problem● Magpieing problem.
8.7 Stores organization
Figure 8.1 shows an example of a company administrative structure where the respon-sibility for stores management is a separate function to maintenance management. Anoutline of the corresponding company resource structure is shown in Figure 8.15.
Figure 8.15 shows the stores location within the maintenance resource structure, i.e.mainly centralized with a number of sub-stores to match the decentralized maintenancegroups. Figure 8.1 indicates the commercial department’s responsibility for stores man-agement, i.e. for its budget, for part storage, cataloging, issuing, ordering and receipt,inventory policy and staffing. The maintenance department being responsible for the ini-tial order quantities and for the specification. This tends to be the arrangement becauseof the advantages of centralization of stockholding, purchasing and invoicing. (Rememberthat maintenance stores accounts for only one part of the total company stockholding –albeit in most cases the dominant part.) The main problem with this arrangement is thetendency of all maintenance departments to play safe, overspecify and overstock – this isespecially so with the slow moving and insurance parts. Periodically, the commercialdepartment may attempt to correct overstocking and in doing so may over-react, leadingto eventual stockouts.
Maintenance Systems and Documentation160

Where the responsibility for spares management is as shown in Figure 8.1 effort mustbe devoted to:
● clearly identifying the role of the commercial department;● putting systems in place at the maintenance–stores interface which will ensure that deci-
sions should always be referred back to maintenance regarding the changing of inven-tory policy of insurance spares and high cost parts (to ensure they are still wanted);
● ensuring that there are stores staff who are technically competent in the maintenanceand engineering areas.
There are many possible variants of the structure of Figures 8.1 and 8.15. Some compa-nies, e.g. make the maintenance department fully responsible for their own spares; oth-ers adopt the Figure 8.1 arrangements but also make maintenance responsible for theinventory policy.
8.8 Stores and rotable performance indices
It will be appreciated that there are many variations of the store system and rotable sys-tem shown in Figures 8.2 and 8.9. Modeling systems in this way allows an understand-ing of the way in which they operate and facilitate the establishment of performanceindices. Some of the main performance indices are listed in Table 8.4.
Review Questions
R8.7 A artisans establishes that according to the stores computer system a parthe wants is in stock. The storemen subsequently find the part is not instock. List the possible reason for this situation.
R8.8 List the key performance indices for stores management and at leastthree key performance indices for the management of rotables.
Spare parts management 161
Stores boundary
Digestion
area
Digestion
maintenance
Digestion
area
stores
Precipitation
area
stores
Calcination
area
stores
Precipitation
maintenance
Calcination
maintenance
Precipitation
area
Main workshopCentralized
tool stores
Main
stores
Calcination
Figure 8.15 Resource structure, showing stores location

8.9 Summary
The authors auditing experience indicates that the maintenance stores function is often notwell carried out. The maintenance department feel they do not get a good service (serviceslow, unable to find parts, stockouts) while the senior management consider there is highadministrative costs due to overstocking, especially with the slow-moving category:
● The worst case the author has come across was a chemical company where each main-tenance supervisor (four in total) was responsible for his own stores. There were 13different storage areas, most were open. The parts were not categorized or cataloged.
● A recent audit of a power station revealed that the slow movers and insurance partsaccounted for some 83% of the stockholding costs but there had never been a reviewof their usage.
● An audit of a cement plant established that while the slow movers/insurance partsaccounted for the majority of stockholding costs a spares criticality analysis had neverbeen carried out. Investigation revealed that some critical parts were not being held.
In order to overcome such problems the author believes that it is important to modelthe maintenance-stores system shown in Figures 8.2 and 8.8. This enables the manage-ment of a company to:
● understand the way in which the system operates;● identify the stores objectives and procedures to ensure they are compatible with
those of the maintenance department;
Maintenance Systems and Documentation162
Spare parts performance indicators
Number of different ‘stores items’.Value of total parts in stock.Turnover ratio � value of annual issues/value of total stores inventory.Value of slow-moving parts as a percentage of total inventory value.Value of insurance parts as a percentage of total inventory value.Ratio of annual stores administrative cost vs inventory value.Total stock outs per period.Stock outs per period causing production loss.Level of service index � stock outs per period/total requests per period.
Rotable performance indicators (see Figure 8.9)
Number of rotables ‘store items’.Number of rotables in stock.Value of rotables in stock.% of rotables externally reconditioned.% of direct return rotables (non-stock).% of rotable externally reconditioned by category (e.g. gearbox).% of rotables replaced per annum by category.Average waiting time for rotable repair.Average waiting time for rotable repair caused by component stockout.Rework index for internally reconditioned rotables.Rework index for externally reconditioned rotables.
Table 8.4 Stores and rotable performance indices
● use the techniques, models and procedures of this chapter (and references) to pro-vide the necessary corrective action.
References
1. Kelly, A. and Harris, M.J. The Management of Industrial Maintenance, Butterworths,1978.
2. Lewis, C.D. Scientific Inventory Control, Newnes-Butterworths, 1971.3. Harris, M.J. An introduction to maintenance stores organization, Terotechnica, 1,
1979, pp. 47–57.4. Mitchell, G.H. Problems of controlling slow-moving spares, Operational Research
Quarterly, 13(1), 1962, pp. 23.5. Hodges, N.W. Strategic Spares and the Economies of Operations, Mechanical
Engineering Publications Ltd., London, 1994.
Spare parts management 163
Exercise Guideline Solutions
E8.2 Re-order level M � DL � K�DL1⁄
2
F (k) � 1 � (level of service) � 1 � 0.96 � 0.04From Table 7.1 the standard variate to � 1.75
M � 2 � 2.14, say 4
Re-order quantity
� 4.The recommended policy is to set the re-order level at 4 and the order quantityat 4.
E8.3 The pump failures randomly – use the top horizontal axis. Average incidencebetween demands is (1/D) � (1/0.5) � 2 years
These are the co-ordinates of a point on Figure 8.5 that lies above the lineC1 � C2 for L � 4 months.
The recommended inventory policy for the pump is maximum two, minimum one.
E8.4 N � 40, p �1—4
� 0.25, T �10—–52
� 2.0
NpT � 2Using Figure 7.10 with x � 4 gives an annual loader downtime D of 0.16.
The annual lost production cost is £2,10,240 � 0.16 � $33,638.
C
CS
H
� �4000
20020
q � �2 1240
60.
1/2
M � � �122
121 75 3
2
12.
1/2

Maintenance Systems and Documentation164
Review Questions Guidelines
R8.1 ‘To minimize � of holding costs � stockout costs’.R8.2 Explained in Section 8.7. Maintenance engineers tend to play safe with initial
orders for slow-moving parts. They over specify and overstock – they are con-cerned mainly with avoiding stockouts and unit unavailability. Periodically thecommercial department may attempt to correct overstocking and in doing somay over-react, leading to stockouts – they are concerned mainly with the costof holding.
R8.3 Figure 8.7 shows that no failure is likely before 120 weeks and the probabilityof failure then increases with time.
The inventory procedure for such ‘wear-out parts’ is a ‘dynamic procedure’,i.e. the inventory controller/engineer is expected to check at 3 monthly intervals‘the probability of a demand within 3 months of delivery’. The bottom axis withCS/CH is then used to establish if a spare should be purchased.
In practice there is little point in checking until, say, 100 weeks into the gear-boxes life and thereafter at 130 weeks, 160 weeks, etc.
R8.4 Rationalization, standardization, modularization, interchangeability.R8.5 See Figure 8.11 – but you should attempt to draw it without reference.R8.6 The herding problem: Most of the rotables in the cycle end up on the pre-
workshop queues. Usually caused by maintenance workshop inefficiencyand/or overloading/understaffing of the workshop.
The bypass problem: The reconditioning of critical rotables jump the work-shop queues.
The loss problem: A rotable is scrapped without letting the stores know.The magpieing problem: A supervisor/engineer builds unofficial stores using
official stores stock.R8.7 ● Artisans/or others removing parts from stores without booking them out.
● Part is in stores but in the incorrect bin.● Supplier sent the wrong part which was not checked on receipt.
R8.8 Listed in full in Table 8.4.

PART 5
Documentation

This page intentionally left blank
Maintenance documentation systems: what they are and how they work9
Chapter aims and outcomes
To explain the structure and operation of maintenance documentation systems.
On completion of this chapter you should be able to:
● draw a functional model of a maintenance documentation system; identifying eachof the seven modules and explaining how the system operates;
● take each of the seven modules in turn, explaining their maintenance documenta-tion function, the information they need in order to perform their function, and thedocuments, files and reports they use or are generated by them.
Chapter route map
Book divisions
Introductory chapters
Budgeting and control
Work planning andwork control
Spare partsmanagement
Documentation
Case studies
This chapter in the division
Chapter 9Maintenancedocumentation systems:what they are and howthey work
Chapter 10Computerizedmaintenanceinformation systems:their uses and problems
Chapter topics
9.1 Introduction
9.2 A functional model
9.3 Plant inventory (Module 1)
9.4 Information base (Element 2)
9.5 Preventive maintenance schedule (Module 3)
9.6 Condition monitoring (Module 4)
9.7 Short-term work planning (Module 5)
9.8 Long-term work planning (Module 6)
9.9 Maintenance control (Module 7)
9.10 Summary
‘A page of history is worth a volume of logic.’
Oliver Wendell Holmes
9.1 Introduction
The business-centered maintenance system paradigm that was outlined in Chapter 1(see Figure 1.1) made clear that some form of documentation system, for recording andconveying information, is an essential operational requirement for all the elements ofthe maintenance management cycle.
Maintenance documentation can be defined as:
Any record, catalog, manual, drawing or computer file containing information
that might be required to facilitate maintenance work.
A maintenance information system (MIS) can be defined as:
The formal mechanism for collecting, storing, analyzing, interrogating and
reporting maintenance information.
Although almost all current systems are computerized, the basis of their mode of oper-ation has evolved from that of the traditional paperwork system and can be most eas-ily explained by discussing the various components and information flows of the latter.
9.2 A functional model
The way in which a MIS generally functions is outlined in Figure 9.1, a model whichhas evolved over a number of years through extensive studies of both paper-based andcomputerized systems, and which therefore illustrates the principal features of bothtypes – features which, inevitably, they have in common.
The system can be considered to be made up of the following interrelated modules:
1. Plant inventory2. Maintenance information base3. Maintenance schedule
Maintenance Systems and Documentation168
Key words
● Maintenance documentation● Maintenance information systems● Documentation model● Manuals library● Plant history● Plant inventory● KKS plant coding● Spare parts list● Application parts list● Bill of materials

4. Condition monitoring5. Short-term work planning and control6. Shutdown work planning and control7. Maintenance control.
The plant inventory (1) (sometimes called the plant register) is a coded list of the plantunits, e.g. a bauxite mill. This is the main way into the system. The maintenance informa-tion base (2) is a database of maintenance information, e.g. unit life plans, job catalog, etc.for each of the units. The maintenance schedule (3) is a schedule of the preventive
Maintenance documentation systems: what they are and how they work 169
Modifications
Corrective
maintenance
(some via inspections)
Maintenance schedule
(3)
Inspection schedule
(4)
(condition monitoring)
Life plans record
by unit
Standard
job catalog
Operating
procedures
record by unit
Plant manuals
and drawings
by unit
Planttechnicalrecordsby unit
Spare parts
list by
unit
Rotable
history
Plant history
records by
unit
Long-term
planning (6)
(networks)
Short-term work
planning (5)
Stores system
Trade-force
history
Cost and
availability
history
Plant
inventory (1)
by unit
Trade-force
performance control
Cost
control
Maintenance
control (7)
Plant reliability
control
Spares
usage
history
Execution
Maintenance information base (2)
for plant units
(work order
system)
Reports
Allocation
Work
Work
order out
order in
Key
Job flow
Information flow
Control information
Possible leakages with
other company
functions
Figure 9.1 A functional model of a maintenance documentation system

maintenance jobs (over a year and longer) listed against each of the units in the life plans.The condition monitoring schedule (4) is a schedule of the condition monitoring tasks, e.g.vibration monitoring listed against each of the units in the life plans. The short-term workplanning system (5) is the documentation/information system necessary to carry out thefunction outlined in the work-planning model of Figure 5.7. The system has to plan andschedule preventive jobs (arising from the maintenance schedule), corrective jobs (of allpriorities) and where necessary modification jobs. The jobs are carried out by trade-forcevia hard copy or electronic work orders. Information coming back on the work orders (andother documents) is used to update the planning systems and provides information formaintenance control. The long-term planning system (6) uses the technique of critical pathanalysis and bar charting to plan and schedule the major work and then uses the short-termplanning system (the work order system) to carry out the work. The maintenance controlsystem (7) uses information coming from a number of sources, work orders, stores, shiftrecord, etc. to provide various reports for cost control, plant reliability control, etc.
Up until about 10 years ago most MIS were stand alone, i.e. they had no elec-tronic linkage with other company software. The most recent computerizedmaintenance systems are integrated electronically (they are in the same data-base) with stores, purchasing, invoicing, company costing, payroll and also canhave electronic links to project management and condition monitoring software.This is discussed in more detail in Chapter 10.
Exercise
E9.1 Study your own MIS to see if you can identify each of the elements andsub-elements of Figure 9.1.
9.3 Plant inventory (Module 1)
The inventory can be regarded as ‘the center of the documentation universe’. It is a listof the most basic information about every unit in the plant (e.g. see Table 9.1). Eachunit is uniquely identified by a short description and a numeric or alpha-numeric codewhich flags up the main way into the system to obtain information on that unit. Theinventory is complemented by a drawing reference (014C53) in order to locate thephysical location of the unit. It should be noted that the unit number (03/F/002) is usedfor on-site identification of the unit as well as for documentation purposes – wherethere are a number of identical units it is essential for safety/planning reasons that thereis a means of uniquely identifying each unit. It is essential that the site identification ofunits and other equipment is maintained. This includes the color coding of pipework toindicate the substance that is being conveyed.
A typical coding system was outlined in Figure 8.9 and an example is shown inTable 9.2. At unit level it is advantageous for the coding to indicate whether the unitmechanical (numbered, say, in the range 001 to 499), electrical (500 to 600) or instrument(700 to 999) and within each of these divisions the more straightforward numbering isprobably in the order in which the units occur along the route of the process.
Maintenance Systems and Documentation170

There are many variations of this simple unit coding procedure. For example theAmmonia Plant of the Case study 1 (see Chapter 11) used an alpha-numeric codeat unit level, e.g. C06. The C representing compressors. There are a number of‘standard coding’ systems that have been developed for process plant. Perhapsthe best known and most widely used is the KKS system developed for thepower industry but now used more generally for process plant.
As in the example of Figure 8.9 and Table 9.2, an assembly number may be added foraccessing data from the information base or for history recording. Where a rotableresides in this location there are two codes involved viz.
1. 03/F/002/03 is a location code (sometimes called the functional location). The sys-tem has to be told what rotable is installed.
2. G/XX/X/23 is the rotable unique identifier – see Table 9.3 (sometimes called thebirth certificate number). Manufacturers information/spares, etc. is held against thegearbox make and type while the history is held against the full number. This num-ber also allows the tracking of the rotables around the rotable loop (see Figure 8.8).(In some industries the unit itself can be a rotable and needs a corresponding birthcertificate number.)
Regarding coding systems in general, Idhammer [1] gives the following advice forensuring system flexibility:
(a) Keep the plant inventory code separate from the spare part code. The formershould facilitate access to the information base at the point where the coding of therelevant spares is listed.
(b) Keep the drawing code separate from the plant inventory code (but inter-connected as in (a)).
Maintenance documentation systems: what they are and how they work 171
Location Manufacturer,
Plant inventory no. Unit description drawing type and year Cost
03/F/002 Water discharge 014C53 Smith Mark, £10,000system IIB, 1986
Table 9.1 Extract from a plant inventory
Plant serial no. Plant stream letter Unit serial no. Assembly serial no.
03 F 002 03
Table 9.2 A coding system
Type Size Serial no.
Gear box (G) XX XX XXX
Electric motor (EM) XX XX XXX
Table 9.3 A coding system for rotables
(c) Keep the cost code separate from the plant inventory code. All jobs require a costcoding, but only site jobs need a plant coding for maintenance cost control.
(d) If there are several sites, do not over co-ordinate the coding system.
Review Questions
R9.1 Explain what you understand by a ‘rotable tracking system’.R9.2 With reference to Figure 8.9 explain the difference between a functional
location number and a rotable birth certificate number.
Exercise
E9.2 Identify the plant inventory coding systems for your own company. Theseshould include the functional location code and the rotable code.
9.4 Information base (Element 2)
For the efficient planning of work it is essential that maintenance-related information isheld for each of the units in the inventory, the most important of this being:
● essential technical data,● spares list,● drawing records,● maintenance instruction manuals,● catalog of standard preventive and corrective jobs,● life plan,● operating instructions and safety information,● rotable tracking.
The maintenance information base can be regarded as the sum total of all such data cat-egorized by unit number.
Technical data: An expansion of the basic information in the plant inventory, seeTable 9.4. It is usually divided into electrical, mechanical and instrumentation files. Itholds essential information needed by the planner, e.g. outside service engineers, man-ufacturers details, guarantee period, specification details.
Spare parts list (SPL):* A list, for each unit, of all spares held in stores, the stores cod-ings being listed against the units/items plant inventory number and/or against theitems birth certificate number (see Table 9.5). Some systems add to this the spares avail-able from the manufacturer and call the full list the bill of materials (BOM).* Other infor-mation, useful in an emergency, could also be included such as the location, on otherunits, of identical or similar parts.
Rotable inventory: A categorized list of rotables (see also Chapter 8.4.2). This can beaccessed continually through the plant inventory or directly using the rotable description/
Maintenance Systems and Documentation172
*Definitions vary – this is my terminology.

birth certificate number. This sub-module also holds the rotable history and when com-puterized allows the tracking of the rotable around the reconditioning loop.
Drawing records: The drawing records should include the users and manufacturersdrawings suitably filed with an index against the unit number (see Table 9.6). Drawingscan be held in drop-leaf files, on micro-fiche or more recently via computer documentimaging. The drawing records are often an engineering responsibility. Nevertheless theimportant point here is that there should be a system for updating drawings and formaintaining the filing system and the index.
Manufacturers manuals library: Same comments as for drawing records but with aneven greater emphasis for the need for a properly maintained master library and a sys-tem for updating workshop based sub-libraries or manual storage.
Life plans, job catalog and operating procedures: Life plans for units of plant werediscussed in outline in Chapter 1.
Maintenance documentation systems: what they are and how they work 173
Manufacturer Description Date purchased
Type Specification no. Size Model
Capacity Speed Weight Connection details
Foundation details Service Engineer contact details
Dimensions Interchangeable with
Table 9.4 Technical data records
Plant Own
inventory drawing Drawing Manufacturer’s Date
no. no. description drawing no. prepared Date revised
Unit 03/F/002 0363943 Assembly 2941/1973/350 73.01.06drawing
3373735 Pulley 2951/1973/387 73.04.06drawing
Table 9.6 Extract from an index of drawings
Plant inventory
locator Description Location Rotable identification no.
03/F/002/05 Water pump Wood handling P/46/02/25
Part name Quantity Price (£) Stores code Stores location
Pump assembly 2 300 123456 Shelf 1 (main)Pump housing 1 25 123457 Shelf 2 (main)Bearing 1 1 123452 Shelf 25 (main)
Table 9.5 Extract from a spares list
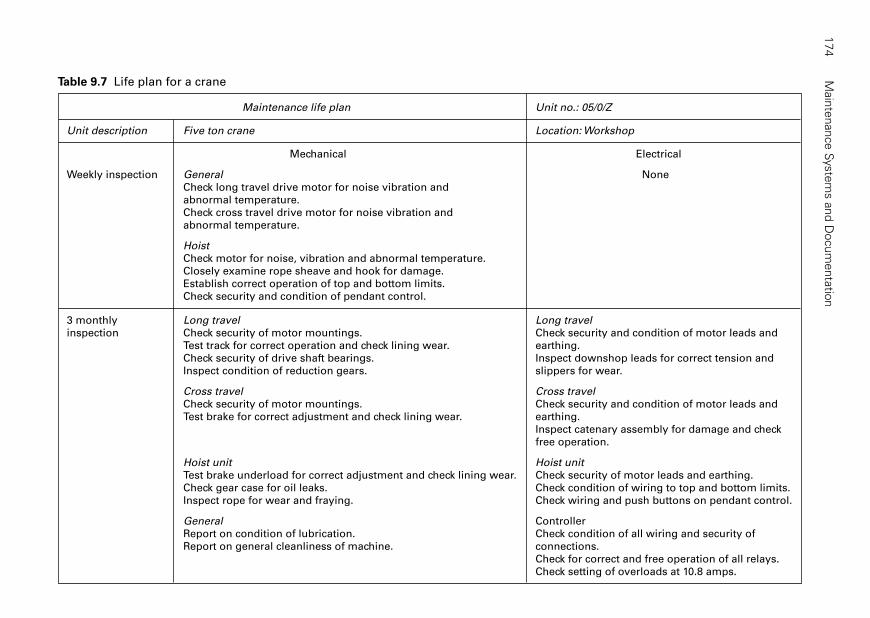
Main
tenance S
yste
ms a
nd D
ocum
enta
tion
174
Maintenance life plan Unit no.: 05/0/Z
Unit description Five ton crane Location: Workshop
Mechanical Electrical
Weekly inspection General NoneCheck long travel drive motor for noise vibration and abnormal temperature.Check cross travel drive motor for noise vibration and abnormal temperature.
HoistCheck motor for noise, vibration and abnormal temperature.Closely examine rope sheave and hook for damage.Establish correct operation of top and bottom limits.Check security and condition of pendant control.
3 monthly Long travel Long travelinspection Check security of motor mountings. Check security and condition of motor leads and
Test track for correct operation and check lining wear. earthing.Check security of drive shaft bearings. Inspect downshop leads for correct tension and Inspect condition of reduction gears. slippers for wear.
Cross travel Cross travelCheck security of motor mountings. Check security and condition of motor leads and Test brake for correct adjustment and check lining wear. earthing.
Inspect catenary assembly for damage and check free operation.
Hoist unit Hoist unitTest brake underload for correct adjustment and check lining wear. Check security of motor leads and earthing.Check gear case for oil leaks. Check condition of wiring to top and bottom limits.Inspect rope for wear and fraying. Check wiring and push buttons on pendant control.
General ControllerReport on condition of lubrication. Check condition of all wiring and security of Report on general cleanliness of machine. connections.
Check for correct and free operation of all relays.Check setting of overloads at 10.8 amps.
Table 9.7 Life plan for a crane

A simple inspection based life plan for a crane is shown in Table 9.7. This subsystemholds the list of life plans and is linked to the job catalog.
The job catalog lists the preventive and standard corrective jobs for each unit ofequipment. Each of the jobs listed are written up in the form of a specification (e.g. seeFigure 9.2) which specifies one of the preventive jobs from the crane life plan. Each ofthe tasks listed in the specification could, if necessary, refer via a code number to thekind of detailed task shown in Figure 9.3.
Although not shown, it is usual for such job specifications to contain estimates ofduration and manpower and a list of spares needed for job completion – such a listsometimes referred to as the application parts list (APL). For the larger jobs these areoften held as ‘kits of parts’ in the stores. It should be noted that whereas SPL’s areimportant in the process industry, APL’s are equally important where fleets of vehiclesare used. In addition, these descriptions often indicate the plant status required if theyare to be carried out (e.g. major overhaul, weekend shutdown, or online) and otherjobs that could be carried out at the same time (opportunity scheduling). In the case ofmajor shutdowns the catalog may include job descriptions linked to bar-charts.
Recurring corrective jobs (sometimes called standard jobs) are specified in a similarway and entered into the catalog against the relevant units. Because they do not havea frequency of execution their specifications are called up via the unit number whenthe need for the work arises.
Maintenance documentation systems: what they are and how they work 175
Job specification
Plant description
Five ton crane
Location
Workshop
Spares required
Special tools
Long travel1. Check security of motor mountings.
2. Test brake for correct operation and check lining wear.
3. Check security of drive shaft bearings.
4. Inspect condition of reduction gears.
Cross travel5. Check security of motor mountings.
6. Test brake for correct adjustment and check lining wear.
Etc.
Unit no. 05/012
Maintenance
code11
Job code Mech/3 monthly
(M3)
8 24 37 1
Drawings and
manual refs.
Week
nos.
Figure 9.2 Job specification
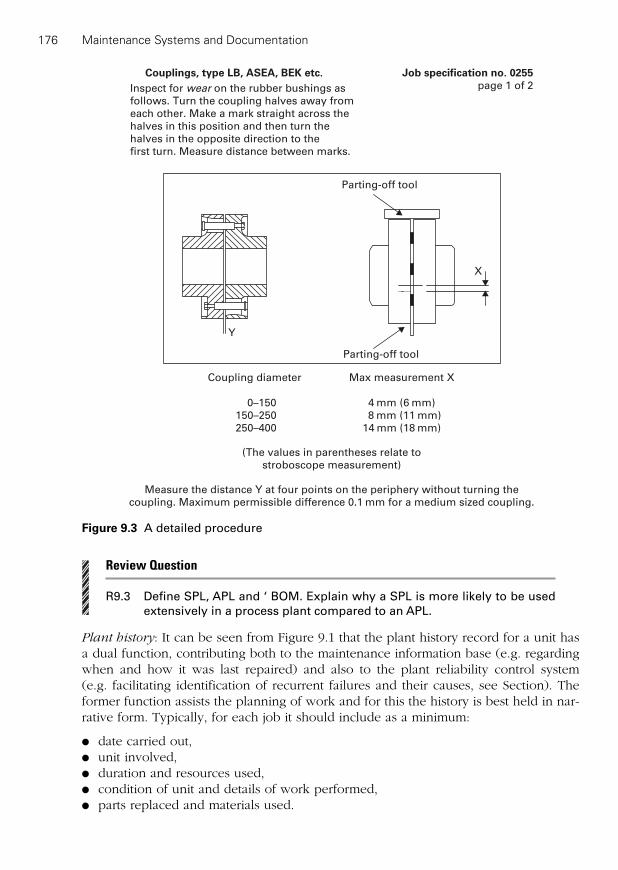
Review Question
R9.3 Define SPL, APL and ‘ BOM. Explain why a SPL is more likely to be usedextensively in a process plant compared to an APL.
Plant history: It can be seen from Figure 9.1 that the plant history record for a unit hasa dual function, contributing both to the maintenance information base (e.g. regardingwhen and how it was last repaired) and also to the plant reliability control system (e.g. facilitating identification of recurrent failures and their causes, see Section). Theformer function assists the planning of work and for this the history is best held in nar-rative form. Typically, for each job it should include as a minimum:
● date carried out,● unit involved,● duration and resources used,● condition of unit and details of work performed,● parts replaced and materials used.
Maintenance Systems and Documentation176
Y
X
Parting-off tool
Parting-off tool
Coupling diameter
0–150
150–250
250–400
Max measurement X
4 mm (6 mm)
8 mm (11 mm)
14 mm (18 mm)
(The values in parentheses relate to
stroboscope measurement)
Measure the distance Y at four points on the periphery without turning the
coupling. Maximum permissible difference 0.1 mm for a medium sized coupling.
Job specification no. 0255page 1 of 2
Couplings, type LB, ASEA, BEK etc.
Inspect for wear on the rubber bushings as
follows. Turn the coupling halves away from
each other. Make a mark straight across the
halves in this position and then turn the
halves in the opposite direction to the
first turn. Measure distance between marks.
Figure 9.3 A detailed procedure

Review Question
R9.4 The ‘plant history’ function is in the information base module (2) and themaintenance control module (7). How would you differentiate betweenthese functions? What sort of information do you need to collect for theinformation base function? What sort of information do you need to col-lect for the control function?
9.5 Preventive maintenance schedule (Module 3)
Maintenance scheduling was discussed in outline in Chapter 1.The preventive schedule is formulated from the recommendations of the unit life plans
and their job specifications (see Figure 9.4). The life plan for the crane shown in Table 9.7,e.g. is made up of four preventive jobs of different frequencies (see the 3-monthlymechanical service listed in Figure 9.2) and the schedule would program all such jobstaking into consideration plant and resource availability (see Figure 9.5 in which it canbe seen, e.g. that the 3-monthly preventive work for the Crane is scheduled for Week 8,Week 21 and so on). The life plan for the Crane can be read off the horizontal line. Theworkload for any work is the addition of the work involved in each of the jobs in thatweek (the addition of the vertical columns).
Maintenance documentation systems: what they are and how they work 177
Maintenance
life plan
for each unit.
Often a simple
inspection based
plan (what
maintenance
is to be done?)
Job specification
methods, spares, tools,
time, trades for each
procedure or job
or routine (how is
the maintenance
to be done?)
Preventive
maintenance
schedule
of all jobs and
routines in the plant
(when is the
maintenance
to be done?)
Output to
work planning
system
Plant inventory
of units
(what is to be
maintained?)
Input
Figure 9.4 Outline of a traditional preventive maintenance documentation system

This is an example of ‘calendar time scheduling’. A preventive maintenance scheduleshould also have the facility for scheduling on usage, e.g. elapsed hours, tonnage throughput, cycles of operation.
In the old paper-based documentation system, a schedule as in Figure 9.5, is usedmainly for organizing the job specifications into some form of card index, see Figure 9.6.Comprising of 52 slots, this can then be used directly for the triggering and control ofpreventive work, i.e. each week it feeds a tranche of job specifications into the workplanning system (each of which is accompanied by a work order on its way to the shopfloor). The index can be updated and re-scheduled as necessary on the return of the jobspecification cards. Resulting corrective work is noted on the completed work order andis entered into the work planning system. Simple systems of this kind operated satisfac-torily for small plants involved in the ‘calender time scheduling’ of routine preventivejobs i.e. services and inspections. They were much less successful for scheduling main-tenance work in the large continuously operating plants e.g. alumina refineries.
Such plant requires more sophisticated scheduling to include:
● The facility for scheduling on usage, e.g. elapsed hours, tonnage, throughput, cyclesof operation.
● The facility to integrate jobs from many units of plant into a single plant shutdown.● Opportunity scheduling, the facility to schedule preventive jobs and standard cor-
rective jobs into unscheduled windows.
Modern computerized systems have evolved from the ideas of the ‘card index’ but havethe power and flexibility (if properly designed) to carry out all of the requirements ofthe maintenance scheduling function (see Chapter 10.3 for a discussion on the advantagesof computerized work planning).
Maintenance Systems and Documentation178
Plant description
Week no.
Unit no.
Unit
description
5 ton crane
Mould con.
Shake out
Sand belt
Hopper
M. M/c
Weekly workload can be
added up vertically
Life plan can be
read horizontally
Malleable iron foundry
1 32 4 5 6 7 8 9 10
103
104
105
106
108
111
AM
1M1E
6E
3M1E
1E1M
1E
1M1E
3M3E
3E3M
1E1M
1E
job specificationno.
Figure 9.5 Preventive maintenance schedule for crane

Review Question
R9.5 Companies do not often keep a record of life plans at unit level. The workis integrated into computerized preventive maintenance schedules. Explainwhy you think it is important to keep a record of unit life plans.
9.6 Condition monitoring (Module 4)
A life plan for a unit may well include inspections that need to be carried out and hencescheduled, independently of the main maintenance jobs. They can include:
(a) condition checks and readings carried out by operators,(b) inspection routines undertaken by artisans,(c) condition monitoring routines carried out by technicians using specialist instru-
mentation.
Maintenance documentation systems: what they are and how they work 179
12
34
5
52
Figure 9.6 Card index
With the old paper-based systems inspection of the kind listed in (a) and (b) tended to becarried out on simple tick cards which might be sent to the responsible supervisor so thathe could ‘fit it in’ to the schedule. Such inspections were subjective and relied on theirefficiency on the experience and motivation of the trade-force/operators. Inspections ofthe kind listed in (c) tended to be scheduled by the technique involved, e.g. vibrationmonitoring. Inspection history was also stored/monitored separately by technique. Whencorrective work was triggered by the inspection a work order was raised and fed into thework planning system.
Minor inspections still tend to be carried out in the way indicated above. Howeverspecialist software has been available for many years to schedule conditionmonitoring routines, record, store and analyze the resulting data (see Case study 1,Chapter 11).
Review Questions
R9.6 Explain the function of each of the following: the inspection history of mod-ule (4), the plant history of module (7) and the rotable history of module (7).
R9.7 Explain why most companies (and software suppliers) keep the conditionmonitoring documentation module (4) separate from the main documen-tation system.
9.7 Short-term work planning (Module 5)
The principles of short-term work planning, scheduling and control were discussed inChapter 5, the work planning system being modeled in Figures 5.7 and 5.11. As has beenexplained, the work order, see Figures 5.8 and 9.7, can be regarded as the vital opera-tional vehicle for this system. The flow of this documentation – the main components of(and aids to) which are listed in Tables 9.8 and 9.9 – is shown in Figures 9.8(a) and (b).
Requests for emergency work are made verbally to area supervision who raise workorders. Requests for deferred corrective work and for modifications are made to theplanner on work request forms. A work order is raised directly or, if appropriate, by ref-erence to the job catalog. Priorities of such work are decided at a weekly planningmeeting and the various jobs entered into the corrective job list.
Preventive work is planned and scheduled as explained in the previous section. Eachweek, the preventive maintenance system enters a list of jobs into the work planningsystem where they are considered for the weekly program alongside the corrective andmodification work. Work orders are raised (by reference to the job catalog) and workthat is not to be carried out is rescheduled using the planning board and job list.
The complete weekly program for each area or each plant is formulated in terms ofresources, plant availability, and the opportunities known to be arising. This, along withthe relevant work orders and any other necessary information (such as manual anddrawing references, job specification codes, spares requirements) is then sent to thearea supervisor who uses a short-term planning board or a simple allocation board toschedule and allocate the planned and the emergency jobs that come to him direct.Work orders are raised in triplicate, one copy remaining in the planning office, one with
Maintenance Systems and Documentation180

Maintenance documentation systems: what they are and how they work 181
Work order A written instruction detailing work to be carried out. Theinformation this might carry is summarized in Table 9.9. When usedto its fullest extent it can act as a work request, a planningdocument, a work allocation document, a history record (if filed)and as a notification of modification work completed. A typical workorder (raised in triplicate in hard paper system and in this case notacting as a work request) is shown in Figure 9.7.
Work request A document requesting work to be carried out. It usually carriessuch information as person requesting, plant number, plantdescription, work description, defect, priority, date requested.
Job catalog A file of job specifications (preventive and corrective) as previouslydescribed.
Planning board For preventive work, a scheduling chart as already described. Forcorrective work, a work order loading board covering a horizon ofup to 12 weeks, in units of a week and having pockets to allow thework orders to be scheduled into the appropriate week.
Allocation board A short-term planning showing men available on each day of 1 week. Allows jobs to be allocated to men.
Other Safety permit, stores and tool note, weekly work program, storesrequisition, top-ten report, cost report, history record.
Table 9.8 Work planning documentation
Planning information
Unit number, unit description and sitePerson requesting jobJob description and estimated timeJob specification and code numberDate required and priorityTrades required and co-ordinating foremanSpares required with stores number and locationSpecial tools and lifting tackle required Usually carried on
Safety procedure number job specification
Drawing and manual numbers
Control information
Cost code for work type and tradeDowntimeActual time takenCause and consequence of failureAction taken
Table 9.9 Information carried on a work order
�
the supervisor and one sent as the order to the artisans. As the work order is returnedthrough the system the copies can be filed or destroyed. An important point is that for
effective cost control the execution of all work should be covered by a work order and a
copy of all completed orders should return to the planning office.
Maintenance Systems and Documentation182
Plant description
Plant number
Maintenance
cost code
Coordinating
supervisor and
extension
Plant location
Job specification
number
Requested by
and extension
Job/defect description
Priority
Action taken
(parts replaced)
Cause
Downtime
(if any)
Foreman’s signature and comments
Date
issued
Date
required
Job Time Date
Started
Finished
Multi-trades involved
Transport
arranged
Permits
requested
Work
programme
Workallocated to ..........
Toolsrequested
Noteissued
Available
Checkinitiated
Stores
Action by scheduler
Check list no.
Transport
Special tools
Stores check
Work order number
Permits
P.T.W. S.F.T. L.O.A. S.F.S.
M L.V. H.V. None
Place of issue
Support and services
M R C L E HP W
Figure 9.7 A typical work order
Exercise
E9.3 Use Figures 9.8(a) and (b) to map the work request/order (or whateverthese documents are called) flow for your own work planning system. Howdoes this tie up with the work planning model you drew in Exercise E5.1.
9.8 Long-term work planning (Module 6)
Turnaround planning was discussed in Chapters 6 and 7. This deals with the jobs (mod-ification work, preventive work and those corrective tasks that can be held over) thatneed the plant to be offline for an extended period.
Thus, if the shutdown was to be undertaken under a paper-based documentationregime a simple file to identify and note all such jobs would be needed, which could becategorized according to the units, they were to be carried out on. Shutdown work tendsto be different from ongoing maintenance in that the overhaul of even a small unit mightconsist of hundreds of interrelated jobs. A wall-mounted bar-chart could be used for the
Main
tenance d
ocum
enta
tion s
yste
ms: w
hat th
ey a
re a
nd h
ow
they w
ork
183
Raise safety permit.
Job origination Planning Scheduling Scheduling Planning Production Supervisor Stores Trade-force
Request to planning
office or supervisor.
Add plant description,
location, request or
date, priority and
defect description.
Complete work.Check priority.
Check if job is
in the standard
job catalog. Raise
WO Add Job no.,
unit no., cost codes,
job specifications.
Check spares, update
catalog as
necessary.
Add WO to job list.
Update list and
preventive
schedule according
to planning meetings.
Create weekly
programme of
planned jobs.
If possible, arrange
by committed jobs
and flexible jobs.
Check and
bond spares and
tools. Raise
safety request.
Check and supply
manuals and
documentation.
Add this
information on WO
Raise emergency WO
and perform all
planning checks.
Allocate WO's to men.
Bond and issue
spare parts.
Compile requisition.
Corrective
(Telephone, or
job request,
or via inspection
card)
Preventive
work
Weekly
programme
of planned
maintenance jobs
(2 copies)
Weekly
package
of work
orders
Corrective and
modification job
list. By supervisor,
priority and if
possible, by date
Raise
WO
Maintenance
standard job
catalog
Preventive
maintenance
schedule
(yearly planning
board)
Raise
WO
Weekly
package
of work
orders
Work
order
Raise
work
order
Permit to
work
Weekly
package
of work
orders
Weekly
programme of
planned
maintenance
jobs
(Supervisor copy)
Modification
work
(Job request)
Request for tool
and spares check
Short – term
routines (held at
supervision level)
Note for
safety permit
check
Safety and
availability
check. Add
necessary
information
to note
Deferred corrective
jobs
Emergency corrective jobs
Tools and
parts
requisition
Hold spares
and tools
in bond
Check spares
and tools
note
Allocation
board
Other documentation or
information flow
Work order (WO) flow
Figure 9.8(a) Maintenance work planning system (work order flow from origination to trade-force)
Main
tenance S
yste
ms a
nd D
ocum
enta
tion
184
Adds cause
of failure,
time taken,
action taken,
downtime.
Completes stores
requisition for
parts usage.
Stores requisition to
stores control and
cost control.
Checks work satisfactory.
Issues new request
for work arising.
Updates allocation board.
Completes WO and returns
to planning office.
Cancels safety permits.
Considers causes of
failure.
Updates job list and
preventive maintenance
schedule.
Analyses job times,
overtime and downtime.
Identifies top ten
of resource costs or
downtime cost.
Updates record history.
Establishes cause
of failure.
Investigates job
methods.
Prescribes
solutions.
Trade-force Stores Supervisor Work scheduling Work analysis Engineer Costing
WO WO WO WOWO
Allocation
board
(update)
Corrective and
modification
job list (update)
Preventive
maintenance
schedule (update)
Cost report Cost report Cost record
Top tens Top tens
Requisition to stores
and cost control
Return parts unused
and parts for scrap
and reconditioning
Return tools File WO copy
Update
File WO
* Change maintenance
life plans schedule
* Design out maintenance
* Change operating method
History record
Figure 9.8(b) Maintenance work control system (work order flow from trade-force to completion)
scheduling of a small overhaul. In a large plant where there are many such interrelatedoverhauls the scheduling would need to be undertaken via a computerized critical pathanalysis. The execution and control of the shutdown, however, should still exploit thework order system so that day-to-day cost control and history recording may be sustained.
9.9 Maintenance control (Module 7)
This topic was discussed in terms of its principles of operation in Chapter 4. Much infor-mation transfer, storage and analysis is needed to facilitate the various maintenancecontrol systems that were outlined. It will be instructive to identify the information thatis critical for each of the main control systems.
Maintenance cost and availability control: The function and operation of this systemwas explained in Chapter 4. Put simply, it depends for its effectiveness on a true historybeing accumulated of maintenance costs and plant availabilities (and other parametersof maintenance output) for each unit of plant. The main documents used to collect thisinformation are:
● work orders or time cards (which provide data on the manhours spent on each unit),● stores requisitions and material purchase documents (for data on the parts and materi-
als used on each unit),● downtime record cards (for data on downtime, availability and output for each unit).
The information can be held in a costing record for each unit and can facilitate the pro-duction of reports on, e.g. total maintenance cost and achieved availability per productionperiod per unit. Such data can then be built up to enable figures on total maintenancecost to be set against figures on total output, per production line or per plant.
Additional reports can be generated by dividing the total costs into preventive, cor-rective, mechanical, electrical, instrumentation, manpower, material and so on, figureswhich can be compared with target values or ranked to highlight problem areas.
Plant reliability control: The key document here is the unit history. As well as providinginformation base function, see Figure 9.1 and Section 9.4, it also has a maintenance con-trol function, i.e. it facilitates the identification of problem units and the diagnosis of thecauses of failures. The history record for each unit should therefore contain, as a minimum,the following information:
● Failure date and/or hours operated to failure.● Duration of failure.● Production/quality losses.● Item/component affected.● Probable cause of failure.
This can be provided via completed work orders, shift reports, defect reports or downtimerecords. Even with information as limited as this the reliability control system could gen-erate lists of items ranked according to, say, mean time to failure, mean time to repair, orrepair hours. For the more troublesome items thus identified, information on item defectsand probable causes could then be interrogated to assist the prescription of correctiveaction.
Maintenance documentation systems: what they are and how they work 185

The simplest form of history record is shown in Figure 9.9 and would operate withthe type of system that was modeled in Figure 9.8.
Maintenance Systems and Documentation186
Date Item Defect Cause Action Downtime
Plant description
Rhodes press
Plant no.
02.003
4.10.840536
Coolant systemFlexible pipe
Rubbing on
casting
Pipe rep.
Bracket required2 Hours
History record mechanical
Figure 9.9 Extract from history record
Organizational efficiency: Reports generated to record the following indices:
● Trade-force performance.● Trade-force utilization.● Intertrade flexibility index.● Absenteeism.● Overtime.● Trade-force turnover.● Trades to non-trades index.● Contractors to internal labor index.● Spans of management.● Levels of management.● Ratio of staff to shop floor.● Ratio of first level management to shop floor.● Ratio of professional engineers to trade-force.● Training cost per artisans.● Job delay ratio.
Short-term work planning: Reports generated to record the following indices:
● Ratio of planned to unplanned work.● Percentage of planned work deferred each week.● Total outstanding workload in man days.
● Outstanding workload by priority in man days.● Percentage of preventive routines completed per period.● Rework as a percentage of all work.
Shutdown planning: Reports generated to record the following indices:
● Percentage of planned work actually completed.● Actual cost as a percentage of budget.● Ratios of actual shutdown time to planned duration.
Stores and rotables: Reports generated to record the indices outlined in Table 8.4.
Review Question
R9.8 The maintenance control module relies mainly on data collection duringthe work execution/reporting phase. The authors auditing experience indi-cates that in spite of sophisticated and expensive systems maintenancecontrol is not carried out well. Explain why you think this is so.
9.10 Summary
The main aim of this chapter has been to develop a general functional model of themaintenance documentation system, to enable the reader to better understand his owndocumentation system.
The functional model, see Figure 9.1 has been used by the author in the following ways:
● As part of his technique for auditing a company’s maintenance documentation system.● As the basic model upon which to structure a company’s user specification if it
wishes to update its computerized documentation system.● To guide the construction of a questionnaire for evaluating maintenance documen-
tation software.
Exercises
E9.4(a) Use the functional model of Figure 9.1 and the information of Section9.3, 9.4 and Case study 1 in order to audit the maintenance informationbase of your own company. Select a typical unit of plant and check thefollowing:● The functional location code.● Rotables used and their code.● Manuals and drawings.● The life plan and standard jobs and APLs.● The operating procedure.● Parts list.● Unit plant history, cost history and essential spares usage history.
Maintenance documentation systems: what they are and how they work 187
(b) Ask the personnel listed below to obtain a drawing, spare part, history record(for a period designated by you) for a particular unit. In each case time howlong this takes:● A planner.● A supervisor.● A tradesperson.
Reference
1. Idhammer, C., ‘Maintenance Course Notes for Developing Countries’, M. GruppenFack 1213, Lidingo, Sweden (c. 1980).
Maintenance Systems and Documentation188
Review Questions Guidelines
R9.1 The birth certificate number of a rotable is used to track where the rotable is inthe rotable loop at any time (see Figure 8.8).
R9.2 A functional location number can be regarded a plant location (or pigeon hole)where a rotable resides. It is necessary to tell the system what rotable is residingin the functional location. The birth certificate number is the unique identificationnumber for the rotable. Maintenance information is stored against this number.
R9.3 A SPL is a list of parts held in stores against a plant unit. An APL is a list of partsfor a particular job (sometimes held in stores as a kit). A BOM is a list of partsheld by the manufacturer for a unit of plant. Every unit needs a SPL. It is likelyonly the larger or more frequent jobs will have an APL.
R9.4 The information base history is collected to provide information on ‘what wasdone last time’ (repairs, replacement, symptoms, etc.) before carrying out thenext job (see Section 9.4 for typical information). The ‘control history’ is col-lected to identify recurring problems and to provide information on root causes(see Section 9.9 for typical information).
R9.5 The life plan for a unit is a complete record of the work you have deemed nec-essary over its life to control its reliability. If the unit causes reliability problemsthe life plan should be reviewed. The life plan is much easier to review when thejobs that are being carried out on a unit are written up against that unit.
R9.6 The condition monitoring history (4) is used to decide when to carry mainte-nance out on a particular item. The plant history of module (7) provides therecords of major preventive and corrective work carried out on the unit. Therotable history provides the record of repair and reconditioning of the rotable.
R9.7 The function of the condition monitoring documentation is different and separatefrom the main maintenance documentation function. In addition condition mon-itoring technology and software has developed at a different rate than the maindocumentation system. In general the condition monitoring software is sold as aseparate package and where necessary interfaced with the main system.
R9.8 The main reason is associated with poor quality of data collection at the artisan–supervisor–computer interface (see Table 4.1).

Computerized maintenance informationsystems: their uses and problems10
‘The newest computer can merely compound, at speed, the oldest problems.’
Edward Murrow
Chapter aims and outcomes
The benefits to be derived from the use of computerized maintenance documentationsystems will be reviewed, as will the problems that may be encountered in their use.
On completion of this chapter you should be able to:
● understand how computerized maintenance documentation systems have evolvedover the last 30 years;
● appreciate the benefits that ‘state of art’ computerized maintenance documentationsystems can bring to the maintenance department;
● appreciate the problems that have to be overcome in order to use computerizedmaintenance documentation systems effectively.
Chapter route map
Book divisions
Introductory chapters
Budgeting and control
Work planning andwork control
Spare partsmanagement
Documentation
Case studies
This chapter in the division
Chapter 9Maintenancedocumentation systems: what they are and how they work
Chapter 10Computerizedmaintenanceinformation systems:their uses and problems
Chapter topics
10.1 Introduction
10.2 Computerized documentation: historical background
10.3 The benefits of computerized maintenance information systems
10.4 The problems with computerized maintenance information systems
10.5 Summary

10.1 Introduction
Figure 9.1 described the functionality of maintenance documentation systems. Theauthor developed this model over a number of years as a result of investigating numer-ous documentation systems, of both the earlier, manually operated, ‘hard-paper (HP)’type and the later, computer-based, variety. Although some small companies still useHP systems the vast majority have now used computer-based systems for many years.Nevertheless, the generic functionality model of Figure 9.1 describes adequately theoverall (top level) architecture of computerized maintenance documentation systems.
10.2 Computerized documentation: historical background
Computer-operated systems* began to be used in the 1970s [1]. The early ones wereBatch-operated on large centralized mainframe machines that were used companywide. The batch operation (perhaps only at weekends in the case of maintenance) lim-ited the use of the computer for maintenance documentation to the more straight-forward tasks, such as the scheduling of preventive maintenance.
The first online computerized maintenance systems made an appearance in the late1970s. Initially these also used main frames in conjunction with an operating systemthat allowed for the application software (e.g. for maintenance documentation, storescontrol, etc.) to be operated in parallel – i.e. time sharing. Such multi-user systems, i.e.with numerous terminals connected to the mainframe, would dedicate several of theseterminals for maintenance use. The early operating systems, however, were such thatuse of these machines was slow and inflexible.
The next (probably concurrent) advance was the use of dedicated computers (at thistime they were called mini-computers) to run the maintenance application software.Such machines had multi-terminal access but, by modern standards, RAM (0.5MB) andhard disk storage were severely limited. For this reason, for large systems the mini-computer was linked online to the company mainframe (distributed processing).
Maintenance Systems and Documentation190
Key words
● Computerized maintenance information systems● User requirement● Application software● Integrated systems● Best of breed
*A basic knowledge of computer systems has been assumed when writing this section. However,those who wish to update their basic computer knowledge should refer to reference [1].

The mini-computer operated the work planning function and the mainframe usedstate-of-the-art databases for maintenance history, spares lists, etc., i.e. for those docu-mentation functions that required storage of large quantities of information.
Throughout the 1980s and into the 1990s there were considerable advances in thepower of hardware, to the point that the PC came to have the processing power and harddisk storage of the mainframe of a decade earlier. In addition software and other tech-nology improvement allowed for local networking (client-server arrangements) and widearea networking of PCs. Application software had become more portable due to thegreater standardization of operating systems. In spite of these advances, up until the mid-1990s most maintenance documentation systems remained ‘stand-alone’, with at most anelectronic linkage between the maintenance and stores software. During this period therewere many maintenance documentation packages on the market, for all sizes of companyand for use on systems varying from the single PC to the multi-user network.
One of the main consultancy tasks the author was involved in during this periodwas helping companies to establish their maintenance user requirement andthen to help them select the best package to match that requirement and theirexisting hardware [2].
Computerized maintenance information systems: their uses and problems 191
DrawingsMail
Files
Manuals and catalogues
Scanner
Fileserver
NetworkMobile link
Wide area
link with
satellite dish
Figure 10.1 A document management system
Over the last 10 years the processing power and storage capacity of hardware hascontinued to increase and its cost to decrease. A typical modern hardware configura-tion – which includes the use of mobile computers (via digital telephony), Internet con-nection and e-mail facilities – is shown in Figure 10.1. In addition, softwareimprovements and the development of scanners have facilitated the storage and trans-mission of drawings and pictures, etc. (document imaging). However, the most impor-tant introduction over this period has been that of electronic inter-connection of thecompany software functions (production control, stores control, maintenance control,

etc.) into a company wide system (CWS) (see Figure 10.2). This electronic linking wasachieved in the early CWSs through the introduction of interfacing software. This wasexpensive where the existing software was on a mainframe. In addition, movement ofdata across the interfaces could be slow.
Maintenance Systems and Documentation192
Bar coding tools
Cash disbursements
in-house
Graphics
Payroll
Time and attendance
Maintenance
StoresInvoicing
Purchasing
Integrated package
Interface links
Integrated data
Imaging
Bar coding tools
General ledger
MSA
McCormick – Dodge, etc.
Project management
Project 2
Primavera,
Artemis, etc.
Corp. materials
ASI,
MSA, etc
Figure 10.2 Part integrated, part interfaced company-wide software
In the mid-1990s a number of packages came onto the market with maintenance con-trol, stores control, purchasing and invoicing on the same relational database, i.e. thesefunctions were integrated. Such packages were then interfaced as necessary with othercompany functions (see Figure 10.2).
At about the same time, fully integrated CWSs also became available (see Figure 10.3).These provided many advantages, e.g. fast, seamless exchange of information betweenthe different company functions. This was particularly important for the financial opera-tion of a company and the strength of most of these integrated CWSs was in the finan-cial software. However, some of the other company functions, including maintenancecontrol, were often poor. Thus, one of the management questions of the time was:
Should we buy a fully integrated CWS or should we go for ‘best of breed’ and
interface?
More recently the fully integrated CWSs have become more flexible and will allowlinkages to other software.
With the most recent systems an effort has also been made to improve the interfacebetween the user and the machine. For example, the traditional menu and keyboardinput has largely been replaced (or partly replaced) by graphical user interfaces (GUIs)*(e.g. in PC Windows format). There are also many examples of bar code readers for storesmanagement and pen computers.
*A basic knowledge of computer systems has been assumed when writing this section. However,those who wish to update their basic computer knowledge should refer to reference [1].

The authors consultancy problem in this area has changed and is no longer involvedin selecting the best maintenance package. It is now involved in ensuring (as faras possible) that the CWS chosen by the company senior and financial manage-ment will satisfy the maintenance management user requirement.
Review Question
R10.1 Briefly describe the two main computer technology advances (in hard-ware and software) that have enabled company-wide software systemsto be used.
Exercises
E10.1 Use Figure 10.1 as a guide to draw a schematic model of the hardwaresystem in your own company.
E10.2 Use Figure 9.1 as a means of identifying the main modules of the main-tenance package in your own company and then identify the electroniclinkages (integrated or interfaced) with other company software.
10.3 The benefits of computerized maintenance informationsystems
Chapter 10.2 has explained how a typical state-of-art computerized information sys-tem for an industrial company is made up of a hardware configuration (as shown in
Computerized maintenance information systems: their uses and problems 193
Maintenance
Report
writerHuman
resources
Drawing and
document
imaging
Performance
engineering
Procurement
Project
management
Note: All functions on the same
relational dates base as maintenance
Operations
Materials
management
Financial
management
Figure 10.3 An integrated information system

Figure 10.1) operating company-wide integrated software. The maintenance documen-tation software can be considered as one of a number of functional application pack-ages hung-off the financial package (the General Ledger) (see Figure 10.3). Themaintenance software can be considered as a number of structured and coded files(information base, history, etc.) held as a part of a common company relational data-base, and a series of programs (covering work planning, history analysis, etc.) thatmanipulates the data files in order to carry out the functions shown in the generic func-tional model of Figure 9.1.
The use of computerized maintenance information systems no longer has to be justi-fied, any more than having to justify using a telephone system. It is almost inconceiv-able that a company information system would operate in any other way.
Some of the main benefits that have resulted from the computerization of mainte-nance documentation are:
● Systems of the kind outlined in Figures 10.1 and 10.3 allow all levels of maintenancepersonnel, from manager to artisans, to have quick access to the maintenance infor-mation (drawings, life plans, history, etc.) that is essential for cost-effective decision-making and job execution.
● The integration of the company information software within a common databaseallows information to be electronically communicated and shared company-wide,e.g. maintenance spare parts lists and rotable tracking are linked to the stores sys-tem; maintenance costs flow automatically from the maintenance department to thefinancial system.
● Communication within and between companies has been enhanced via e-mails.Access to the Internet has provided major advances in accessing the databases ofequipment manufacturers. It has also provided opportunities for (a) setting upalliances for the holding of strategic spare parts and (b) ‘spares-finder’ access toInternet companies specializing in spares management.
● The use of PCs as part of the network has allowed maintenance personnel a widerange of generic analysis and planning tools, e.g. spread sheets.
● Computerized maintenance systems are excellent at storing, interrogating and retrievinginformation from the maintenance information base (see Figure 9.1). The main way intothe maintenance information system has been via the plant inventory, Module 1. Thistraditionally requires the unit description or code to be known. In the most recent sys-tems utilizing document imaging software (DIS) the inventory data can be held in theform of a coded process flow diagram which can be put on screen and used to tracedownwards to identify the plant unit and then the component parts. The plant draw-ings, manuals and other information base data can also be held in the DIS and can bebrought onto the screen. It must be emphasized, however, that DIS is expensive.
● The short-term work planning system (see Figures 9.1 and 5.7) has become muchmore dynamic and flexible and in many cases paperless. Computerized work plan-ning systems give visibility of outstanding/completed work across the completeorganization. They facilitate the cascading and balancing of the workloads of largecomplex organizations (see Figures 5.9 and 5.10) and provide the possibility ofscheduling work flexibly over time horizons of from hours to weeks. They enabletrade teams and artisans to do much of their own planning. They reduce the cost of
Maintenance Systems and Documentation194

administrating the operation of a work planning system. They are sufficiently flexi-ble to facilitate the operation of opportunity scheduling or of a strategy driven bycondition based maintenance. The most recent software facilitates linkage betweenproduction scheduling and maintenance scheduling, i.e. via the computer, mainte-nance work can be scheduled into the production windows indicated in the pro-duction schedule (supply chain planning). Computerized work control systems (seeFigures 5.7 and 5.9), in conjunction with work control indices, provide the necessarymeans of prioritizing and controlling the flow of work through the maintenancedepartments.
● The shutdown planning system can be electronically linked to the maintenanceinformation system (see Figures 9.1 and 5.11), which facilitates the planning andscheduling of the shutdown on the network planning software, and the execution ofthe work via the ongoing work-planning work-order system. This also enables theshutdown costs to be collected, monitored and controlled (via S curves).
● Perhaps the greatest benefit (or potential benefit) of all is the computerized mainte-nance information system’s ability to store, analyze and report on large quantities ofcontrol data (see Figure 9.1, Module 3). This includes the storing and analysis of historyon costs, plant behavior, spares usage and labor usage – providing a variety of KPIs,control reports (Pareto, or Top Ten, analysis), etc. Such reports can be on-request, auto-matic, by exception, etc.
10.4 The problems with computerized maintenance informationsystems
Some 5 years ago the author was provided with the information that one in every twomaintenance information systems was either scrapped within 2 years of its commis-sioning [2], or operated well below its designated capability. The main reasons given forthis were:
● Underestimation of the time and money necessary to up-rate the life plans, spareslists, documentation, etc. and to transfer existing data into the new system.
● Underestimation of the time and money needed to provide the initial and ongoingtraining of the maintenance personnel in the use of the system.
● Poor quality of the maintenance information collected (descriptions of work under-taken, parts replaced, cause of failure, symptoms, etc.). This resulted from:– poor training in the use of the system, resulting in a reluctance to input data;– poor training in understanding the need for data, e.g. to establish the root cause
of failure, etc.;– user-unfriendliness of the system, in spite of GUIs and improved software;– negative trade-force human factors.
While not wishing to be pessimistic, the author feels (as a result of his own auditingexperience over the last few years) that in spite of the advances in hardware and soft-ware these basic problems still persist. The ammonia plant case study of Chapter 11 isan example of a large company using a ‘state-of-the-art’ company-wide integrated CWS,
Computerized maintenance information systems: their uses and problems 195
but with all of these listed problems. The author has found this to be typical of compa-nies investigated. The following is a list of his main criticisms of the maintenance infor-mation systems of this company:
● The effort and cost of revising and improving life plans and the information base(spare parts lists, standard jobs, etc.) had been underestimated. Most of this infor-mation in the new systems was either poor or non-existent.
● The effort and cost of training the artisans in the use of the systems had been under-estimated. Training courses had been set up, but had not been well attended andhad not been followed through.
● The artisans regarded the new maintenance system (part of the recently installedcompany-wide integrated system) as inferior to the stand-alone maintenance systemit replaced (which it was, in terms of maintenance functionality).
● The artisans considered that the new system was user-unfriendly and for this, andthe reasons above, a resistance to the use of the new system had built up.
● It appeared that the main use of the new computerized maintenance system was tocollect costs for the financial department.
● The auditor’s over-riding impression was that the new company-wide informationsystem was acquired because it was strong on the financial side, giving company-wide coverage of cost usage and control. The maintenance department was expectedto go along with this decision. This, in conjunction with an incomplete and poorlyspecified user requirement for the maintenance information system resulted in a func-tional mismatch in a number of important areas, viz.:– The maintenance information base of the new CWS was not suitable for storing
and interrogating the life plans and history for its large plant (pressure vessels andlarge machines). It was only suitable for ancillary equipment. Separate databasesfor large plant were set up and interfaced with the CWS.
– The CWS maintenance software did not interface with the shutdown scheduler(Primavera) and did not produce S curves for financial control.
– The ongoing work planning system of the CWS was not sufficiently dynamic tomeet the company’s workload and priorities.
10.5 Summary
The author has been involved in computerized information systems since 1975. Manyof the problems raised in Chapter 10.4 were evident in those early years. In spite of theimprovement in hardware and software these problems are even more evident today.If company and maintenance management are going to realize the full potential ofinformation systems a lot more effort is going to be required to improve:
● the quantity and quality of data capture;● the user-friendliness of the man–machine interface;● the quality of systems training for artisans and operators.
In addition (and perhaps this is the most important point) it is essential that, before thepurchase of new or upgraded information systems software, maintenance managementshould establish a comprehensive and detailed ‘maintenance and information
Maintenance Systems and Documentation196

systems user requirement ’. They will then be able to compare this with the capabilitiesof what is on offer and negotiate the necessary changes.
Review Question
R10.2 List the main problems encountered by the users of maintenance infor-mation systems.
Exercise
E10.3 Carry out a survey, or an on-site investigation, in your own company toestablish:(a) the extent to which the trade-force regards the maintenance infor-
mation system as ‘user-friendly’;(b) whether there are problems in collecting and inputting maintenance
data (list them);(c) those modules of the maintenance information system that are used
most and those that are used least.
References
1. Bulger, P.M.J., Large-Scale Software Projects – World-Class Success or Failure?, BulgerAssociates, 2000.
2. Kelly, A., Maintenance and its Management, Conference Communication, 1991.
Computerized maintenance information systems: their uses and problems 197
Review Questions Guidelines
R10.1 Software that allowed the integration of different company functions on acommon relational database coupled with the networking of PCs.
R10.2 These are listed in Section 10.4.

This page intentionally left blank

PART 6
Case study

This page intentionally left blank

Case study: Maintenance audit of anagricultural chemical plant11
‘When problems mount so high that you cannot see anything else,
it pays to step back from your work so you can see the bigger picture.’
Anon
Chapter aims and outcomes
The main purpose of this case study is to show how the business-centered mainte-nance methodology can be used to audit the maintenance management systems of alarge complex chemical plant. The full audit is presented, including that of the strategyand organization as well as that of the systems, but its criticisms and recommenda-tions focus largely on the systems. The study is also used as a vehicle for review ques-tions relating to the preceding chapters.
Chapter route map
Book divisions
Introductory chapters
Budgeting and control
Work planning andwork control
Spare partsmanagement
Documentation
Case study
This chapter in the division
Chapter 11Case study: Maintenanceaudit of an agriculturalchemical plant
Chapter topics
11.1 Introduction
11.2 An overview of Fertec A
11.3 Objectives
11.4 Maintenance strategy
11.5 Maintenance organization
11.6 Work planning systems
11.7 Spare parts management
11.8 Maintenance control
11.9 Documentation

11.1 Introduction
This case study concerns a full audit of Fertec A a company manufacturing fertilizers forthe agricultural industry. Fertec is made up of two plants: Plant A and Plant B locatedin different cities. This audit was carried out on the maintenance department of Plant A.Fertec is owned by a parent company Cario.
11.2 An overview of Fertec A
The plant layout of Fertec A is shown in Figure 11.1 indicating the location of the mainprocess areas and the maintenance resources (labor and parts store). The labor resourcesare identified by a letter code that carried through to the organizational models.
An outline process flow diagram is shown in Figure 11.2. The ammonia plant is pro-duction critical since it supplies the other plants with ammonia and CO2. There is someinter-stage ammonia storage. The plant can also be supplied with imported ammonia,which is much more expensive than that produced internally.
Maintenance Systems and Documentation202
Wharf
Distribution
Ureastore
Ph
osp
hate
sto
re
Granulationworkshop
Sub-store
Granulation
c
gUrea
Ammonia
Ammoniastorage
Nitrogen control room
a and b
Ammoniaworkshop
Ureaworkshop
f
e
Code:
(a) Ammonia process technicians(b) Urea process technicians(c) Granulation process technicians(d) Response call-in team(e) Ammonia maintenance technicians(f) Urea maintenance technicians(g) Granulation maintenance technicians(h) Workshop maintenance technicians(i) Welding technicians(j) Stores staff
Main workshopCentral storesj
h and i
Utilities
Figure 11.1 Plant layout showing locations of technician resource
The complex is some 30 years old but has been up-rated, especially in the areas ofinstrumentation and control systems. The urea plant is currently being up-rated. Thecost of energy (natural gas) is a very high percentage of the ammonia-plant-operatingcost. The energy efficiency of the ammonia plant is low compared to the worlds best

because it has ‘old technology’. The reliability of the plant has a major influence onenergy efficiency and needs to be improved.
Fertec is one of a number of companies that belong to the parent group Cario. Thesenior management structure of Fertec A and its relationship with Fertec B and its par-ent group is shown in Figure 11.3. It should be noted that the Reliability Manager hasresponsibilities that cover both Fertec Plant A and Fertec Plant B.
A number of the senior positions in Fertec A had recently changed and had beenfilled with a young forward-looking team. The new team commissioned the auditbecause they felt that in order to remain competitive they needed to improve plant reli-ability and at the same time reduce maintenance costs. In addition they considered thatthere were ‘attitude issues’ that needed resolving both with respect to ‘trade-force per-formance’ and ‘maintenance management standards’. The new management of Fertec Awanted answers to the following fundamental questions:
● Taking into consideration the ageing nature of the plant ‘How effective is the main-tenance strategy’ (life plans, preventive schedule, etc.) in giving Fertec what theywant in terms of reliability and output?
● How organizationally efficient is the maintenance department in providing this serv-ice at ‘best cost’?
● How good are the maintenance systems?
11.3 Objectives
An outline of the process of setting objectives and business plans is shown in Figure 11.4.This is a form of management-by-objectives (MBO) closely allied to the authors business-centered maintenance approach.
Case study: Maintenance audit of an agricultural chemical plant 203
Plant utilities
Ammonia
Ammonia
Natural gas
Sulfuric acid
AmmoniaAmmonia
storage
Urea
Ammonium
sulfate
Ammonia plant Urea plant
Granulation
plant
CO2 plant CO2
CO2
Natural gas
Natural gas
Imported ammonia
Figure 11.2 Outline process flow diagram of Fertec Ltd

The Fertec A senior management group (to include the group Reliability Manager)establish a ‘works objectives and performance statement’. Objectives at this level areconcerned with manufacturing performance. Maintenance objectives are set for thoseareas that directly affect manufacturing. For example, an objective is set to improve theavailability of the ammonia plant from its current level of 88% to match the world bestat 96%. Objectives are also set to improve energy efficiency.
At plant manager level the works objectives are translated into local plant objectivesthrough three separate but linked objective/action statements viz. the people plan (con-cerns organizational efficiency objectives), the performance plan (concerns effective-ness objectives) and the safety plans. For example, in the case of the performance planreliability improvement objectives are set for the critical units of the ammonia plant, e.g.the syn-gas compressor (SGC). In addition a series of tasks are identified to achievethese improvements, e.g. introduce the use of ‘reliability centered maintenance’. Theseactions are allocated to specific engineers and supervisors.
The actions are reviewed by the plant manager at 3-monthly intervals. Similarly theworks objectives and actions are reviewed by the senior management group at 3-monthly intervals.
In addition to this procedure each of the managers, engineers and supervisors are setannual objectives within which are included many of the objectives/actions of Figure 11.4.
11.3.1 Comments on objectives
The auditors were impressed with the objectives and the objective setting procedure. Ithad only recently been set up and required time to ‘bed in’. The main criticism was that
Maintenance Systems and Documentation204
Cario Ltd
Fertec
general
manager
PlasticsPaints
Fertec A
works manager
Reliability
manager
Reliability
engineer
Ammonia
plant
manager
(See
Figure 5.12)
Urea
plant
manager
Site
services
manager
Granulation
manager
Shutdown
manager
Fertec B
works manager
Etc.
Explosives
Figure 11.3 Senior management administrative structure of Fertec Ltd

Case study: Maintenance audit of an agricultural chemical plant 205
Vision statement
Seniormanagement
group
Plantmanager
level
Engineer andsupervision
level
Works objectives and performance plan(list of quantified objectives for
plant performance, resource cost, safety,customers and the actions necessary)
Reviewed every3 months
Reviewed every3 months
Actions specified by the respectiveplant managers for their subordinates
with expected completion dates.Reviewed regularly
People planIdentification of
the actions neededto improve
organizationalefficiency, i.e.
alliances, reductionin staff, etc.
The plan includesidentification of
actions, milestonesand who is responsible
for the actions
Plant performance planIdentification of
key performanceindices in the areas
of reliability, quality,workshop service,
work planning,spares holding,remnant life andan outline of the
actions needed toachieve betterperformance in
these areas
Safety plansIdentification of
key performanceindices in the
areas of safetyand environment,
and an outlineof the actions
needed to achievethese objectives
Figure 11.4 MBO at Fertec Ltd

the procedure had not been brought down to the ‘self-empowered teams’. The auditorswere told that this would have to wait until the ‘negative human factors’ of the processteams improved.
11.4 Maintenance strategy
11.4.1 Plant-operating characteristics
The outline process flow diagram for the Fertec A complex was shown in Figure 11.2.The ammonia plant is the rate-determining process – it is production limited. Ammoniaplant failures can only be made up via imported ammonia (which is costly). The audi-tors were given the figure that a 1% loss of annual availability translates into many hun-dreds of thousands of pounds. The ammonia storage tank gives some protection (days)to the ammonia plant in the case of urea plant downtime. Failure of the ammonia plantalso brings out the urea and CO2 plants. The Granulation Plant is largely independentof the rest of the complex. In terms of downtime cost the following is the rule of thumb:
Ammonia plant Urea plant Granulation plant downtime costs
��downtime costs
��downtime costs
This section of the audit will be limited to the ammonia plant (the audit covered thestrategy for the full complex).
An outline process flow diagram for the ammonia plant is shown in Figure 11.5. Atunit level it can be seen that plant is a series process with limited redundancy. Thereare many units whose failure can affect the output of the ammonia plant and those thatpresent the highest risk of failure are regarded as critical, e.g. the SGC.
11.4.2 Ammonia plant maintenance strategy
The current strategy is to operate the ammonia–urea–CO2 complex for a 4-year periodbefore a 4-week shutdown. This operating period is a function of statutory inspectionof the pressure vessels (now self-regulating) and the need to inspect/repair/replaceother plant units whose reliability falls off after 4 years. The timing of the shutdown isset to coincide with low annual urea demand.
The 4-year operating period has been determined by the reliability group basedmainly on an empirical study of the ‘risk of failure factor’ vs the period of operation ofpressure vessels before inspection (i.e. how long can we operate the plant for withoutaffecting safety integrity?). They have established that the critical 20% of units carry 80%of the ‘risk factor’.
Continuous vibration monitoring is used on the large machines mainly for opera-tional safety but also for maintenance prediction. A number of other online monitoringtechniques are used both on the large machines and the pressure vessels to aid condition-based maintenance.
Maintenance Systems and Documentation206

The ammonia plant strategy has its center of gravity well toward condition-basedmaintenance. While the plant is operated for a 4-year period the shutdown workscopeis mainly based on the work predicted from:
● online inspections;● offline inspections from previous shutdowns;● history from previous shutdowns.
The duration of the shutdown is normally 4 weeks which includes a ‘dead-week’needed for shutdown and startup. The critical path during the shutdown is the reformerinspection (pressure vessel) and the SGC (large machine).
In terms of maintenance characteristics the plant can be categorized into largemachines, pressure vessels, ancillary equipment, e.g. duplicate pumps and electrical/instrumentation (E/I) equipment.
Life plan for the SGCA schematic diagram of the SGC is shown in Figure 11.6, which includes details on spareparts holding. The condition-based maintenance carried out on the machine is shown in
Case study: Maintenance audit of an agricultural chemical plant 207
High temperature
Air compressor
Low temperature
Steam
Waste-heat boiler
Shiftconverters
Ab
so
rber
Gas w
ash
er
CO2
Separator
AmmoniaRefrigeration
Recycle gas
Methanator
Heatexchangers
Ammoniaconverters
SGC
Primaryreformer
Secondaryreformer
Steam
Natural gas
Air
Figure 11.5 Outline of process flow model of the ammonia plant

Maintenance Systems and Documentation208
GearboxAir Inlet
Naturalgas feed
Exhaust gas towaste heat
boiler
Gas exit
CouplingsSpare NR
Syn-Gas toconvertors
IP case HP caseAir
filter Gas turbineR/T
Trans. R/T
Assembly NRSpare parts:Filter media D
Assembly RSpare x 2 RESpare parts:Numerous D
Assembly NRSpare parts:Rotor REDiffuse RIBearings DInnerdiffuser DNozzlewall outer D
Assembly RSpare RESpare parts:Gear train DBearings D
Assembly NRSpare parts:Aero-dynamic assy RI (HP only) Rotor REBearings D
LP case
Spares legend
R Rotable
NR Non-rotable
RE Repair externally
RI Repair internally
D Discard
RT Reaction turbine
LP Low pressure
IP Intermediate pressure
HP High pressure
Figure 11.6 Schematic diagram of an SGC
Bently Nevada system
• This sophisticated system records various data and has the ability to combine inputs toproduce multidimensional displays.
• It produces data in real time plus long and short trend patterns.• Items measured include:
– Radial shaft displacement– Axial shaft displacement– Bearing temperatures: radial and thrust– Accelerometer readings (gearbox and gas turbine only)– Shaft orbit readings (multidimensional)– Shaft phase angle (multidimensional)
• In addition to the above approximately 200 process variables are monitored.• All the above have alarm points and key items have shutdown settings.
Oil analysis
• Routine oil analysis.
Seal bypass test (compressor only)
• Routine seal accumulator drop test.
Oil debris analysis (gas turbine only)
• Online continuous monitoring.
Table 11.1 SGC condition-based maintenance

Case study: Maintenance audit of an agricultural chemical plant 209
Table 11.1. The machine is expected to operate continuously for 4 years. The shutdownworkscope is established from previous shutdown history, deferred corrective mainte-nance, and the online monitoring information. Additional work is identified as a resultof the offline inspection during the shutdown (unplanned).
Standard job procedures are in use, e.g. inspection-overhauls of the high-pressure case.These are comprehensive and detailed. The machine history records have not been for-malized, are hard copy and reside in a number of locations looked after by a number ofdifferent people. The life plan has not been formally documented.
Although not shown in Figure 11.6 there is an automatic lubrication system for theSGC. There are simple documented service routines associated with this system whichhave been computerized.
Life plan for pressure vesselsThe generic life plan for pressure vessels is based on condition-based maintenance. Themaintenance carried out during the shutdown is based on condition prediction fromprevious shutdown history and on any online non-destructive testing (NDT) monitoringperformed between the shutdowns. Additional work is identified from inspections car-ried out (open and closed) during the shutdown.
There are variations on the life plans to suit specific vessels. Those that are high onthe ‘risk factor analysis’, see Table 11.2 for the basis of the calculations, are subjected toan in-depth analysis to up-rate the life plan. Every pipe, weld and hot support thatmight give rise to failure is examined to develop the most appropriate NDT techniqueand inspection methodology (e.g. see Figure 11.7).
This inspection-based life plan is backed up with a comprehensive computerized infor-mation base, the pressure systems database which includes for each vessel the followinginformation:
● Process and mechanical data sheets.● Inspection history.● Inspection procedures and test plans (see Figure 11.7).● The vessel life plan (which has involved risk assessment and remnant life analysis).● Hard copy reports of previous shutdown case studies.
This computerized database is independent of the recently purchased company widecomputerized enterprise system.
Ancillary equipment*The life plans of such equipment is based on ‘service routines’ which are embedded inthe main computerized maintenance system (linked to other company systems). A typ-ical routine would be as follows:
Pump preventive routine: 3-monthly frequency:
● Oil change● General inspection
– Check coupling– Lift bearing cap, etc.
* For example, pumps, pressure relief valves, control valves, etc. – equipment that can be main-tained outside of the main shutdowns.
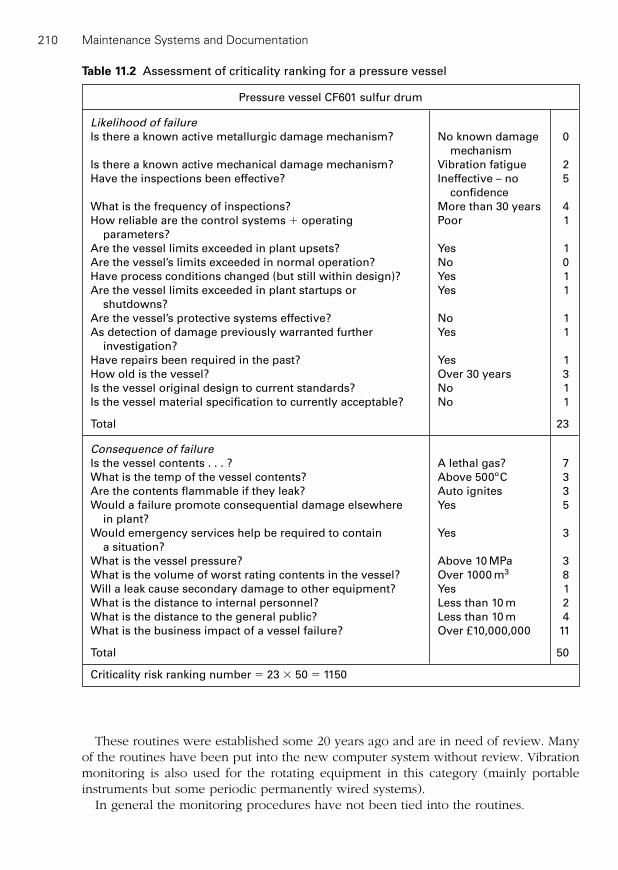
Maintenance Systems and Documentation210
Pressure vessel CF601 sulfur drum
Likelihood of failure
Is there a known active metallurgic damage mechanism? No known damage 0mechanism
Is there a known active mechanical damage mechanism? Vibration fatigue 2Have the inspections been effective? Ineffective – no 5
confidenceWhat is the frequency of inspections? More than 30 years 4How reliable are the control systems � operating Poor 1
parameters?Are the vessel limits exceeded in plant upsets? Yes 1Are the vessel’s limits exceeded in normal operation? No 0Have process conditions changed (but still within design)? Yes 1Are the vessel limits exceeded in plant startups or Yes 1
shutdowns?Are the vessel’s protective systems effective? No 1As detection of damage previously warranted further Yes 1
investigation?Have repairs been required in the past? Yes 1How old is the vessel? Over 30 years 3Is the vessel original design to current standards? No 1Is the vessel material specification to currently acceptable? No 1
Total 23
Consequence of failure
Is the vessel contents . . . ? A lethal gas? 7What is the temp of the vessel contents? Above 500ºC 3Are the contents flammable if they leak? Auto ignites 3Would a failure promote consequential damage elsewhere Yes 5
in plant?Would emergency services help be required to contain Yes 3
a situation?What is the vessel pressure? Above 10 MPa 3What is the volume of worst rating contents in the vessel? Over 1000 m3 8Will a leak cause secondary damage to other equipment? Yes 1What is the distance to internal personnel? Less than 10 m 2What is the distance to the general public? Less than 10 m 4What is the business impact of a vessel failure? Over £10,000,000 11
Total 50
Criticality risk ranking number � 23 � 50 � 1150
Table 11.2 Assessment of criticality ranking for a pressure vessel
These routines were established some 20 years ago and are in need of review. Manyof the routines have been put into the new computer system without review. Vibrationmonitoring is also used for the rotating equipment in this category (mainly portableinstruments but some periodic permanently wired systems).
In general the monitoring procedures have not been tied into the routines.
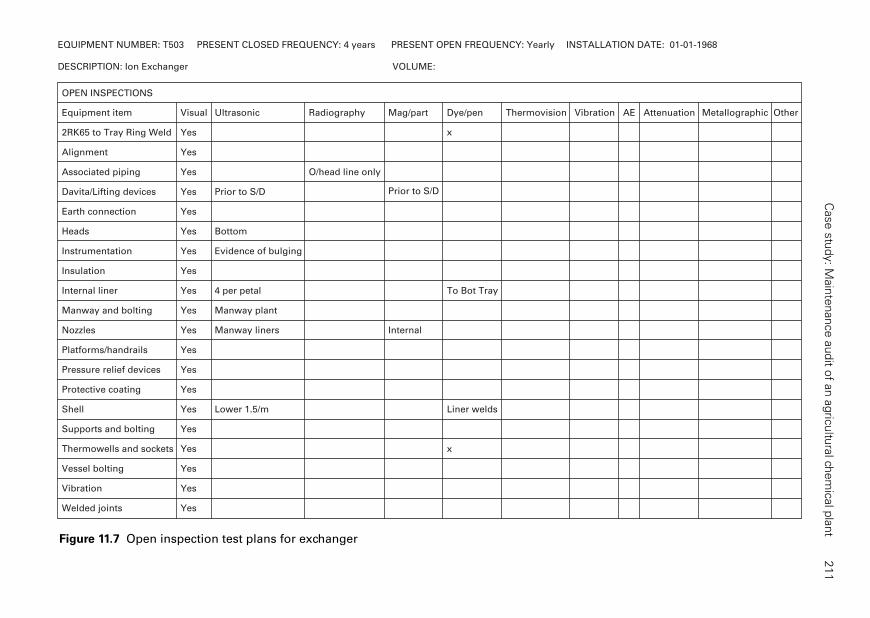
Case s
tudy: M
ain
tenance a
udit o
f an a
gric
ultu
ral ch
em
ical p
lant
211
EQUIPMENT NUMBER: T503 PRESENT CLOSED FREQUENCY: 4 years PRESENT OPEN FREQUENCY: Yearly INSTALLATION DATE: 01-01-1968
DESCRIPTION: Ion Exchanger
OPEN INSPECTIONS
Equipment item Visual Ultrasonic Radiography Mag/part Dye/pen Thermovision Vibration AE Attenuation Metallographic Other
2RK65 to Tray Ring Weld Yes x
Alignment Yes
Associated piping Yes O/head line only
Davita/Lifting devices Yes Prior to S/D Prior to S/D
Earth connection Yes
Heads Yes Bottom
Instrumentation Yes Evidence of bulging
Insulation Yes
Internal liner Yes 4 per petal To Bot Tray
Manway and bolting Yes Manway plant
Nozzles Yes Manway liners Internal
Platforms/handrails Yes
Pressure relief devices Yes
Protective coating Yes
Shell Yes Lower 1.5/m Liner welds
Supports and bolting Yes
Thermowells and sockets Yes x
Vessel bolting Yes
Vibration Yes
Welded joints Yes
VOLUME:
Figure 11.7 Open inspection test plans for exchanger
In addition to the routines a ‘contract lubrication system’ has been introduced oper-ated by one of the large oil companies.
The auditors noted that the operating procedure for units with duplicated drives wasas follows:
● Electric motors: change over weekly● Electric motors and steam turbine: use the electric motor and proof test the turbine
weekly.
E/I equipmentThe life plans are based on clean, inspect and calibrate where necessary. These preven-tive routines were set up many years ago and need review. It was noted that much of themore recent equipment, e.g. PLCs were not included on the routines and had not beenreviewed. The large electrical machines had no documented life plan. More importantlythe whole of the E/I equipment had not been reviewed in terms of ‘spares criticality’. Theinformation base data (job specification, modification and plant history, etc.) was eitheron hard copy (in a number of different locations) or held in people’s memory.
11.5 Maintenance organization
11.5.1 Introduction
The methodology model (see Figure 1.1) showed that the maintenance organization isbest understood by analyzing it into its resource structure and administrative structure.
11.5.2 The maintenance resource structure
A model of the resource structure for Fertec A is shown in Figure 11.8 and the inven-tory of resources is shown in Table 11.3. See also the plant layout of Figure 11.1 whichindicates the location of the trade groups. The following are the main characteristics ofthe structure:
● Each of the maintenance and process group, e.g. the ammonia maintenance group,are intended to be self-managed and co-ordinated by their facilitator.
● The process groups include 25% artisans and are expected to carryout some first-linemaintenance. In fact these groups carryout little or no maintenance.
● The out of hours priority maintenance is carried out by the response group (d) sup-plied on rota by all engineering technicians on site. These maintenance techniciansare on an annualized hours agreement and do not get paid for callouts. The averageovertime is about 5%. In order to enable all maintenance technicians to support theresponse group they are rotated across plants on a 2-yearly periodicity.
● The plant located maintenance day-groups, e.g. the ammonia maintenance groupcarry out most of the first- and second-line maintenance work in their own areas. Theyare supplemented by an average 25% contract labor to ensure the higher priority second-line work is complete. In spite of the use of contract labor the lower prioritycorrective and the preventive routines are neglected.
Maintenance Systems and Documentation212

Case study: Maintenance audit of an agricultural chemical plant 213
Ammonia
plant
Urea
plant
Granulation
plant
Urea
maintenance
Maintenance
technicians
Facilitator 1
Fitters 5
Inst./elect. 2
Inst./mech. 1
Elect. 2
38 hours week as
9 day fortnight
Granulation
maintenance
Maintenance
technicians
Facilitator 1
Fitters 3
Inst./elect. 2
38 hours week as
9 day fortnight
Ammonia
maintenance
Maintenance
technicians
Facilitator 1
Fitters 4
Inst./elect. 3
Elect. 2
Fitters 3
Elect. 1
Inst./mech. 1
Welder 1
38 hours week as
9 day fortnight
Operation and
a little first-line
maintenance
on shifts
First-line
maintenance
callout team
Support to all plants
Support to all groups
Workshop
Engineering technicians
Main workshop
Facilitator 1
Fitters 3
Welders 1
38 hours week 9 day fortnight
Stores
Supply technicians 3
38 hours week 9 day fortnight
Contractors
Support to all groups
Support to all groups
Third-line
maintenance
on weekdays
First- and
second-line
maintenance
on weekdays
Response
group
(a) (b) (c)
(d)
(e) (f) (g)
(h) (i)
Process tech. 24
(incl. Fitters 3
Elect. 2
Inst. mech. 3)
12 hours � 4 shifts 12 hours � 4 shifts
Process tech. 28
(incl. Fitters 3
Elect. 1
Inst. mech. 2)
12 hours � 4 shifts
Process tech. 16
(incl. Inst. mech. 3)
Selected from rota
supplied from all
maintenance teams
on site
Figure 11.8 Fertec A resource structure

Maintenance Systems and Documentation214
Resource categories
Technicians
Maintenance facilitator 4Fitter 15E/I 7Instrumentation machinist 1Electrician 4Welder 2
Semi-skilled
Stores technicians 3
Sub-totals
Total maintenance facilitators 5Total technicians (less facilitators) 29Total semi-skilled resources 3Total skilled and semi-skilled resources 32Total maintenance resources 37Total process technicians 68
Ratios
Operators per maintenance employee 1.85Percent semi-skilled of maintenance resource 8%Total skilled and semi-skilled resource facilitators 6.5Total skilled technicians/facilitators 5.8
Table 11.3 Maintenance resource inventory
● Inter-plant flexibility is encouraged by the management to cover the smaller over-hauls. In general such sideways movement is resisted by the technicians.
● The area maintenance groups are supported in terms of fabrication, machining,reconditioning and spares by the workshop facilities, stores and external contractworkshops, see Figure 11.9 for the reconditioning cycle.
● The workshop technicians also provide a maintenance service to non-manufacturingfacilities.
● The 4-yearly shutdown (third-line work) involves an influx of many hundreds of arti-sans for a 4-week period to supplement the internal labor. The resource structurechanges to a ‘shutdown structure’ for this period.
● The management has recently recognized the need for ‘engineering skills training’and introduced a comprehensive list of ‘goal-oriented learning’ units.
● A number of surveys were carried out to include the following:– Production perceptions of maintenance service, in general the maintenance serv-
ice was regarded as just satisfactory.● Maintenance technicians’ – ‘human factors’ – moral and goodwill toward manage-
ment was low and equipment ownership less than satisfactory. There was a feelingof strong vertical polarization.
● An alliance between the company and an internationally known contractor has beenproposed to carry out all non-core maintenance activities. This will include all work-shop services, spare parts management and other non-maintenance activities.

● There is little or no skills flexibility between the mechanical trades and the E/I tradesin spite of the two groups having a common facilitator and planner.
11.5.3 The maintenance administrative structure
The senior management administrative structure for Fertec A was shown in Figure 11.3.The administrative structure for the ammonia plant is shown in Figure 11.10 (the urea
Case study: Maintenance audit of an agricultural chemical plant 215
Contract reconditioningNew
rotables
Plant
Bin location for stockable LP items
Bin location for stockable electrical items
Bin location for stockable HP items
Rotable item failure
Note: All percentages have been estimated by the
site service planner
Rotable item
replace from stock
Main categories of
rotables
HP items 15%
Electrical 30%
LP Items 40%
Garage 8%
Strip Inspect
in
Plan
method
Repair Test
External reconditioning
Electrical: 10–20% of total
HP items 30% of total
LP items 20% of total
17% of all
rotables Bala
ncin
gfo
r ro
tati
ng
eq
uip
men
t
Ro
tab
les
17%
All balancing
done externally
Workshop
5%
new
ro
tab
les
Stores
HP items
Electrical
LP items
Spares to
external
contractors
Scrapped
items
5% Spares
Involves a
physical transfer
between locations
2200 rotables
reconditioned per year
HP High pressure
LP Low pressure
goods
received
area
spares
& infor-
mation
Recep
tio
n a
reas
Reco
nd
itio
ned
item
s a
reas
Inspection
in
goods
received
area
Figure 11.9 Logistics of rotable maintenance
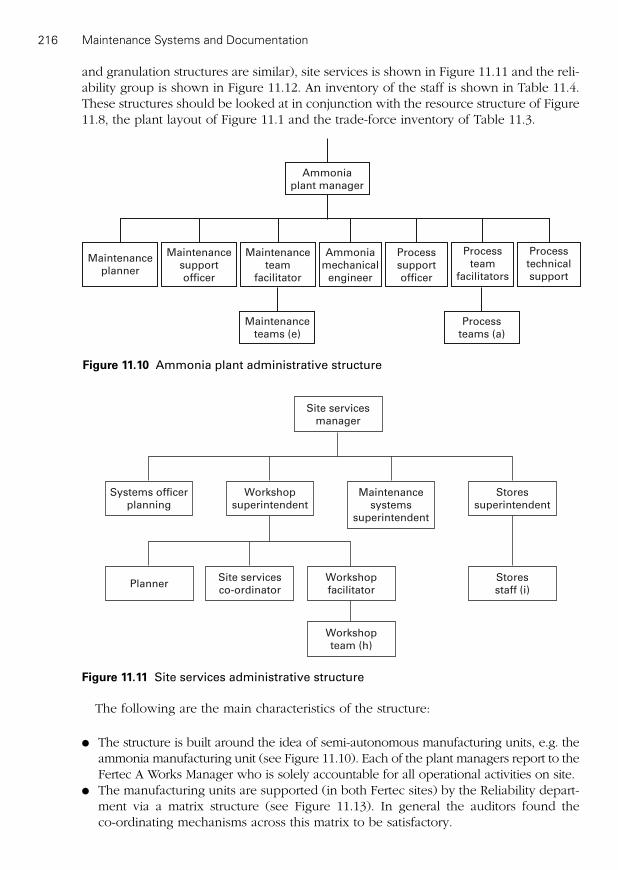
Maintenance Systems and Documentation216
Ammonia
plant manager
Maintenance
teams (e)
Maintenance
support
officer
Maintenance
team
facilitator
Process
team
facilitators
Process
technical
support
Process
support
officer
Ammonia
mechanical
engineer
Maintenance
planner
Process
teams (a)
Figure 11.10 Ammonia plant administrative structure
Stores
superintendent
Maintenance
systems
superintendent
Workshop
superintendent
Systems officer
planning
Site services
manager
Site services
co-ordinatorPlanner
Workshop
facilitator
Stores
staff (i)
Workshop
team (h)
Figure 11.11 Site services administrative structure
and granulation structures are similar), site services is shown in Figure 11.11 and the reli-ability group is shown in Figure 11.12. An inventory of the staff is shown in Table 11.4.These structures should be looked at in conjunction with the resource structure of Figure11.8, the plant layout of Figure 11.1 and the trade-force inventory of Table 11.3.
The following are the main characteristics of the structure:
● The structure is built around the idea of semi-autonomous manufacturing units, e.g. theammonia manufacturing unit (see Figure 11.10). Each of the plant managers report to theFertec A Works Manager who is solely accountable for all operational activities on site.
● The manufacturing units are supported (in both Fertec sites) by the Reliability depart-ment via a matrix structure (see Figure 11.13). In general the auditors found the co-ordinating mechanisms across this matrix to be satisfactory.
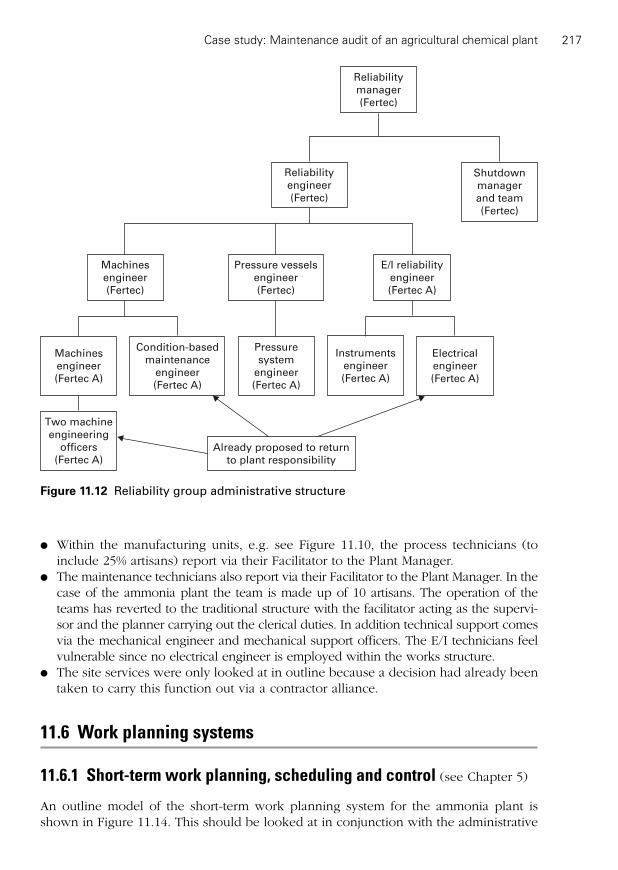
Case study: Maintenance audit of an agricultural chemical plant 217
E/I reliability
engineer
(Fertec A)
Reliability
engineer
(Fertec)
Shutdown
manager
and team
(Fertec)
Two machine
engineering
officers
(Fertec A)
Reliability
manager
(Fertec)
Machines
engineer
(Fertec)
Instruments
engineer
(Fertec A)
Electrical
engineer
(Fertec A)
Machines
engineer
(Fertec A)
Pressure vessels
engineer
(Fertec)
Pressure
system
engineer
(Fertec A)
Condition-based
maintenance
engineer
(Fertec A)
Already proposed to return
to plant responsibility
Figure 11.12 Reliability group administrative structure
● Within the manufacturing units, e.g. see Figure 11.10, the process technicians (toinclude 25% artisans) report via their Facilitator to the Plant Manager.
● The maintenance technicians also report via their Facilitator to the Plant Manager. In thecase of the ammonia plant the team is made up of 10 artisans. The operation of theteams has reverted to the traditional structure with the facilitator acting as the supervi-sor and the planner carrying out the clerical duties. In addition technical support comesvia the mechanical engineer and mechanical support officers. The E/I technicians feelvulnerable since no electrical engineer is employed within the works structure.
● The site services were only looked at in outline because a decision had already beentaken to carry this function out via a contractor alliance.
11.6 Work planning systems
11.6.1 Short-term work planning, scheduling and control (see Chapter 5)
An outline model of the short-term work planning system for the ammonia plant isshown in Figure 11.14. This should be looked at in conjunction with the administrative
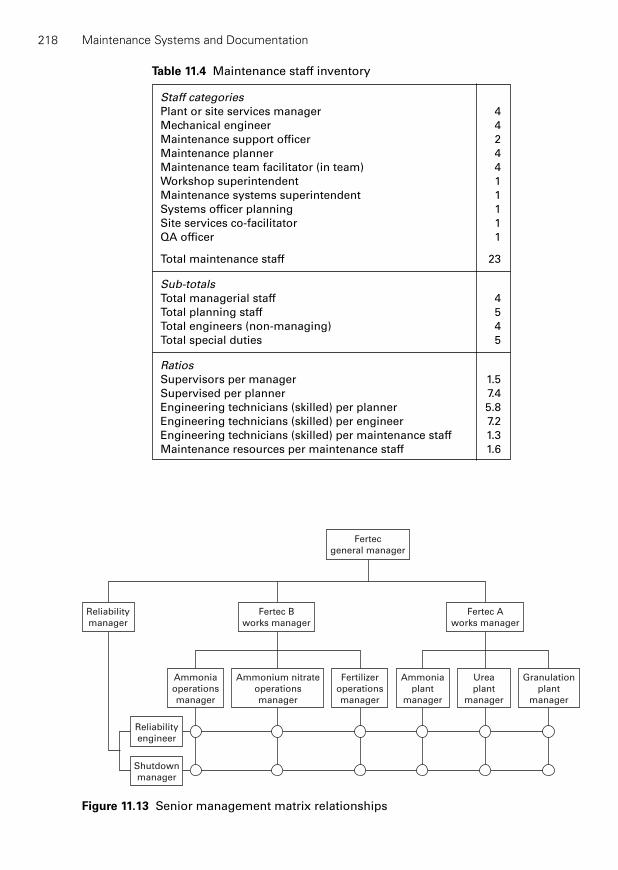
Maintenance Systems and Documentation218
Fertec
general manager
Fertec A
works manager
Reliability
manager
Fertec B
works manager
Shutdown
manager
Reliability
engineer
Fertilizer
operations
manager
Ammonia
plant
manager
Urea
plant
manager
Granulation
plant
manager
Ammonia
operations
manager
Ammonium nitrate
operations
manager
Figure 11.13 Senior management matrix relationships
Staff categories
Plant or site services manager 4Mechanical engineer 4Maintenance support officer 2Maintenance planner 4Maintenance team facilitator (in team) 4Workshop superintendent 1Maintenance systems superintendent 1Systems officer planning 1Site services co-facilitator 1QA officer 1
Total maintenance staff 23
Sub-totals
Total managerial staff 4Total planning staff 5Total engineers (non-managing) 4Total special duties 5
Ratios
Supervisors per manager 1.5Supervised per planner 7.4Engineering technicians (skilled) per planner 5.8Engineering technicians (skilled) per engineer 7.2Engineering technicians (skilled) per maintenance staff 1.3Maintenance resources per maintenance staff 1.6
Table 11.4 Maintenance staff inventory
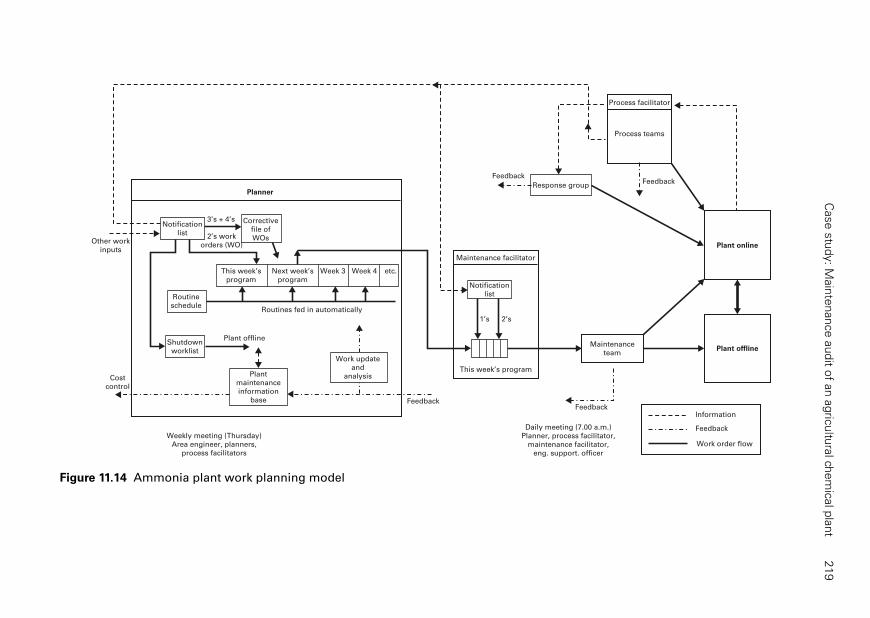
Case s
tudy: M
ain
tenance a
udit o
f an a
gric
ultu
ral ch
em
ical p
lant
219
Planner
Corrective
file of
WOs
Routine
schedule
Plant offline
Plant
maintenance
information
base
This week’s
program
Next week’s
program
Week 3 Week 4 etc.
3’s + 4’s
Routines fed in automatically
Feedback
Maintenance
team
Notification
list
This week’s program
Maintenance facilitator
1’s 2’s
Plant online
Plant offline
Response group
Process facilitator
Process teams
Feedback
Weekly meeting (Thursday)
Area engineer, planners,
process facilitators
Daily meeting (7.00 a.m.)
Planner, process facilitator,
maintenance facilitator,
eng. support. officer
2’s work
orders (WO)Other work
inputs
Cost
control
Feedback
FeedbackInformation
Feedback
Work order flow
Shutdown
worklist
Notification
list
Work update
and
analysis
Figure 11.14 Ammonia plant work planning model

Maintenance Systems and Documentation220
structure of Figure 11.10 and the resource structure of Figure 11.8. The ammonia sys-tem can be regarded as typical of the other plant-based systems.
This planning model is built around the resource structure of Figure 11.8. The shiftprocess teams carry out little or no maintenance work. The response team handles ‘outof hours’ emergency work. The day ‘maintenance team’ handles the first- and second-line work.
The priority system is as follows:
1. Now, or as soon as possible.2. This week, interrupt schedule.3. Next week.4. Shutdown, product change, opportunity.
Preventive routines are not prioritized and are ‘fitted in’. The system is computeroperated using a maintenance package which is part of an enterprise wide softwarepackage (EWSP).
A notification (a request for work) can be raised from a number of sources. Figure 11.14shows a notification being raised by the process facilitator. The notification carries mostof the history that is later transferred to the history record. In theory, resources cannotbe used (labor, spares, etc.) until the notification has been raised to a work order (WO).
In theory, on shifts, if the process team is available and the job is within their capabil-ity the WO is raised against them. In practice the process team rarely carries out mainte-nance work. In the case of an ‘out of hours’ emergency the ‘response group’ is summonedand the WO raised.
In most cases the notification (1–4) goes directly into the facilitators and planners in-tray (notification list). In total about 10 WOs per day are received of which only onewould be priority 1 – most WOs require one technician and a few might require up tofive technicians. The facilitator/planer reassesses the priorities.
In general (across Fertec) the facilitator deals with the 1’s and 2’s (if necessary withassistance from the planner) and the planner with the 3’s and 4’s.
It was agreed that ‘job instructions’ are limited to the large machines. The planner andfacilitator felt that opportunity windows are used in a satisfactory manner.
The actual labor hours go into the system at a later date (on occasions a very muchlater date) via the technicians updating the computer.
The permit to work (PTW) system operates via the facilitator. For the non-emergencyjobs he takes the WOs and PTW over to the process facilitator at the end of the day. The tagging is carried out overnight and is checked by the day process facilitator before handing over to the maintenance facilitator. The maintenance facilitator starts workat 6.30 a.m. to cover the PTW and overspill jobs from the night shift. A daily meetingtakes place at 7.00 a.m. to include the maintenance facilitator/day process facilitator/planner/technical support. The main purpose of the meeting is to establish the days program.
The main function of the planner (in all of the planning systems audited) was to plannext weeks work program. In this he is helped by the weekly meeting on a Thursdayafternoon. The meeting involves the planner, facilitator, plant engineer and processpeople. The function of the meeting is to provide the planner with the information nec-essary for him to set up next weeks program (outstanding work by priority, productionrequirements for next week, routines outstanding, etc.). The planner establishes next

weeks program to commit 75% of the existing manpower – some jobs are scheduled tothe day/hour to match plant requirements and some jobs are ‘flexible’, i.e. they can bemoved to different time/day. The most difficult jobs to plan are the multi-trade jobs –the planner deals with these. Multi-trade jobs can be handled via single WO or as ismore often the case a master WO and sub-WOs tied up to the master.
The auditor was told that about 70% of the planned work is completed – this meansthat approximately 50% of the work is planned (goes via the planner) and 50% isunplanned (goes direct to the facilitator). This varies across the different plants and the unplanned percentage can be higher – resulting in a considerable level of theplanned work (mostly routines) being dropped. The computer system can produce out-standing work by priority vs available resource. A backlog report has recently beenintroduced.
CommentsIn spite of a low planner plus facilitator/technician ratio the users and customers of thework planning system consider it is not working satisfactorily. The following are someof the contributing factors:
● The maintenance technicians and facilitator find the computer system difficult to use.They consider it user-unfriendly and they say they have not been properly trained touse it.
● An incomplete or user-unfriendly maintenance database, e.g. lack of standard jobprocedures, poor descriptions of the spares in the stores system, etc. (these problemsare being addressed).
● A high level of reactive work (in some plants) caused by the age of the plant and bythe previous poor maintenance regimes (routines, etc.).
● A pedantic PTW/tagging system (this problem is being addressed to ensure compli-ance and to streamline).
In the authors’ opinion the main problem is the unsatisfactory resource structure ofFigure 11.8. The process teams are not carrying out any first-line maintenance work. Allthe maintenance work is cascading into six small plant trade groups. The priority 1’sand 2’s going direct to the maintenance facilitator is disrupting the weekly program setup by the planner. This means that in many areas up to 50% of the total workload isunplanned. (To operate an effective weekly forward planning system the unplannedelement of the workload should be less than 15%.)
RecommendationsThe auditors consider that the main problem is with the resource structure rather thanthe planning system. They proposed that the modified structure shown in Figure 11.15be adopted. This would overcome the disruption outlined above. The 1’s and a propor-tion of the less complex 2’s would be carried out by the process technicians on shifts andthe plant dedicated maintenance technicians on days (the auditors envisage these main-tenance technicians working closely with the process technicians). The remainder of the work would be carried out by the nitrogen team. This should have a 90% planned
Case study: Maintenance audit of an agricultural chemical plant 221

Maintenance Systems and Documentation222
Ammonia
plant
Urea
plant
Granulation
plant
Urea
Maintenance
technicians
Mech. 1
Inst./elect. 1
38 hours week as
9 day fortnight
Solids plants
area team
Mech. 3
Inst./elect. 2
Nitrogen
area team
Mech. 7
Inst./elect. 6
38 hours week as
9 day fortnight
38 hours week as
9 day fortnight
Balance of
first-line
maintenance
on days:
ultimately
taken over
by process
technicians
Ammonia
maintenance
technicians
Mech. 1
Inst./elect. 1
38 hours week as
9 day fortnight
Contractor alliance
Site facilities
maintenance,
first-, second-line
Central workshop
emergency
reconditioning
Central
stores
Vehicle maintenance
resource
All trades, skilled and
semi skilled
Operations–
High proportion
of first-line
maintenance
on shifts
First-line maintenance back up
support to plant team for
absences and emergencies
Rotational transfer
of ammonia and
urea plant
technicians into
area team to update
maintenance
skills
First-line
maintenance
back up and
all second-line
maintenance
Rotational transfer
of granulation
plant technicians
into area team
to update
maintenance
skills
Site facilities
Support to
all groups
Support to
all plants
Support to area
second-line
maintenance groups
Contractors
from
alliance for
overhauls
Third-line maintenance
Reconditioning.
first- and second-
line maintenance
for site non-
manufacturing
facilities
Process
technicians 24
12 hours � 4 shifts
Process
technicians 28
12 hours � 4 shifts
Process
technicians 16
12 hours � 4 shifts
Maint techs.Maint techs.
Figure 11.15 Proposal for modified resource structure

Case study: Maintenance audit of an agricultural chemical plant 223
content. The auditors further recommend the facilitators should receive increased train-ing to enable them to carry out the planning role.
11.6.2 The planning of the major shutdowns (see Chapters 6 and 7)
This was not a full audit of the shutdown planning procedure. Such an audit wouldneed the presence of the auditors during the actual shutdown period. This exercise waslimited to a review of the Fertec shutdown planning procedure by comparing it with thestandard procedure of Figure 11.16.
Over the years, Fertec have had some poorly planned and executed shutdowns andas a result of this experience have set up a shutdown planning team reporting to theReliability Manager (see Figures 11.3 and 11.12). The team is permanent and includes ashutdown manager and Shutdown Planners located at Fertec 1 and Fertec 2. This teamis supplemented by key personnel immediately before and during the shutdown. Theongoing administrative structure of Figures 11.3 and 11.10, etc. is modified during theperiod of the shutdown (not shown). The resource structure of Figure 11.8 is also mod-ified to include an influx of personnel (not shown). The scheduling and resourcing ofthe shutdown is carried out with the use of Primavera (a network planning package).The identified tasks off the main network are carried out using the main computerizedwork planning system.
Comments and recommendationsAs a result of a history of poorly executed shutdowns Fertec have made major effortsto improve the planning, organization and execution of their major shutdowns. Theauditors consider that Fertec have a shutdown planning procedure that approachesinternational best practice. The following are the main recommendations for furtherimprovement:
● More thought should be given to the development of the plant shutdown and startupplans.
● A more rigorous approach to site logistics should be developed to ensure that ‘theright thing is in the right place at the right time’.
● In order to be able to establish a comprehensive and detailed shutdown workscopeit will be necessary for Fertec to improve their recording and storage or previousshutdown history. (Pressure vessel history is satisfactory.) In addition the historyrecording of online condition monitoring needs to be improved – at the momentthere is no connection between this data and the plant information base history.
● One of the main reasons for poor quality work during shutdowns is the lack of stan-dard job procedures with inspection test plans. The auditors are aware that improve-ments in this area are in hand but it is necessary to re-emphasize the considerableeffort/resource that this requires.
● The computer software systems being used to carry out the shutdown planning requiresome improvement (perhaps interfacing). At the moment Primavera is going to beused to produce the schedule. This then needs to be fed into the computerized work
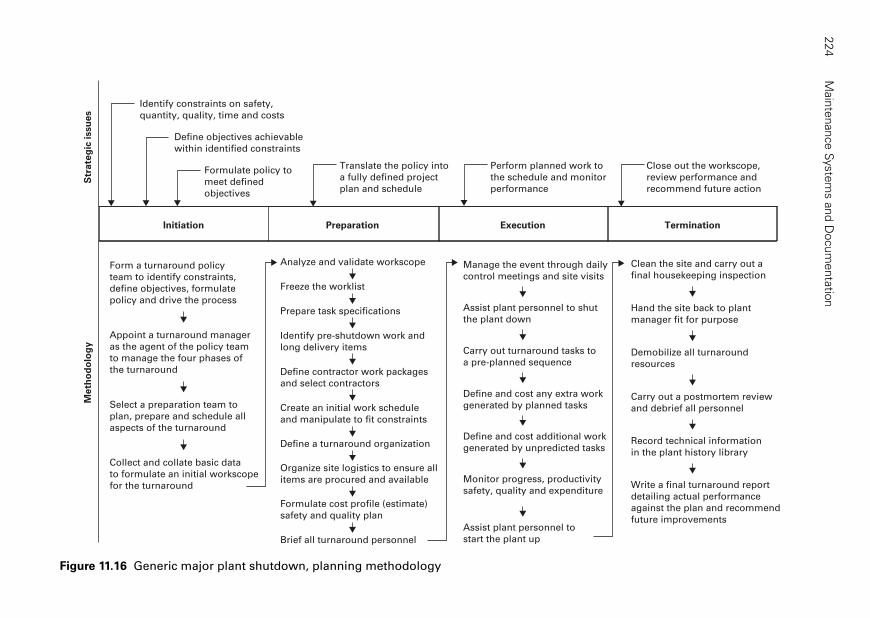
Main
tenance S
yste
ms a
nd D
ocum
enta
tion
224
Identify constraints on safety,
quantity, quality, time and costs
Define objectives achievable
within identified constraints
Formulate policy to
meet defined
objectives
Translate the policy into
a fully defined project
plan and schedule
Perform planned work to
the schedule and monitor
performance
Close out the workscope,
review performance and
recommend future action
Initiation Preparation Execution Termination
Form a turnaround policy
team to identify constraints,
define objectives, formulate
policy and drive the process
Appoint a turnaround manager
as the agent of the policy team
to manage the four phases of
the turnaround
Select a preparation team to
plan, prepare and schedule all
aspects of the turnaround
Collect and collate basic data
to formulate an initial workscope
for the turnaround
Analyze and validate workscope
Freeze the worklist
Prepare task specifications
Identify pre-shutdown work and
long delivery items
Define contractor work packages
and select contractors
Create an initial work schedule
and manipulate to fit constraints
Organize site logistics to ensure all
items are procured and available
Formulate cost profile (estimate)
safety and quality plan
Brief all turnaround personnel
Manage the event through daily
control meetings and site visits
Assist plant personnel to shut
the plant down
Carry out turnaround tasks to
a pre-planned sequence
Define and cost any extra work
generated by planned tasks
Define and cost additional work
generated by unpredicted tasks
Monitor progress, productivity
safety, quality and expenditure
Assist plant personnel to
start the plant up
Clean the site and carry out a
final housekeeping inspection
Hand the site back to plant
manager fit for purpose
Demobilize all turnaround
resources
Carry out a postmortem review
and debrief all personnel
Record technical information
in the plant history library
Write a final turnaround report
detailing actual performance
against the plan and recommend
future improvements
Str
ate
gic
issu
es
Me
tho
do
log
y
Define a turnaround organization
Figure 11.16 Generic major plant shutdown, planning methodology
planning system (at the moment manually) in order to collect and control costs. Andsince neither of these systems produces satisfactory S curves XCEL is used to carry outthis function.
11.7 Spare parts management (see Chapter 8)
11.7.1 Introduction
This project was not concerned with auditing the stores management system – this is amajor audit in its own right. The purpose of this section of a maintenance audit is toestablish ‘how good is the stores system in giving the maintenance people the servicethey need’.
11.7.2 Outline of the stores organization and systems
The plant layout diagram of Figure 11.1 shows the location of the main stores, sub-stores and the maintenance workshop.
The main workshop carries all of the cataloged parts and is operated by the enterprisewide computer package. The value of the stores is around £3M (2000) involving some12,500 grouping of items. The turnover was estimated at 60% of the value per annum.The main stores had recently introduced an open stores policy (serve yourself ). Theparts can be located via the computer system and withdrawn after a WO has been raised.
In terms of inventory policy the items are divided into six categories to include a ‘slowmoving parts’ category. The initial ordering procedure for parts (‘what to hold’ and ‘howmany to hold’ for new equipment) is taken by the Unit Engineers as part of their ‘lifeplan analysis’. A stand-alone software package (SCAS) is used to establish the policy forthe ‘slow moving expensive category or parts’. The main stores are the responsibility ofthe site services manager via the stores superintendent (see Figure 11.11).
The sub-stores carry a mixture of consumables, non-stores controlled parts and toolsand are the responsibility of the area facilitators.
The reconditioned items are supplied to the stores from the workshop and also directfrom outside contractors (see Figure 11.9). The workshop is currently the responsibilityof the site services manager but will come within the proposed contractor alliance.
Comments and recommendations● The auditors were told that the SCAS system for establishing the level of slow moving
parts was not being used. In addition the inventory policy for parts holding had notbeen reviewed for upwards of 20 years. During this time the plant had gone throughnumerous major shutdowns. In the auditors opinion (backed up by the comments ofinterviewees) there is serious overstocking of the expensive slow moving parts.
It is recommended that a review is carried out of the stock held in stores. Thisshould included a Pareto analysis of parts by cost and turnover. All expensive slowmoving parts should be subjected to a SCAS review.
Case study: Maintenance audit of an agricultural chemical plant 225

● The proportion of reconditioned items (17%) going out to contract is low for a com-pany located in an industrial area. It is recommended that a small project team be setup to study this problem in more detail with the objective of outsourcing as much aspossible of the reconditioned items. This should start with the outsourcing of thereconditioning of the electric motors.
● There were very few performance indices (PIs) in operation in the stores manage-ment system. PIs should be introduced as soon as possible to include:– a service factor index (the number of times per period a request for parts was
unable to be provided);– a rework index (for reconditioned items).
11.8 Maintenance control (see Chapters 3 and 4)
11.8.1 The control of overall maintenance performance
A conventional budgeting and cost control system was in use via the computer WO system of the kind outlined in Figure 11.14. The plant is divided into its main units ofequipment and each given a functional location number, e.g.:
Maintenance Systems and Documentation226
SGC 6 C 02
Ammonia plant Compressor Unique number
The units are divided into their main assemblies or systems, e.g. Reaction TurbineRT02. The costs are also divided via an alpha-numeric code into trade/department/worktype, etc. This allows cost reports to be generated against numerous criteria to include:
● Total cost per period per functional location/equipment number.● Top 10’s/20’s/30’s functional location by cost and work type.
A different system was in use to record plant and equipment uptime/availability andmore recently a series of key PIs have been established. These include the followingindices/graphs for each main plant:
● Monthly maintenance cost per ton produced.● Monthly availability.● Total cost of maintenance.
11.8.2 The control of organizational efficiency
Until recently no data was collected for this purpose. However, the recently introducedsystem of key PIs include the following organizational indices for each plant:
● Percentage of planned work.● Percentage of unplanned work.● Percentage of preventive man-hours.
● Percentage of rework man-hours.● Time WO raised before completion.● Units with a spare parts list.● Backlog of man-hours.● Percentage overtime.● Inventory value.● Percentage turnover.● Stockout costs.
11.8.3 The control of maintenance effectiveness (plant reliability control)
The auditors summarized their comments about plant reliability control (PRC) at Fertecas follows:
● The PRC structure should be formalized and the roles of the people involved clari-fied viz.:– The level 1 system should be set up to include the involvement of the process and
maintenance teams in continuous improvement (non-existent at the moment). Theteams should also be involved in the improvement of the life plans and givenincreased training with a view to improving the quality of history feedback.
– The roles of the Plant Engineer and Engineering Officers in PRC should be clarified(second level). Such clarification should include their inter-relationships and theirrelationships with the reliability group. It should be pointed out that they should bespending at least 30% of the time on ‘design out maintenance problems’.
– The role of the Reliability Group and their linkage to the Plant Engineers and theoriginal equipment manufacturer.
11.9 Documentation (see Chapters 9 and 10)
The main computerized information system at Fertec is a fully integrated EWSP of whichthe maintenance management system is one of a number of functions. This main systemis supplemented by a number of other computer systems and by hard paper documen-tation files.
The following are a list of the main observations made about documentation atFertec:
● Unit life plans: Not as yet formally documented with the exception of the pressurevessels.
● Standard job catalog: Some of the original preventive routines for the ancillaryequipment are in the EWSP. These need updating. There are a number of recondi-tioning specifications for the large machines held in hard copy.
● Equipment drawings: The main point was that many of the drawings are out of date.● Manuals: There is no master library. The manuals investigated were in poor condi-
tion and held in a number of locations.
Case study: Maintenance audit of an agricultural chemical plant 227

● Spare parts lists by unit: The electrical lists are only 50% complete.● History: Held in a number of locations as follows:
– The ‘ancillary equipment’ history was held in the EWSP and was of poor qualitydue to poor feedback from the teams.
– The ‘pressure vessel’ history was held in a stand-alone computerized databasewhich included job specifications, life plans and operating procedures. This his-tory was of excellent quality.
– The ‘large machine’ history was hard copy and held in a number of different locations.
● Condition monitoring: Each monitoring system seemed to be stand alone, e.g. theexternal consultant for the hand held vibration monitoring held their own records.
● Short-term work planning: Carried out via the WO system of the EWSP. This systemalso holds the preventive schedule for the ancillary equipment but not the shutdownschedule.
● Shutdown planning: Primavera is used to build the shutdown schedule and the WOsystem of the EWSP is used to allocate the jobs and collect the costs. XCEL is usedto produce S curves.
11.9.1 Comments and recommendations
(i) The Reliability Group expressed the view that the EWSP was not suitable for hold-ing and operating the kind of equipment that is needed for the maintenance of thelarge machines and pressure vessels viz. life plans, job specifications, history toinclude NDT mapping, case studies of overhaul, etc. The Reliability Group indi-cated their intention to develop stand-alone databases for the pressure vessels(existing), large machines and E/I equipment.
The auditors had some sympathy with this view based on their audit. The EWSPhad evolved out of the manufacturing industry where the major shutdowns are dif-ferent to the process industries. However, the building of new databases and theinterfacing costs is going to be an expensive business. The auditors recommend thata small project team is set up to examine this problem further to establish (via theEWSP experts) if the EWSP can be modified to satisfy the needs of the ReliabilityGroup. For example, the auditors cannot see the need for a separate E/I database.
The point being made is that if the EWSP is limited to its present equipment cov-erage then Fertec have paid a very heavy price for a simple WO – costing system.
(ii) At the moment the EWSP is not operating as well as it should. This is partlybecause the system is not user-friendly and partly because the training has fallenaway. The auditors recommend that the EWSP training is reviewed and restarted toinclude its monitoring.
(iii) It is recommended that an equipment manuals master library is set up as soon aspossible.
Reference
1. Kelly, A., Maintenance Management Auditing, Industrial Press, New York, 2005.
Maintenance Systems and Documentation228

Appendix: Weibull analysis*
A.1 Weibull analysis of item lifetime
The Weibull probability density function (pdf) can represent any of the three basictypes of failure viz. ‘wear-out’, ‘random’ and ‘running in’. It has two other sovereignvirtues:
(i) It can be applied via simple graphical techniques.(ii) It is expressed by a formula in which all the terms have engineering significance.
The ideas underlying this pdf may be grasped from Weibull’s own derivation, which wasneither mathematical nor statistical, but was based on a few practical considerations.
Weibull was involved in analyzing the results of load tests on many nominally iden-tical test specimens of a particular type of steel. Their ultimate tensile strengths exhib-ited random variability, as they always do. If F(x) was defined as the cumulative fractionwhich exhibited strengths less than a particular load x (i.e. F(x) was the cumulative dis-
tribution function (cdf), the distribution of the probability that a specimen would failunder the load x, then a plot of F(x) looked like the one shown in Figure A.1. Nonefailed before some given load x0 (guaranteed strength) and a very few hung on to quitelarge loads.
F (x) � 1�exp{�f(x � x0)}
Load (x)
1.0
F(x
)
(pro
bab
ilit
y o
f
failu
re u
nd
er
a lo
ad
x)
x0
Figure A.1 Probability of failure of specimens as a function of load
* Extracted from ‘Maintenance Strategy’, Kelly, A., Butterworth-Heinemann, 1997.

First, Weibull conjectured (see Figure A.1) that it might be possible to represent sucha cdf fairly accurately by the expression:
F(x) � 1 � exp{–�(x � x0)}
where �(x – x0) would be some function of (x – x0), as yet undefined and which itselfincreased as x increased, e.g. 3 (x – x0), or (x – x0)
2, or whatever. This would give a plot which started at x0 and approached F(x) � 1 asymptotically, as required. However,�(x – x0) would have to be such that it gave the appropriate rate of rise of the value ofF(x), and would have to be dimensionless (because it is an exponent, a power).
Weibull found that the form:
where � was a characteristic load (determining, along with x0, the scale of the loadsinvolved), and � was a curve-shaping factor, gave him an expression for the cdf:
which enabled him to correlate his test data very well. In addition, the expression hadsome other very useful properties, as we shall see.
In the reliability problems that we are looking at here the stressing factor is not loadbut running time t, since new or last overhaul. The Weibull cdf for times-for-failure is,therefore, written as:
From this, some not very complicated mathematics (e.g. R(t) � 1 � F(t)) then leads tothe appropriate expressions for the Weibull pdf F(t), reliability R(t) and hazard rate Z(t):
Each of the constants in these formulae has a practical meaning and significance.The threshold time-to-failure, or guaranteed life t0. In many cases of wear-out the first
failure does not appear until some significant running time t0 has elapsed. In the Weibullexpressions the time factor is then the time interval (t – t0).
f tt t t t
( ))
exp��
���b
h
b
b
b( 1
0 0
�
R tt t
( ) exp� �� 0
h
b
Z t t t( ) )� � �bb
b
�( 1
0
F xt t
( ) exp� � ��
1 0
h
b
F xx x
( ) exp� � ��
1 0
h
b
fh
b
( )xx x
�� 0
Maintenance Systems and Documentation230
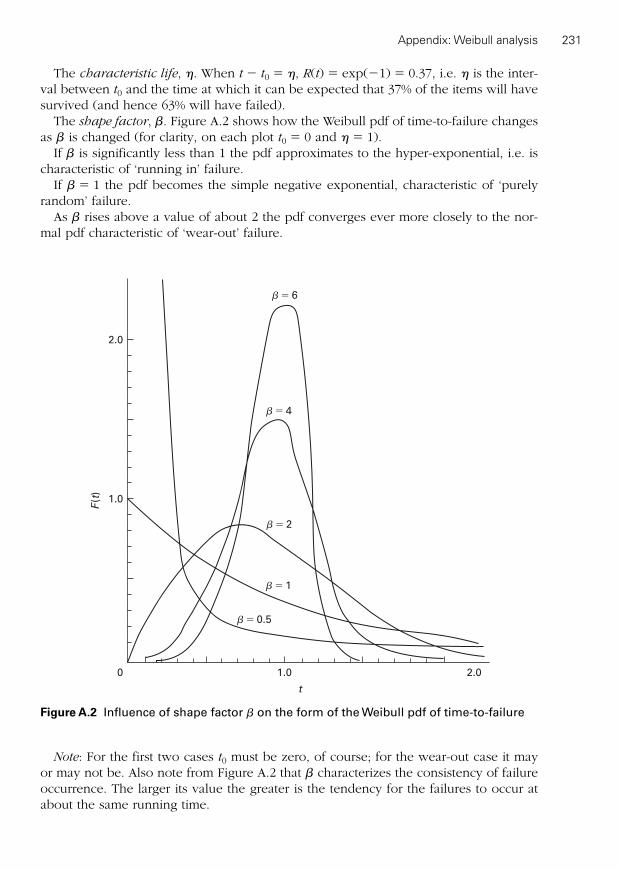
The characteristic life, �. When t � t0 � �, R(t) � exp(�1) � 0.37, i.e. � is the inter-val between t0 and the time at which it can be expected that 37% of the items will havesurvived (and hence 63% will have failed).
The shape factor, �. Figure A.2 shows how the Weibull pdf of time-to-failure changesas � is changed (for clarity, on each plot t0 � 0 and � � 1).
If � is significantly less than 1 the pdf approximates to the hyper-exponential, i.e. ischaracteristic of ‘running in’ failure.
If � � 1 the pdf becomes the simple negative exponential, characteristic of ‘purelyrandom’ failure.
As � rises above a value of about 2 the pdf converges ever more closely to the nor-mal pdf characteristic of ‘wear-out’ failure.
Appendix: Weibull analysis 231
2.0
1.0
0
F(t
)
1.0 2.0
t
b� 0.5
b� 1
b� 2
b� 4
b� 6
Figure A.2 Influence of shape factor � on the form of the Weibull pdf of time-to-failure
Note: For the first two cases t0 must be zero, of course; for the wear-out case it mayor may not be. Also note from Figure A.2 that � characterizes the consistency of failureoccurrence. The larger its value the greater is the tendency for the failures to occur atabout the same running time.
A.2 Weibull probability paper
How do we test whether several times-to-failure, collected from the history record of aparticular type of component, look as if they could be plausibly represented by aWeibull cdf? In the language of statistics, whether they look as if they have been sam-ple from such a distribution? And if they do, how do we determine the values of t0, �and � which will give the distribution which best fits the data?
One easy way is to use Weibull probability graph paper. There are several versions ofthis; we shall use the one, i.e. probably the most widely used in the UK, marketed by the Chartwell technical graph paper company (Ref. No. 6572 in their list. On this, they-axis variable is the cumulative fraction failed, F(t), expressed in percent, and the x-axis variable (t – t0), in whatever are the appropriate units of time for the particularcomponent studied (as explained earlier in this section, ‘time’ in this context is a meas-ure of usage and might appropriately be ‘number of operational cycles’). The axialscales are so arranged that if a theoretic Weibull cdf were to be plotted on the paper,(i.e. using values of F(t) calculated from the expression given earlier) they would lie ona perfectly straight line. The following example shows how the paper is used.
A.3 A Weibull analysis of a large and complete sample of times-to-failure
One hundred identical pumps have been run continuously and their times-to-failurerecorded. To fit a Weibull expression to the data we proceed as follows:
1. The data are tabulated as in Columns 1 and 2 of Table A.1.2. Successive addition of the figures in Column 2 leads to Column 3, the cumulative
percentages of pumps failed by the ends of each of the class intervals of Column 1.3. Three or four possible values, thought likely to span the actual value, are assigned
to t0 (the guaranteed life). The resulting values of t – t0 are tabulated in Columns 4–6.Note: In each case t is the time of the end of the interval (e.g. in Column 4, Row 3):
t � t0 � 1300 � 800 � 500 hours
4. On the Weibull probability paper, the Column 3 figures are plotted first against thosein Column 4, then against those in Columns 5 and 6, respectively.
The result is shown in Figure A.3. The value of t0 which results in the straight plot, inthis case 900 hours, is the one which gives a Weibull cdf which best represents the data.
5. The characteristic life, �, is the value of t – t0 at which the line fitted to the straight-est plot reaches the 63% failed level, in this case 600 hours. (Note: t � t0 � 600 hourscorresponds to a total actual running time of t � 1500 hours, remembering thatt0 � 900 hours.)
6. As shown, a perpendicular is dropped from the fixed ‘estimation point’ (printed justabove the too left-hand corner of the diagram) to the straightline fit. The point atwhich this perpendicular intersects the special � – scale at the top of the graph givethe value of � for the best-fit cdf (in this case approximately 3.5, clearly pointing toa wear-out mode of failure).
Maintenance Systems and Documentation232

Appendix: Weibull analysis 233
Table A.1 Pump failure data
(1) (2) (3) (4) (5) (6)
Cumulative t � t0 t � t0 t � t0
Time-to-failure Number percentage t0 � 800 t0 � 900 t0 � 1000
(hour) of pumps failed hours hours hours
1000–1100 2 2 300 200 1001100–1200 6 8 400 300 2001200–1300 16 24 500 400 3001300–1400 14 38 600 500 4001400–1500 26 64 700 600 5001500–1600 22 86 800 700 6001600–1700 7 93 900 800 7001700–1800 6 99 1000 900 8001800–1900 1 100 1100 1000 900
0.5 1 2 3b
b5
Estimation point
99
90
50
10
0.1102 103 104
1
Cu
mu
lati
ve p
erc
en
t fa
iled
b � 3.5
h � 600 hours
t0 � 900 hours
h estimator
t0 � 900 hours
t0 � 800 hours
t � t0 (hours)
h
t0 � 1000 hours
Figure A.3 Weibull plot of pump failure data (see Table A.1)

This page intentionally left blank

Index
Accident investigation, 127Administrative structure, 15–16Agricultural chemical plant:
documentation:comments and recommendations, 227–228
Fertec A:overview, 202–203
maintenance control:effectiveness, 227organizational efficiency, 226–227overall maintenance performance, 226
maintenance organization:administrative structure, 215–217resource structure, 212–215
maintenance strategy:ammonia plant, 206–212plant-operating characteristics, 206
objectives:comments, 203–206
spare parts management:stores organization, 225–226
work planning system:short-term, 217–225
Alternative maintenance strategy:for continuous operation, 25–26
Application parts list (APL), 175Application software, 191
Bar charts, 92–93, 101–102BCM, see Business-centered maintenanceBill of materials (BOM), 172Budget, 42Budgeting, 41 et seqBulkwork, 116Business-centered maintenance (BCM),
1 et seqalternative strategy, 25–26application of, 6–7audit, 7 et seqmaintenance organization, 3 et seqmethodology, 5organizational change, 26strategic thought process, 27–28
Business objectives, 4, 27
Capital budget, 42, 44Card index, 178
Case study:agricultural chemical plant:
Fertec A, 202 et seqCompany revenue budget, 42, 44Company wide system (CWS), 192–193Computerized maintenance information
systems:benefits, 193–195computerized documentation:
historical background, 190–192uses and problems, 195–196
Condition monitoring, 179–180Contractor work packages, 120Control principles, 56–57Cost center, 42, 44, 49Critical path analysis, 99, 101, 170
Data collection, 97Document imaging software (DIS), 194Documentation management systems, 191Drawing records, 173Dummy task, 94
Effectiveness, 60, 65–66Efficiency, 60, 65End event, in network analysis, 94Event, in network analysis, 93
graphical representation, 94
Feedback, 21, 55, 61, 65, 82–83Feed-forward, 21, 61Fertec, 202–223
Fertec A:administrative structure, 215–217resource structure, 213
First-line work, 11, 13, 45Food processing plant, maintenance
department:audit of, 7 et seqaudit summary, 25control system, 19–23documentation, 23–25life plans, 9–11objectives, 7–8organization:
administrative structure, 15–16resource structure, 12–15

Food processing plant, maintenancedepartment (Contd )
preventive schedule, 9–11work planning, 16–18workload, 11–12
General systems theory, 36
Hierarchic systems model, 34–36Holism, 36Human factors, 67–68
Information base, 172–177Insurance spares, 150Integrated CWS, 192Inter-firm comparison, 67Internet, 194Inventory policy:
fast-moving spares, 142–144guidelines, 155–156rotable, 153–155, 172–173slow-moving spares, 145–150
Job catalog, 175Job list, 82, 114Job procedure identification, 81
Kaizen, 62
Labor efficiency indices, 63Logic diagram, 97–99
Magpieing problem, 160Mainframe, 190–191Maintenance:
costing system, 19objectives, 8, 55
Maintenance administrative structure,215–217
Maintenance auditing, 7 et seqMaintenance budgeting, 42–45
procedure, 45–49workload categorization, 45
Maintenance control, 185–187effectiveness, 227organizational efficiency, 226–227overall performance, 226
Maintenance cost and availability control, 185Maintenance data:
feedback, 82–83Maintenance documentation systems:
condition monitoring, 179–180functional model, 168–170
information base, 172–177long-term work planning, 182–185maintenance control, 185–187plant inventory, 170–172preventive maintenance schedule, 177–179short-term work planning, 180–182
Maintenance effectiveness, 21–23Maintenance effectiveness control, 185–186Maintenance information system (MIS), 168,
172–176user requirement, 196
Maintenance management control:basics, 55human factors and data collection, 67–68maintenance performance:
published methods, 67use of indices, 67
organizational efficiency, 63–64overall performance, 57–60plant reliability:
pro-active control, 62–63reactive control, 61–62
principles, 56–57system model incorporation, 64–66
Maintenance management systems:hierarchic systems model, 34–36identification, 36–37
Maintenance organizational efficiency, 23Maintenance performance indices:
hierarchy, 58Maintenance stores:
basic function, 139Major shutdowns, planning, 223–225Major tasks, 116Manuals library, 173Matrix relationship, senior relationships, 218Minor tasks, 116
Network analysis:comments, 103planning procedure:
bar chart, derivation, 101–102critical path, floats and overhaul time,
99–101data collection, 97logic diagram, construction, 97–99resource histograms, 102–103
terms, concepts and definitions, 93–96
Open system, 34Organizational efficiency, 186
control, 63–64
Index236

Organizational objectives, 23, 63Overall maintenance performance, 57–60Overhaul, 92
Performance indices, 18, 20, 36, 58, 67stores and rotables, 161–162
Plant history, 176Plant inventory, 169, 170–172Plant reliability:
control, 185–186pro-active control, 62–63reactive control, 61–62
Plant turnarounds, management:methodology, 109 et seqnetwork analysis, 91 et seq
Preventive maintenance, 9Preventive maintenance schedule, 177–179Pro-active control, 62–63, 67Production plan, 10Profit center, 42, 49
Random failure parts, 145Reactive control, 61–62, 67–68Recurring corrective jobs, 175Re-order cycle policy, 142Re-order level policy, 142–143Repairable equipment, see RotableRequired level of service, 144Resource histograms, 102–103Resource structure, 12Revenue budget, 44Rotable:
inventory policy, 172–173in practice, 155theory, 153–154
system, 150–153
Safe working routine, 126Safety inspections, 126–127Safety team, 126Second-line work, 11, 13, 45Shift work planning system, 79–81Short-term work planning, 186–187Short-term work planning and control:
comments, 83–84design of, guidelines, 84–88fundamentals, 74–75modeling, operation, 75 et seq
maintenance data feedback, 82–83shift, 79–81weekend, 81–82
safety aspects, 88
Shutdown, 92Shutdown planning, 86, 187, 195Slow-moving spares, classification, 149–150Spare parts list (SPL), 172Spare parts management:
inventory policy:fast-moving spares, 142–144guidelines, 155–156slow-moving spares, 145–150
repairable equipment/rotable:inventory policy, 153–155, 172–173system, 150–153
stores operation, 139–142documentation, 156–160organization, 160–161outline, 139–141rotable performance indices, 161–162
Spares inventory policy, 139, 142 et seqStandard costs, 42Standard jobs, 175Start event, in network analysis, 94Stock control, 139, 158Stores documentation, 156–160
stores receipt voucher, 159stores requisition, 158
Stores operation:documentation, 156–160organization, 160–161outline, 139–141performance indices, 161–162
Stores organization, 160–161Strategic thought process, 27–28System incorporation:
maintenance management control, 64–66
Systems hierarchy, 36
Task hazard assessment, 126Tasks, in network analysis, 93
dummy task, 94graphical representation, 94interrelationship, 94
Technical data, 172Third-line work, 12, 13, 45Turnaround, 92
objective, 113Turnaround methodology:
execution:additional work, 129extra work, 129monitoring vehicle, 129–130shutdown, 128
Index 237
Turnaround methodology (Contd )execution (Contd )
starting up, 130turnaround tasks, 129
initiation:job lists collection, 114policy decisions, 113–114policy team formation, 110–113preparation team selection, 114
preparation:contractors, 120cost estimate, 125–126freezing worklist, 116optimization, 123organization formation, 123–124pre-shutdown work, 116–120quality plan, 127safety plan, 126–127site logistics, 125task specification, 116techniques involved, 120–122turnaround personnel, 127work schedule creation, 120workscope analysis, 114–116
termination, 130 et seqTwo-bin system, see Re-order level policy
Wear-out failure parts, 147Weekend work planning system, 81–82Weibull analysis:
item lifetime, 229–231probability paper, 232sample, times-to-failure, 232–233
Work control, 82, 83–84Work control system, 18Work order, 79–80, 180, 181Work planning:
long-term, 182–185shift, 79–81short-term, 180–182weekend, 81–82
Work request, 79Work scheduling, 120Workload, 11
categorization, 13Workscope, 114–116
Zero-based budgeting, 42, 49
Index238

88ويرايش
شركت
مشاور فني و خدمات مديريت
(سهامي خاص)
رزومه تخصصي نگهداري و تعميرات

شركت مشاورفني و خدمات مديريت رسا تدبير پارس
فيرست مطالب
ؼشفي ؽشوت سعب تذثيش پبسط .1
گذاسي تؼيشات تي سص تخققي .2
ؽشوت سعب تذثيش پبسط ايتشتی/عبيتبي تخققي .3
ؼشفي عاثك ذيش ػبي تي ؾبس ت .4
فؼبيتبي ؽشکت سعب تذثيش پبسط دس دص گذاسي تؼيشات کبسخبجبت فؼتي کؾس .5
فؼبيتبي فست گشفت شتجظ ثب عيغت گذاسي تؼيشات .6
تتخققبي ثىبسگشفت ؽذ دس تي ؾبس عيغت بي ذيشيت گذاسي تؼيشا .7
گذاسي تؼيشات دس عبصببي تمبضياجشا پيبد عبصي چگگي فشايذ وبسي دس .8
دس اجشاي پشژ ت عبصبب ي سد يبص ؽبآص .9
آدسط چگگي تبط ثب ؽشوت سعب تذثيش پبسط .10
کتبثبی چبپ ؽذ دس صي گذاسی تؼيشات .11

شركت مشاورفني و خدمات مديريت رسا تدبير پارس
في شركت رسا تذبير پارش معر
ثب تىي ثش تا تخققي، عاثك " سعبتذثيش پبسط " ؽشوت ؾبس في خذبت ذيشيت
ساعتبي سعبت خيؼ ثب پبيجذي ث اسصػ بي تجشثيبت ثش ذيشا وبسؽبعب خد دس
32699 ثب ؽبس ثجت ثيبدي دس دص خذبت ذعي ذيشيت ثؼا ؽشوت عبي خبؿ
. ؾغي ث فؼبيت د اعت
ب فتخشي و ثب جؼي اص تخققب وبسؽبعب خجش دس دص فؼت داؾگب دس غيش تذي
. ادا وي،ث وؾس ػضيضب ايشاسا دس اي اش خد ثبذگي جبؼ دس تالؽي تب ع
ب " سعبتذثيش پبسط " ؽشوت ؾبس في ذيشيت ث ػا ىبس يبس، تعؼ استمبء عبصب
لشاسداد خذبت خد بدبي دتي خقفي يض استمبي جبؼ سا ثؼا ذف افي
سا دس ذسبي صيش اساي ي بيذتخققي خد
ارائو خذمات سيستمياي مذيريت (1
ارائو خذمات مينذسي فني (2
ارائو خذمات آمزشي فرىنگي مشتمل بر برگساري دره ىاي (3آمزشي، سمينارىا كارگاىياي تخصصي
بي سد اؽبس ثب جت ؾبسوتب عؼي اي دس دص وبسؽبعب تخققب ثشجغت د
بي لي، جتي ثش سػ بي خاللب ي، سضبيت تبي ري فؼب ؾتشيب وبسي تؾىي تي
خد سا فشا آسي

. . . شركت مشاورفني و خدمات مديريت رسا تدبير پارس
شركت مشاورفني و خدمات مديريت رسا تدبير پارس
رزمو تخصصي نگيذاري تعميرات در
شركت رسا تذبير پارش
دس ساعتبي تخققي وشد خذبت خد عت تؼبالت ثي ؾتشيب ثبفؼ "سعب تذثيش پبسط "ؽشوت
اص . ثبم خد فؼبيتبي فست گشفت خد سا ث فست تخققي فشعت د دس اختيبس ؾتشيب لشاس يذذ
: صي گذاسي تؼيشات ث ؽشح صيش يجبؽذدستعظ اي ؽشوت فؼبيتبي فست گشفت اي ع
" : رسا تذبير پارش " شركتاينترنتي/سايتياي تخصصي
www.rasatadbir.comعبيت افي ؽشوت سعب تذثيش پبسط .1
120000اص ثب ثيؼ TPM www.irantpm.irعبيت تخققي گذاسي تؼيشات ثش س فشاگيش .2
فش ػضيت 1500ثبصديذ وذ
CMMS www.cmms.irش افضاس گذاسي تؼيشات عبيت تخققي .3
: نت پرژه /مذير عالي تيم مشاره
بفش جالي : ب ب خبادگي
کبسؽبط اسؽذ عيغت بي ذيشيت گذاسي تؼيشات
,OEE, TPM, PM, PS, MFMEA, CBM, PdM, 5S RCMؾبس آصػ: ػذ تخقـ
RCA, SPC, CMMS اسگببعي فبي عغخ کؾس کدس
09153163393 : غتمي تف تبط
[email protected] : آدسط ايي

. . . شركت مشاورفني و خدمات مديريت رسا تدبير پارس
شركت مشاورفني و خدمات مديريت رسا تدبير پارس
: فعاليتياي شرکت رسا تذبير پارش در حزه نگيذاري تعميرات کارخانجات صنعتي کشر
آصؽي گذاسي تؼيشات دس عغخ کؾس –ثشگضاسي عيبسب بيؾبي تخققي .1
عشادي عيغت گذاسي تؼيشات کبسخبجبت فؼتي .2
(DPM – Design Preventive Maintenance)
ؾبس ثجد عيغت ذيشيت گذاسي تؼيشات .3
(PMO – Preventive Maintenance Optimization)
بعت ثب يبصبي ت عبصب ت CMMSؾبس خشيذ ش افضاس گذاسي تؼيشات .4
(UMLتذي عيغت عبصب ثب اثضاس )
TPMپيبد عبصي عيغت گذاسي تؼيشات ثش س فشاگيش تبعت ثب عبصببي ايشاي .5
KPI Maintenanceپيبد عبصي ؽبخـ بي ػکشدي گذاسي تؼيشات .6
OEEپيبد عبصي ؽبخـ اثشثخؾي کي تجيضات .7
جتي ثش ػبسض يبثي فؼبيتبي ت عبصب جت ثجد (آديت ت)اجب يضي گذاسي تؼيشات .8
PM Auditافالح عيغت ت عبصب دس لبت
اسائ دس بي آصؽي گذاسي تؼيشات .9
(TPM , OEE , PM , KPI , PS , RCM , PMO , PM Audit , 5S , PM Cost)
وؾبسصي ، فبيغ غزائي غيش –ساغبصي - اجب گذاسي تؼيشات بؽي آالت فؼتي .10
اجب گذاسي تؼيشات تبعيغبت ثشدتي دشاستي .11
اجب گذاسي تؼيشات خغط خبثشاتي ثشق سعبي .12
ثي عبصي قشف اشژي .13
دفظ عشبي بي فيضيىي وبؼ ضي بي شثع .14
اط5عبصبذي ذيظ اعشاف وبس .15

. . . شركت مشاورفني و خدمات مديريت رسا تدبير پارس
شركت مشاورفني و خدمات مديريت رسا تدبير پارس
: مرتبط با سيستم نگيذاري تعميرات صرت گرفتو فعاليتياي
ؾتشک 1500 ثبصديذ 120000 ثب ثيؼ اص 1384عشادي عبيت ايتشتي ت ثش س فشاگيش اص عبي .1
1385 اص عبي CMMSش افضاس گذاسي تؼيشات عشادي عبيت ايتشتي .2
ؾبس ت پيؾگيشا کبسخب يشگغتشا .3
ؾبس ت پيؾگيشا کبسخب پبست عبصي .4
ؾبس ت پيؾگيشا کبسخب جبد اثشيؾ .5
ت ثش س فشاگيش جػ کبسخبجبت تبژ (يضي)آديت ؾبس ت .6
ؾبس ت ثش س فشاگيش فبيغ يذسيک .7
ؾبس ت پيؾگيشا کبسخب پيب ثبتشي خشاعب .8
ؾبس ت پيؾگيشا کبسخب سخؼ لغؼ .9
(ثب کبسي ؽشکت پيک )ؾبس ت پيؾگيشا ؽشکت گبص ؾذ .10
ثب گش ؾبسا فأسي اعالػبت CMMSؾبس ش افضاس ت .11
ثب ؽشکت عيغتبي ش افضاسي پگئ CMMSؾبس ش افضاس ت .12
ثب ؽشکت پيؾش عيغت CMMSؾبس ش افضاس ت .13
ثب ؽشکت ثي پشداصا عشآذ CMMSؾبس ش افضاس ت .14
ثشگضاسي بيؼ ت ثش س فشاگيش دس فؼت کبؽي کؾس يجذ يضد .15
ثشگضاسي بيؼ ت ثش س فشاگيش دس فؼت خدس ؽشکت پبسط خدس .16
1387ثشگضاسي اي بيؼ ي ت ثش س فشاگيش تشا .17
1387دثيش کيت ذعي اي بيؼ ي ت ثش س فشاگيش تشا .18
ؾبس ش افضاس گذاسي تؼيشات ؽشکت پباليؼ گبص ثيذ ثذ دس اعتب خصعتب .19
ؾذ ثب ؽشکت ي گبص ؾذCNGعشادي عيغت ذيشيت گذاسي تؼيشات ايغتگب بي گبص .20
(دس دعت اجشا) دس کبسخب تبژي پدس ؾذ CMMSپيبد عبصي اعتمشاس ش افضاست .21
يضي گذاسي تؼيشات کبسخب ثغپبس عبص تط دس ساعتبي پشژ بي ثش سي عبصب .22
ثشگضاسي عيبس تخققي عشادي عيغت گذاسي تؼيشات دس يشگب ثشق ساي ااص .23
ثشگضاسي عيبس تخققي عشادي عيغت گذاسي تؼيشات سؽبي ثجد عيغت گذاسي .24
تؼيشات پيؾگيشا دس يشگب ثشق ؾذ

. . . شركت مشاورفني و خدمات مديريت رسا تدبير پارس
شركت مشاورفني و خدمات مديريت رسا تدبير پارس
مارد مرتبط با نگيذاري تعميرات صرت گرفتو ساير فعاليتياي
ؾبس پيبد عبصي خغب بپزيش عبصي فشايذب دس ؽشوت سعتبن لغؼ تط .1
ؾبس پيبد عبصي خغب بپزيش عبصي فشايذب دس ؽشوت گبسدا پبست عبصا .2
ؾبس عيغتي پيبد عبصي خغب بپزيش عبصي فشايذب ؽشوت پژاي وبسا تط .3
ؾبس پيبد عبصي خغب بپزيش عبصي فشايذب دس ؽشوت جػ عبصي پبست عبصا .4
تشا - 1387 دس تيشبTPMوبسگب آصؽي خغب بپزيش عبصي فشايذب دس اي عيبس ي .5
پبست عبصي ؾذ (5S)ؾبس ظب پبويضگي .6
کبسخب جبد اثشيؾ (5S)ؾبس عيغتي ظب پبويضگي .7
ؽشوت لغؼ عبص دس ؾذ17ؾبس ثشگضاسي دس بي آصؽي دس اثضاسبي ويفي شتجظ ثب ت ثب .8
ؽشوت لغؼ عبص دس خشاعب22 دس ثيؼ اص FMEA ؾبس ثشگضاسي دس بي آصؽي .9
دس ؽشوت پؾ ثبفي تط ؾبس عيغتي .10
ؾبس عيغتي دس ؽشوت پبست ي .11
ؾبس عيغت ايض تي اط ث کبسخب کيب فؼت لبئ .12
ؾبس عيغت گشيذ عبپک جغتيک ث کبسخب تبژي پدس ؾذ .13
تيم مشاره سيستم ىاي مذيريت نگيذاري تعميرات بكارگرفتو شذه در تخصصياي
ع فش - (عيبالت ، جبذات)يغبظ فق يغبظ ذط کبيک .1
فش يه- (اکتشيک ، لذست)يغبظ ذعي ثشق .2
يک فش - (پشعظ)فق يغبظ ذعي ؽيي .3
فش يه–ذط فبيغ .4
يک فش - (ناعتشاتژيثشب سيضي )فق يغبظ ذيشيت ثبصسگبي .5
يک فش - تذي گش عيغت ش افضاسي .6
د فش - ذط کبپيتش ش افضاس .7

. . . شركت مشاورفني و خدمات مديريت رسا تدبير پارس
شركت مشاورفني و خدمات مديريت رسا تدبير پارس
ي نگيذاري تعميراتفراينذ كاري در اجرا پياده سازچگنگي
يغت ذقالت، تيشاژ تيذ، تؼذاد ک پشع عبصب، تؼذاد )ؾتشي کغت اعالػبت اي اص کبسخب .1
، تؼذاد ک تجيضات عبصب، تؼذاد ک تجيضات تيذ ، يپشع تيذ، تؼذادپشع ت، عبختبس عبصب
(تؼذاد ک تجيضات تبعيغبت ، عي ػش تبعيظ ش خظ تيذي
اص تخقـ بي سد يبص تؾى تي آديتس اص ؾتشي ثب تج ث اعالػبت کغت ؽذ )اجب آديت ت .2
( اػضا ي گشدد جت اجب آديت تخققيدس خاعت کذ ث عبصب
فبف آ ثب عيغت تؼيي دس خقؿ ت خاعت وذ سدتي گضاسػ جبغ اص ضؼيت فؼي عبصب .3
Gap Analyse. تي اسائ (ضغ غة)س فشاگيش ت ثش
تمبضيعبصبدس تؾکي تي يب کيت ت .4
Gap Analyseاعبط تبيج اسائ يغت فؼبيتبي شاد پيبد عبصي ت .5
(Gant Chart)فبص ثذي ثشب بي اجشايي تؾکي تي بي تخققي اجشايي دس عغخ کبسخب .6
ظبست اسائ ؾبس آصػ جت "سعب تذثيش پبسط" ؾبستي دضس ثشب سيضي ؽذ .7
آصؽبي الص ثشآسد ؽذ دس آديت ت غبثك ثشب صبي پشژ اسائ .8
ذيشيت کتشي پشژ دي اجشاي وبس .9
ثشگضاسي جغبت الص ثب ذيشا اسؽذ دبيب پشژ عبيش غئال ريشثظ جت ذايت ػبي .10
اسائ گضاسؽبت الص ث ذيشيت عبصب .11
گيذاري تعميرات يکي از نقاط قت تيم مشاره ن
در شركت رسا تذبير پارش استفاده از علم ، تجربو تخصصياي مرد نياز
. نياست فراينذىاي آسازمانيا با تجو بو زمينو كاري

. . . شركت مشاورفني و خدمات مديريت رسا تدبير پارس
شركت مشاورفني و خدمات مديريت رسا تدبير پارس
: خذمات آمزشي مرد نياز در اجراي پرژه نت
ثش اعبط سعبت فؼبيتبي تخققي خديىي اص پبي بي ػىشدي خد سا آصػ دس " سعب تذثيش پبسط "ؽشوت
بي تخققي اص ج گذاسي تؼيشات ثب بد اعت دس ب ثب تج ث TPMي تخققي شتجظ ثب صي
. عغخ يبص عبصبب دعت ثذي اسائ ي گشدد
.آصؽبي تخققي دس دص ت دس جذاي صيشؾخـ ؽذ اعت
ب دس آصؽي فسدي
ب دس آصؽي ف
سدي
5Sظب آساعتگي TPMگذاسي تؼيشات ثش س فشاگيش 13 1
OEE- اثش ثخؾي وي تجيضات 8D 14– سؽبي د غئ 2
اضابت يبصذيبي ش افضاس بي گذاسي تؼيشات
CMMS 15
يژ عغخ کبسگشا )صثب تقيش ثب ت اپشاتسي
(اپشاتسب 3
MSAکبيجشاعي جبي فىشي دس عشادي فشايذبي عبصب 16 4
ذيشيت ثشب سيضي اعتشاتژيه اي 18 OHSAS آؽبيي ثب اضابت ايي ثذاؽت دشف 6
چشخ ثش سي چگگي اجشاي آ دس عبصبب ايي ذيظ صيغت 19 7
تي عبصي وبسگشي اسگي فؼتي 20 8
ثجد غتش – کبيض MFMEA 21آبيض دبالت ثبم خشاثي بؽي آالت 9
RCM ت جتي ثش لبثيت اعيب
(Reliability Centered Maintenance ) 22 CMMS 10 اعتفبد اص وبپيتش دس ت
PdM گذاسي تؼيشات پيؾگيب
(Predictive Maintenance) CBM گذاسي تؼيشات جتي ثش ضؼيت 23
(Condition Based Maintenance) 11
RCFA آبيض سيؾ ػ خشاثي
(Root Cause Failure Analysis) 24 SPC 12 ثىبسگيشي ف آبسي دس فشايذ ت

. . . شركت مشاورفني و خدمات مديريت رسا تدبير پارس
شركت مشاورفني و خدمات مديريت رسا تدبير پارس
: ثب ب طات
شركت رسا تذبير پارش
0511-6097243 0511-8649940: تف
0511-6097243: فبوظ
www.rasatadbir.com: ة عبيت
[email protected]: پغت اىتشيىي
290پالک - 1214ثي ؼ - ثاس ؼ- ؾذ: آدسط
91895 –1435: فذق پغتي
(سهامي خاص)