maintenance planning and resource allocation in a urea ...planning+and... · allocation in a urea...
TRANSCRIPT

QUALITY AND RELIABILITY ENGINEERING INTERNATIONAL. VOL. 9. 41 1-423 (1993)
MAINTENANCE PLANNING AND RESOURCE ALLOCATION IN A UREA FERTILIZER PLANT
DINESH KUMAR Regional Engineering College, Kurukshetra, 132119, India
A N D
P. C. PANDEY Indmtrial Engineering and Management Division, A.I. T . , Bangkok, Thailand
SUMMARY
This paper is devoted to the analysis and computation of overall as well as various subsystem availabilit- ies of a urea fertilizer plant. Based on the analysis, appropriate maintenance strategies for different situations have been developed. Using Lagrange’s multiplier technique the cost of maintenance and manpower is analysed. By minimizing the maintenance cost allocation to various subsystems, the optimum repair policy is determined.
KEY WORDS Maintenance planning Plant availability
INTRODUCTION
Fertilizer plants are complex, repairable engineering systems comprised of a large number of subsystems interconnected in seriedparallel or both. For efficient working, it is essential that the various subsystems of the plant remain perpetually in the up state. However, in reality, the subsystems are subject to random failures. These, however, can be brought back into service after repaidreplace- ments. The failures of the subsystems and their components are difficult to predict precisely, as they depend upon the operating conditions and repair policy used. From economic and operational points of view it would be desirable to ensure the maximum possible level of system availability. 1-4
Repairable engineering systems are characterized by a large number of interconnected components with their own failure behaviour and repair time distributions. System availability in such cases is a complex function of the failure and repair time distributions of the components in the system. The analysis based on Markov models applies in general to series, parallel or combined series/parallel sys- t ems.
In this work the performance evaluation of the fertilizer plant based on system availability has been attempted by the use of Chapman-Kolmogorov equations, and the steady-state subsystem/system availabilities are computed by the use of Laplace transforms.
The system model for the plants has been developed on the basis of an actual study conducted in a medium-sized fertilizer plant located near Roorkee. The failure-timelrepair-time data as well as the current maintenance practice in the plants were studied. Based on these models the best plant
operating policies and their preventive maintenance schedules have been worked out and compared with the existing practice. To minimize the maintenance cost, fund allocation to various subsystems so as to achieve the optimum repair policy has also been worked out. For this purpose Lagrange’s multiplier technique has been employed.
The findings of this paper have been discussed with the management of the plants with a view to appraising them of the potential benefits that would accrue through the implementation of the analytical results.
MODELLING
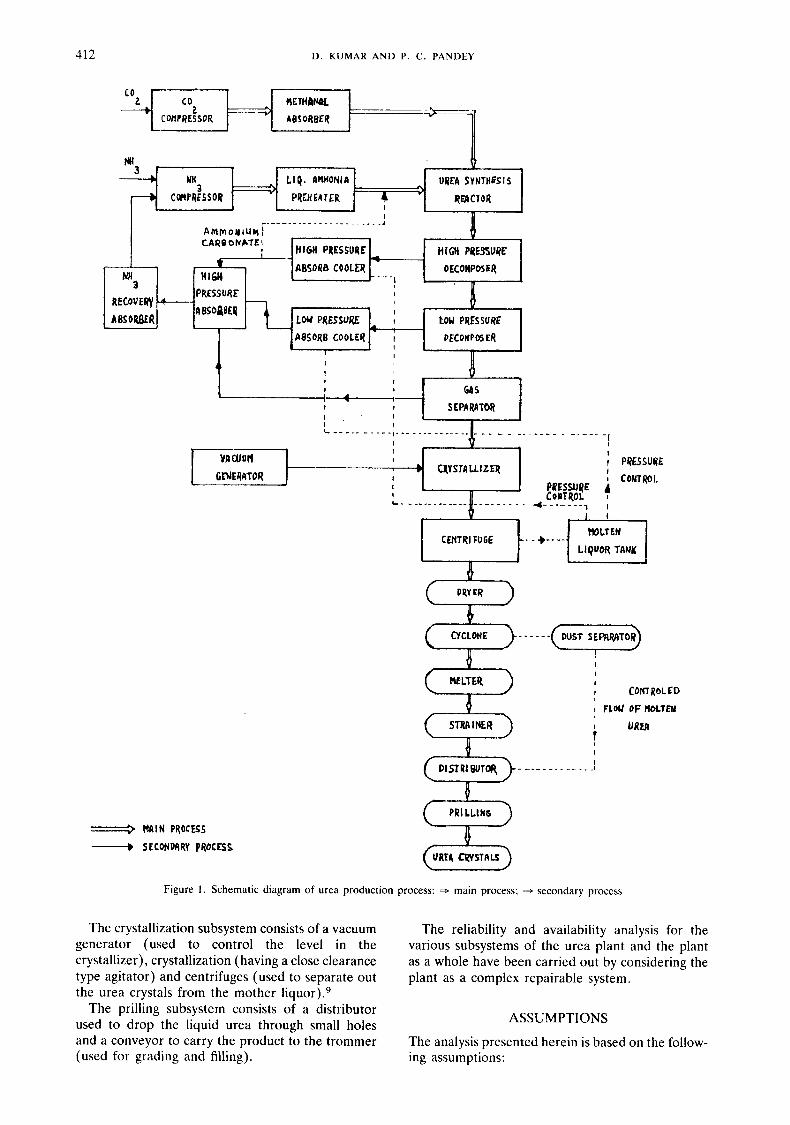
For the purpose of system modelling a study was carried out in a plant situated in North India produc- ing 100 tons of urea per day. For the production of urea, carbon dioxide (CO,) and ammonia (NH,) are the prime inputs. These gases react at a particu- lar temperature and pressure to form urea. The urea in gaseous form is cooled down to yield urea crystals. A schematic diagram of the urea manufacturing pro- cess is shown in Figure 1.
The urea production process is quite complex and continuous in nature. To facilitate the availability analysis of this plant the production system is div- ided into four subsystems namely, synthesis, decomposition, crystallization and prilling.
The synthesis subsystem comprises a centrifugal pump (to compress CO, gas), two reciprocating pumps (one for CO, and another for NH,, to boost the pressure) and heaters (to heat NH, gas).’
The decomposition subsystem consists of a heater (using the reboiler and falling film heater), an absorber (high and low pressure), a gas separator and a heat exchanger.x
0748-8017/93/050411-13$11.50 0 1993 by John Wiley & Sons, Ltd.
Received 10 October 1992 Revised 6 February 1993
412 D . KUMAR A N D P. C . PANDEY
I FLoU OF HOLTEN
- SECONPRRY pRocflr :=> HAlN PqOCESS
Figure 1 . Schematic diagram of urea production process: * main process, -+ secondary process
The crystallization subsystem consists of a vacuum The reliability and availability analysis for the generator (used to control the level in the various subsystems of the urea plant and the plant crystallizer), crystallization (having a close clearance as a whole have been carried out by considering the type agitator) and centrifuges (used to separate out plant as a complex repairable system. the urea crystals from the mother liquor).’
The prilling subsystem consists of a distributor used to drop the liquid urea through small holes and a conveyor to carry the product to the trommer (used for grading and filling).
ASSUMPTIONS
The analysis presented herein is based on the follow- ing assumptions:

MAINTENANCE PLANNING A N D RESOURCE ALLOCATION 413
20,2 1,22 2 3 2 0 Figure 2. Urea synthesis system
5 12 11
Figure 3 . Urea decomposition system
(1)
(ii)
Y
Figure 4. Urea crystallization system
Mean failure/repair rates of the units are con- stant over time, for equal intervals of time and are statistically independent. The repaired units are as good as new per- formance-wise. Repair/replacement is under- taken upon failure only."'."
(iii) Each subsystem has a separate repair facility and subsystems do not wait for the avail- ability of repair facilities. 12 ,13
(iv) Service includes repair and/or replace- ment. I 2 , l 3
(v) System times to failure/repair are exponen- tially distributed. This would imply that there are no simultaneous failures of units in a subsystem or among the subsystems and the probability of more than one failure/repair in a time interval t is ~ e r 0 . ~ ~ , ~ ~
(vi) Intermittent service may be performed in the various subsystems.
(vii) Cold standby units are provided for the liquid ammonia feed pump, the recycle solution feed pump, the heat exchanger and the dis- tributers (B,D,F and V). These subsystems have the same nature and capacity as the active units (Figures 2-4).
(viii) Simultaneous failures in B and/or in D cannot occur.
(ix) In the centrifuge ( G 3 ) , all the units are work- ing simultaneously and the failure of any one cannot be tolerated (since inflow of liquid urea in the centrifuge cannot be controlled, hence reduced capacity operation is not possible).
Based on the above assumption the transition diagrams for the various subsystems have been pre- pared; these represent a visual picture of the states of the system at any particular instant (see Figures 2-5).
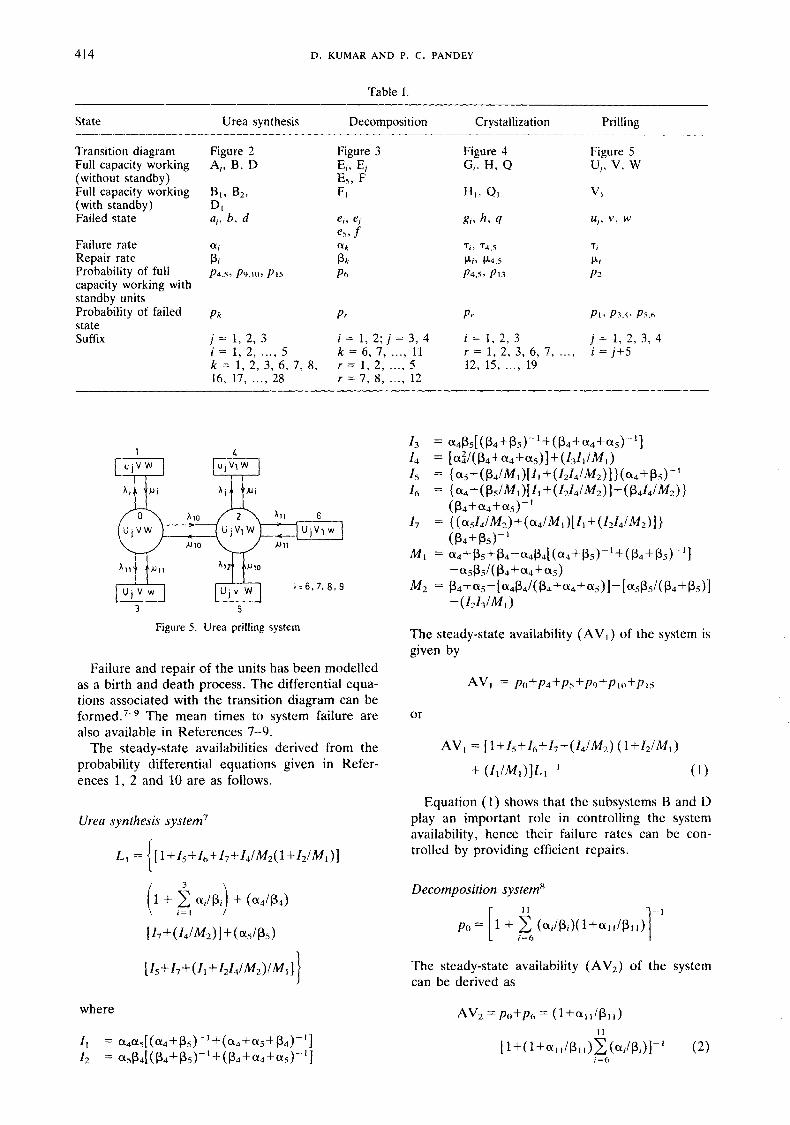
NOTATIONS The notations employed to represent the various states of the subsystems are given in Table I .
414 D. KUMAR A N D P. C. PANDEY
Table I .
State Urea synthesis Decomposition Crystallization Prilling ~~
Transition diagram Figure 2 Figure 3 Figure 4 Figure 5 Full capacity working A,, B, D Ei, Ej Gi, H, Q uj, v, w (without standby) Es, F Full capacity working B,, B2, FI H I , QI VI (with standby) DI Failed state a,, b, d ei, ej gi, h , 4 u,, v , w
es. f
Repair rate Pi P k Pi, P4.5 IJ., Probability of full p4.53 pY.10, PI5 P 6 P4.5. PI3 P2
Probability of failed P k P r Pr PI. p3.4. PS.6
Failure rate a, a k T,, 74.5 Ti
capacity working with standby units
state Suffix j = 1, 2, 3
i = 1, 2, ..., 5 k = 1 , 2 , 3 , 6 , 7 , 8 , r = l , 2 ,..., 5 12, 15, ..., 19 16, 17, ..., 28
i = 1, 2; j = 3, 4 k = 6, 7, ..., 11 r = 1 , 2 , 3 , 6 , 7 , ..., i = j t 5
r = 7, 8, ..., 12
i = 1, 2, 3 j = 1, 2, 3, 4
0 :o 6 , u,vw UjVjW UjVl w
NlO
3 5
Figure 5. Urea prilling system
Failure and repair of the units has been modelled as a birth and death process. The differential equa- tions associated with the transition diagram can be f ~ r m e d . ~ - ~ The mean times to system failure are also available in References 7-9.
The steady-state availabilities derived from the probability differential equations given in Refer- ences 1, 2 and 10 are as follows.
Urea synthesis system7
where
The steady-state availability (AV,) of the system is given by
AVI = PO+P4+PS+P9+P lO+PlS
or
Equation (1) shows that the subsystems B and D play an important role in controlling the system availability, hence their failure rates can be con- trolled by providing efficient repairs.
Decomposition system8
The steady-state availability (AV,) of the system can be derived as

MAINTENANCE PLANNING A N D RESOURCE ALLOCATION 415
Equation (2) shows that the performance of the equipment F is crucial in controlling the system availability [AV,]. Hence its failure rate must be maintained to as small a value as possible by provid- ing better repair facilities.
Crystallization system'
The long-run availability (AV,) of the system is given by
Equation (3) shows that the equipment H and Q having standby units has a controlling influence on system availability.
Prilling system r 9 1
The steady-state availability (AV,) of the system is given by
Equation (4) indicates that the failure of the dis- tributor plays an important role in controlling the system availability. Its failure rate should therefore be maintained to as small a value as possible.
OVERALL AVAILABILITY OF THE UREA PLANT
Since the urea synthesis system, the decomposition system, the crystallization system and the urea pril- ling system work in series, the availability of the entire plant (AV) is given by
AV = AV, x AV2 x AV, X AV4
= { [ 1 + 1, +I,+ I , + ( 14/M2)( 1 +I,lMl ) + I1 /MI ] L ; 1 1
J
+ (71 I / PI I 1 + (. 10712/ P:o)
Based on the failure and repair data of the plant, the plant availability (AV) has been computed under the following conditions (see Table 11):
(i) The C 0 2 booster compressor and CO, high pressure compressor units do not have standbys, and hence their failures would have a large effect upon system availability. Generally the plant uses a1 = a, = 0.02, repair rates P I = P2 = 0-25 (the mean repair time, however, may vary depending upon the type of failure).
(ii) The ammonia preheater is just like a heat exchanger and there is no mechanical operation, so the typical failure rate would be a, = 0.001. How- ever, it takes about 5 h to repair, mainly on account of the replacement of the preheater tubes after fail- ure (p3 = 0.02).
(iii) The liquid ammonia feed pump ( B ) and recycle solution feed pump (D) have units in standby; hence their failure rates a, and as remain small, having very little effect upon system avail- ability. Typical values are a4 = 0-002 and as = 0.004, and the repair rate P4 = Ps = 0.25, i.e. about 4 h to repair, may vary due to the mode of failure, having small effect upon system availability.
(iv) Equipment such as the reboiler, the low and high pressure absorber, the gas separator and the heat exchanger operate due to chemical changes, pressure difference or temperature difference only, i.e. no mechanical operation is involved in any of the equipment; hence in this equipment complete failure never occurs. The instruments provided in this system perform chemical analysis, pressure rec- ording at the inlet and outlet and also carry out temperature recording. The failure rate in these cases is very small (a, = 0.001), whereas repairs take about 10 h, i.e. p, = 0.1 (where i = 6,7,8,9,
(v) All the units in the crystallization system gre- atly influence the system availability; hence their role must be analysed critically. The failure rate for the generator ( T ~ ) has been observed to vary from once ip 1000 h to once in 100 h, and the repair takes about 20 h.
The crystallizer works on a temperature difference principle. Since there are no mechanical parts, its rate of failure is very small ( T ~ = 0.002) and its repair takes about 5 h (p,, = 0.2). The failure rate
10,ll).

416 D. KUMAR A N D P. C. PANDEY
Table 11. The effect of the failure rates of the vacuum generator, the centrifuge, the screw conveyor and the belt conveyor on system availability with the repair rates of the C02 booster and C02 high pressure compressor being 0.1. Values based on the plant data are al = a2 = 0.02, a3 = 0.001, p1 = 0.2,
pz = 0.2, r4 = rS = 0.02, p4 = 115 = 0.5, T~ = 0.0025, p6 = 0.2, r8 = T~ = 0.005, px = 0.5, py = 0.8, 12.4 = 0,002, as = 0.004, p 4 = (3s = 0.25, = 0.001, p, = 0.1, (i = 6, 7, 8, 9, 10, l l ) , T* = 0,002,
710 = 0.002, pi0 = 0.9, p1 = 0.05, p 3 = 0.2, 712 = 0.005, = 0.5, p.7 = 0.5
Availability (AV) 71 7 3 77 ~~1 = 0.005 711 = 0.010 7 1 1 = 0-015 711 = 0.020
0.001 0.001 0.010 0.613 0.607 0.601 0.596 0.015 0.607 0.601 0.596 0.591 0.020 0-601 0.596 0.591 0.585
0-005 0.010 0.601 0.596 0.590 0.585 0-015 0.596 0.590 0.585 0.579 0.020 0.590 0.585 0.579 0.574
0.010 0.010 0.587 0.581 0.576 0571 0.015 0.582 0.576 0,571 0.566 0.020 0-576 0-571 0.566 0.581
0.005 0.001 0.010 0569 0.564 0.558 0.553 0.015 0.564 0.558 0.553 0.548 0.020 0.558 0.553 0.548 0.543
0-005 0-010 0.559 0.554 0.548 0.544 0-015 0.554 0-549 0.544 0.539 0.020 0.545 0.544 0.539 0.534
0.010 0.010 0.547 0.542 0.541 0.532 0.015 0.542 0.537 0,532 0.527 0.020 0.537 0.532 0.527 0.522
0.010 0.001 0.010 0.522 0-517 0-512 0.508 0.015 0.517 0.513 0.508 0.503 0.020 0.513 0.508 0.503 0,499
0.005 0.010 0.514 0.509 0.504 0.500 0.015 0.509 0.504 0.500 0.495 0.020 0.504 0.500 0-495 0-491
0.010 0.010 0.504 0.499 0.494 0.490 0.015 0.499 0.494 0.490 0.485 0.020 0.494 0.490 0.485 0.481
of the centrifuge is high and varies greatly from once in 1000 h to once in 100 h, and its repair takes about 5 h. The crystallizer pump and slurry feed pump have units in standby; hence their failure rates ( T ~ and T ~ ) remain very low ( T ~ = T~ = 0-02), and the repair takes about 2 h, i.e. p4 = p5 = 0.5.
(vi) The failure rates of the cyclone is also small, i.e. once in 400 h ( T ~ = 0.0025), whereas its repair takes about 5 h (p6 = 0-2). Failure of the screw conveyor has been observed to vary from once in 200 h to once in 100 h, whereas its repair takes about 2 h. The failure rates of the melter and strainer are very small ( T ~ = T~ = 0.005) and their average repair rates are JI.~ = 0.5 and p9 = 0.8.
Since the distributor has a unit in standby with an unskilled worker, to avoid any choking of the distributor holes, its failure rate is very small
= 0.002) and its average repair rate is pIO = 0-9. Failure of the belt conveyor varies from once in 200 h to once in 100 h, whereas an average repair takes 2 h.
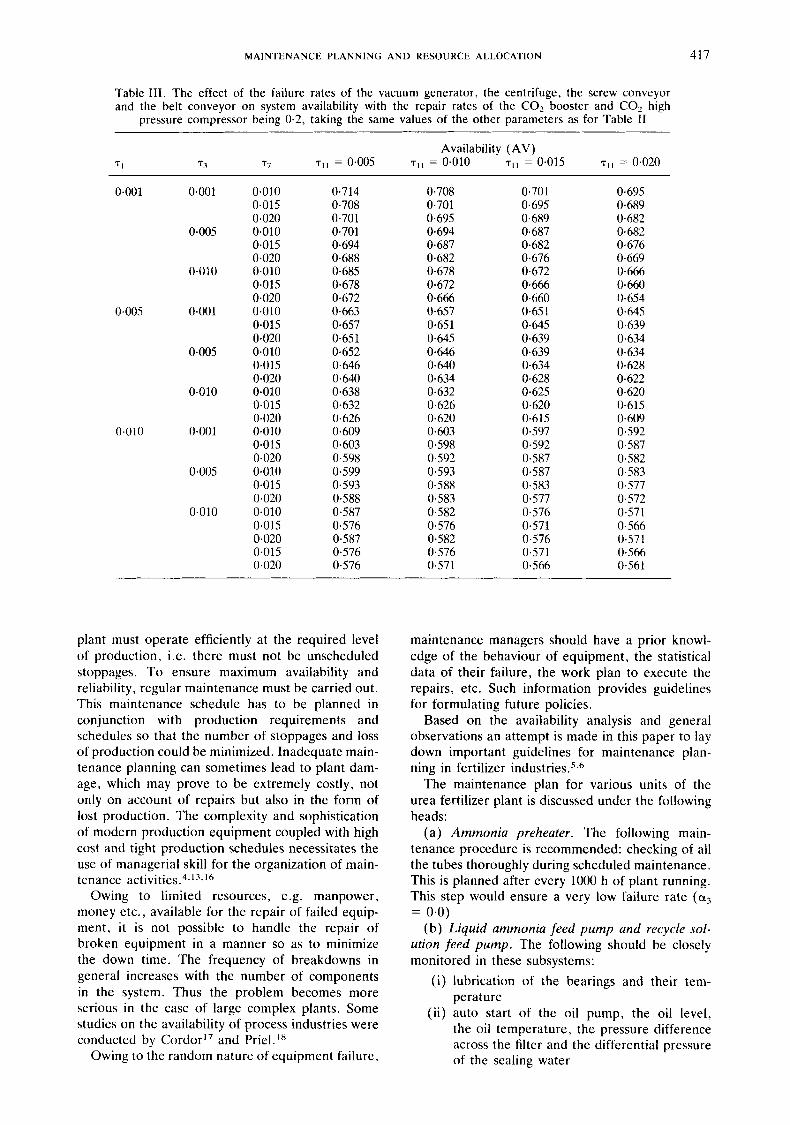
Tables I11 and IV show that increasing the repair rates of the CO, booster and C 0 2 high pressure compressor leads to increased availability. For example, reducing the repair time from 10 h to 5 h increases the availability by 10 per cent and a further
reduction in repair time to 3-33 h increases the avail- ability by another 4 per cent. It can be observed from Tables 11-IV that by employing the available repair facilities in the best possible manner a mini- mum possible repair time of 4 h should be achieved. It is therefore desirable to have units in standby. Field investigations have shown that the CO, boos- ter and high pressure compressor are costly, and is not easy to provide them with standbys. Tables 11-IV show that an increase in failures of the vac- uum generator from once in 1000 h to once in 200 h reduces the availability sharply, whereas an increase in failure rate in any of the centrifuges from 0.001 to 0.005 has little effect upon system availability because five centrifuges work simultaneously in par- allel. An increase in the failure rate of the screw conveyor from once in 100 h to three times in 200 h reduces the availability by 0.667 per cent. A similar effect is observed for an increase in the failure rate of the belt conveyor from 0.005 to 0.01.
MAINTENANCE
To produce profitable products, it is necessary to produce the right quality of goods at the right price and delivered at the right time. To achieve this the
MAINTENANCE PLANNING A N D RESOURCE ALLOCATION 417
Table 111. The effect of the failure rates of the vacuum generator, the centrifuge, the screw conveyor and the belt conveyor on system availability with the repair rates of the COr booster and COz high
pressure compressor being 0.2, taking the same values of the other parameters as for Table I1
Availability ( A V ) 71 73 77 711 = 0.005 71, = 0.010 711 = 0.015 711 = 0.020
0,002
0.005
0410
0.001
0.005
0.010
0.001
0.005
0.010
0.001
0.005
0.010
0.010 0.015 0.020 0.010 0.015 0.020 0.010 0.015 0.020 0.010 0.015 0.020 0.010 0.015 0.020 0.010 0.015 0.020 0.010 0.015 0.020 0.010 0.015 0.020 0.010 0.015 0.020 0.015 0.020
0.714 0.708 0.701 0.701 0.694 0.688 0.685 0.678 0.672 0.663 0.657 0.65 1 0.652 0.646 0.640 0.638 0.632 0.626 0.609 0.603 0.598 0.599 0.593 0.588 0,587 0.576 0.587 0.576 0.576
0.708 0.701 0.695 0.694 0.687 0.682 0.678 0.672 0.666 0.657 0.651 0.645 0.646 0.640 0.634 0.632 0.626 0-620 0.603 0-598 0.592 0.593 0.588 0.583 0.582 0.576 0.582 0.576 0.571
0.701 0.695 0.689 0.687 0.682 0.676 0.672 0.666 0.660 0.65 1 0.645 0.639 0.639 0.634 0.628 0.625 0.620 0.615 0.597 0.592 0.587 0.587 0.583 0,577 0.576 0471 0.576 0.571 0.566
0.695 0.689 0.682 0.682 0.676 0,669 0.666 0.660 0.654 0.645 0.639 0.634 0.634 0.628 0.622 0.620 0.615 0.609 0.592 0.587 0.582 0.583 0.577 0.572 0.571 0.566 0.571 0.566 0.561
plant must operate efficiently at the required level of production, i.e. there must not be unscheduled stoppages. To ensure maximum availability and reliability, regular maintenance must be carried out. This maintenance schedule has to be planned in conjunction with production requirements and schedules so that the number of stoppages and loss of production could be minimized. Inadequate main- tenance planning can sometimes lead to plant dam- age, which may prove to be extremely costly, not only on account of repairs but also in the form of lost production. The complexity and sophistication of modern production equipment coupled with high cost and tight production schedules necessitates the use of managerial skill for the organization of main- tenance a ~ t i v i t i e s . ~ ~ " ~ ' ~
Owing to limited resources, e.g. manpower, money etc., available for the repair of failed equip- ment, it is not possible to handle the repair of broken equipment in a manner so as to minimize the down time. The frequency of breakdowns in general increases with the number of components in the system. Thus the problem becomes more serious in the case of large complex plants. Some studies on the availability of process industries were conducted by Cordor" and Priel. IX
Owing to the random nature of equipment failure,
maintenance managers should have a prior knowl- edge of the behaviour of equipment, the statistical data of their failure, the work plan to execute the repairs, etc. Such information provides guidelines for formulating future policies.
Based on the availability analysis and general observations an attempt is made in this paper to lay down important guidelines for maintenance plan- ning in fertilizer
The maintenance plan for various units of the urea fertilizer plant is discussed under the following heads:
(a) Ammonia preheater. The following main- tenance procedure is recommended: checking of all the tubes thoroughly during scheduled maintenance. This is planned after every 1000 h of plant running. This step would ensure a very low failure rate (a3
(b) Liquid ammonia feed pump and recycle sol- ution feed pump. The following should be closely monitored in these subsystems:
(i) lubrication of the bearings and their tem- perature
(ii) auto start of the oil pump, the oil level, the oil temperature, the pressure difference across the filter and the differential pressure of the sealing water
= 0.0)

418 D. KUMAR AND P. C . PANDEY
Table IV. The effect of the failure rates of the vacuum generator, the centrifuge, the screw conveyor and the belt conveyor on system availability with the repair rates of the COz booster and COz high
pressure compressor being 0.3, taking the same values of the other parameters as for Table I1
0.001 0.001 0.010 0.015 0.020
0.005 0.010 0.015 0.020
0.010 0.010 0.015 0.020
0.005 0.001 0.010 0.015 0.020
0.005 0.010 0.015 0.020
0.010 0.010 0.015 0.020
0.010 0.001 0.010 0.015 0.020
0.005 0.010 0.015 0.020
0.010 0.010 0.015 0.020
0.756 0.749 0.742 0.742 0.735 0.728 0.725 0.718 0.711 0.690 0.696 0.689 0.690 0.683 0.677 0.675 0-669 0.663 0.645 0-639 0.633 0.632 0.626 0.620 0.622 0.616 0.610
0-749 0.742 0.736 0.735 0.728 0.722 0.718 0.711 0.705 0.683 0.689 0.683 0.683 0.677 0.671 0-669 0.662 0.656 0.639 0.633 0.627 0.626 0.620 0.615 0.616 0.610 0.605
0.742 0.736 0.729 0.728 0.722 0.715 0.71 1 0.705 0.699 0.677 0.683 0.677 0.677 0.671 0.665 0.662 0.656 0.651 0.632 0.627 0.621 0.620 0.615 0.609 0.610 0.605 0.599
0.736 0.729 0.722 0.722 0.715 0.709 0.705 0.706 0.692 0.671 0.677 0.671 0.671 0.665 0.659 0.657 0.651 0.645 0.627 0.621 0.616 0.615 0.609 0.604 0.605 0.599 0.594
(iii) that immediate attention is given to the repair of the pump irrespective of its standby unit.
These measures have been found to reduce the failure rate from once in 600 h for the liquid ammonia feed pump and once in 400 h for the recy- cle solution feed pump.
(c) Reboiler, low and high pressure absorber, gas separator and heat exchanger. The maintenance must be planned in advance and thorough checking of each part be carried out during the period of shut down which is organized after every 1000 h of plant operation. This would ensure failure-free running of the plant, i.e. a, = 0.0 for i = 6,7,8,9,10,1€.
(d) Screw conveyor and distributor. Failure in these units occurs mainly due to choking of excess material. Providing an unskilled worker who can keep a regular watch and report any malfunctioning immediately would reduce the failure rate in the screw conveyor from once in 200 h to once in 400 h, and no failure in the distributor
(e) Vacuum generator. Effort must be made to achieve a low failure rate for this unit, and in no case should it exceed once in 200 h, i.e. if the failure exceeds this limit then the unit is to be replaced by a new one. The repair in the failed unit should be undertaken immediately by a skilled worker and instructions issued for its thorough checking. ‘9.20
Taking into account the above maintenance pro-
= 0.0
gramme in various units and putting the assumed values of failure and repair rates in equation (5) the availability of the urea fertilizer production pro- cess with reduced failure rate and reduced repair time is given as
Comparing Table V with Table 111 we observe that through proper maintenance planning the avail- ability of the system can be increased by 5 per cent. Further improvement in the system availability is achieved by providing standby units for the CO, booster and CO, high pressure compressor, i.e. reducing the failure rate to T~ = 73 = 0-0, which would yield AV3 = 0.987, thus improving the avail- ability of the total system by about 2 per cent.
have suggested some measures to be adopted by the manager/section officer of the plant to reduce unwanted failures in the system through the following steps:
(i) reduce the delay in information to the section
(ii) provide instruction manuals and supporting
(iii) minimize the delay in starting repairs
Kumar et
officer
software

MAINTENANCE PLANNING A N D RESOURCE ALLOCATION 419
Table V. The effect of the failure rates of the vacuum generator, the centrifuge, the screw conveyor and the belt conveyor
0.001 0.001 0.010 0.015 0.020
0.005 0.010 0.015 0.020
0.010 0.010 0.015 0.020
0.005 0.010 0.010 0.015 0.020
0.005 0.010 0.015 0.020
0.01 0.010 0.015 0.020
0.758 0.757 0.744 0.744 0.743 0.730 0.727 0.726 0.713 0.704 0.703 0.691 0.692 0.691 0.679 0.677 0.676 0.664
0.751 0.744 0.737 0.737 0.730 0.723 0.720 0.713 0.707 0.697 0.691 0.685 0.685 0.679 0.673 0.670 0.664 0.658
0.744 0.737 0.73 1 0.730 0.723 0.717 0.713 0.707 0.700 0.691 0.685 0.678 0.679 0.673 0.666 0.664 0.658 0.652
0.737 0.731 0.724 0.723 0.717 0.710 0.707 0.700 0.694 0.685 0.678 0.672 0.673 0.666 0.660 0.658 0.652 0.646
(iv) use trained workers who can undertake repairs of the failed equipment efficiently; their knowledge and skill must be updated periodically through educatiodtraining
(v) use a scientific approach to maintenance/ repairs
(vi) study the causes of increased failure rates of units.
RESOURCE ALLOCATION
Achieving economic and reliable performance of the types of systems, discussed earlier, is important for their survival in the commercial world. Several steps that can be taken to achieve this are the use of large safety factors, reducing the system complexity, increasing the use of reliable components, planning the maintenance and repair schedule, etc.
For an existing system, planned maintenance and repair schedules are effective means of ensuring high system reliability. In this paper the urea fertilizer plant has been modelled as a k-stage system in series and the effort needed for its maintenance (or the benefit derived therefrom) has been expressed as a function of input variables, e.g. cost and manpower, with a view to optimizing the objective function (maintenance effort).
THE MODEL
A process industry normally consists of k stages in series operating under constraints such as avail- ability of maintenance resources, manpower etc. Such a problem can be treated as a multistage decision problem. At stage j , a decision must be made regarding the amount of resource to be allo- cated to activity j (i.e. c,). The decision for the kth
stage of the problem can be made on the basis of allocations made at the previous k-1 stages. The optimum allocation (c,, j = 1 , 2 , . . . , k ) would also depend on the total quantity of the resource E avail- able for allocation to the k stages. If stage j com- prises xi components with reliability pi, then the resource allocated at the jth stage will be xi = (cJ /F , ) or cj = F,x,. F , is known as the coefficient for component cost.
The reliability of successful operation of stage j , R,(cj), when the resource allocated to that stage is cJ is given by- ’2-24
Since all the k stages are in series, the overall reliability of the system is given by
k
R, = R I R *... RJ = n R J ( c , ) I - 1
k
= f l [ l - ( l -p , ) rJ ’F1] / = 1
or
where
+j( c j ) = lnR,( c,) = In[ 1 - ( 1 -pj)cj’Fl]
The management is normally interested in the solution of the following problem:
MaximizeZ= C +i(cj) ,cj>O, j=1,2 ,..., k (7) k
j = I

D . KUMAR AND P. C . PANDEY 420
subject to
k 2 c;xj 5 c1 ;= 1
maintenance resource constraints)
k
C mi C, I c2 ;= 1
maintenance manpower budget constraints) and
where c1 is the total maintenance resource available (excluding manpower) and c2 is the total available manpower budget for maintenance. x, and mi are the number of components and manpower, respect- ively, at the jth stage and are known beforehand. Since the manpower required for maintenance depends on the number of units/components at stage j , the manpower cost 2, can be taken to be pro- portional to c,, i.e. C, = F2c, (i.e. for a greater num- ber of components the cost will be more, hence the manpower cost will also be more (in general). F2 is known as the coefficient of manpower cost and lies in the range 0 < F2 < 1.
Introducing Lagrange’s multiplier A the problem becomes
k k
Maximize 2, = c +,(c,)-A c rn, cj F2(c, > 0 ) ;= 1 ;= 1
subject to
k 2 cjxj 5 c j = 1
The recursive equation for the n stage problem is as follows:
Raw cost data for the operation of the plants have been obtained from their accounts books. For the missing data use has been made of the experience and judgement of experts.
Based on the information thus gathered, estimates were made regarding allocation of optimum capital to each stage so as to achieve maximum system availability.
For urea fertilizer industries the values F, = 6.0 and F2 = 0-8 for component cost coefficients have been suggested by the plant personnel concerned.
The values of the best possible steady-state avail- abilities have been taken for respective stages from
the analysis given above. The data are tabulated in Table VI.
Starting with the first stage for each industry, a table (see Table VII) can be prepared for each stage for the given values of the state functions and using the recursive relationship. The value of allocation for which the state function is maximum is deter- mined for each value of A. These are checked against the available resources. Then a new value of X is chosen and the allocation is repeated. The process is continued until the given constraints are satisfied. Table VIII gives the values of allocated money for different values of the Lagrange multiplier A.
Table VIII clearly shows that decrease in the value of A increases the availability, which leads to the requirement of more money both for mainte- nance and manpower. Hence, subject to the avail- able resources, an appropriate value of X is taken so as to allocate the money to each stage for achieving optimum system reliability, i.e. for maximum profit with available factory conditions. Also, for a given value of e a relation giving optimum reliability with minimum allocated resources can be achieved by differentiating equation (9) with respect to the cost c, and equating to zero; this yields
Since &fn(~)ldcj] is negative for c, > 0, the relation given by (10) is the condition for maximum reliability for a given value of money.
ECONOMIC PRODUCTION CHART
The data in Table VIII will guide the process engin- eer to choose an appropriate level of maintenance according to his factory requirements. However, a certain minimum level must be maintained so as to achieve the minimum required profit. The analysis shows that the system availability increases with the increase of the maintenance and the manpower cost. Profit increases with the increase of the availability and profit fluctuates with the increase of the variable cost (i.e. maintenance cost + manpower cost). Con- sidering that sales are proportional to system avail- ability (assuming that the fixed cost is about 30 per
Table VI. Data table for the fertilizer industry
Stages 1 2 3 4
System reliability 0.80 0-95 0.85 0.90 No. of components 5 4 5 3 No. of personnel 8 3 6 5 Permitted range 90.0 to 115
cost Permitted range 1204 to 165.0
of maintenance
of manpower cost

MAINTENANCE PLANNING A N D RESOURCE ALLOCATION 42 1
Table VII. Process of computation. The recurrence formula used is f , , ( ~ ) = Max{ln[l-(1-p,(','5]-0~8Am,,+f,,..,(~-c~,,{ } and X,C,?E
A 0-001 0.002 0.003 E stage f(E) C(E) E stage f ( e ) C(E) E stage f ( ~ ) C(E)
5 10 15 20 25 30 35 40 41 42 43
10 20 30 31 32 20 40 41 42 43
20 22 24 26 27 28
- 1.4790 -0-9430 -0-6888 - 0.5465 -0.4632 -0.4151 -0.3900 -0.3804 -0.3799 -0.3798 -0.3800
-0.7421 -0.5138 -0.4757 -0.4753 -0.4824
-0.9030 -0.7503 -0.7499 -0.7497 -0.7499
-0.9103 -0.8995 -0.8932 -0.8903 -0.8898 -0.8899
1 5
10 15 20 23 24 24 24
1 5
10 15 20
1 10 20 30 33
20 30 31 32
20 25 26 27 28 20 30 31 32 33
20 21 22 23
-0.6745 5 -0.6071 10 -0.6070 15 -0.6076 20
-0.7889 10 -0.7721 20 -0.7715 25 -0-7715 28 -0.7721 29
-1.2952 10 -1.2220 20 -1,2209 28 -1.2205 29 -1.2208 30 - 1.4611 - 1.4590 - 1.4583 -1.4587
20 24 25 26 27
21 22 23 24
25 26 27 28
18 19 20 21
-0.8025 10 -0.7837 20 -0.7832 24 -0.7840 25 -0.7862 26
-1.0099 10 -1.0079 20 -1.0071 30 -1.0073 32
-1.5975 10 -1.5961 20 -1.5960 30 -1.5969 36
- 1.9173 -1.9161 - 1.9166 -1.9185
Table VIII. Cost allocation with different values of A
0.001 0.002 0.003
Allocation 42, 31, 31, 26, 25, 23, 42, 27 32, 22 27, 19
Maintenance cost 142 111 94 Manpower cost 185.85 161.8 121.3 Optimum reliability 0.78896 0.635444 0-52012 Cost of sales 558.66 473.3 411-99
cent of the total cost), the relation for cost of sales C, is given as
C, = (Maximum availability)
x (Maintenance cost + Manpower cost)
+ Fixed cost
The sales cost for the urea product is taken as 10 units per ton of production. Figure 6, based on the information given in Table VIII, shows that the break-even point (BEP) is low, i.e. 34 per cent and the increase in profit is also large at high system availability.
The analysis presented herein should help process engineers to consider the application of optimization techniques in making a decision regarding resource
allocation. It is hoped that the technique for the problem modelling and for controlling the process through optimization will motivate personnel to undertake creative investigations so that the tend- ency of accepting the past practice without proper scrutiny is minimized.
CONCLUSION
Urea synthesis system
Failure rate and repair times must be controlled in the following order of preference: C 0 2 high pressure compressor, C 0 2 compressor and ammonia preheat- er .
Attention should be given to the liquid ammonia feed pump and the recycle solution feed pump so as to achieve quick repairs.
Decomposition system
The analysis shows that, since there is no mechan- ical operation in any part of the system, failure of the system is analysed only through the quality level and the quantity of urea production. If quality or quantity goes down beyond a limit then a shutdown must be declared to perform the overall main- tenance.

422 D. KUMAR AND P. C. PANDEY
900
aoo
700
0 600
m - - 5 500 - x a2
C O 400 z
300
2 00
100
0 0.0 0-1 0 . 2 0.3 0 . 4 0.5 0.6 0.7 0 .8 0.9 1.0
S y s t e m availability [Av]
Figure 6. Economic chart for urea fertilizer industry
Crystallization system
Failure and repair times must be controlled in the following order of preference through maintenance: crystallizer pump, slurry feed pump, vacuum gener- ator, crystallizer and centrifuges.
Urea prilling system
Attention should be given to controlling the fail- ure rate in the screw conveyor and the strainer.
The failure and repair times must be controlled in the following order of preference: screw conveyor, strainer, cyclone, melter and distributor.
Advanced planning for the equipment repair should be undertaken during shutdown, preventive maintenance should be arranged for critical equip- ment.
For the conditions assumed the value of the break- even system availability has been evaluated as 35 per cent.
REFERENCES 1. S. P. Applebaum, ‘Steady state reliability of systems of mutu-
ally independent subsystems’. IEEE Trans. Reliability, R- 14, ( l ) , (1965).
2.
3.
4.
5.
6.
7.
8.
9.
10.
11.
12.
13.
14.
D. H. Allen, ‘Economic aspect of plant reliability’, The Chemical Engineer, October 1973, pp. 467-470. D. Kumar, Jai Singh and P. C. Pandey, ‘Behaviour analysis of urea decomposition system with general repair policy in fertilizer industry’, Micro & Reliab. (in press). D. Kumar, Jai Singh and P. C. Pandey, ‘Process design for crystallization system in the urea fertilizer industry’, Micro & Reliab. (in press). J. Singh, ‘Reliability of a fertilizer production supply prob- lem’, Proc. ISPTA, Wiley Eastern, 1984, pp. 92-94. J. Singh, ‘Priority concept in fertilizer supply’, Proc. INSCA,
M. Neale et al., A Guide to Condition Monitoring, HMSO, 1979. F. Nixon, Managing Costs to Achieve Quality and Reliability, McGraw-Hill, New York, 1971. D. Norman, ‘Incorporating operational experience and design changes in availability forecasts’, Reliab. Eng. and System Safety, 20, 245-261 (1988). W. E. McFalter, ‘Reliability experiences in a large refinery’, Chem. Eng. Progress, 68, 52-55 (1972). S. B. Bennet, A. L. Ross and P. Z. Zemanick, Failure Prevention and Reliability, American Society of Mechanical Engineers, New York, 1977. D. C. Freshwater and B. A. Buffham, ‘Reliability engineer- ing for the process plant industries’, The Chemical Engineer, October 1969, pp. 367-369. W. J. Foster, D. T. Phillips and T. R. Rogers, Reliability, Availability and Maintainability-The Assurance Techno- logies Applied to the Procurement of Produciion System, MIA Press, Beaverton, Oregon, 1981. R. E. Lenz, ‘Reliability design in process plant’, Chem. Eng. Progress, 66, (December), 42-44 (1970).
1984, pp. 10-13.

MAINTENANCE PLANNING A N D RESOURCE ALLOCATION 423
15. R. P. Lee, ‘Systematized failure analysis-some unusual fail- ure modes’, The Chemical Engineer, March 1975,
16. Y. H. Kim, K. E. Case and P. M. Chase, ‘A method of computing complex system reliability’, IEEE Trans. Reliability, R-21, 215-219 (1972).
17. C. G. Cordor, ‘Maintenance techniques and outlook’, Sern- inar Publication, British Productivity Council, 1973, Section
18. V. Z . Priel, Systematic Maintenance Organization, McDonald and Sons, London, 1974.
19. G. P. William, ‘Cause of ammonia plant shutdown’, Chem. Eng. Progress, 74, (September), 88-93 (1978).
20. E. N. White, Maintenance Planning Control and Docu- mentation, Gower, England, 1979.
21. D. Kumar, Jai Singh and P. C. Pandey, ‘Designing for reliable operation of urea synthesis in fertilizer industry’, Microelectron. & Reliab., 30, (6), 1021-1024 (1990).
22. R. E. Bellman and S. E. Drefus. Applied Dynamic Pro- gramming, Princeton University Press, Princeton, 1962.
23. R. E. Barlow and Proschan, Mathematical Theory of Reliability, Wiley, New York, 1965.
24. K. B. Misra. ‘Dynamic programming formulation of redun- dancy allocation problem’, Int. J . Maths. Educ. Sci. Technol.,
25. D. E. Bently and C. P. Reid, ‘Unreliability factors in chemi- cal plants’, Chem. Eng. Progress, 66, (December), 50-52 ( 1970).
26. W. A. Holmes, ‘A new technique for the calculation of chemical plant availability at the designed stage’, Institute of Chemical Engineers Design Congress, Aston University.
27. T. H. Naylor, J . L. Balintfy, D. S. Burdick and K. Chu, Computer Simulation Techniques, Wiley, New York, 1966.
28. H. E. Schweyer, Process Engineering Economics, McGraw- Hill Chemical Engineering Series, Tokyo, 1955.
29. K. Seiler 111, Introduction to Systems Cost Effectiveness, Wiley Interscience, New York, 1969.
30. J. Singh, ‘Redundancy in fertilizer production’, Proc ORSI,
31. J. Singh, ‘A DDP approach to reliability optimization of a
pp. 107-128.
6. pp. 73-77.
2, 207-215 (1971).
1976, F-4, pp. 1-10.
1980, pp. 1-5.
fertilizer supply system’, Silver Jubilee Research Bulletin, IIT, Bombay, 1982.
Authors’ biographies:
P. C. Pandey is a Professor in the Mechanical and Indus- trial Engineering Department, and Dean of Research and Industrial Liason at the University of Roorkee, Roorkee- 247667, India. At present he is working Chairman of the Department of Industrial Engineering and Management of the Asian Institute of Technology, Bangkok.
H e graduated in Mechanical Engineering from B.H.U., Varansi, India in 1957. H e obtained a Post-graduate Dip- loma in Production Engineering from King’s College, Newcastle upon Tyne and a Ph.D. degree from the Uni- versity of Nottingham, U.K. H e has 32 years of research, teaching and industrial experience. H e has to his credit a very large number of publications in international/ national journals and conferences, and has guided a large number of students for their Ph.D. degrees. He is the author of three textbooks in production/industrial engin- eering. His current research interests are unconventional metal machining, computer-aided manufacturing and industrial engineering.
Dinesh Kumar is an Assistant Professor in the Mechanical Engineering Department of the Regional Engineering College, Kurukshetra 132119, India.
H e obtained a B.Sc. degree from Meerut University in 1976. He did his Mechanical Engineering with Hons from Punjab University in 1980 and a Master’s Degree (M.E.) in Mechanical Engineering with Hons from Roorkee Uni- versity in 1984. He has about 10 years of researchheaching and industrial experience and 25 published research pap- ers to his credit in international journals/conferences. H e has guided a number of students for their Master’s degree.
His field of interest is system behaviour in industry, process planning and optimization.