maintenance assessment & funding needs for the · maintenance assessment & funding needs...
TRANSCRIPT
2016
SCDOT Maintenance Division SCDOT
1/1/2016
SCDOT Maintenance Assessment Program Annual Report
Maintenance Assessment & Funding Needs for the
South Carolina State Primary and Secondary
Highway System
2
South Carolina Department Of Transportation Maintenance Assessment Program (MAP) Report2016
Table of Contents
Executive Summary ................................................................................................................................................ 3
Background: ............................................................................................................................................................ 3
Description: ............................................................................................................................................................. 4
Evaluation ............................................................................................................................................................... 7
Level of Service .................................................................................................................................................. 7
Results ..................................................................................................................................................................... 8
System Needs ........................................................................................................................................................ 15
Growth – Population and DVMT ..................................................................................................................... 15
Funding Needs ...................................................................................................................................................... 17
MAP Projection ................................................................................................................................................ 17
Pavement Management Program Projection ..................................................................................................... 22
Resurfacing Projection ...................................................................................................................................... 27
Backlog Cost ......................................................................................................................................................... 28
Minimum Acceptable Levels of Service ............................................................................................................... 28
Summary and Conclusions ................................................................................................................................... 28
Addendum ............................................................................................................................................................. 30
Appendix A ....................................................................................................................................................... 31
Appendix B ....................................................................................................................................................... 32
3
South Carolina Department Of Transportation Maintenance Assessment Program (MAP) Report2016
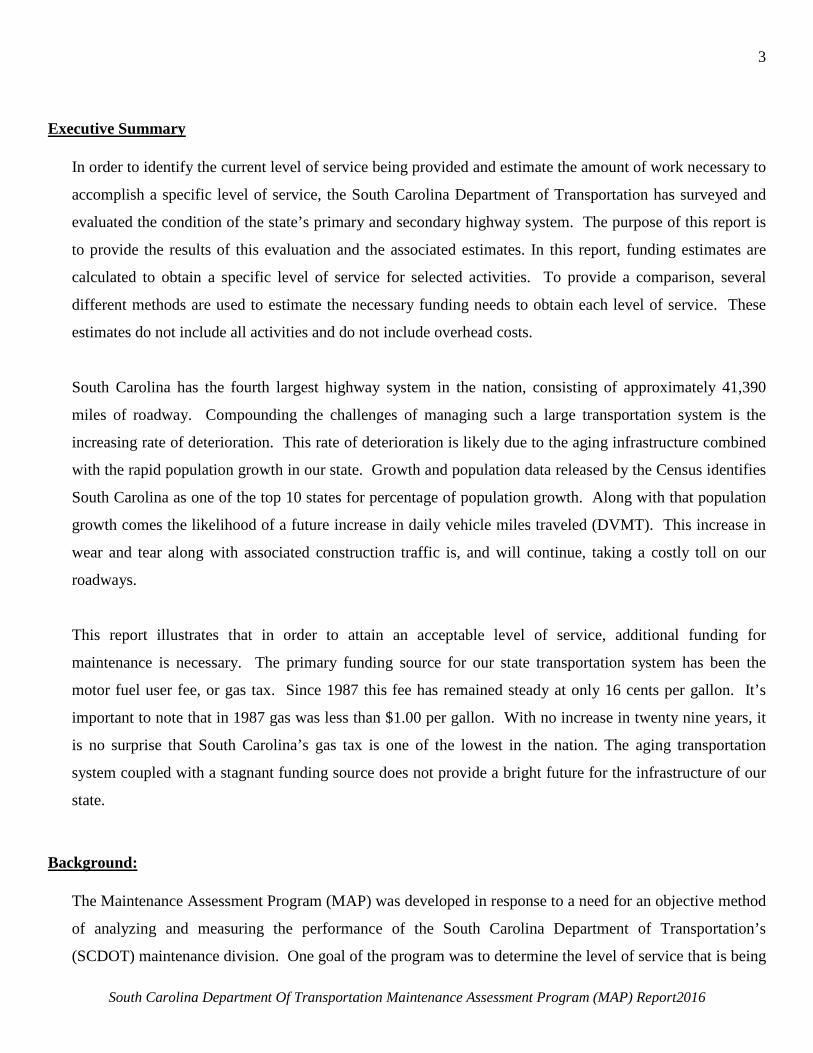
Executive Summary
In order to identify the current level of service being provided and estimate the amount of work necessary to
accomplish a specific level of service, the South Carolina Department of Transportation has surveyed and
evaluated the condition of the state’s primary and secondary highway system. The purpose of this report is
to provide the results of this evaluation and the associated estimates. In this report, funding estimates are
calculated to obtain a specific level of service for selected activities. To provide a comparison, several
different methods are used to estimate the necessary funding needs to obtain each level of service. These
estimates do not include all activities and do not include overhead costs.
South Carolina has the fourth largest highway system in the nation, consisting of approximately 41,390
miles of roadway. Compounding the challenges of managing such a large transportation system is the
increasing rate of deterioration. This rate of deterioration is likely due to the aging infrastructure combined
with the rapid population growth in our state. Growth and population data released by the Census identifies
South Carolina as one of the top 10 states for percentage of population growth. Along with that population
growth comes the likelihood of a future increase in daily vehicle miles traveled (DVMT). This increase in
wear and tear along with associated construction traffic is, and will continue, taking a costly toll on our
roadways.
This report illustrates that in order to attain an acceptable level of service, additional funding for
maintenance is necessary. The primary funding source for our state transportation system has been the
motor fuel user fee, or gas tax. Since 1987 this fee has remained steady at only 16 cents per gallon. It’s
important to note that in 1987 gas was less than $1.00 per gallon. With no increase in twenty nine years, it
is no surprise that South Carolina’s gas tax is one of the lowest in the nation. The aging transportation
system coupled with a stagnant funding source does not provide a bright future for the infrastructure of our
state.
Background:
The Maintenance Assessment Program (MAP) was developed in response to a need for an objective method
of analyzing and measuring the performance of the South Carolina Department of Transportation’s
(SCDOT) maintenance division. One goal of the program was to determine the level of service that is being
4
South Carolina Department Of Transportation Maintenance Assessment Program (MAP) Report2016
provided to South Carolina’s motorists. This would also allow a calculation of the amount of improvement
that would be required to obtain higher levels of service, and the associated cost of these improvements.
Another benefit of this program is that a consistent expectation of performance has been established for the
entire state. Areas that need improvement have been identified and available resources can be directed to
these areas. In some cases, improvement plans and programs have been developed in an effort to improve
the performance.
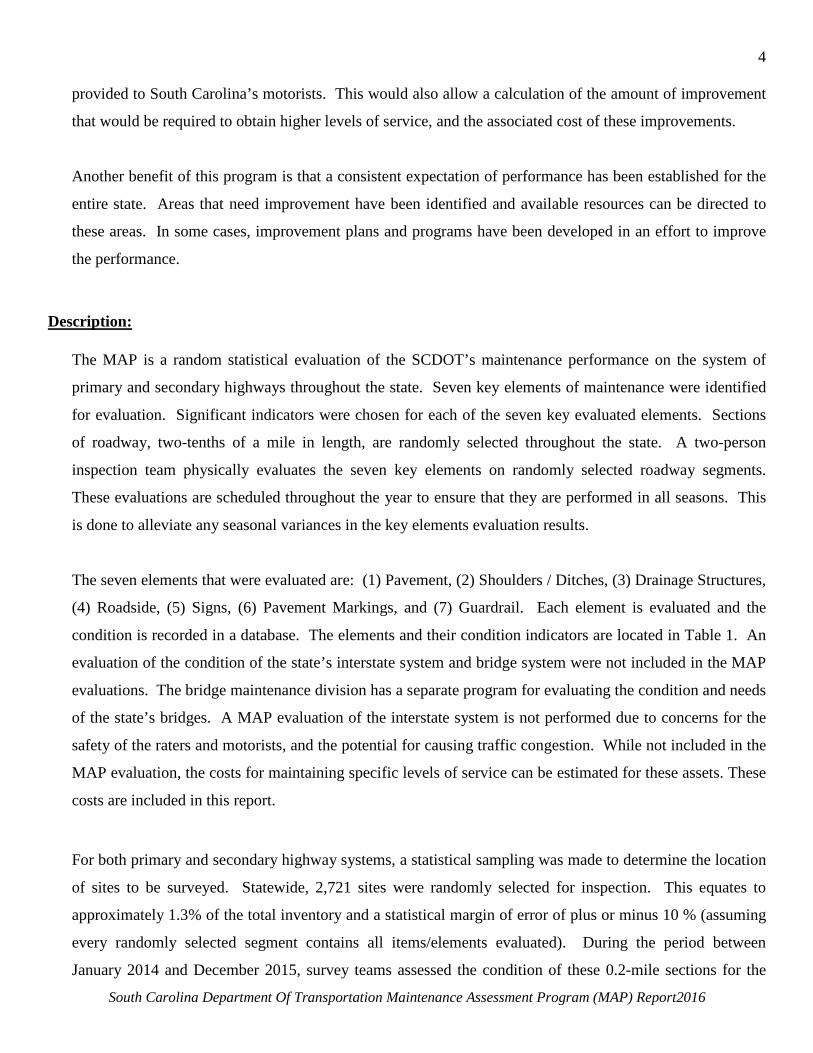
Description:
The MAP is a random statistical evaluation of the SCDOT’s maintenance performance on the system of
primary and secondary highways throughout the state. Seven key elements of maintenance were identified
for evaluation. Significant indicators were chosen for each of the seven key evaluated elements. Sections
of roadway, two-tenths of a mile in length, are randomly selected throughout the state. A two-person
inspection team physically evaluates the seven key elements on randomly selected roadway segments.
These evaluations are scheduled throughout the year to ensure that they are performed in all seasons. This
is done to alleviate any seasonal variances in the key elements evaluation results.
The seven elements that were evaluated are: (1) Pavement, (2) Shoulders / Ditches, (3) Drainage Structures,
(4) Roadside, (5) Signs, (6) Pavement Markings, and (7) Guardrail. Each element is evaluated and the
condition is recorded in a database. The elements and their condition indicators are located in Table 1. An
evaluation of the condition of the state’s interstate system and bridge system were not included in the MAP
evaluations. The bridge maintenance division has a separate program for evaluating the condition and needs
of the state’s bridges. A MAP evaluation of the interstate system is not performed due to concerns for the
safety of the raters and motorists, and the potential for causing traffic congestion. While not included in the
MAP evaluation, the costs for maintaining specific levels of service can be estimated for these assets. These
costs are included in this report.
For both primary and secondary highway systems, a statistical sampling was made to determine the location
of sites to be surveyed. Statewide, 2,721 sites were randomly selected for inspection. This equates to
approximately 1.3% of the total inventory and a statistical margin of error of plus or minus 10 % (assuming
every randomly selected segment contains all items/elements evaluated). During the period between
January 2014 and December 2015, survey teams assessed the condition of these 0.2-mile sections for the
5
South Carolina Department Of Transportation Maintenance Assessment Program (MAP) Report2016
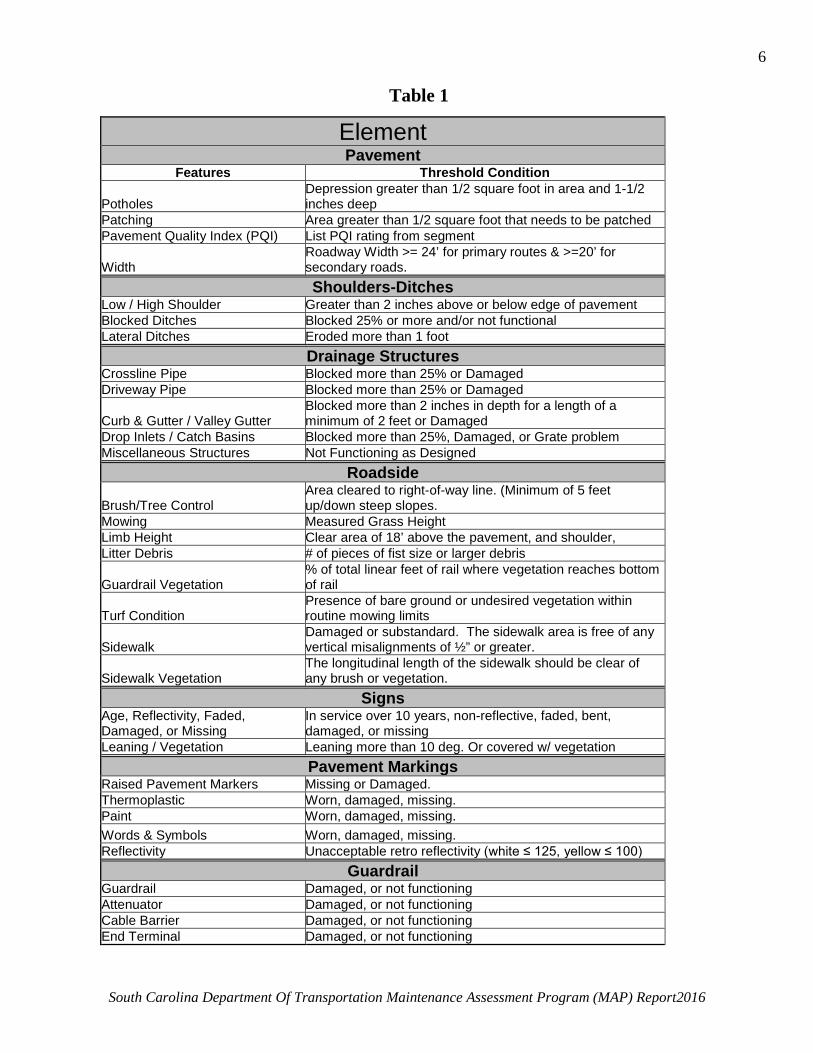
features shown in Table 1. The inventory of each element and the quantity of the deficient conditions were
recorded and summarized, and a maintenance condition rating calculated. From this assessment, the
necessary maintenance activities to achieve the various levels of service were determined along with their
estimated costs.
The data collected has been used to objectively determine the current level of service provided by the
maintenance division. This information permits a projection of the amount of work necessary to bring the
entire state’s maintenance service to a desirable level. A cost can be associated with this work to assist in
identifying funding needs. The program also points out the substandard areas to local SCDOT departments.
This information is used to assist with planning and the allocation of existing maintenance resources.
The specific features that were measured in each of the seven elements evaluated are identified in Table 1.
Also shown in this table are the threshold conditions that must be satisfied to qualify for measurement.
These threshold conditions are comparable with similar assessment programs used by other state
transportation departments.
6
South Carolina Department Of Transportation Maintenance Assessment Program (MAP) Report2016
Table 1
Element Pavement
Features Threshold Condition
Potholes Depression greater than 1/2 square foot in area and 1-1/2 inches deep
Patching Area greater than 1/2 square foot that needs to be patched Pavement Quality Index (PQI) List PQI rating from segment
Width Roadway Width >= 24’ for primary routes & >=20’ for secondary roads. Shoulders-Ditches
Low / High Shoulder Greater than 2 inches above or below edge of pavement Blocked Ditches Blocked 25% or more and/or not functional Lateral Ditches Eroded more than 1 foot
Drainage Structures Crossline Pipe Blocked more than 25% or Damaged Driveway Pipe Blocked more than 25% or Damaged
Curb & Gutter / Valley Gutter Blocked more than 2 inches in depth for a length of a minimum of 2 feet or Damaged
Drop Inlets / Catch Basins Blocked more than 25%, Damaged, or Grate problem Miscellaneous Structures Not Functioning as Designed
Roadside
Brush/Tree Control Area cleared to right-of-way line. (Minimum of 5 feet up/down steep slopes.
Mowing Measured Grass Height Limb Height Clear area of 18’ above the pavement, and shoulder, Litter Debris # of pieces of fist size or larger debris
Guardrail Vegetation % of total linear feet of rail where vegetation reaches bottom of rail
Turf Condition Presence of bare ground or undesired vegetation within routine mowing limits
Sidewalk Damaged or substandard. The sidewalk area is free of any vertical misalignments of ½” or greater.
Sidewalk Vegetation The longitudinal length of the sidewalk should be clear of any brush or vegetation.
Signs Age, Reflectivity, Faded, Damaged, or Missing
In service over 10 years, non-reflective, faded, bent, damaged, or missing
Leaning / Vegetation Leaning more than 10 deg. Or covered w/ vegetation Pavement Markings
Raised Pavement Markers Missing or Damaged. Thermoplastic Worn, damaged, missing. Paint Worn, damaged, missing. Words & Symbols Worn, damaged, missing. Reflectivity Unacceptable retro reflectivity (white ≤ 125, yellow ≤ 100)
Guardrail Guardrail Damaged, or not functioning Attenuator Damaged, or not functioning Cable Barrier Damaged, or not functioning End Terminal Damaged, or not functioning
7
South Carolina Department Of Transportation Maintenance Assessment Program (MAP) Report2016
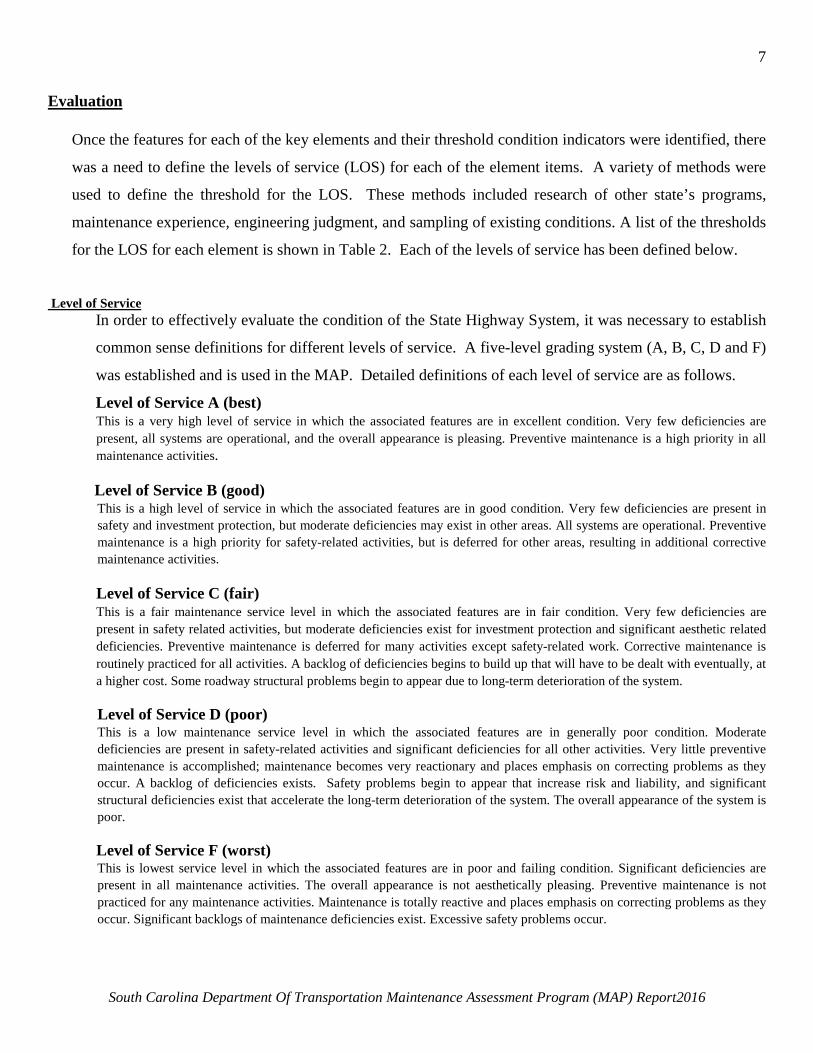
Evaluation
Once the features for each of the key elements and their threshold condition indicators were identified, there
was a need to define the levels of service (LOS) for each of the element items. A variety of methods were
used to define the threshold for the LOS. These methods included research of other state’s programs,
maintenance experience, engineering judgment, and sampling of existing conditions. A list of the thresholds
for the LOS for each element is shown in Table 2. Each of the levels of service has been defined below.
Level of Service
In order to effectively evaluate the condition of the State Highway System, it was necessary to establish
common sense definitions for different levels of service. A five-level grading system (A, B, C, D and F)
was established and is used in the MAP. Detailed definitions of each level of service are as follows.
Level of Service A (best) This is a very high level of service in which the associated features are in excellent condition. Very few deficiencies are present, all systems are operational, and the overall appearance is pleasing. Preventive maintenance is a high priority in all maintenance activities.
Level of Service B (good) This is a high level of service in which the associated features are in good condition. Very few deficiencies are present in safety and investment protection, but moderate deficiencies may exist in other areas. All systems are operational. Preventive maintenance is a high priority for safety-related activities, but is deferred for other areas, resulting in additional corrective maintenance activities.
Level of Service C (fair) This is a fair maintenance service level in which the associated features are in fair condition. Very few deficiencies are present in safety related activities, but moderate deficiencies exist for investment protection and significant aesthetic related deficiencies. Preventive maintenance is deferred for many activities except safety-related work. Corrective maintenance is routinely practiced for all activities. A backlog of deficiencies begins to build up that will have to be dealt with eventually, at a higher cost. Some roadway structural problems begin to appear due to long-term deterioration of the system.
Level of Service D (poor) This is a low maintenance service level in which the associated features are in generally poor condition. Moderate deficiencies are present in safety-related activities and significant deficiencies for all other activities. Very little preventive maintenance is accomplished; maintenance becomes very reactionary and places emphasis on correcting problems as they occur. A backlog of deficiencies exists. Safety problems begin to appear that increase risk and liability, and significant structural deficiencies exist that accelerate the long-term deterioration of the system. The overall appearance of the system is poor.
Level of Service F (worst) This is lowest service level in which the associated features are in poor and failing condition. Significant deficiencies are present in all maintenance activities. The overall appearance is not aesthetically pleasing. Preventive maintenance is not practiced for any maintenance activities. Maintenance is totally reactive and places emphasis on correcting problems as they occur. Significant backlogs of maintenance deficiencies exist. Excessive safety problems occur.
8
South Carolina Department Of Transportation Maintenance Assessment Program (MAP) Report2016
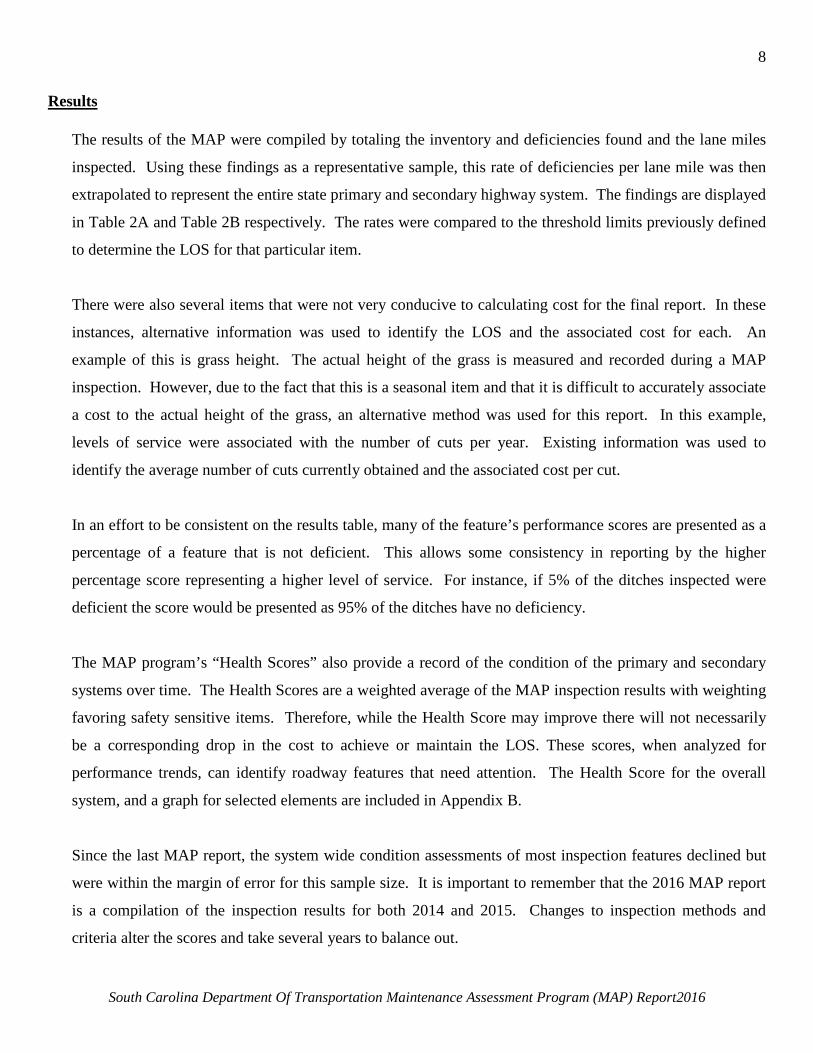
Results
The results of the MAP were compiled by totaling the inventory and deficiencies found and the lane miles
inspected. Using these findings as a representative sample, this rate of deficiencies per lane mile was then
extrapolated to represent the entire state primary and secondary highway system. The findings are displayed
in Table 2A and Table 2B respectively. The rates were compared to the threshold limits previously defined
to determine the LOS for that particular item.
There were also several items that were not very conducive to calculating cost for the final report. In these
instances, alternative information was used to identify the LOS and the associated cost for each. An
example of this is grass height. The actual height of the grass is measured and recorded during a MAP
inspection. However, due to the fact that this is a seasonal item and that it is difficult to accurately associate
a cost to the actual height of the grass, an alternative method was used for this report. In this example,
levels of service were associated with the number of cuts per year. Existing information was used to
identify the average number of cuts currently obtained and the associated cost per cut.
In an effort to be consistent on the results table, many of the feature’s performance scores are presented as a
percentage of a feature that is not deficient. This allows some consistency in reporting by the higher
percentage score representing a higher level of service. For instance, if 5% of the ditches inspected were
deficient the score would be presented as 95% of the ditches have no deficiency.
The MAP program’s “Health Scores” also provide a record of the condition of the primary and secondary
systems over time. The Health Scores are a weighted average of the MAP inspection results with weighting
favoring safety sensitive items. Therefore, while the Health Score may improve there will not necessarily
be a corresponding drop in the cost to achieve or maintain the LOS. These scores, when analyzed for
performance trends, can identify roadway features that need attention. The Health Score for the overall
system, and a graph for selected elements are included in Appendix B.
Since the last MAP report, the system wide condition assessments of most inspection features declined but
were within the margin of error for this sample size. It is important to remember that the 2016 MAP report
is a compilation of the inspection results for both 2014 and 2015. Changes to inspection methods and
criteria alter the scores and take several years to balance out.
9
South Carolina Department Of Transportation Maintenance Assessment Program (MAP) Report2016
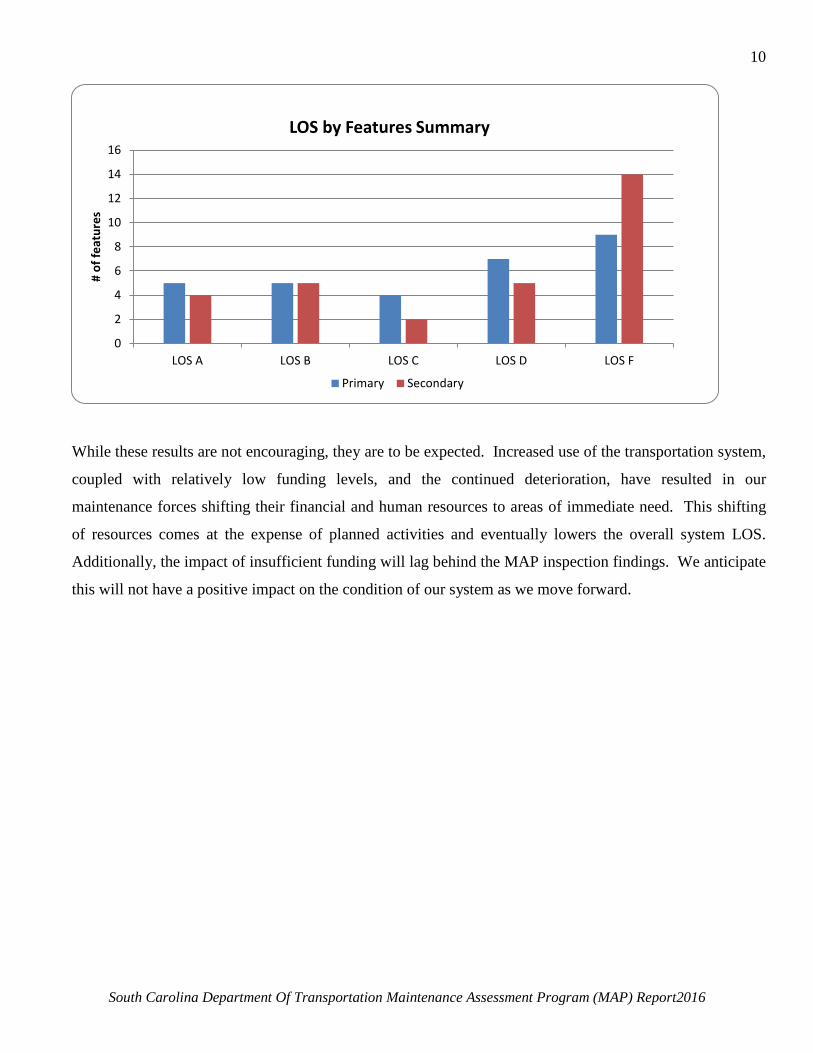
On primary routes, improvements were seen in fourteen inspection features. These features are: potholes,
patching, PQI, width, low/high shoulders, blocked ditches, lateral ditches, crossline pipes, driveway pipes,
miscellaneous drainage structures, brush & tree control, sign condition, paint, and words & symbols. All
improvements are within the margin of error, with the exception of crossline pipes, driveway pipes,
miscellaneous drainage structures.
Five primary route features remained relatively unchanged. These features are: mowing, thermoplastic,
guardrail, attenuator, and cable barrier.
Ten primary route features had negative trends for this report, but are within the margin of error for this
sample size. These features are: curb and gutter, drop inlets, limb height, litter, guardrail vegetation, turf
condition, sidewalk, sidewalk vegetation, leaning signs, raised pavement markers, and end terminals.
Raised pavement markers exhibited decline outside the margin of error. We believe that winter weather of
the last few years resulted in many raised pavement markers being removed by snow plows.
On secondary roads, improvements were seen in ten inspection features. These features are: roadway
width, driveway pipe, curb & gutter, miscellaneous structures, catch basins, limb height, guardrail
vegetation, thermo plastic, paint, guardrail and end terminals. All improvements are within the margin of
error, with the exception of driveway pipes, and drop inlets.
Six secondary road features remained relatively unchanged. These features are: lateral ditches, brush &
tree, mowing, turf condition, attenuator, and cable barrier.
Fourteen secondary road items had negative trends for this report but are within the margin of error for this
sample size. These features are: potholes, patching, PQI, low/high shoulders, blocked ditches, crossline
pipe, drop inlet/catch basins, litter, sidewalk, sidewalk vegetation, sign condition, leaning signs, raised
pavement markers, and words & symbols.
10
South Carolina Department Of Transportation Maintenance Assessment Program (MAP) Report2016
While these results are not encouraging, they are to be expected. Increased use of the transportation system,
coupled with relatively low funding levels, and the continued deterioration, have resulted in our
maintenance forces shifting their financial and human resources to areas of immediate need. This shifting
of resources comes at the expense of planned activities and eventually lowers the overall system LOS.
Additionally, the impact of insufficient funding will lag behind the MAP inspection findings. We anticipate
this will not have a positive impact on the condition of our system as we move forward.
0
2
4
6
8
10
12
14
16
LOS A LOS B LOS C LOS D LOS F
# of
feat
ures
LOS by Features Summary
Primary Secondary
11
South Carolina Department Of Transportation Maintenance Assessment Program (MAP) Report2016
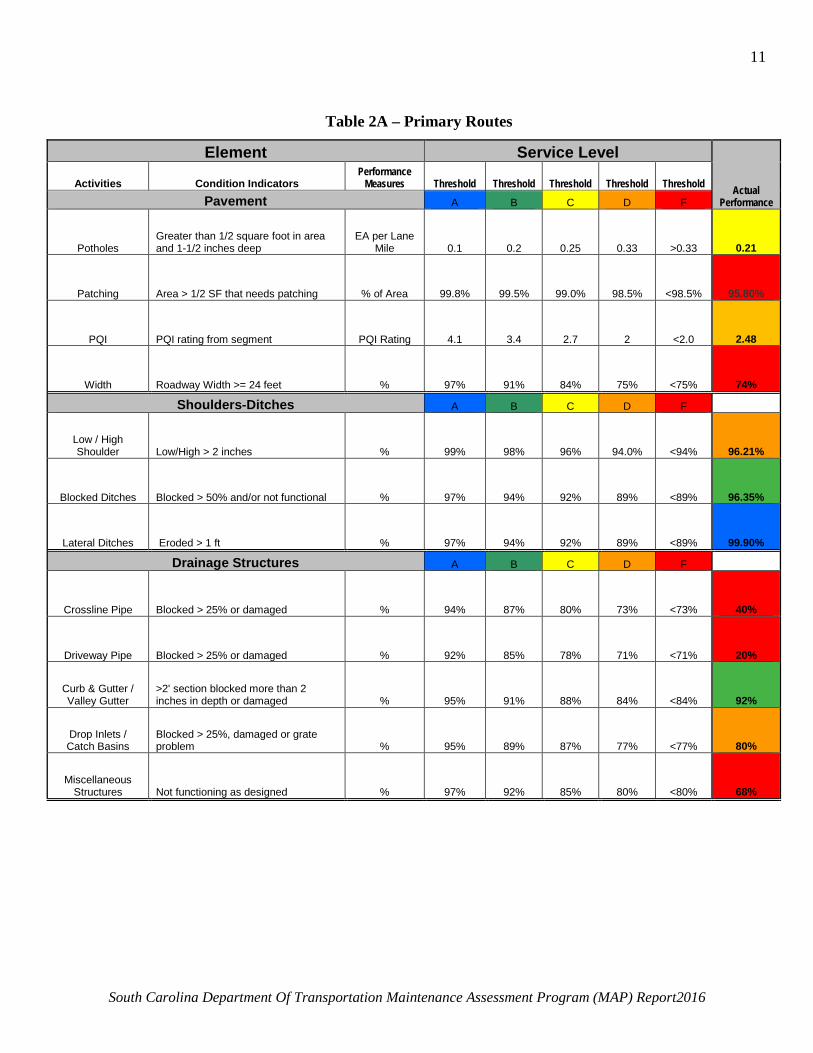
Table 2A – Primary Routes
Element Service Level
Actual Performance
Activities Condition Indicators Performance
Measures Threshold Threshold Threshold Threshold Threshold Pavement A B C D F
Potholes Greater than 1/2 square foot in area and 1-1/2 inches deep
EA per Lane Mile 0.1 0.2 0.25 0.33 >0.33 0.21
Patching Area > 1/2 SF that needs patching % of Area 99.8% 99.5% 99.0% 98.5% <98.5% 95.80%
PQI PQI rating from segment PQI Rating 4.1 3.4 2.7 2 <2.0 2.48
Width Roadway Width >= 24 feet % 97% 91% 84% 75% <75% 74%
Shoulders-Ditches A B C D F
Low / High Shoulder Low/High > 2 inches % 99% 98% 96% 94.0% <94% 96.21%
Blocked Ditches Blocked > 50% and/or not functional % 97% 94% 92% 89% <89% 96.35%
Lateral Ditches Eroded > 1 ft % 97% 94% 92% 89% <89% 99.90%
Drainage Structures A B C D F
Crossline Pipe Blocked > 25% or damaged % 94% 87% 80% 73% <73% 40%
Driveway Pipe Blocked > 25% or damaged % 92% 85% 78% 71% <71% 20%
Curb & Gutter / Valley Gutter
>2' section blocked more than 2 inches in depth or damaged % 95% 91% 88% 84% <84% 92%
Drop Inlets / Catch Basins
Blocked > 25%, damaged or grate problem % 95% 89% 87% 77% <77% 80%
Miscellaneous Structures Not functioning as designed % 97% 92% 85% 80% <80% 68%
12
South Carolina Department Of Transportation Maintenance Assessment Program (MAP) Report2016
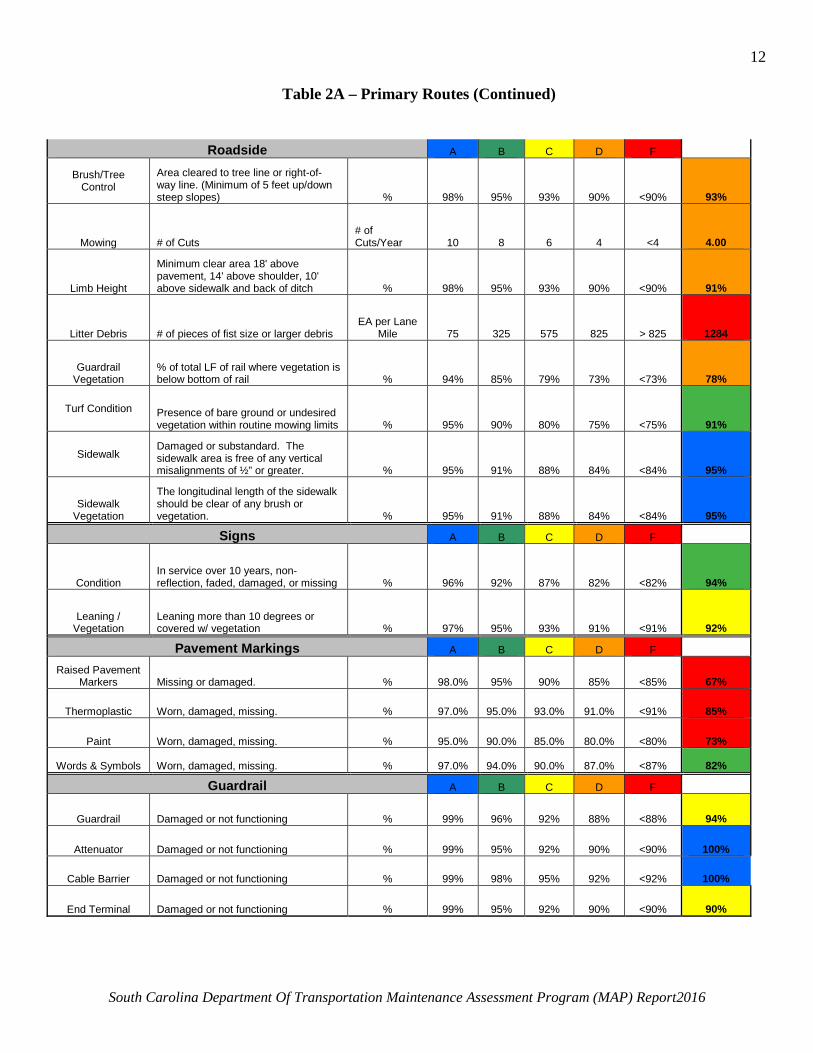
Table 2A – Primary Routes (Continued)
Roadside A B C D F
Brush/Tree Control
Area cleared to tree line or right-of-way line. (Minimum of 5 feet up/down steep slopes) % 98% 95% 93% 90% <90% 93%
Mowing # of Cuts # of Cuts/Year 10 8 6 4 <4 4.00
Limb Height
Minimum clear area 18' above pavement, 14' above shoulder, 10' above sidewalk and back of ditch % 98% 95% 93% 90% <90% 91%
Litter Debris # of pieces of fist size or larger debris EA per Lane
Mile 75 325 575 825 > 825 1284
Guardrail Vegetation
% of total LF of rail where vegetation is below bottom of rail % 94% 85% 79% 73% <73% 78%
Turf Condition Presence of bare ground or undesired vegetation within routine mowing limits % 95% 90% 80% 75% <75% 91%
Sidewalk Damaged or substandard. The sidewalk area is free of any vertical misalignments of ½” or greater. % 95% 91% 88% 84% <84% 95%
Sidewalk Vegetation
The longitudinal length of the sidewalk should be clear of any brush or vegetation. % 95% 91% 88% 84% <84% 95%
Signs A B C D F
Condition In service over 10 years, non-reflection, faded, damaged, or missing % 96% 92% 87% 82% <82% 94%
Leaning / Vegetation
Leaning more than 10 degrees or covered w/ vegetation % 97% 95% 93% 91% <91% 92%
Pavement Markings A B C D F
Raised Pavement Markers Missing or damaged. % 98.0% 95% 90% 85% <85% 67%
Thermoplastic Worn, damaged, missing. % 97.0% 95.0% 93.0% 91.0% <91% 85%
Paint Worn, damaged, missing. % 95.0% 90.0% 85.0% 80.0% <80% 73%
Words & Symbols Worn, damaged, missing. % 97.0% 94.0% 90.0% 87.0% <87% 82%
Guardrail A B C D F
Guardrail Damaged or not functioning % 99% 96% 92% 88% <88% 94%
Attenuator Damaged or not functioning % 99% 95% 92% 90% <90% 100%
Cable Barrier Damaged or not functioning % 99% 98% 95% 92% <92% 100%
End Terminal Damaged or not functioning % 99% 95% 92% 90% <90% 90%
13
South Carolina Department Of Transportation Maintenance Assessment Program (MAP) Report2016
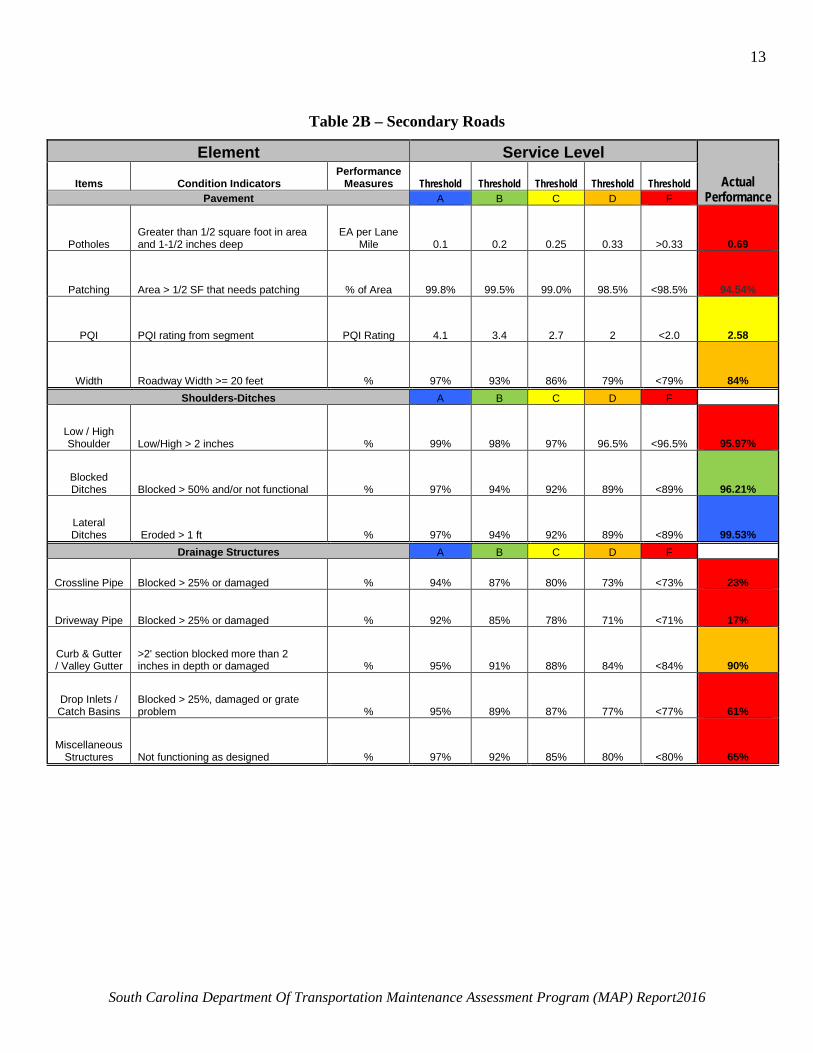
Table 2B – Secondary Roads
Element Service Level
Actual Performance
Items Condition Indicators Performance
Measures Threshold Threshold Threshold Threshold Threshold Pavement A B C D F
Potholes Greater than 1/2 square foot in area and 1-1/2 inches deep
EA per Lane Mile 0.1 0.2 0.25 0.33 >0.33 0.69
Patching Area > 1/2 SF that needs patching % of Area 99.8% 99.5% 99.0% 98.5% <98.5% 94.54%
PQI PQI rating from segment PQI Rating 4.1 3.4 2.7 2 <2.0 2.58
Width Roadway Width >= 20 feet % 97% 93% 86% 79% <79% 84% Shoulders-Ditches A B C D F
Low / High Shoulder Low/High > 2 inches % 99% 98% 97% 96.5% <96.5% 95.97%
Blocked Ditches Blocked > 50% and/or not functional % 97% 94% 92% 89% <89% 96.21%
Lateral Ditches Eroded > 1 ft % 97% 94% 92% 89% <89% 99.53%
Drainage Structures A B C D F
Crossline Pipe Blocked > 25% or damaged % 94% 87% 80% 73% <73% 23%
Driveway Pipe Blocked > 25% or damaged % 92% 85% 78% 71% <71% 17%
Curb & Gutter / Valley Gutter
>2' section blocked more than 2 inches in depth or damaged % 95% 91% 88% 84% <84% 90%
Drop Inlets / Catch Basins
Blocked > 25%, damaged or grate problem % 95% 89% 87% 77% <77% 61%
Miscellaneous Structures Not functioning as designed % 97% 92% 85% 80% <80% 65%
14
South Carolina Department Of Transportation Maintenance Assessment Program (MAP) Report2016
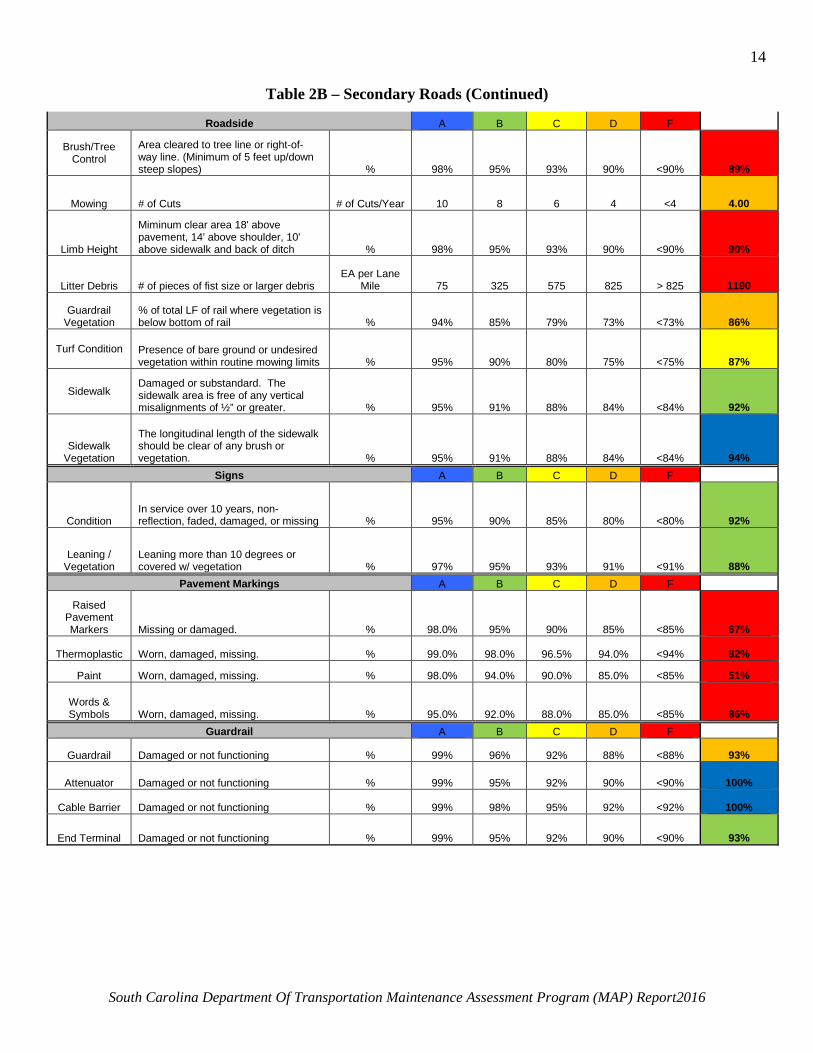
Table 2B – Secondary Roads (Continued)
Roadside A B C D F
Brush/Tree Control
Area cleared to tree line or right-of-way line. (Minimum of 5 feet up/down steep slopes) % 98% 95% 93% 90% <90% 89%
Mowing # of Cuts # of Cuts/Year 10 8 6 4 <4 4.00
Limb Height
Miminum clear area 18' above pavement, 14' above shoulder, 10' above sidewalk and back of ditch % 98% 95% 93% 90% <90% 90%
Litter Debris # of pieces of fist size or larger debris EA per Lane
Mile 75 325 575 825 > 825 1190
Guardrail Vegetation
% of total LF of rail where vegetation is below bottom of rail % 94% 85% 79% 73% <73% 86%
Turf Condition Presence of bare ground or undesired vegetation within routine mowing limits % 95% 90% 80% 75% <75% 87%
Sidewalk Damaged or substandard. The sidewalk area is free of any vertical misalignments of ½” or greater. % 95% 91% 88% 84% <84% 92%
Sidewalk Vegetation
The longitudinal length of the sidewalk should be clear of any brush or vegetation. % 95% 91% 88% 84% <84% 94%
Signs A B C D F
Condition In service over 10 years, non-reflection, faded, damaged, or missing % 95% 90% 85% 80% <80% 92%
Leaning / Vegetation
Leaning more than 10 degrees or covered w/ vegetation % 97% 95% 93% 91% <91% 88%
Pavement Markings A B C D F
Raised Pavement Markers Missing or damaged. % 98.0% 95% 90% 85% <85% 67%
Thermoplastic Worn, damaged, missing. % 99.0% 98.0% 96.5% 94.0% <94% 82%
Paint Worn, damaged, missing. % 98.0% 94.0% 90.0% 85.0% <85% 51%
Words & Symbols Worn, damaged, missing. % 95.0% 92.0% 88.0% 85.0% <85% 86%
Guardrail A B C D F
Guardrail Damaged or not functioning % 99% 96% 92% 88% <88% 93%
Attenuator Damaged or not functioning % 99% 95% 92% 90% <90% 100%
Cable Barrier Damaged or not functioning % 99% 98% 95% 92% <92% 100%
End Terminal Damaged or not functioning % 99% 95% 92% 90% <90% 93%
15
South Carolina Department Of Transportation Maintenance Assessment Program (MAP) Report2016
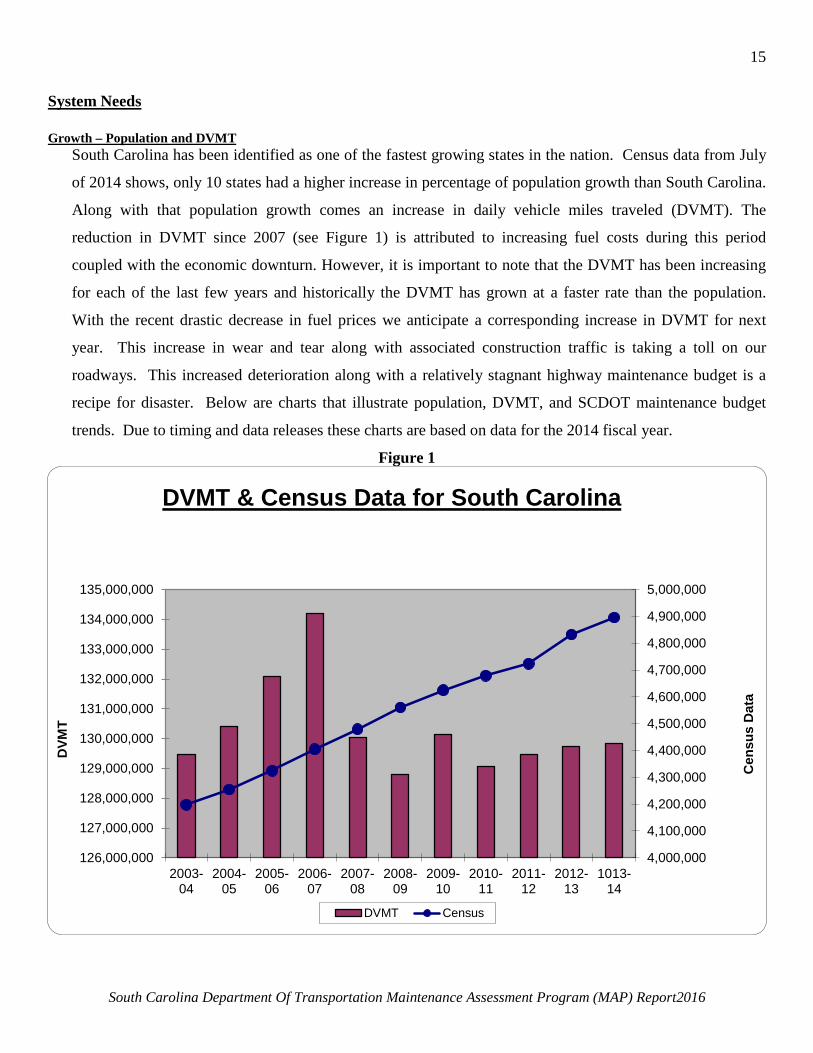
System Needs Growth – Population and DVMT
South Carolina has been identified as one of the fastest growing states in the nation. Census data from July
of 2014 shows, only 10 states had a higher increase in percentage of population growth than South Carolina.
Along with that population growth comes an increase in daily vehicle miles traveled (DVMT). The
reduction in DVMT since 2007 (see Figure 1) is attributed to increasing fuel costs during this period
coupled with the economic downturn. However, it is important to note that the DVMT has been increasing
for each of the last few years and historically the DVMT has grown at a faster rate than the population.
With the recent drastic decrease in fuel prices we anticipate a corresponding increase in DVMT for next
year. This increase in wear and tear along with associated construction traffic is taking a toll on our
roadways. This increased deterioration along with a relatively stagnant highway maintenance budget is a
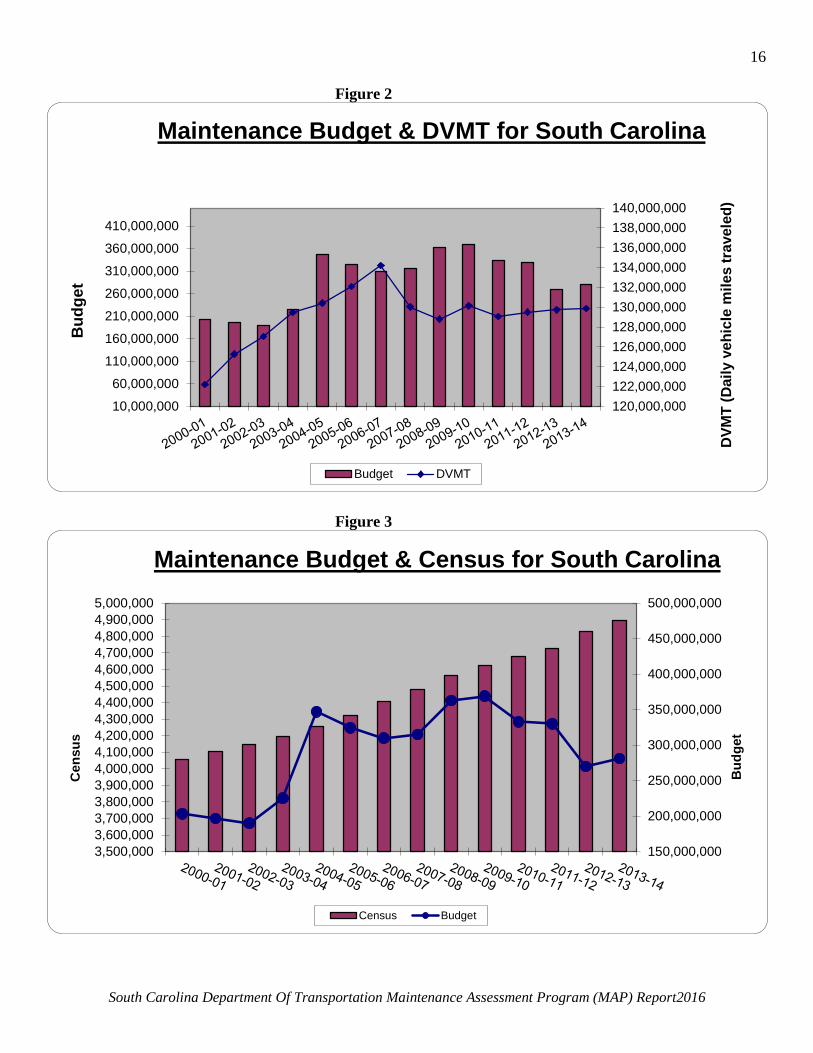
recipe for disaster. Below are charts that illustrate population, DVMT, and SCDOT maintenance budget
trends. Due to timing and data releases these charts are based on data for the 2014 fiscal year.
Figure 1
4,000,000
4,100,000
4,200,000
4,300,000
4,400,000
4,500,000
4,600,000
4,700,000
4,800,000
4,900,000
5,000,000
126,000,000
127,000,000
128,000,000
129,000,000
130,000,000
131,000,000
132,000,000
133,000,000
134,000,000
135,000,000
2003-04
2004-05
2005-06
2006-07
2007-08
2008-09
2009-10
2010-11
2011-12
2012-13
1013-14
Cen
sus
Dat
a
DVM
T
DVMT & Census Data for South Carolina
DVMT Census
16
South Carolina Department Of Transportation Maintenance Assessment Program (MAP) Report2016
Figure 2
Figure 3
120,000,000122,000,000124,000,000126,000,000128,000,000130,000,000132,000,000134,000,000136,000,000138,000,000140,000,000
10,000,000
60,000,000
110,000,000
160,000,000
210,000,000
260,000,000
310,000,000
360,000,000
410,000,000
DVM
T (D
aily
veh
icle
mile
s tr
avel
ed)
Bud
get
Maintenance Budget & DVMT for South Carolina
Budget DVMT
150,000,000
200,000,000
250,000,000
300,000,000
350,000,000
400,000,000
450,000,000
500,000,000
3,500,0003,600,0003,700,0003,800,0003,900,0004,000,0004,100,0004,200,0004,300,0004,400,0004,500,0004,600,0004,700,0004,800,0004,900,0005,000,000
Bud
get
Cen
sus
Maintenance Budget & Census for South Carolina
Census Budget
17
South Carolina Department Of Transportation Maintenance Assessment Program (MAP) Report2016
Funding Needs
South Carolina has the fourth largest state maintained road system in the nation with approximately 41,390
centerline miles. The primary funding source for SCDOT is a motor fuel user fee, or the gas tax. The state
gas tax has not been increased since 1987. That is almost thirty years without an increase. During this
period of time, the system has grown and the rate of deterioration has increased, but the funding mechanism
has been relatively stagnant. South Carolina disburses approximately $39,403 per mile of state maintained
road1. That is the lowest in the nation. In comparison, the national average is approximately $162,202 per
mile of road maintained1. For maintenance of roads, South Carolina disburses $7,320 per lane mile for state
maintained roads1. This is the third lowest in the nation1. The national average is $26,079 per lane mile1.
South Carolina receives fewer dollars per mile of responsibility than any other state in the nation1. If South
Carolina funded the maintenance of roads at the national average the budget would be over $900 million. 1 David G. Hartgen,Ph.D., P.E., M. Gregory Fields, and Baruch Feigenbaum, 21st Annual Report on the Performance of State Highway Systems (1984-2012) Policy
Study 436, September 2014, https://reason.org/files/21st_annual_highway_report.pdf.
MAP Projection
This MAP report identifies the needs associated with the state maintained primary and secondary road
systems in South Carolina. Table 3A and Table 3B illustrate the cost associated with the work required to
achieve each LOS. This cost is in addition to the 2015 fiscal year’s state funded budget of $294.1 million
plus an additional $180.4 million in federal funding. These costs were calculated by multiplying the amount
of work necessary to achieve a particular LOS by the unit cost of that work. Unit costs were obtained from
historical data from both maintenance contracts and our internal Highway Maintenance Management
System (HMMS). The unit cost for each item was determined by the primary method in which the work is
performed. For example, the unit cost in HMMS for pothole patching was used because SCDOT
maintenance forces primarily perform this function. Similarly, the unit cost for shoulder paving was taken
from the Department’s Bid Estimator program because this work is typically contracted. A possible flaw in
this logic is the assumption that all of the additional work would be performed by SCDOT maintenance
forces and contract forces in the same manner that it is occurring now. In reality, additional full-time
employees (FTE) and equipment would be required for SCDOT forces to perform this additional work. If
the decision was made to maintain the existing level of full-time employees and satisfy the increased
demand with contract forces, the cost projections shown in Table 3A and Table 3B would significantly
increase. A table of the costs used to calculate these projections is displayed in Appendix A.
18
South Carolina Department Of Transportation Maintenance Assessment Program (MAP) Report2016
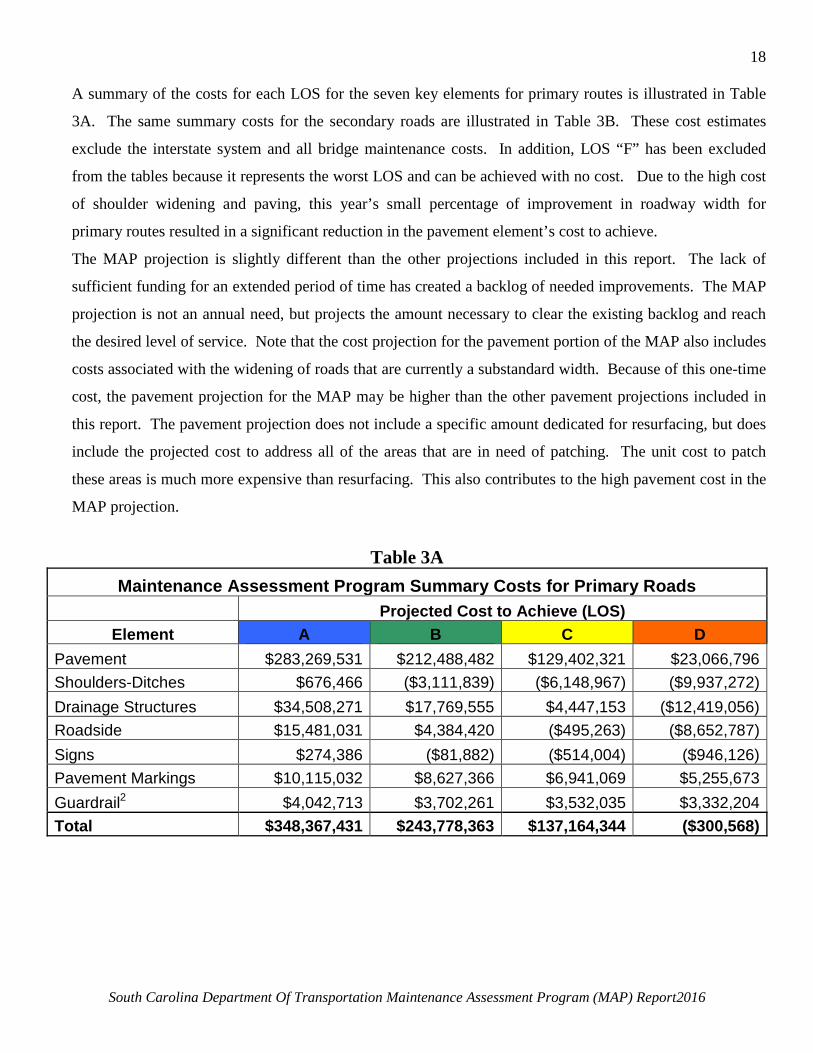
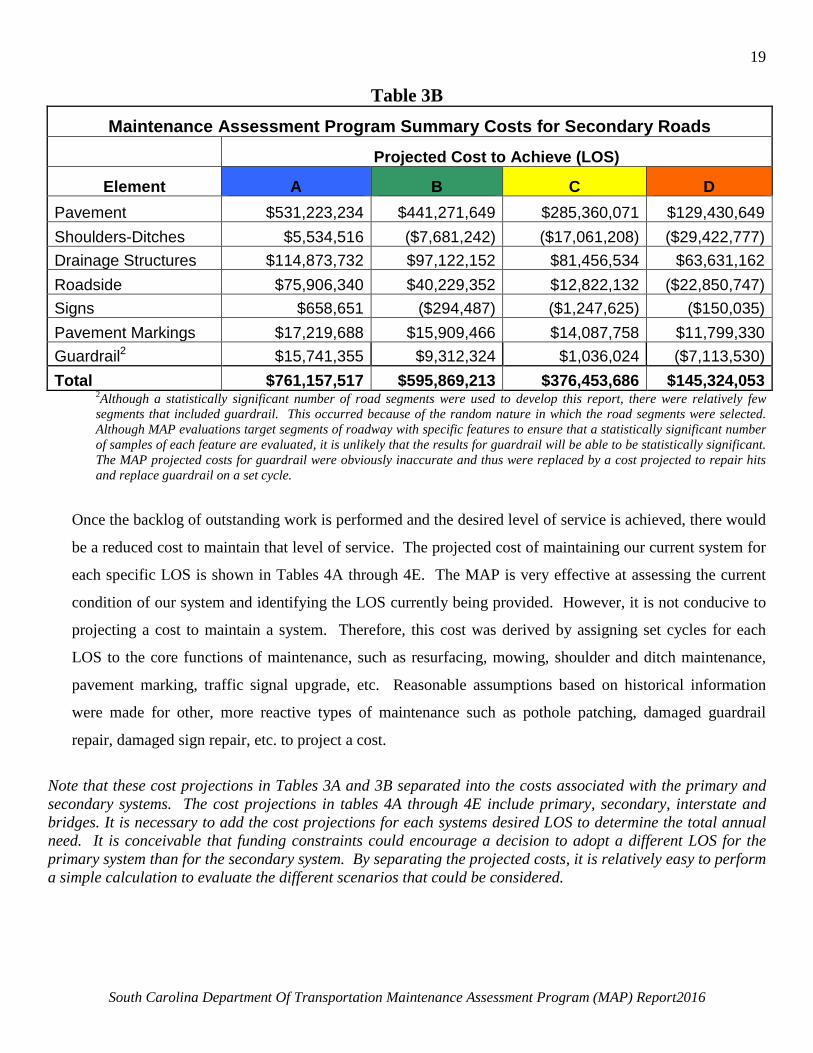
A summary of the costs for each LOS for the seven key elements for primary routes is illustrated in Table
3A. The same summary costs for the secondary roads are illustrated in Table 3B. These cost estimates
exclude the interstate system and all bridge maintenance costs. In addition, LOS “F” has been excluded
from the tables because it represents the worst LOS and can be achieved with no cost. Due to the high cost
of shoulder widening and paving, this year’s small percentage of improvement in roadway width for
primary routes resulted in a significant reduction in the pavement element’s cost to achieve.
The MAP projection is slightly different than the other projections included in this report. The lack of
sufficient funding for an extended period of time has created a backlog of needed improvements. The MAP
projection is not an annual need, but projects the amount necessary to clear the existing backlog and reach
the desired level of service. Note that the cost projection for the pavement portion of the MAP also includes
costs associated with the widening of roads that are currently a substandard width. Because of this one-time
cost, the pavement projection for the MAP may be higher than the other pavement projections included in
this report. The pavement projection does not include a specific amount dedicated for resurfacing, but does
include the projected cost to address all of the areas that are in need of patching. The unit cost to patch
these areas is much more expensive than resurfacing. This also contributes to the high pavement cost in the
MAP projection.
Table 3A
Maintenance Assessment Program Summary Costs for Primary Roads Projected Cost to Achieve (LOS)
Element A B C D Pavement $283,269,531 $212,488,482 $129,402,321 $23,066,796 Shoulders-Ditches $676,466 ($3,111,839) ($6,148,967) ($9,937,272) Drainage Structures $34,508,271 $17,769,555 $4,447,153 ($12,419,056) Roadside $15,481,031 $4,384,420 ($495,263) ($8,652,787) Signs $274,386 ($81,882) ($514,004) ($946,126) Pavement Markings $10,115,032 $8,627,366 $6,941,069 $5,255,673 Guardrail2 $4,042,713 $3,702,261 $3,532,035 $3,332,204 Total $348,367,431 $243,778,363 $137,164,344 ($300,568)
19
South Carolina Department Of Transportation Maintenance Assessment Program (MAP) Report2016
Table 3B Maintenance Assessment Program Summary Costs for Secondary Roads
Projected Cost to Achieve (LOS)
Element A B C D Pavement $531,223,234 $441,271,649 $285,360,071 $129,430,649 Shoulders-Ditches $5,534,516 ($7,681,242) ($17,061,208) ($29,422,777) Drainage Structures $114,873,732 $97,122,152 $81,456,534 $63,631,162 Roadside $75,906,340 $40,229,352 $12,822,132 ($22,850,747) Signs $658,651 ($294,487) ($1,247,625) ($150,035) Pavement Markings $17,219,688 $15,909,466 $14,087,758 $11,799,330 Guardrail2 $15,741,355 $9,312,324 $1,036,024 ($7,113,530) Total $761,157,517 $595,869,213 $376,453,686 $145,324,053
2Although a statistically significant number of road segments were used to develop this report, there were relatively few segments that included guardrail. This occurred because of the random nature in which the road segments were selected. Although MAP evaluations target segments of roadway with specific features to ensure that a statistically significant number of samples of each feature are evaluated, it is unlikely that the results for guardrail will be able to be statistically significant. The MAP projected costs for guardrail were obviously inaccurate and thus were replaced by a cost projected to repair hits and replace guardrail on a set cycle.
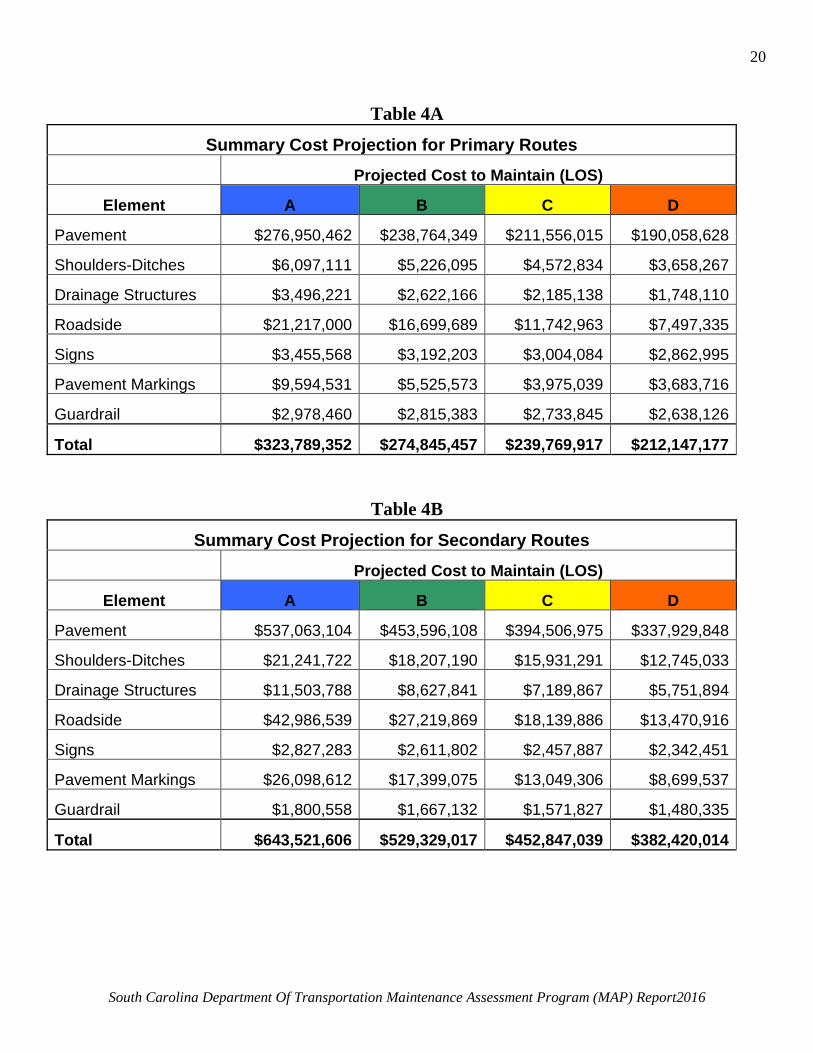
Once the backlog of outstanding work is performed and the desired level of service is achieved, there would
be a reduced cost to maintain that level of service. The projected cost of maintaining our current system for
each specific LOS is shown in Tables 4A through 4E. The MAP is very effective at assessing the current
condition of our system and identifying the LOS currently being provided. However, it is not conducive to
projecting a cost to maintain a system. Therefore, this cost was derived by assigning set cycles for each
LOS to the core functions of maintenance, such as resurfacing, mowing, shoulder and ditch maintenance,
pavement marking, traffic signal upgrade, etc. Reasonable assumptions based on historical information
were made for other, more reactive types of maintenance such as pothole patching, damaged guardrail
repair, damaged sign repair, etc. to project a cost.
Note that these cost projections in Tables 3A and 3B separated into the costs associated with the primary and secondary systems. The cost projections in tables 4A through 4E include primary, secondary, interstate and bridges. It is necessary to add the cost projections for each systems desired LOS to determine the total annual need. It is conceivable that funding constraints could encourage a decision to adopt a different LOS for the primary system than for the secondary system. By separating the projected costs, it is relatively easy to perform a simple calculation to evaluate the different scenarios that could be considered.
20
South Carolina Department Of Transportation Maintenance Assessment Program (MAP) Report2016
Table 4A
Summary Cost Projection for Primary Routes Projected Cost to Maintain (LOS)
Element A B C D
Pavement $276,950,462 $238,764,349 $211,556,015 $190,058,628
Shoulders-Ditches $6,097,111 $5,226,095 $4,572,834 $3,658,267
Drainage Structures $3,496,221 $2,622,166 $2,185,138 $1,748,110
Roadside $21,217,000 $16,699,689 $11,742,963 $7,497,335
Signs $3,455,568 $3,192,203 $3,004,084 $2,862,995
Pavement Markings $9,594,531 $5,525,573 $3,975,039 $3,683,716
Guardrail $2,978,460 $2,815,383 $2,733,845 $2,638,126
Total $323,789,352 $274,845,457 $239,769,917 $212,147,177
Table 4B Summary Cost Projection for Secondary Routes
Projected Cost to Maintain (LOS)
Element A B C D
Pavement $537,063,104 $453,596,108 $394,506,975 $337,929,848
Shoulders-Ditches $21,241,722 $18,207,190 $15,931,291 $12,745,033
Drainage Structures $11,503,788 $8,627,841 $7,189,867 $5,751,894
Roadside $42,986,539 $27,219,869 $18,139,886 $13,470,916
Signs $2,827,283 $2,611,802 $2,457,887 $2,342,451
Pavement Markings $26,098,612 $17,399,075 $13,049,306 $8,699,537
Guardrail $1,800,558 $1,667,132 $1,571,827 $1,480,335
Total $643,521,606 $529,329,017 $452,847,039 $382,420,014
21
South Carolina Department Of Transportation Maintenance Assessment Program (MAP) Report2016
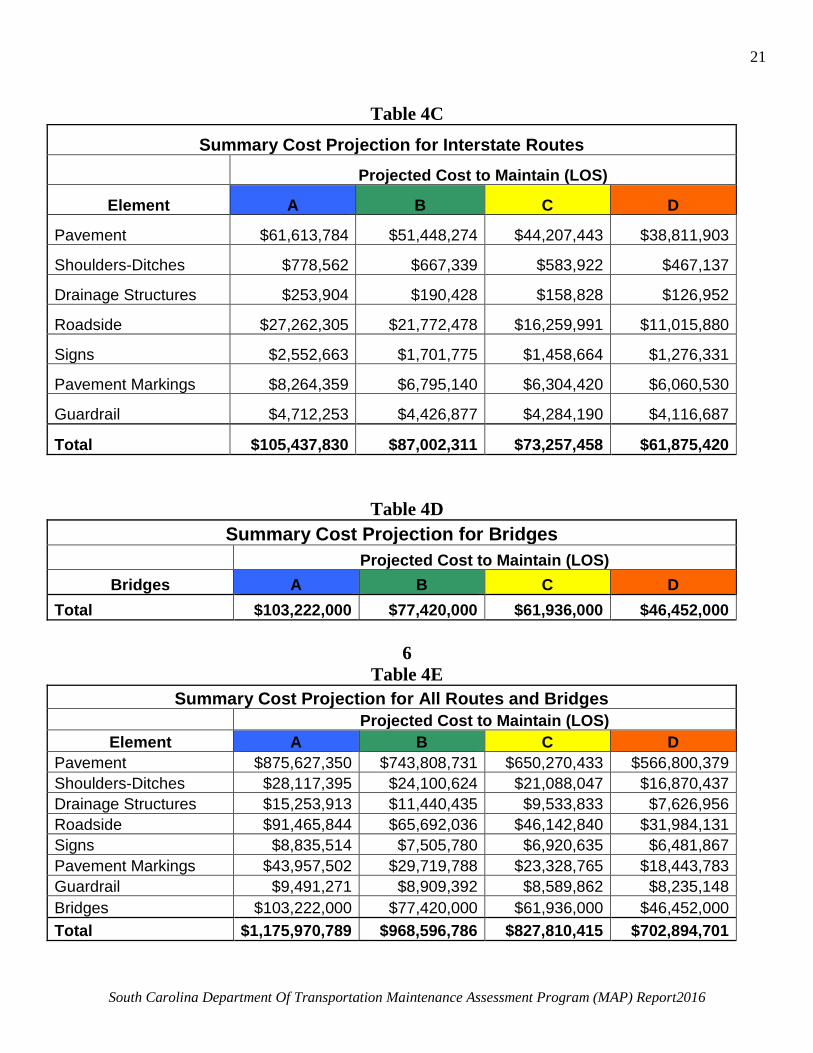
Table 4C
Summary Cost Projection for Interstate Routes Projected Cost to Maintain (LOS)
Element A B C D
Pavement $61,613,784 $51,448,274 $44,207,443 $38,811,903
Shoulders-Ditches $778,562 $667,339 $583,922 $467,137
Drainage Structures $253,904 $190,428 $158,828 $126,952
Roadside $27,262,305 $21,772,478 $16,259,991 $11,015,880
Signs $2,552,663 $1,701,775 $1,458,664 $1,276,331
Pavement Markings $8,264,359 $6,795,140 $6,304,420 $6,060,530
Guardrail $4,712,253 $4,426,877 $4,284,190 $4,116,687
Total $105,437,830 $87,002,311 $73,257,458 $61,875,420
Table 4D Summary Cost Projection for Bridges
Projected Cost to Maintain (LOS) Bridges A B C D
Total $103,222,000 $77,420,000 $61,936,000 $46,452,000 6
Table 4E Summary Cost Projection for All Routes and Bridges
Projected Cost to Maintain (LOS) Element A B C D
Pavement $875,627,350 $743,808,731 $650,270,433 $566,800,379 Shoulders-Ditches $28,117,395 $24,100,624 $21,088,047 $16,870,437 Drainage Structures $15,253,913 $11,440,435 $9,533,833 $7,626,956 Roadside $91,465,844 $65,692,036 $46,142,840 $31,984,131 Signs $8,835,514 $7,505,780 $6,920,635 $6,481,867 Pavement Markings $43,957,502 $29,719,788 $23,328,765 $18,443,783 Guardrail $9,491,271 $8,909,392 $8,589,862 $8,235,148 Bridges $103,222,000 $77,420,000 $61,936,000 $46,452,000 Total $1,175,970,789 $968,596,786 $827,810,415 $702,894,701
22
South Carolina Department Of Transportation Maintenance Assessment Program (MAP) Report2016
Pavement Management Program Projection
A second evaluation included in this report utilizes our Pavement Management Program to project funding
needs for the pavement maintenance of our primary and secondary systems. Although the MAP uses the
pavement quality index (PQI) to assist in defining the LOS, this information was not used in the MAP cost
projection. Our pavement management division used the current PQI data along with a target PQI range to
project maintenance cost over the next fifteen years. This calculation would be an alternative projection for
only the pavement element of the MAP. All non-pavement related maintenance costs (drainage, mowing,
litter, etc.) would be in addition to the projections in this section. The projection for the secondary system
used a five county sample and includes an extrapolated projection for the entire state. The Pavement
Quality Index is the basic measure of road condition used by Pavement Management. This index
incorporates the roughness and distresses (including rutting) that occur on the surface of a road. The PQI
scale ranges for 0.0 to 5.0, with 5.0 being the best.
This Pavement Management Program projection is presented in this report in terms of Remaining Service
Life (RSL) and Level of Service (LOS). RSL is an indication of how many years can be expected out of a
pavement before it reaches the minimum acceptable operating condition. In essence, RSL can be used to
illustrate the condition of the highway system. Each year, the entire system would deteriorate by one
service life year per lane mile of the system. As improvements are made to the system, service life years are
added. To maintain a transportation system at its current service level, the same number of service life years
need to be added as is lost. For example, in South Carolina, the secondary road system is comprised of
approximately 62,900 lane miles. Each year 62,900 lane mile years of service life are lost. Therefore,
62,900 lane mile years of service life must be added back each year to prevent further deterioration of the
system. The cost projections below are estimates by our Pavement Management System for the cost of the
reconstruction, rehabilitation, and preservation treatments that would be necessary to accomplish the desired
goal. The RSL of the system is determined from the direct correlation of the calculated PQI. The LOS is a
range of RSL values. The approximate correlation of LOS, PQI and RSL are displayed in the table below.
23
South Carolina Department Of Transportation Maintenance Assessment Program (MAP) Report2016
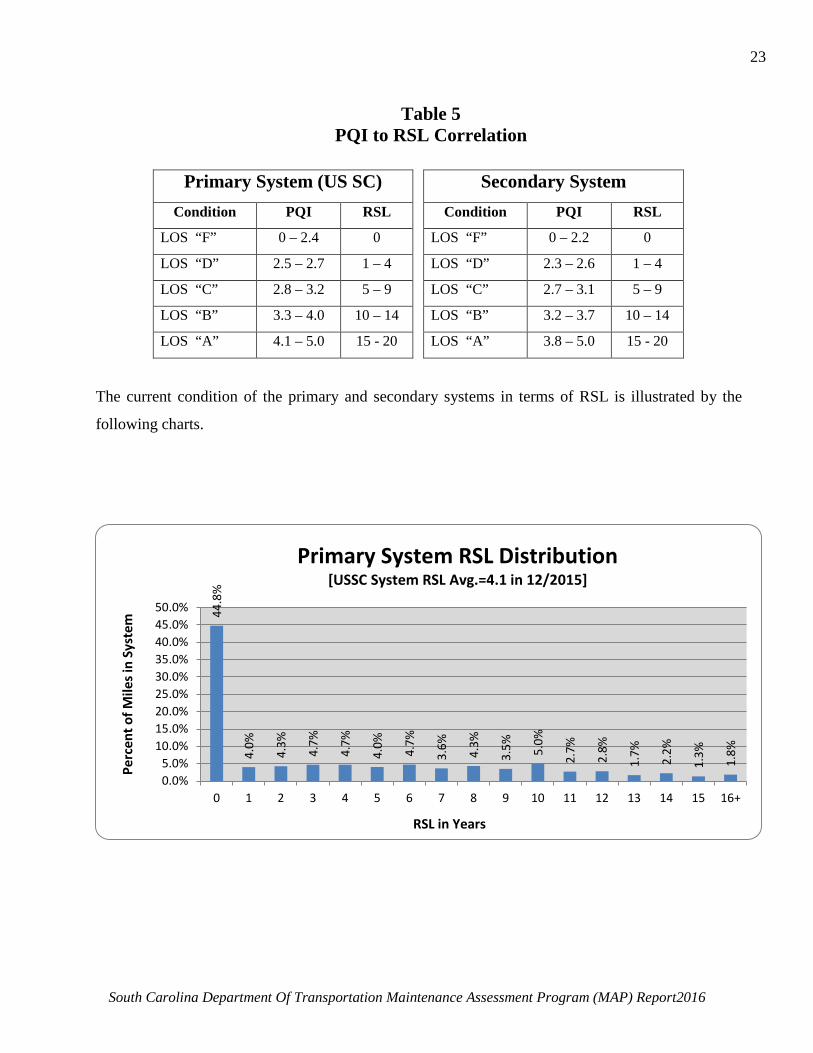
Table 5
PQI to RSL Correlation
The current condition of the primary and secondary systems in terms of RSL is illustrated by the
following charts.
44.8
%
4.0%
4.3%
4.7%
4.7%
4.0%
4.7%
3.6%
4.3%
3.5%
5.0%
2.7%
2.8%
1.7%
2.2%
1.3%
1.8%
0.0%5.0%
10.0%15.0%20.0%25.0%30.0%35.0%40.0%45.0%50.0%
0 1 2 3 4 5 6 7 8 9 10 11 12 13 14 15 16+
Primary System RSL Distribution [USSC System RSL Avg.=4.1 in 12/2015]
RSL in Years
Perc
ent o
f Mile
s in
Syst
em
Primary System (US SC) Condition PQI RSL
LOS “F” 0 – 2.4 0
LOS “D” 2.5 – 2.7 1 – 4
LOS “C” 2.8 – 3.2 5 – 9
LOS “B” 3.3 – 4.0 10 – 14
LOS “A” 4.1 – 5.0 15 - 20
Secondary System Condition PQI RSL
LOS “F” 0 – 2.2 0
LOS “D” 2.3 – 2.6 1 – 4
LOS “C” 2.7 – 3.1 5 – 9
LOS “B” 3.2 – 3.7 10 – 14
LOS “A” 3.8 – 5.0 15 - 20
24
South Carolina Department Of Transportation Maintenance Assessment Program (MAP) Report2016
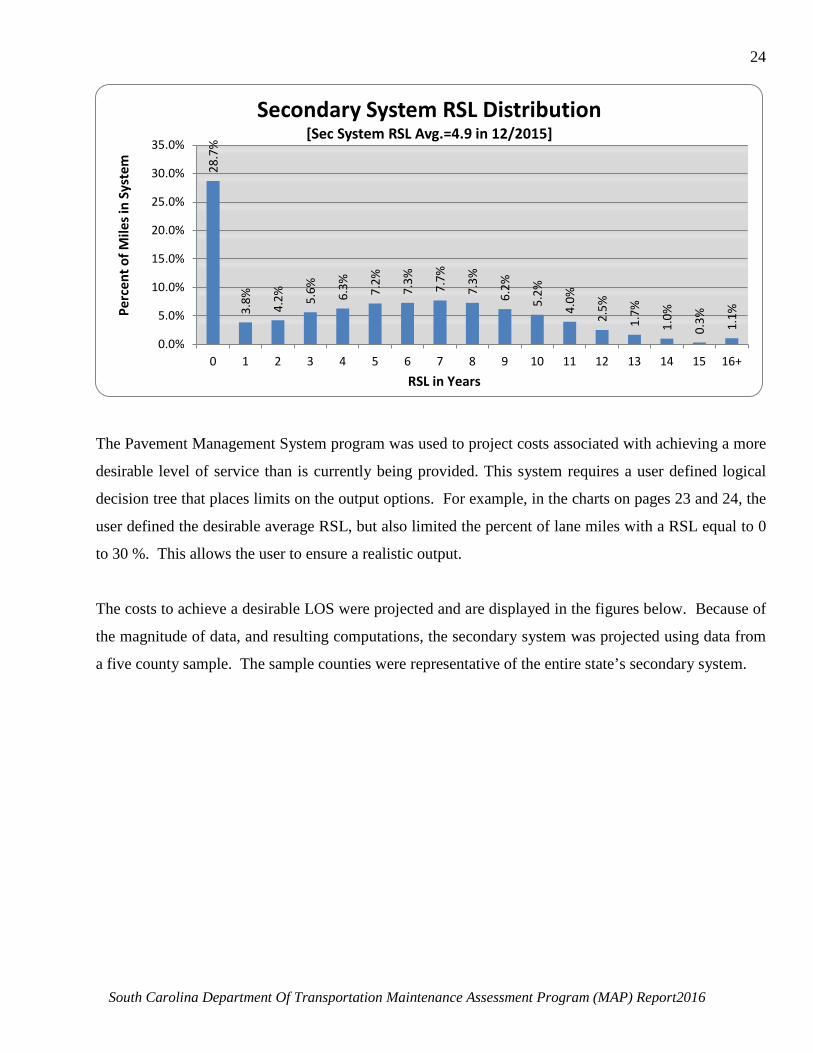
The Pavement Management System program was used to project costs associated with achieving a more
desirable level of service than is currently being provided. This system requires a user defined logical
decision tree that places limits on the output options. For example, in the charts on pages 23 and 24, the
user defined the desirable average RSL, but also limited the percent of lane miles with a RSL equal to 0
to 30 %. This allows the user to ensure a realistic output.
The costs to achieve a desirable LOS were projected and are displayed in the figures below. Because of
the magnitude of data, and resulting computations, the secondary system was projected using data from
a five county sample. The sample counties were representative of the entire state’s secondary system.
28.7
%
3.8%
4.2%
5.6%
6.3%
7.2%
7.3%
7.7%
7.3%
6.2%
5.2%
4.0%
2.5%
1.7%
1.0%
0.3%
1.1%
0.0%
5.0%
10.0%
15.0%
20.0%
25.0%
30.0%
35.0%
0 1 2 3 4 5 6 7 8 9 10 11 12 13 14 15 16+
Secondary System RSL Distribution [Sec System RSL Avg.=4.9 in 12/2015]
Perc
ent o
f Mile
s in
Syst
em
RSL in Years
25
South Carolina Department Of Transportation Maintenance Assessment Program (MAP) Report2016
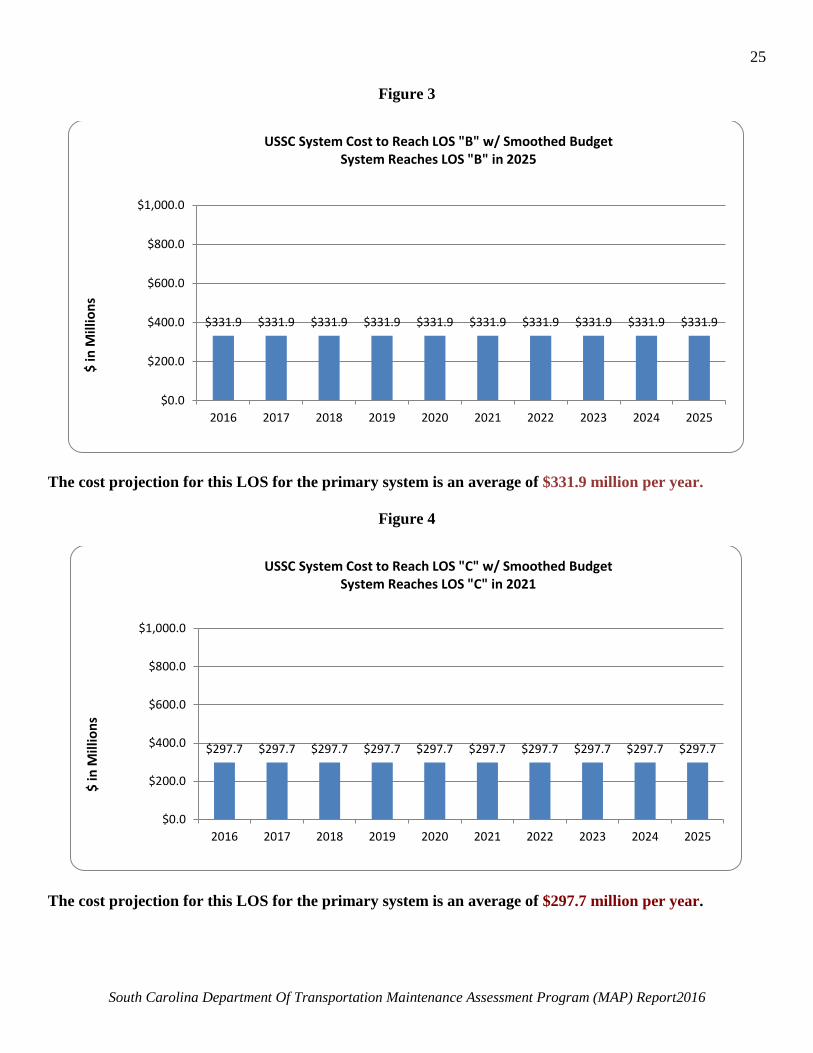
Figure 3
The cost projection for this LOS for the primary system is an average of $331.9 million per year.
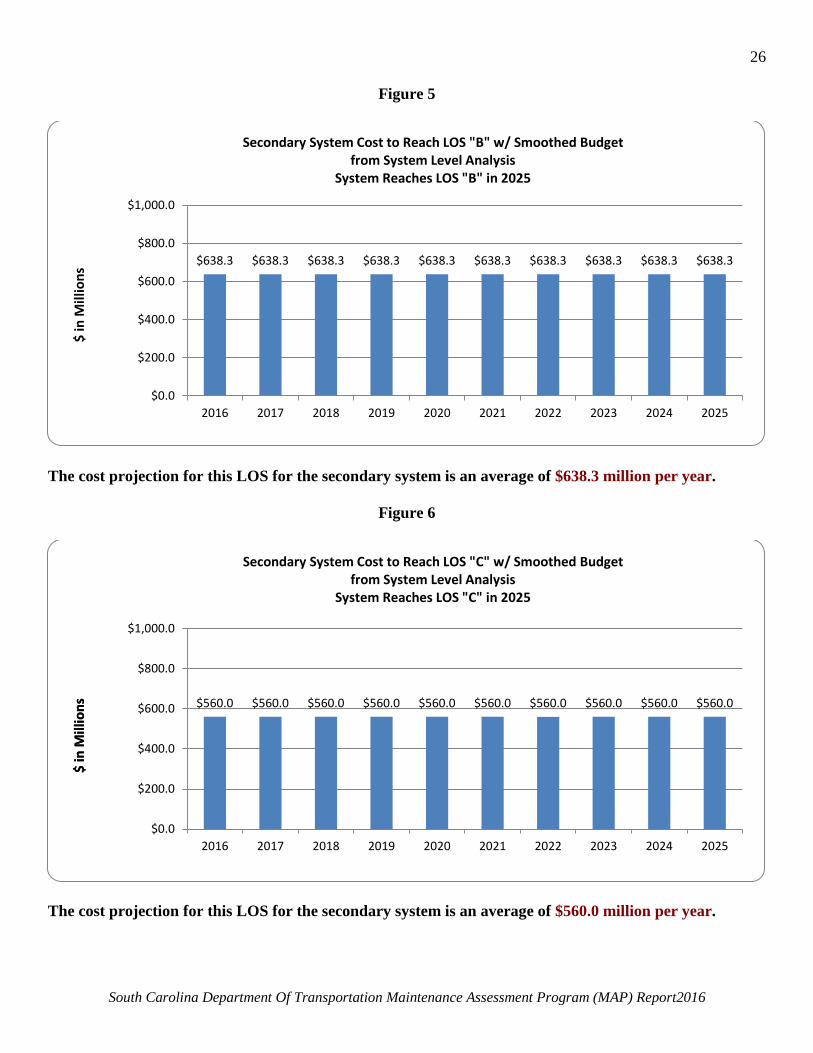
Figure 4
The cost projection for this LOS for the primary system is an average of $297.7 million per year.
$331.9 $331.9 $331.9 $331.9 $331.9 $331.9 $331.9 $331.9 $331.9 $331.9
$0.0
$200.0
$400.0
$600.0
$800.0
$1,000.0
2016 2017 2018 2019 2020 2021 2022 2023 2024 2025
$ in
Mill
ions
USSC System Cost to Reach LOS "B" w/ Smoothed Budget System Reaches LOS "B" in 2025
$297.7 $297.7 $297.7 $297.7 $297.7 $297.7 $297.7 $297.7 $297.7 $297.7
$0.0
$200.0
$400.0
$600.0
$800.0
$1,000.0
2016 2017 2018 2019 2020 2021 2022 2023 2024 2025
$ in
Mill
ions
USSC System Cost to Reach LOS "C" w/ Smoothed Budget System Reaches LOS "C" in 2021
26
South Carolina Department Of Transportation Maintenance Assessment Program (MAP) Report2016
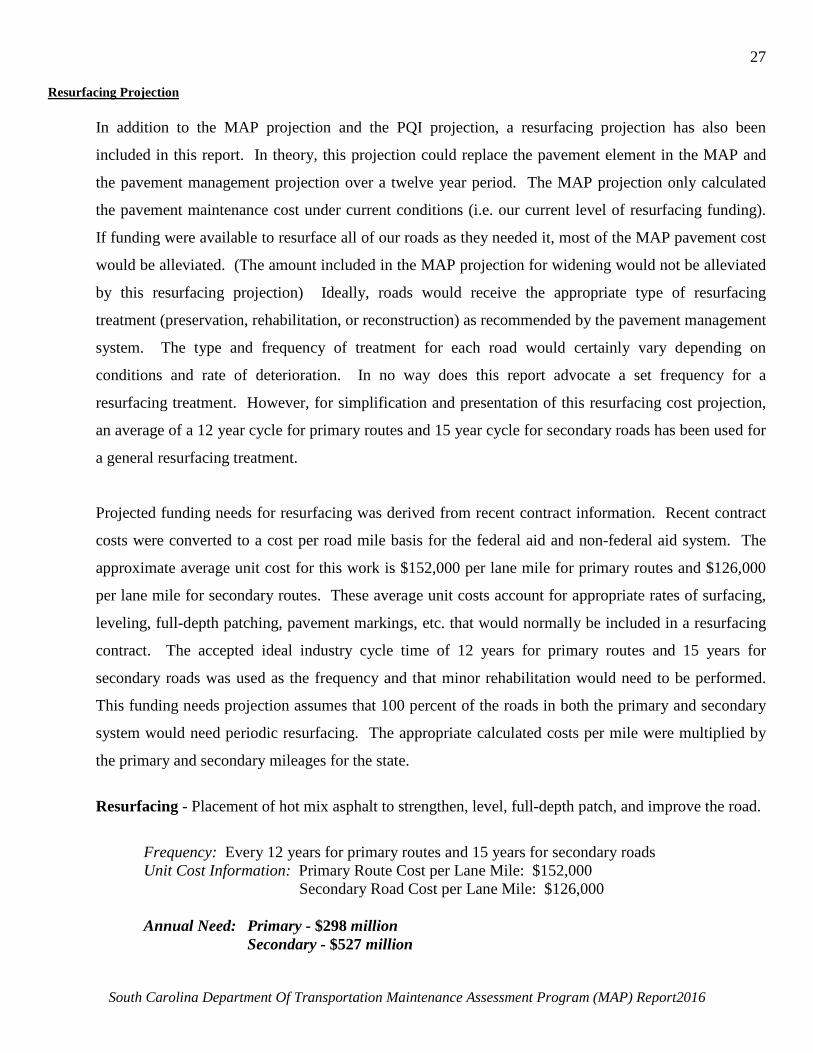
Figure 5
The cost projection for this LOS for the secondary system is an average of $638.3 million per year.
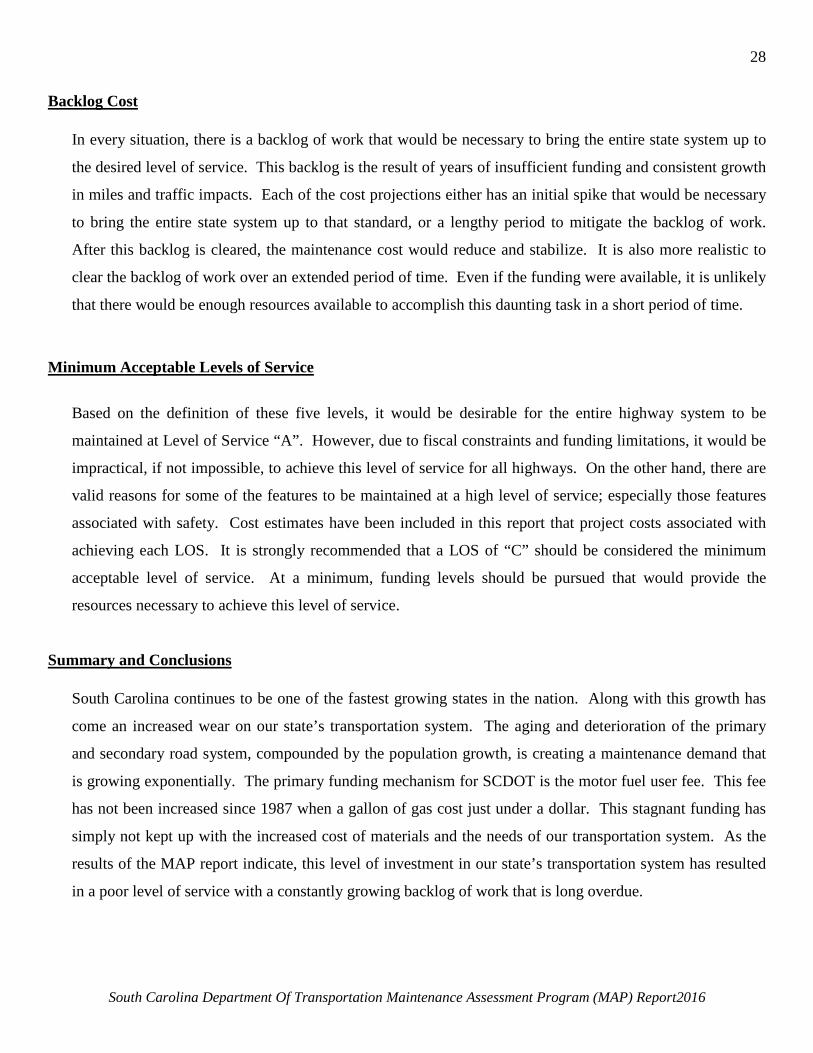
Figure 6
The cost projection for this LOS for the secondary system is an average of $560.0 million per year.
$638.3 $638.3 $638.3 $638.3 $638.3 $638.3 $638.3 $638.3 $638.3 $638.3
$0.0
$200.0
$400.0
$600.0
$800.0
$1,000.0
2016 2017 2018 2019 2020 2021 2022 2023 2024 2025
$ in
Mill
ions
Secondary System Cost to Reach LOS "B" w/ Smoothed Budget from System Level Analysis
System Reaches LOS "B" in 2025
$560.0 $560.0 $560.0 $560.0 $560.0 $560.0 $560.0 $560.0 $560.0 $560.0
$0.0
$200.0
$400.0
$600.0
$800.0
$1,000.0
2016 2017 2018 2019 2020 2021 2022 2023 2024 2025
$ in
Mill
ions
Secondary System Cost to Reach LOS "C" w/ Smoothed Budget from System Level Analysis
System Reaches LOS "C" in 2025
$ in
Mill
ions
27
South Carolina Department Of Transportation Maintenance Assessment Program (MAP) Report2016
Resurfacing Projection
In addition to the MAP projection and the PQI projection, a resurfacing projection has also been
included in this report. In theory, this projection could replace the pavement element in the MAP and
the pavement management projection over a twelve year period. The MAP projection only calculated
the pavement maintenance cost under current conditions (i.e. our current level of resurfacing funding).
If funding were available to resurface all of our roads as they needed it, most of the MAP pavement cost
would be alleviated. (The amount included in the MAP projection for widening would not be alleviated
by this resurfacing projection) Ideally, roads would receive the appropriate type of resurfacing
treatment (preservation, rehabilitation, or reconstruction) as recommended by the pavement management
system. The type and frequency of treatment for each road would certainly vary depending on
conditions and rate of deterioration. In no way does this report advocate a set frequency for a
resurfacing treatment. However, for simplification and presentation of this resurfacing cost projection,
an average of a 12 year cycle for primary routes and 15 year cycle for secondary roads has been used for
a general resurfacing treatment.
Projected funding needs for resurfacing was derived from recent contract information. Recent contract
costs were converted to a cost per road mile basis for the federal aid and non-federal aid system. The
approximate average unit cost for this work is $152,000 per lane mile for primary routes and $126,000
per lane mile for secondary routes. These average unit costs account for appropriate rates of surfacing,
leveling, full-depth patching, pavement markings, etc. that would normally be included in a resurfacing
contract. The accepted ideal industry cycle time of 12 years for primary routes and 15 years for
secondary roads was used as the frequency and that minor rehabilitation would need to be performed.
This funding needs projection assumes that 100 percent of the roads in both the primary and secondary
system would need periodic resurfacing. The appropriate calculated costs per mile were multiplied by
the primary and secondary mileages for the state.
Resurfacing - Placement of hot mix asphalt to strengthen, level, full-depth patch, and improve the road.
Frequency: Every 12 years for primary routes and 15 years for secondary roads Unit Cost Information: Primary Route Cost per Lane Mile: $152,000
Secondary Road Cost per Lane Mile: $126,000
Annual Need: Primary - $298 million Secondary - $527 million
28
South Carolina Department Of Transportation Maintenance Assessment Program (MAP) Report2016
Backlog Cost
In every situation, there is a backlog of work that would be necessary to bring the entire state system up to
the desired level of service. This backlog is the result of years of insufficient funding and consistent growth
in miles and traffic impacts. Each of the cost projections either has an initial spike that would be necessary
to bring the entire state system up to that standard, or a lengthy period to mitigate the backlog of work.
After this backlog is cleared, the maintenance cost would reduce and stabilize. It is also more realistic to
clear the backlog of work over an extended period of time. Even if the funding were available, it is unlikely
that there would be enough resources available to accomplish this daunting task in a short period of time.
Minimum Acceptable Levels of Service
Based on the definition of these five levels, it would be desirable for the entire highway system to be
maintained at Level of Service “A”. However, due to fiscal constraints and funding limitations, it would be
impractical, if not impossible, to achieve this level of service for all highways. On the other hand, there are
valid reasons for some of the features to be maintained at a high level of service; especially those features
associated with safety. Cost estimates have been included in this report that project costs associated with
achieving each LOS. It is strongly recommended that a LOS of “C” should be considered the minimum
acceptable level of service. At a minimum, funding levels should be pursued that would provide the
resources necessary to achieve this level of service.
Summary and Conclusions
South Carolina continues to be one of the fastest growing states in the nation. Along with this growth has
come an increased wear on our state’s transportation system. The aging and deterioration of the primary
and secondary road system, compounded by the population growth, is creating a maintenance demand that
is growing exponentially. The primary funding mechanism for SCDOT is the motor fuel user fee. This fee
has not been increased since 1987 when a gallon of gas cost just under a dollar. This stagnant funding has
simply not kept up with the increased cost of materials and the needs of our transportation system. As the
results of the MAP report indicate, this level of investment in our state’s transportation system has resulted
in a poor level of service with a constantly growing backlog of work that is long overdue.
29
South Carolina Department Of Transportation Maintenance Assessment Program (MAP) Report2016
Because of these challenges our maintenance forces have not been able to improve the LOS in most areas.
A few areas show did show improvement. On primary routes, the level of service for potholes and sign
condition improved from a LOS “D” to a LOS “B”. On secondary roads, sign condition, guardrail
vegetation and end terminal damage improved but remained within the LOS from the previous year. These
gains have been realized by focusing resources on specific areas of need. While these improvements are
encouraging, and our maintenance forces should be commended for their efforts, the overall system LOS is
well below the desired level and continues to decline. Without additional funding the decline of the overall
service level will likely continue.
Several methods of funding need projections have been included in this report. All of which indicate a
substantial additional investment is necessary to bring our system up to an acceptable level of service.
The MAP program projects a need of just over $513.6 million to bring just our primary and
secondary systems up to a LOS of “C”. This is in addition to the current level of funding. Once this
LOS is achieved, it is projected that an annual need of $692.6 million would allow the maintenance of the
primary and secondary system at this LOS. An additional $133 million would also be required for
maintenance of the interstate system and bridges.
One of the pavement management projections would bring the state’s primary and secondary pavement
conditions to the median standard for a LOS of “C”. The projected need for the primary roads is $297.7
million annually to fund the backlog and maintain that LOS. The projected need for all secondary roads is
$560 million annually to fund the backlog and maintain that LOS. This projection would fund most of the
pavement portion of the MAP only. All non-pavement needs would be in addition to this projection.
The resurfacing projection would bring the state’s primary and secondary pavement to a much higher LOS
than its current condition. This projection would require consistent funding and would place all roads on a
regular resurfacing schedule. This would allow for the resurfacing of all primary roads every 12 years and
all secondary roads every 15 years. This method projects an annual need of $298 million for primary roads
and $527 million for secondary roads. As with the PQI projection, this would fund only a significant
percentage of the pavement portion of the MAP. All non-pavement needs would be in addition to this
projection.
30
South Carolina Department Of Transportation Maintenance Assessment Program (MAP) Report2016
This MAP report clearly identifies a very real need to identify substantial additional funds to invest in the
maintenance of our current transportation system. With approximately 41,390 centerline miles of state
maintained roads, we have a significant investment in our transportation infrastructure. This infrastructure
needs an increased and recurring level of funding for repair and development of a consistent preventive
maintenance program. This investment is crucial to properly maintain the highway system to meet the
transportation needs of the growing population in South Carolina.
Addendum
As shown in the MAP report, the only way to make substantial improvements in the state system is to
increase the amount of investment. However, it is the desire of the Director of Maintenance to address the
items that currently have a poor LOS that are related to safety or are considered priority items.
The approach currently used by the Director of Maintenance is to ensure appropriate resources are dedicated
to the identified areas of need through the budget process. Each year the districts are required to submit a
need based budget request and associated work plan to the Director of Maintenance for review and
approval. Additionally, any reallocation of funds away from the identified areas of need requires approval
from the Director of Maintenance. By mandating the districts address the areas of need identified by the
MAP inspection, it is anticipated that system wide improvements should be realized in these areas over
time. There is a likely adverse effect to this approach. In many cases, resources are simply being shifted
from one area to another. This shifting of resources, will likely result in the decrease of LOS in the areas
from which resources are redirected. However, there are some areas where a lower LOS could be tolerated.
The goal is to ensure that resources are expended on the safety sensitive maintenance activities and not on
activities that are less important or easy to perform.
31
South Carolina Department Of Transportation Maintenance Assessment Program (MAP) Report2016
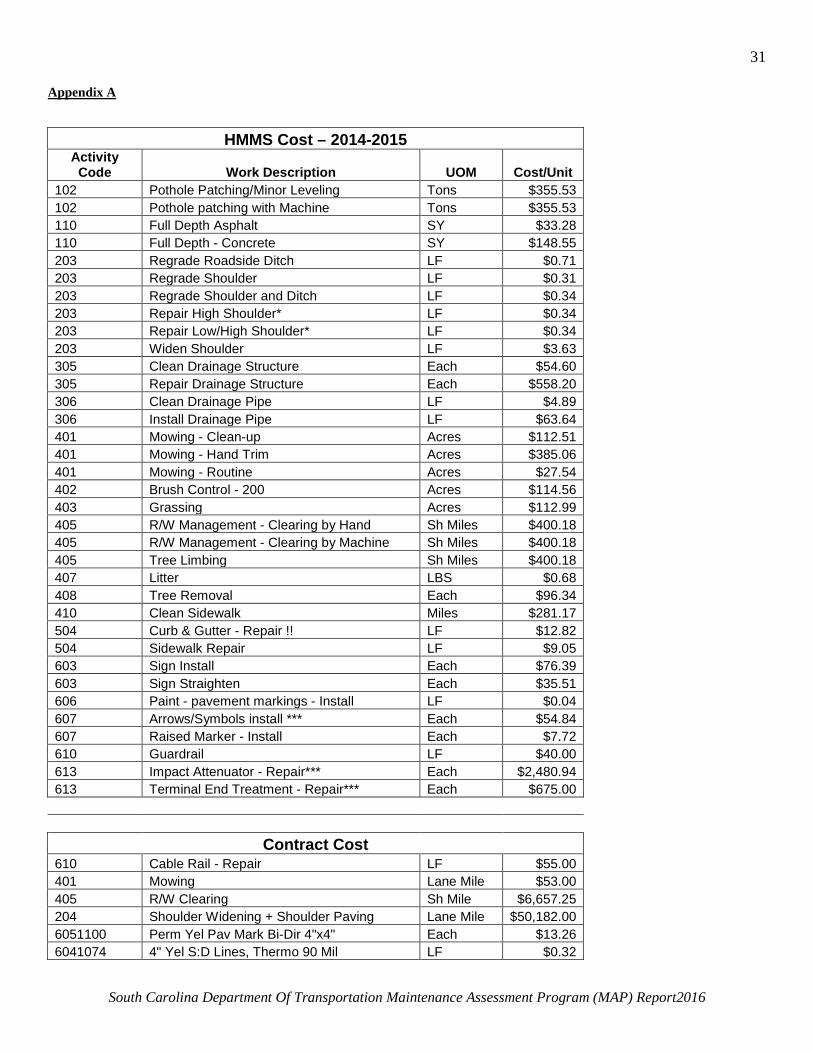
Appendix A
HMMS Cost – 2014-2015 Activity Code Work Description UOM Cost/Unit
102 Pothole Patching/Minor Leveling Tons $355.53 102 Pothole patching with Machine Tons $355.53 110 Full Depth Asphalt SY $33.28 110 Full Depth - Concrete SY $148.55 203 Regrade Roadside Ditch LF $0.71 203 Regrade Shoulder LF $0.31 203 Regrade Shoulder and Ditch LF $0.34 203 Repair High Shoulder* LF $0.34 203 Repair Low/High Shoulder* LF $0.34 203 Widen Shoulder LF $3.63 305 Clean Drainage Structure Each $54.60 305 Repair Drainage Structure Each $558.20 306 Clean Drainage Pipe LF $4.89 306 Install Drainage Pipe LF $63.64 401 Mowing - Clean-up Acres $112.51 401 Mowing - Hand Trim Acres $385.06 401 Mowing - Routine Acres $27.54 402 Brush Control - 200 Acres $114.56 403 Grassing Acres $112.99 405 R/W Management - Clearing by Hand Sh Miles $400.18 405 R/W Management - Clearing by Machine Sh Miles $400.18 405 Tree Limbing Sh Miles $400.18 407 Litter LBS $0.68 408 Tree Removal Each $96.34 410 Clean Sidewalk Miles $281.17 504 Curb & Gutter - Repair !! LF $12.82 504 Sidewalk Repair LF $9.05 603 Sign Install Each $76.39 603 Sign Straighten Each $35.51 606 Paint - pavement markings - Install LF $0.04 607 Arrows/Symbols install *** Each $54.84 607 Raised Marker - Install Each $7.72 610 Guardrail LF $40.00 613 Impact Attenuator - Repair*** Each $2,480.94 613 Terminal End Treatment - Repair*** Each $675.00
Contract Cost
610 Cable Rail - Repair LF $55.00 401 Mowing Lane Mile $53.00 405 R/W Clearing Sh Mile $6,657.25 204 Shoulder Widening + Shoulder Paving Lane Mile $50,182.00 6051100 Perm Yel Pav Mark Bi-Dir 4"x4" Each $13.26 6041074 4" Yel S:D Lines, Thermo 90 Mil LF $0.32
32
South Carolina Department Of Transportation Maintenance Assessment Program (MAP) Report2016
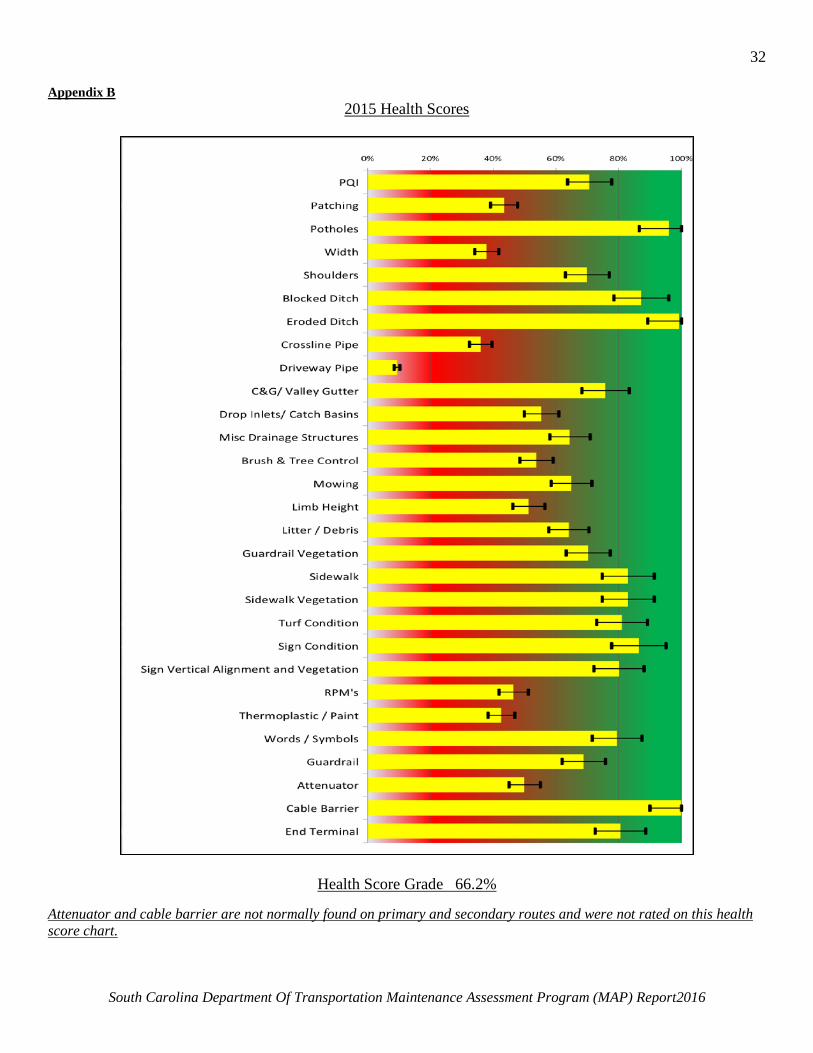
Appendix B 2015 Health Scores
Health Score Grade 66.2%
Attenuator and cable barrier are not normally found on primary and secondary routes and were not rated on this health score chart.