maintaining dynamic competition in procurement contracts
TRANSCRIPT

1
Maintaining Dynamic Competition in Procurement Contracts: A case study on the London Bus Market1
June 2016
Elisabetta Iossa2 and Michael Waterson3
Abstract This paper takes a case study approach to analyse the evolution of competition in the market for local bus services in London. With the aid of a public dataset made available by Transport for London, the paper makes a preliminary assessment of whether competition is being maintained over time and what factors are determining its alleged success. Keywords: Dynamic Competition, Procurement and Incumbent advantage, Bus market.
1 We thank Estelle Cantillon for providing us with much background information on the tendering and her mixed bundling work and Stephane Saussier for making his data available to us. We thank our research assistants Svetlana Bilalova, Chiara Carboni, Sergio Castagnetti, Paolo di Fonzo, Sotiris Giannoulis, Rachana Nirgudkar, Daniele Surian and Midori Takeda, for their help with the data and information collection and processing. We also thank various bus enthusiasts, particularly Robert Munster, for their provision of data. We acknowledge financial support from Laboratorio Bocconi Aspi Project and the University of Warwick Economics Department. 2 University of Rome Tor Vergata, IEFE-Bocconi and Center of Research in Procurement and Supply Chain (www.proxenter.it) 3 University of Warwick, UK. [email protected] Waterson was involved in the Competition Commission market Inquiry into the British bus market, but this Inquiry related only to bus services outside London.
2
1. Introduction
In many sectors, procurement is repeated over time. In the road sector, for example,
the Department of Transport, the Road Authority or private concessionaires repeatedly
buy services from suppliers. The contracts cover road construction and paving projects,
traffic signal projects, bridge construction and maintenance projects as well as smaller
drainage and clearance type projects. These contracts are auctioned off repeatedly to
individual contractors typically via sealed-bid actions where the lowest bid is awarded
the contract. Different variants are also observed; (i) contracts may be awarded on best
value for money criteria; (ii) contracts may be rotated among a set of qualified suppliers;
(iii) bid preferences may be given to some of them.
Contrary to one-shot procurement, under recurrent procurement, procurers and firms
need to recognize the elements of interdependency that exist across tenders, rather
than thinking of each tender in isolation. The selection of the contractor in the current
tender may indeed have an impact on the position of that contractor in future tenders,
which in turn may affect how competition will evolve over time.
Consider firms participating in the auction. When bidding for the contract, firms
anticipate that being awarded the current tender may affect their chance of winning
future tenders. Depending on whether this effect is positive (i.e. the firm gains a
competitive advantage) or negative (i.e. the firm loses a competitive advantage), firms
will bid differently. Similarly, competitors of the current contractor will follow different
bidding strategies, depending on whether they expect themselves to be facing an
incumbent with a competitive advantage or not.
The implications of these effects are non- trivial. How will an incumbent take advantage
of its position? If the firm has acquired superior knowledge on the project compared to
competitors, will it bid more or less aggressively? And anticipating this strategy, how will
competitors bid in the auction?
Consider now the procurers of recurrent auctions. Procurers are/should not be myopic.
They should design sequential tenders so as to take into account the interdependency
among them and the consequent strategic bidding behaviour of incumbents and
competitors. Procurers should thus take into account that the design and outcome of
the current tender may have an impact on subsequent tenders. Tenders should then be
designed and adjudicated in order to minimize long term procurement cost rather than

3
the cost of each single tender. More generally, the impact of sunk costs on future
tenders was first discussed informally but powerfully by Williamson in terms of
transactions costs: “… the initial large numbers bidding competition will be transformed
into one of bilateral exchange at the contract renewal interval if execution entails non-
trivial transaction specific investments.” (Williamson, 1981, p.571, emphasis in original).
The objective of the paper is to study this tender interdependency under recurrent
tenders in the London bus market and identify the factors that affect the evolution of
competition for tendered contracts over time: Under what conditions will competition
be sustainable over time or alternatively lead to monopolization? The paper investigates
in particular the impact on bidding behaviour and future competition of learning effects,
sunk costs of entry, switching costs for the procurer and capacity constraints. The paper
discusses how each of these factors affects the position of entrants and incumbents at
tender stage, and thus their incentives to bid aggressively in order to secure the
contract.
The market for local bus services in London has some useful features from the viewpoint
of this analysis. Like the road sector, contracts for local transport services are auctioned
off regularly, contracts are relatively standard and a limited number of pre-qualified
firms bid to provide service over time. Sunk costs of entry exist but are not necessarily
prohibitive. Many local authorities in cities all over the world contract out the operation
of their local transportation, so the example is an important one.
Using a dataset of over 400 bus routes tendered at least twice by Transport for London
(TfL) under essentially the same rules of competition, we obtained information on all
tenders from 2003 to 2015, which enables us to investigate whether competition is
being maintained over time, outcomes in terms of prices per mile, and what factors that
are determining its success. The data were in part available through the TfL website and
partly manually collected from various websites as discussed in more detail later.
Using a slightly modified dataset of all major routes, also drawn on London bus data, we
then examine the specific role of the spread of garage ownership amongst the key firms
in the market from the viewpoint that location of a garage may be a key element in being
able to offer a competitive bid for a service. We find that proximity of a firm’s garages
to the routes it operates is indeed a major factor in predicting whether it will operate
the route. However another key finding is that other competitors are commonly well
placed to provide the service.
The paper is structured as follows. In Section 2, we focus on the repeated tender analysis
of London bus services. In Section 3 we analyse the role of garages. Section 4 concludes.

4
2. The London Local Transport Market
2.1 Description
To gain insights we shall consider what is believed to be one of the most successful
experiences of competitive tendering in Europe for the award of local transport services:
the London bus market, a large market now serving nearly 9 million people, with nearly
9000 buses and a total of 675 routes (Verbich and El-Geneidy, 2016).
The familiar London bus is the subject of a complex and extensive operation in
tendering. Despite the common red branding, London’s bus services are run by several
different operators, virtually all operating on gross cost contracts (subject to quality
payments, which may go in either direction) lasting five years, with possible extensions
to seven years. Service provision is dictated by Transport for London which is ultimately
under control of the Mayor of London.
TfL organises tender competitions to choose operators. Start (and therefore
termination) dates are widely spread, so that the contracts are put out to tender every
two to three weeks, on a rotating basis. The contracts are for service on a particular
route, where the route, timetable, vehicle quality and service quality have been
specified by TfL.
For example, the so-called 2015-16 tendering programme, starting with tenders issued
in April 2014, contains 40 separate sets of contracts, covering around 180 bus routes,
with between 1 and 10 bus routes being the subject of tender returnable by a particular
date. The choice of routes tendered on a particular date is not random; commonly for
example routes in a similar area of London are issued together, so that for example (the
largest) Tranche 490, issued on 1st September 2014, comprised 10 routes, covering
routes focused on south-east/ south London a few miles from the centre. Tenders for
these were due on 13th October 2014, with decisions to be announced in January 2015
and services to start operation from 29th August 2015. The lag between announcement
and delivery is because the new operator, if the contract changes hands, will need to
have crew and buses in place, together with a garage or similar accommodation for
stabling and maintenance. Indeed, the tender may call for buses of a standard above
that currently in operation on the route, for example to a tougher emissions standard,

5
so the existing operator who wins may also be forced to purchase new vehicles.4 Most
tenders are for an initial five years, although it is quite common for the operator to be
offered an extension of a further two years on the same terms, subject to performance.
Tenderers must submit a compliant gross cost tender, which is a tender that fully meets
the requirements set out in the tender document such as quality and adherence to
timetable, to be provided for a defined annual payment. However, they are also free to
propose alternatives which may modify some aspect of the service. One of the most
common modifications is to offer a package price for a bundle of routes that is less costly
than the sum of the tenders for individual routes. In other words, there is the possibility
of mixed bundling. Subject to this qualification, it is normal for TfL to select the tenderer
offering the lowest annual price, and if it does not it will provide a brief explanation. TfL
publicises, on a route-by-route basis, the name of the winning tenderer, the number of
tenderers, the total price of the lowest tender, the price of the accepted tender, the
price offered by the highest tenderer, the constitution of the package and its price, if
any, plus a breakdown by route, and a price per mile run figure for the lowest tender
(which clearly facilitates comparisons across routes and time). Cases where no tender is
deemed acceptable appear to be non-existent, or at least extremely rare.
The gross price specified in the contract is subject to a formula-driven annual increase
over the life of the contract, with the formula based upon a few key cost elements.
Within the formula, efficiencies over time are assumed, because the cost uplifts apply
to only 85% of the price.5
This system of gross cost contracts, subject to quality payments which may go either to
or from the operator (from the operator in the case of significantly below-tendered
performance), has been in operation in essentially the same form since 2001 and results
have been reported online since 2003. The routes themselves are largely static in nature,
although more routes have been added over time and frequency enhancements have
been built into the new contracts from time to time. For example, when the London
congestion charge was inaugurated in February 2003, significant enhancements to bus
services were introduced at the same time. Improvements in information technology,
such as GPS location, have substantially enhanced monitoring of adherence to schedule
4 Except for the recently increasing number of routes where New Bus for London is specified, or Heritage routes, the particular vehicle is not specified, so that companies can and do purchase buses from any of a number of providers. 5 The formula is not well publicised, but a previous FoI request yielded a model tender. This may be accessed at http://content.tfl.gov.uk/metroline-bus-contract.pdf

6
as well as provision of customer-focused advance information of various types. Fares
are no longer proffered to the driver but instead purchased through machines at the bus
stop or, more commonly, by using the Oyster card, which was introduced on 30th June
2003, and more recently also by contactless debit card.6
Almost a quarter of all local bus miles run in England are in London, although of course
the population of London is substantially less than ¼ of the population of England.
Moreover, bus patronage has been growing in London, up 32% between 2004/5 and
2013/4, whereas it has been essentially static outside London,7 so that remarkably over
½ of total English passenger bus journeys are now made inside London (Department for
Transport statistics, 2014). Outside London, the bus services are organised substantially
differently, with tendering taking place only for a small minority of marginal routes.
The data we have collected include 402 routes from 2003 to 2015, where data was only
collected in those cases where the same bus service was tendered twice within the
period. The information was partially obtained from the procurer, Transport for London
(TfL)’s website, and partially manually collected from various other websites maintained
by dedicated enthusiasts. In particular, from TFL website, we obtained information on
number of bids, lowest and highest bids, number of firms, whether the bid was a joint
bid or not, and the name of the company that won the contract. We then investigated,
using websites such as londonbuses.co.uk and londonbusroutes.net, the peak vehicle
requirement, the history of the company, and its garaging facilities, so as to see whether
this company was an existing firm in the market, a new entrant or it was simply an
incumbent with a different name and key elements in the history of the route and its
garage. We also used the information from a sample contract provided under Freedom
of Information request on the TfL website to calculate the uprated contract price in the
years after the initiation of the contract.
6 The Oyster card was an instant success, partly due to the low basic cost and substantial discounts it offers to the transport user, including capping of daily fares, etc. More than 60 million Oyster cards have been issued and in 2013, 85% of journeys in London were made using them, so their use extends much beyond the regular London traveller. From 2014, buses have also accepted “contactless” payment cards. Payments to the driver’s cashbox are no longer accepted on any part of the system. Source: http://www.digitalspy.co.uk/tech/news/a494731/londons-oyster-card-turns-10-years-old.html#~oTB9poLY3Aq4MU 7 Secular decline in the numbers of bus travellers outside London was stemmed by the introduction of national free bus travel (commonly after 09.30) for people over 60, subject to possession of a free travel card, in 2006.

7
2.2 The Evidence: Stylised facts
Operator market shares in London have varied over time. The evidence collected shows
that contracts have changed hands, new companies have entered the market and
existing companies have exited it. The position as at October 2014 is given in table 1.
Table 1: Market share percentage calculated according to number of buses in operation on TfL routes. http://www.londonbusroutes.net/garages.htm. Retrieved October 2015
Operator Market share
Go-Ahead 24.68
Metroline 18.00
Arriva 17.75
Stagecoach 14.04
RATPDev 11.45
Abellio 7.60
Transit Systems 5.07
Others 1.41
Of the operators listed here, Go-Ahead, Arriva and Stagecoach are amongst the “big
five” bus operators in Great Britain, with substantial operations outside London.
Stagecoach left the London market in 2006 but returned in 2010. The other two of the
“big five” national bus operators, First and National Express, have both operated in
London but currently neither runs buses in London, for reasons connected more with
overall company strategy than performance in the London market.8 Arriva is now a
subsidiary of Deutsche Bahn. The remaining substantial operators are all subsidiaries of
overseas transport groups; Metroline is a Singaporean company, RATPDev is a subsidiary
of the company operating the Paris Metro, amongst other things, Abellio is a subsidiary
of Ned Rail, the Netherlands operator and Transit Systems is an Australian company. In
addition, it is noteworthy that very small operators (for example HCT and Sullivan Buses)
are able to survive within the system. There have been various other operators active at
one time or another, commonly on outer-London routes, and for a while TfL formed its
own in-house operation, East Thames buses, following the collapse of a previous
operator in 1999 (and another in 2002), but in 2009 this operation was sold to Go-Ahead.
8 None of the big 5, incidentally, is headquartered in London or the south east of England.

8
In the case of a company gaining or losing a contract which is not offset by losses or
gains elsewhere, there will be implications for bus and driver requirements and possibly
for garaging and maintenance facilities. With a total fleet in London of over 8,000 buses
in operation, and even the largest route only having a peak vehicle requirement (PVR)
of around 70 buses, there will be relatively limited implications for a medium to large
operator. Smaller operators in particular may face the need to acquire or dispose of
buses and possibly a need to acquire additional space. In this they benefit from TfL’s
policy of retiring buses from London after only between 7 to 12 years’ use, when the
economic lifetime of a bus is at least 15 years (SMMT, 2010). Hence retired buses retain
some market value.
London bus routes commonly require new buses at start of a contract (presuming it has
a potential extension to 7 years) and ex-London buses can be cascaded to locations
outside London, through the second-hand market, although there are complaints from
operators that London buses are “over-specified” and need to be “de-specified” for use
elsewhere.9 Alternatively, buses can be leased rather than purchased. There are three
British-based bus makers (SMMT, 2010) in addition to suppliers such as Volvo and
Mercedes, who can supply buses to London specifications. Obtaining garaging facilities
is potentially more problematic, although there are examples where companies share
garage space. At most times of the economic cycle, recruiting bus drivers is not a
significant issue and there is ample time for training new ones (from an existing
operator’s viewpoint) within the gap between contract award and commencement of
operations.10
An important feature of the market is that competition appears to be maintained over
time. Because the basic data on contract awards is public, and has remained essentially
unchanged for over 10 years, we can make comparisons over time. At any one time,
there are over 500 different bus routes within London. We have collected data on all the
9 The specifications for London buses are “tougher” than for those outside the capital, where responsibility for vehicle serviceability is in the hands of Traffic Commissioners, individuals with huge areas to oversee (Competition Commission, 2011). There are only eight of these individuals to cover the whole of Great Britain and they have responsibility for trucks as well as buses. Apart from average quality level, London buses are idiosyncratic in minor ways and so need adaptation for use outside London. One of the most obvious differences is that London buses normally have two doors, one for entry and one for exit, whilst outside London it is usual to have only one. The introduction of the New Bus for London (NBfL) 0 on several routes has modified the arrangement somewhat. These buses are not obviously adaptable for use outside London and are substantially more expensive than other buses. As a result, they are leased from TfL rather than being purchased by the operator. Given our sample time frame, we need not be too concerned about the (growing) influence of NBfL. 10 This is implied by comments on, for example, the Arriva website.

9
contracts awarded between mid-2003 and the middle of 2015. Within this period, most
of the contracts have been let twice, some three times, so that we can compare the
contract outcome for bus service 2 (for example) at two distinct time points. Not all
services are covered by this, because some exist only for a period and a very small
number appear to involve different contract arrangements.11 In total, we have collected
402 instances of routes for which the contracts have been let again within our sample.
Our analysis of these contracts provides the following findings:
The existing company quite frequently wins the contract. Of the 402 contracts, on a
narrow definition there are 194 that are won by a company with the same name.
Further, names change, and including routes that are won by the same underlying
company but a different division, or under a name that has changed following
reorganisation, there are approximately 300 contracts won by the same company when
the contract is re-tendered.12 In other words almost 75% of the routes go to the same
company in two successive tender rounds. The incidence of this is somewhat higher on
average for the “letters” routes (e.g. E8) which operate within particular small areas of
outer London.
Table 2: Winning Company
1. Second tender winner company N. of contracts awarded Percentage
Same Company 194 48.26
Different division/name 106 26.37
Different Company 102 25.37
Total 402 100.00
The average number of competitors per contract has decreased slightly, although at
2.85 per re-tendered contract route, there are almost as many as for the first contract
11 We decided against including bus services with numbers in the 600s, and these figures ignore that particular category of contract. These are almost all school travel services, so are run once in the morning and then again late afternoon, to coincide with the school day, rather than being a regularly timed service. In addition, some services run on a 24 hour basis whilst others have a separate “night” element (so maybe four or five services on a typical day, between 1am and 5am). In the latter case, we do not include the night route as a separate route in our analysis. 12 By constructing company histories from various sources including the companies themselves, we attempted to discover whether, at the time of the tender being awarded, the winning company was in fact essentially the same company as previously held the contract. This is occasionally difficult, because companies have left and re-entered the market, for example.

10
we observe (3.03 per route). Nevertheless, there are only 16 instances in which the re-
tendered route has only one participant, which is lower than on the first occasion that
we observe the contract for that route being tendered. Of the 402 routes, 120 have
more competitors on the later occasion compared with the earlier one and 150 have
fewer.
There is relatively little evidence for the possibility that a semblance of competition is
being maintained by companies putting in “sham” bids. Bids are in the lower millions of
pounds for a year’s service, but the bid is normally specified to a particular number of
pounds rather than being rounded. There are some round-number bid amounts, but
these do not constitute a high proportion of the total bids that are revealed.
Table 3: Number of Competitors
The award cost (price) per mile increases over time. We compared the cost per mile
implied by the contract on the second occasion of tendering that route, with the cost
per mile on the first occasion, uprated to the second date according to the formula for
cost increases. There is some tendency for the cost per mile to increase when the
contract is let for a second time. Of the 402 cases, 253 show a rise in cost per mile above
what might be anticipated if the price were generated by the cost-based formula, the
remainder below that. On average in our sample, price rises by 3.8% above what might
be expected from the cost-based formula. The distribution is illustrated in Figure 1
below.
Tender Average Number of Bidders N. of Contracts with higher competition
First Tender 3.03
Retendered 2.85 120 have more competitors 150 have fewer competitors

11
Figure 1: Price Changes over Time
Figure 2 shows the range of outcomes within our sample. Discounting outliers, which
probably correspond to special cases of greatly changed services, the modal increase is
in the tenth percentile range.
The most obvious explanation for this price increase is that either competition is
weakening over time or that quality is rising. Our data do not allow us to capture the
increase in price that may result from quality standards being more demanding in recent
times. Therefore, we cannot yet disentangle these effects.

12
Figure 2 Price Increase over Time
Price Increase and Entry. We investigated whether the greatest price increases were
observed when a new firm won the market rather than when the contract was allocated
to the incumbent firm. This initial evidence goes against some previous work showing
that entrants typically win auctions at lower costs than incumbents. Indeed, we find that
the greatest price increase was observed when new entrants win the tender (4.20%
price increase rather than 3.41%). However, we caution against putting much weight on
this finding, since the differences are insignificant at normal levels on a t-test (see Table
4). Rather, there is no evidence that new entrants winning was associated with a
materially different cost value. Figure 3 shows the raw percentages.

13
Figure 3: Price Increase and Entry AGGIUNGI QUANTE IMPRESE SONO (TIPO 100 CASI)
Table 4: t-test, Comparing price increase when the incumbent wins and when it does not.
New supplier Old supplier
Mean value new to old contract price 1.04 1.03
Variance 0.016 0.011
Observations 208 194
Hypotesized difference in means 0
df 395
t Stat 0.71
P(T<=t) one tail 0.24
t critical one tail 1.65
P(T<=t) two tail 0.48
t critical two tail 1.97
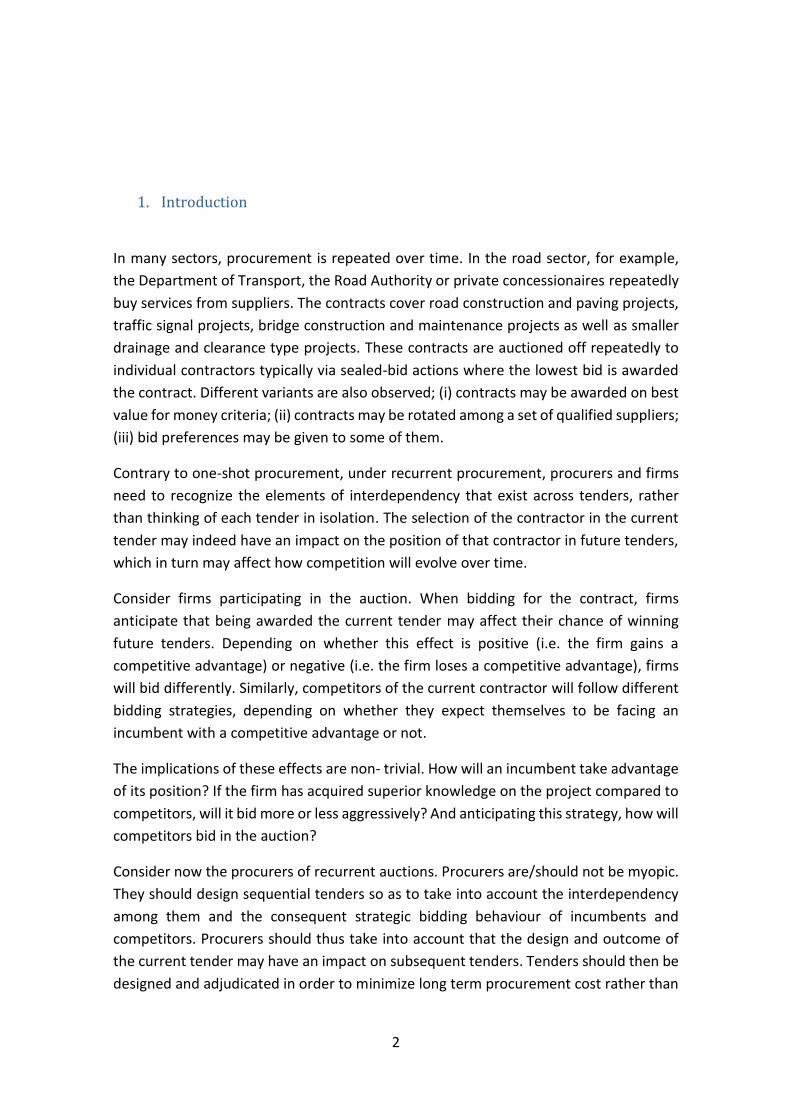
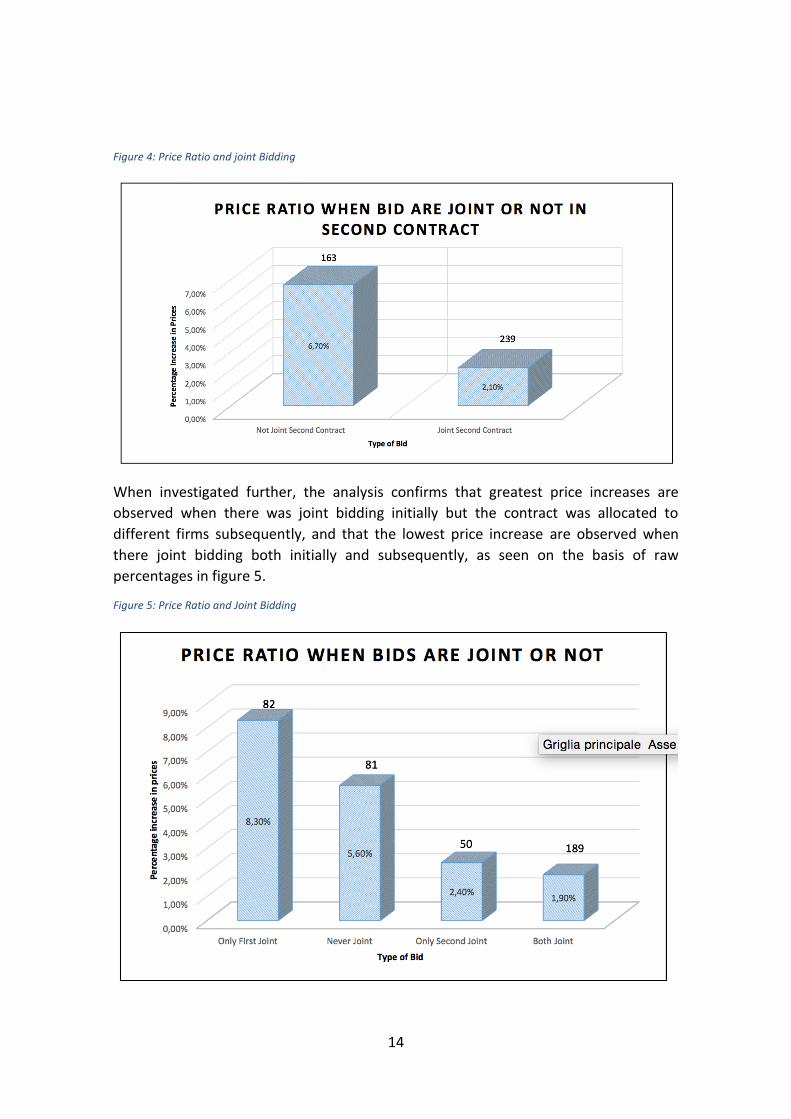
Joint bidding is associated with a lower price increase. We note that the price increase
when bids are awarded jointly to the same company tends to be lower than the price
ratio when bids are allocated to individual companies. This suggests that there may be
some economies of scale/scope in the market, which make it efficient to manage more
than one route in the package at the time. (Cantillon and Pesendorfer, 2006, explore
this issue to some extent.). This is illustrated in figure 4.
14
Figure 4: Price Ratio and joint Bidding
When investigated further, the analysis confirms that greatest price increases are
observed when there was joint bidding initially but the contract was allocated to
different firms subsequently, and that the lowest price increase are observed when
there joint bidding both initially and subsequently, as seen on the basis of raw
percentages in figure 5.
Figure 5: Price Ratio and Joint Bidding

15
Price Ratio and Contract Length. We investigated whether the price change was
somehow associated with the contract duration. A contract duration of 7 years normally
implies that new buses are bought at the beginning of the contract, so this should be
associated to the greatest level of symmetry between the entry cost of incumbents (i.e.
firms who were previously serving that route) and entrants. From Section 2.4, we should
then observe that it is easier to maintain competition over time. With a 7 year contract
of the sort described above, both the entrants and the incumbents will need to buy new
buses to be able to provide the service.
We are only able to investigate this phenomenon to some extent because we have
completed lengths only for the first contract. The raw percentages are given in figure 6.
Note that contracts lasting for fewer than five years are unusual, and often are
associated with particular circumstances, such as when a firm decides for strategic
reasons to exit the London market. The evidence in Figure 6 suggests that contract
duration is associated with different levels of price increases. However, when we run a
t-test, we found that the observed difference between the sample means is not enough
to say that the average price increase is significantly different (see Table 5).
Figure 6: Price Ratio and Contract Duration

16
Table 5: t-test, comparing 7 year sample with less than seven years
Variable 1 Variable 2
Mean value seven year to other price 1.03 1.04
Variance 0.018 0.012
Observations 142 260
Hypothesized difference in means 0
df 239
T Stat -0.74
P(T<=t) one tail 0.23
t critical one tail 1.65
P(T<=t) two tail 0.46
t critical two tail 1.97
2.3 A summary regression
The discussion above can be crystallised through a descriptive regression analysis in
which the dependent variable is the price per mile in the new contract as a ratio of the
inflation formula updated price per mile in the old. Two alternative formulations, both
incorporating the same set of right hand side variables, were tried and one of these is
listed in Table 6. One formulation examines the influences on the ratio, the other
captures the factors that lead to the ratio exceeding 1, but the results are very similar.
The rhs variables are: the ratio of the number of competitors in the new contract to the
number in the year in which the contract was previously let; whether the first contract
was extended to seven years; whether the contract was joint with other routes (there
are three cases, joint first time not second time, joint second time not first, and joint
both times); whether the same company won the route on both occasions; the year in
which the contract was let the second time.
The reasoning behind these variables is as follows. (i) Clearly, we would expect from
auction theory that if the number of bidders goes down, the price would be relatively
high. It might be objected that the number of bidders is endogenous, but here we are
not doing a cross section of number of bidders but rather a cross section of differences
in the number of bidders for the same route over time. (ii) Companies are commonly
offered the choice of whether to extend a five year contract to seven years, on the same

17
terms (but uprated according to the formula). We might expect that if the company
chooses to extend the contract, they must think it a good deal, so the likelihood is that
the rebid price when the contract comes up for renewal after seven years will be lower.
(iii) Presumably the purpose of allowing joint bids is to generate possibilities for lower
average procurement costs. However, it is not clear whether companies will always be
in a position to take advantage of this. We would expect that if the previous bid was not
joint, then the new bid will tend to be relatively low priced if it is joint. Whether or not
the other two cases will have an impact is unclear, but we might expect that if the
previous bid was joint and the current one is not, the price is unlikely to be lower in the
new bid. (iv) If the same company wins a second time then there are several reasons
why the price is likely to be lower than otherwise. One is that the company may be able
to reuse current fleet and garage location most easily. Another is that the company is
keen to hold on to the contract. On the other hand, there are also reasons why the price
might be higher, for example the company may feel confident it can win again, or may
believe it faces little or no opposition,13 (v) Finally, the contract regime can change from
time to time for many reasons- it may become less or more competitive overall,
specifications for buses may be uprated, new legislation may affect costs of operation,
compensation formulae may be too generous, or not generous enough. Therefore we
include a year counter to capture these various effects over time.
Table 6 contains the results for a representative case; the regression alternatives all led
to very similar results. Here the dependent variable is whether or not the price in the
second contract was higher, after allowing for the inflation formula, than in the first. A
probit regression is employed and the coefficients reported are the marginal effects (or,
in the case of dummies, the discrete change). The key variables where we anticipated a
definite sign yield the expected results- more competitors lead to a lower price, the
contract following a seven year contract leads to a lower price and moving from non-
joint to joint bid leads to a lower price per mile. All these are comfortably significant. On
the other hand, it is somewhat surprising that having joint bids on both occasions leads
to a lower price on average in the second case. Of more concern from the policy point
of view are the findings that if the same company wins on both occasions, the price is
higher on average, and that prices are on average rising over time, all other variables
equal. As said, there are several reasons for the latter finding, and it would be useful to
investigate this more deeply.
13 There is even the possibility of collusion to keep to particular routes, but the evidence for this is slight.

18
Table 6: Regression to investigate the determinants of whether contract prices rise or fall over time
Probit regression: Dependent is probability that the second contract is at a higher price per mile than the first.
Variable Marginal effect
z statistic
Sig level
Bidders-new/bidders-old -0.105 -2.45 5% Contract 7 -0.151 -2.63 1% Non-joint, joint -0.225 -2.28 5% Joint, non-joint -0.078 -0.9 Non Joint, joint -0.188 -2.64 1% Same company 0.112 2.13 5% Year variable 0.097 5.76 1%
398 observations
3 The Role of Garages
One of the key issues in examining the continuing role of a number of companies
competing in the London bus market alongside the high proportion of incumbent
winners is the role of the spread of their garages in ensuring this. Specifically, each of 7
companies has several garages in the London area where buses can be stabled, cleaned
and light maintenance carried out when the buses are not running. There are almost
100 garages used for TfL bus services and given pressure on land in the London area,
obtaining planning permission for and quickly constructing a new garage would be a
major proposition. New companies that have entered the market in a significant way
have done so by (amongst other things) purchasing existing garage facilities from exiting
or downsizing operators.
How important is garage proximity to the routes operated? To examine this issue
empirically takes a number of steps, facilitated by the use of compete postcodes. These
are a convenient and very accurate means of fixing geo-locations, since each postcode
refers to only a very small number of physical addresses; in the case of medium sized
commercial premises a single address and in the case of residential premises perhaps
10 properties. Hence, garages’ geo-locations can be determined by obtaining their
postcodes. It is apparent from this exercise that different companies in the London
market have different strategies- some have garages spread over the entire area whilst

19
others confine their garages to a part of London, for example RATP’s garages are all in
the North Western quadrant of Greater London.
The next step is to obtain postcodes for the routes themselves. In doing this, we
obtained postcodes for the start and end of each route in London, covering the whole
set of routes. It is possible that in the course of a route, it passes nearer to a garage than
at either end, but it would be an impossible task to evaluate this empirically.
Using a package based upon Google Maps, we then obtained driving distances and time
estimates from the start and end of each route to each garage in the London area.14
Based upon the times, we then calculated the most advantageous garage for each
company to use for each route and from this the minimum time to travel from one of
their garages to the start or end of the route. Of course we accept that the timings are
for car drivers rather than bus drivers transiting between garage and start point, but the
two should be highly correlated. Recalling that a particular route may require at peak up
to 60 buses in service at one time, the dead transfer time is likely to be a significant
determinant of the ease of operating the service.
Our key hypothesis is that this minimum time to start or end is a powerful influence on
whether the company will bid for the right to operate the route and whether its bid is
successful because it incorporates less dead time transiting between garage and route.
In other words, if the company is ranked as the closest to the route amongst the
companies we investigate, it is much more likely to be the operator of that route than if
it is not well placed.
The identities of the bidders for each route are not revealed in the reporting process,
save of course for the winner, who becomes the operator. Therefore we test the key
hypothesis by examining the identities of the operators by comparison with their rank
in the set of companies in terms of proximity to the route. We focused on operators as
at October 2015; clearly identities change from time to time.15
The test is a significant success. Table 7 below lists the count of ranks of the winners for
the routes involved. The table lists a total of 557 routes where we calculated the value.
Of these, 47% are operated by the company whose garage is nearest in time to either
14 We used the site doogal.co.uk. Using this however is a tedious business, since the package is designed to restrict commercial use, and therefore chokes the display of results considerably once the first few hundred are obtained. Hence we obtained them in blocks of a few hundred. The total number of distances and times involved is approximately 200,000 over the first 100 routes, for example. 15 This includes both routes in the first sample which were tendered at least twice, and other routes, not including the 600s, night routes and X routes.

20
the start or end of the route. Most of the others are operated by a company that is either
next nearest or third nearest, so that over 4/5 of the routes are covered by one of these
firms. The probability of this happening by chance is infinitesimally small. This provides
a clear demonstration that proximity of one of your garages to a route is a major
consideration in being able to generate a competitive bid for that route.
At the same time, this suggests a concern. If most routes are operated by the company
most favourably placed in terms of its garage locations, is there much possibility of
competition in the market? We examine this by looking at the time proximity of the
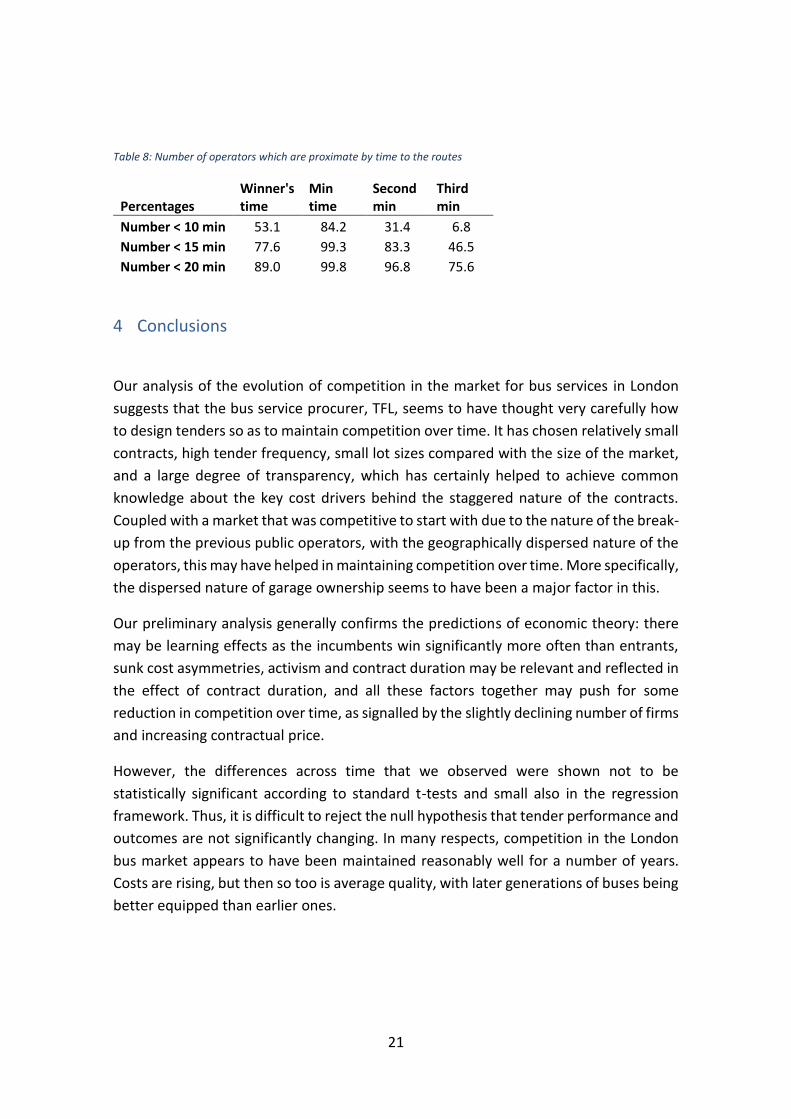
winner and of the other operators in Table 8. The meaning of the entries is as follows.
The first column shows the percentage of routes for which the operator on the route is
within 10 minutes, 15 minutes or 20 minutes as between their nearest garage and the
start or end of the route. So, over half of the time, the operator is within 10 minutes of
the route. There are 84% of the routes for which one of the firms, not necessarily the
operator, is within 10 minutes (second column). There are over 30% of routes for which
two operators are within 10 minutes (third column) but there are only a few routes (final
column) for which three or more operators are within 10 minutes. Yet still nearly half of
the routes have three operators within 15 minutes of the route.
Clearly, time of nearest garage to the location of the route is not the only criterion a
bidder will bear in mind. It will also be, for example, a question of whether they have
spare capacity in the relevant garage(s), either directly or by switching around routes
between garages. However, it is evident that there are many routes for which several
operators are well placed to bid, when the route comes up for re-tendering.
Table 7: Listing over 557 numbered TfL bus routes, ranked by minimum distance from garage of operator to start or
end of route, compared with other operators.
Winner's Rank Count Percentage
1 262 47.0
2 123 22.1
3 77 13.8
4 49 8.8
5 or greater 46 8.3
21
Table 8: Number of operators which are proximate by time to the routes
Percentages Winner's time
Min time
Second min
Third min
Number < 10 min 53.1 84.2 31.4 6.8
Number < 15 min 77.6 99.3 83.3 46.5
Number < 20 min 89.0 99.8 96.8 75.6
4 Conclusions
Our analysis of the evolution of competition in the market for bus services in London
suggests that the bus service procurer, TFL, seems to have thought very carefully how
to design tenders so as to maintain competition over time. It has chosen relatively small
contracts, high tender frequency, small lot sizes compared with the size of the market,
and a large degree of transparency, which has certainly helped to achieve common
knowledge about the key cost drivers behind the staggered nature of the contracts.
Coupled with a market that was competitive to start with due to the nature of the break-
up from the previous public operators, with the geographically dispersed nature of the
operators, this may have helped in maintaining competition over time. More specifically,
the dispersed nature of garage ownership seems to have been a major factor in this.
Our preliminary analysis generally confirms the predictions of economic theory: there
may be learning effects as the incumbents win significantly more often than entrants,
sunk cost asymmetries, activism and contract duration may be relevant and reflected in
the effect of contract duration, and all these factors together may push for some
reduction in competition over time, as signalled by the slightly declining number of firms
and increasing contractual price.
However, the differences across time that we observed were shown not to be
statistically significant according to standard t-tests and small also in the regression
framework. Thus, it is difficult to reject the null hypothesis that tender performance and
outcomes are not significantly changing. In many respects, competition in the London
bus market appears to have been maintained reasonably well for a number of years.
Costs are rising, but then so too is average quality, with later generations of buses being
better equipped than earlier ones.

22
5 References
Cantillon E. and M Pesendorfer (2006).Auctioning Bus Routes: The London Experience,
Ch. 23 in Cramton, Shoham and Steinberg (eds), Combinatorial Auctions, MIT Press,
2006.
Competition Commission (2011), Local Bus Services Market Investigation, London:
HMSO.
Saussier, S. (2013), Expected Number of Bidders and Winning Bids: Evidence from the
London Bus Tendering Model, Journal of Transport Economics and Policy (JTEP), Volume
47 (1): 17-34(18)
SMMT, (2010). Bus longevity report.
Verbich, D. and El-Geneidy, A. (2016), The pursuit of satisfaction: Variation in satisfaction
with bus transit service among riders with encumbrances and riders with disabilities
using a large-scale survey from London, UK, Transport Policy, Volume 47(1), 64-71.
Williamson, O.E. (1981) The economics of organization: The transaction cost approach,
American Journal of Sociology, 87: 548-577.