maintaining consistency between business process … · list of figures and tables ... structure of...
TRANSCRIPT

Eindhoven, July 2011
BSc Industrial Engineering and Management Science
Student identity number 0595177
in partial fulfilment of the requirements for the degree of
Master of Science
in Innovation Management
Supervisors:
Dr. P.M.E. Van Gorp TU/e, IS
Prof. Dr. Ir. U. Kaymak, TU/e, IS
Maintaining consistency between
business process diagrams and
textual documentation using the
EPSILON Model Management Platform
by
T.T.G.P. van der Molen
2
TUE. School of Industrial Engineering.
Series Master Theses Innovation Management
Subject headings: consistency maintenance, generic transformation tools, EPSILON

3
Abstract In the context of model driven engineering, many languages and tools are developed to provide in the
automatically transformation of models. Model driven engineering tools are generic in the sense that
the models don’t have to be expressed in a particular language. As long as the models are conforming to
a metamodel, such tools can deal with any model. This is interesting in the perspective of business
process management, since there are many process modelling languages like BPMN, UML, and EPCs.
Moreover, even when a company maps processes according to one particular modelling notation like
BPMN, the problem arises of constantly emerging new versions of that language. This leads to
incompatibilities at the level of modelling tools. Until now, research focused on the application of
transformation tools for the translation of models from one language to another one, and on the
migrations of models between tools for different version of a modelling language. This thesis focuses on
the investigation to what extent generic tools can be used for developing transformations that can
support in the management of inconsistencies between visual and textual representations of a business
process. It turned out that even non-IT experts can leverage such tools to build support for inconsistency
management that is more powerful than the state-of-the-art in special purpose commercial
environments. This thesis shows the potential of the use of generic transformation tools in inconsistency
management, through a transformation prototype, in complex industries such as healthcare and more
structured industries like IT service delivery. In a first stage, earlier studies about inconsistency
management are used to get a framework that indicates what inconsistency management must
comprehend. In later stages this framework is used to judge the state-of-the-art of commercialized
products and the potential of the use of a generic transformation tool in inconsistency management.
Several practical processes are used to demonstrate the potential of a prototype of such a generic
transformation tool.
4
Contents Abstract ......................................................................................................................................................... 3
List of Figures and Tables .............................................................................................................................. 6
1. Introduction .......................................................................................................................................... 8
1.1. Background Information ............................................................................................................... 9
1.2. Motivation and Relevance .......................................................................................................... 11
1.3. Objective ..................................................................................................................................... 13
1.4. Problem Statement and Research Questions ............................................................................. 13
1.5. Methodology ............................................................................................................................... 14
2. State-of-the-Art: Literature Inconsistency Management ................................................................... 18
2.1. Inconsistencies ............................................................................................................................ 18
2.1.1. Definition of an Inconsistency ............................................................................................. 18
2.1.2. Causes of Inconsistencies .................................................................................................... 18
2.1.3. Effects of Inconsistencies .................................................................................................... 19
2.2. Inconsistency Management ........................................................................................................ 19
2.2.1. Framework by Nuseibeh and Easterbrook (1999) .............................................................. 19
2.2.2. Framework by Finkelstein et al. (1996) ............................................................................... 22
2.2.3. Framework by Spanoudakis and Zisman (2001) ................................................................. 23
2.2.4. Conclusion Regarding the Frameworks .............................................................................. 24
3. State-of-the-Art: Commercialized Products........................................................................................ 25
3.1. Visual Paradigm ........................................................................................................................... 25
3.2. IBM integration tool .................................................................................................................... 26
3.3. Qmap ........................................................................................................................................... 27
3.4. Casewise ...................................................................................................................................... 27
3.5. Conclusion: Commercialized Products ........................................................................................ 28
4. Inconsistency Management Features in Practice ............................................................................... 30
4.1. Criticizing the ‘Suite tools’ .......................................................................................................... 30
4.2. Criticizing the IBM Tool ............................................................................................................... 31
4.3. Conclusion Commercialized Products for Inconsistency Management ...................................... 31
5. Improving Inconsistency Management: Using Generic Tools ............................................................. 32
5.1. Selecting a Generic Transformation Tool .................................................................................... 32
5.2. The EPSILON tool ........................................................................................................................ 34

5
6. Using the Prototype for Inconsistency Management ......................................................................... 36
6.1 The Original Prototype ...................................................................................................................... 36
6.2. The Original Prototype Expanded ............................................................................................... 38
6.3. EPSILON in the Framework of Managing Inconsistencies .......................................................... 43
7. Using the Inconsistency Management Tool in Healthcare Processes ................................................ 45
7.1. Healthcare Process: Peripheral Arterial Disease......................................................................... 45
7.2. Healthcare process: Screening Child Abuse ................................................................................ 48
8. Conclusion ........................................................................................................................................... 51
9. Recommendations for Future Research ............................................................................................. 53
10. Bibliography .................................................................................................................................... 54
Appendix A: Word.evl ................................................................................................................................. 58
Appendix B: EPML.eol ................................................................................................................................. 59
Appendix C: Table.eol ................................................................................................................................. 62
Appendix D: Execute.eol ............................................................................................................................. 63
Appendix E: PAD Visual Processes .............................................................................................................. 65
Appendix F: PAD Tabular Form ................................................................................................................... 66
Appendix G: PAD Visual Process Expanded ................................................................................................ 67
Appendix H: PAD Tabular Form Expanded .................................................................................................. 68
Appendix I: Process Model Screening Child Abuse ..................................................................................... 69
Appendix J: EPC Screening Child Abuse ...................................................................................................... 70
Appendix K: Screening Child Abuse Tabular Form ...................................................................................... 71

6
List of Figures and Tables Figure 1: Shifts in research objective .......................................................................................................... 10
Figure 2: The research objective ................................................................................................................. 13
Figure 3: Methodology used in the study ................................................................................................... 14
Figure 4: Inconsistency fanagement framework ((Nuseibeh & Easterbrook, 1999), p. 2) ........................ 20
Figure 5: Improved framework for managing inconsistencies ((Nuseibeh et al., 2000), p. 2) ................... 21
Figure 6: Difference between interference management and inconsistency management and framework
according to Spanoudakis and Zisman ........................................................................................................ 23
Figure 7: Business process modeling using textual analysis (Visual Paradigm, 2011) ................................ 25
Figure 8: Integration IBM tool ( (Rader & Vo, 2008), p. 5) .......................................................................... 26
Figure 9: Text-based procedure in Qmap ................................................................................................... 27
Figure 10: Process model in Qmap ............................................................................................................. 27
Figure 11: Auto Modeler: Use MS Word tables to gather process information ......................................... 28
Figure 12: Auto Modeler: Uploads completed tables to build process diagrams ...................................... 28
Figure 13: Framework for Managing Inconsistencies ( (Nuseibeh, Easterbrook, & Russo, Leveraging
Inconsistency in Software Development, 2000), p. 2) ................................................................................ 30
Figure 14: The Epsilon Architecture, from ((Kolovos et al., 2006), p.2) ...................................................... 35
Figure 15: Structure of EPC Practical Example ............................................................................................ 36
Figure 16: Validation output of EPSILON .................................................................................................... 37
Figure 17: Resolving a Title Inconsistency .................................................................................................. 37
Figure 18: EPSILON EVL Output .................................................................................................................. 37
Figure 19: Translation of the consistency checking rule in EOL .................................................................. 38
Figure 20: EPSILON console output ............................................................................................................ 39
Figure 21: Translation of the consistency checking rule in EOL .................................................................. 39
Figure 22: EPSILON console output ............................................................................................................ 40
Figure 23: Translation of the consistency checking rule in EOL .................................................................. 40
Figure 24: EPSILON console output ............................................................................................................ 41
Figure 25: Translation of the consistency checking rule in EOL .................................................................. 42
Figure 26: EPSILON console output ............................................................................................................ 43
Figure 27: EPSILON EVL output ................................................................................................................... 44
Figure 28: Part of the PAD treatment process ............................................................................................ 45
Figure 29: EPSILON console output PAD treatment process ...................................................................... 46
Figure 30: Part of the expanded PAD treatment process ........................................................................... 47
Figure 31: EPSILON console output expanded PAD treatment process ..................................................... 47
Figure 32: Part of screening child abuse process ........................................................................................ 48
Figure 33: EPSILON console output screening child abuse process ........................................................... 49
Figure 34: EPSILON console output screening child abuse process ........................................................... 50
Table 1: Descriptions of possible transformation tools .............................................................................. 33
Table 2: Scores of the MOFLON and EPSILON tool ..................................................................................... 34
Table 3: Structure of Table Practical Example ............................................................................................ 36

7
Table 4: Expansion of the EVL code ............................................................................................................ 44
Table 5: Part of the PAD treatment work instructions ............................................................................... 46
Table 6: Part of the expanded PAD treatment work instructions .............................................................. 47
Table 7: Part of the screening child abuse work instructions ..................................................................... 49

8
1. Introduction Companies often document their processes. Documenting processes can be done in several ways and
for different purposes. Business processes can be described in models in many different notations, but
also in textual documents, like work instructions, consisting of process descriptions in tabular form, for
example. Software process modeling objectives and goals can be the facilitation in human
understanding and communication, supporting process improvement, supporting process management,
automated guidance in performing processes, and automated execution support (Curtis et al., 1992).
Also other researchers, like (Krogstie et al., 2008), have seen overlapping objectives of the use business
process models. They see facilitating communication and coordination of modeling initiatives between
stakeholders as a main objective. Others are: gaining more knowledge about the enterprise through
computer-assisted analysis, acting as a reference point in which the work process is described according
to standards and regulations, model deployment and activation, and using the model as a context like in
a system development project.
A handbook with textual work instructions can also be used as an operation guide needed in particular
functions in a company. Think of an operation guide describing how to assemble a product, or an
operation guide which directs call center employees in the right direction for problem solving during a
phone call. A company can have different types of documentation of the same processes, because
companies have to deal with different stakeholders in their company, and different stakeholders have
different needs. In the first place, different people have different brain types. Where some people
prefer text, others prefer the use of graphics. This fact is discussed in the field of cognition, like in
(Gevins & Smith, 2000; Grabner et al., 2006). The need for particular descriptions is also influenced by
the level of education of the stakeholders. Some of them can handle visual process models, while for
others explicit descriptions of their tasks are the minimal requirement to execute their tasks decently.
An important aspect is the maintenance of consistency between these different descriptions of the
same process. For several reasons inconsistencies can occur between these descriptions. Inconsistencies
can have different levels of importance (based on, for example, their consequences). Another theme is
the fact that inconsistencies can be solved in different ways. These and several other topics will be
discussed in this study.
This study will give an overview of the challenges in maintaining consistency between business process
models and textual documents. The following sections in the introduction part give more information
about the topic of this report. Background information will be provided in section 1.1. In the background
information it is clarified why inconsistency management is seen as the most interesting and most
promising subject in comparison to other related topics. Section 1.2 has a motivational function by
bringing several arguments for doing research on this particular topic and describing the relevance of
this research. The next section provides the objective. Section 1.4 discusses the problem statement and
the research questions. The final part of the introduction discusses the method used in carrying out
research to the consistency maintenance topic.

9
1.1. Background Information
Starting point for this research project was the topic about translating text into process models. It
seemed a relevant topic, mainly because of the disadvantages of clinical guidelines. The idea for the
topic originates from the healthcare, in which the clinical guidelines in textual form probably could be
visualized in a more synoptic notation. These guidelines are often unordered, very large pieces of text
for which it is not easy to use them properly. In this format much information can be given about the
process and it could be very useful when detailed information is needed. However, often the people
executing the process are aware of what a particular step consists of. Dealing with clinical guidelines in
the extensive form is very time consuming, and mistakes are easily made (e.g. overlooking parts or
wrong interpretations). One way of dealing with these negative consequences of clinical guidelines in
textual form is the translation into process models. Main advantage of this method seems the possibility
to convert the clinical guidelines into a more structured form. A great benefit of this structuring aspect is
the fact that this could lead to more automation in healthcare. Earlier research already showed in what
way automation in healthcare can be advantageous, like in (Clarke, et al., 2005; Song, et al., 2006) It has
been researched that the more structured a text is, the easier it becomes for computerized systems to
deal with these texts (Woolf et al., 1999; Shiffman et al., 2004; Shiffman et al., 2010).
Several potential methods in which clinical guidelines could be translated into process models were
analyzed. The NT2OD tool seemed best related to the task just described, because it translates natural
text to diagrams (Dreyer & Zundorf, 2009). However, after evaluation of the tool it became clear that a
lot of mistakes are made in the translation of short and easy sentences. Therefore, the tool seems not
appropriate yet for healthcare purposes, because the textual input in this area is much more
complicated. In the search for other similar tools, it was concluded that none could be found. This fact
shows the newness and relevance of this research domain.
Because of the lack of available tools, which are able to translate written text into story process models,
it was decided to split the objective in two parts. The first step focused on converting written text in a
more structured concept, while the second step focused on translating the output of the first step into
visual process models. This shift from objective is shown in figure 1, through the change from situation 1
to situation 2. Several tools and platforms were evaluated to perform the first step: the so-called
natural language processing systems (Brill & Mooney, 1997). Tools like MedLEE, the Linguistic String
Project and MetaMap, and the natural language processing platforms UIMA and GATE were evaluated
(MEDLEE, 2010; MLP, 2010; MetaMap, 2010; Ferruci & Lally, 2004; Cunningham, 2002).
In the preparation of this study in July 2010, we rated the MedLee tool with the highest rating with
respect to several aspects like availability, input needed, ease of use, and quality of output. However,
none of the evaluated tools and platforms seemed developed and adapted well enough to use it for
process model purposes. This is unfortunate, because of the potential benefits for the healthcare area in
the future. Therefore it is questioned how it is possible to create better circumstances for using tools as
described above for healthcare purposes in the future.

10
Figure 1: Shifts in research objective
The most important outcome is the fact that it became clear that the translation from text to visual
process models seemed not feasible. Therefore it was decided to simplify the problem, and to shift the
focus to the input and output.
We have taken one step back: having both the textual document and the process model available. This
means that there is no longer the focus on the generation of complete process models out of
unstructured text. Instead, the aim will be on the situation in which both documents are already
available: consistency maintenance. This seemed less ambitious, because some parts in the output have
to be added manually. However, it also seems more ambitious than the earlier focuses, because with
consistency maintenance the focus can be bidirectional, while earlier situations were headed toward
one direction.
This shift is also shown in figure 1, by the change from situation 2 to situation 3. In comparison to
situation 1 and 2, the third situation has several differences. The consistency maintenance tool uses
both the textual documentation and visual process model as input, if one of the two is compared to the
other one. When the textual documentation is seen as the leading process description, the description
which should be most correct in essence, and is compared to the process model, both are used as input.
However, the process model will be transformed to an improved version, when necessary, and
transferred back as output. In this scenario the textual documentation will be unaffected. A scenario in
which the business process model is seen as the leading description is also possible. Another difference
focuses on internal consistency. With the consistency maintenance tool, it should be possible to check
separately whether both the textual documentation and process model are internally consistent. Finally,
there is an extra output box described in figure 1. This box represents a list of inconsistencies which can
be the result in each of the different scenarios described for situation 3. This list contains

11
inconsistencies, which cannot be solved by the tool, which are preferably not resolved, etc. These
options are highlighted later in this study. The presence of bidirectional arcs provides new scenarios,
what makes this new situation very interesting.
We have decided to use model driven engineering (MDE) for the creation of a consistency maintenance
tool. MDE is a promising approach to address the inability of third-generation languages to alleviate
their platform complexity and to express domain concepts effectively (Schmidt, 2006). The so-called
third-generation languages are the programming languages that are introduced as an enhancement to
the second-generation languages, mainly by making them more user-friendly through the use of English
words to denote variables, programming structures, and commands. Examples are FORTRAN, PASCAL,
and C++. A main problem of these languages is the growth of platform complexity. These platforms
contain thousands of classes and methods with many complex dependencies for which it is hard to
program and tune properly. For most of these applications and platform code a related problem is the
fact that these are written and maintained manually using third-generation languages. Obviously this
takes a lot of time and effort. MDE reduces these problems by combining domain-specific modeling
languages and transformation engines and generators:
“Domain-specific modeling languages whose type systems formalize the application structure, behavior,
and requirements within particular domains…DSMLs are described using metamodels, which define the
relationships among concepts in a domain and precisely specify the key semantics and constraints
associated with these domain concepts…Transformation engines and generators that analyze certain
aspects of models and then synthesize various types of artifacts, such as source code, simulation inputs,
XML deployments descriptions, or alternative model representations.” ( (Schmidt, 2006), p. 2-3)
Examples of MDE tools are actifsource1, Eclipse ATL
2, Mia-Software
3, AtomWeaver
4, but there are many
others. The transformation aspect is a heavily discussed topic in MDE like in (Sendall & Kozaczysnki,
2003; Mens & Van Gorp, 2005; Czarnecki & Helsen, 2006; Brottier et al., 2006; Schmidt, 2006; Gray et
al., 2006). The choice for using MDE is, among other things, motivated in the next section.
1.2. Motivation and Relevance
Why this topic of maintaining consistency between business process diagrams and textual documents?
What is the relevance of this topic and why is it needed? In the first part of the introduction section the
effect of having different stakeholders in the company on the need for different process descriptions is
already shortly mentioned. An employee from the IT department may prefer an easily understandable
overview of a particular process in the company without unnecessary details in a process model.
However, an employee who is executing a particular process may need a detailed description of the
tasks to be performed in that process. This makes clear why different types of process descriptions are
available and needed in companies. Because of the availability and the need of different process
descriptions, inconsistency management becomes an important theme.
1 http://www.actifsource.com/
2 http://www.eclipse.org/atl/
3 http://www.mia-software.com/
4 http://www.atomweaver.com/
12
Inconsistency management is a relevant topic which deserves more and more attention. However, the
subject of inconsistency management got relatively little attention until now (Branco et al., 2010). The
experience they gained from performing research showed that information about the topic is limited,
while the interest of companies for consistency management is increasing. The challenges in consistency
management are also recognized by others (Finkelstein et al., 1992; Finkelstein et al., 1994).
Rader & Vo (2008) emphasizes the (negative) effects of inconsistencies between business process
models and operation guides. According to them, more problems than benefits will be generated when
operations manuals are inaccurate or incomplete. Operations guides should contribute in speeding up
training and providing a baseline for expected operating procedures. But what happens when
employees discover inaccuracies or omissions? Probably they may begin to look for information
elsewhere, because they distrust the guidance. Violations of recent policy changes may be the result of
outdated guidance. And just as important, outdated process documentation can result in low morale
and high attrition rates.
A lot of time and money is invested in training employees to execute a business process in a correct
manner. But these trainings are a waste of money when employees often make mistakes as a result of
inaccurate guidance. One should think about the business impact of those mistakes. Another result of
inaccurate guidance is the occurrence of delays. How much time is needed in searching for answers?
And what are the costs (again) for the company?
The need for research to a system that can support in inconsistency management is also recognized by
Finkelstein (2000). The specific requirements for such a tool are described later, but Finkelstein
describes the needed tool as follows:
“The end goal is the construction of a lightweight and generic set of consistency management tools
which operate across heterogeneous and distributed information, to be offered as components and web
services from which an information manager will be able to assemble a consistency management
solution.” ((Finkelstein, 2000), p.5)
Important element in this last citation is the ‘generic set of consistency management tools’ part. It
suggests that a possible solution is located in the use of generic tools. A generic tool can be described as
a tool which is written in terms of meta-language shared between multiple domain specific language
tools (Clark & Bettin, 2009). Based on these statements of Finkelstein and because of the fact that the
use of generic model tools (Model Driven Engineering) is an emerging topic, a generic model tool will be
used for the creation of a consistency maintenance tool. Model Driven Engineering (MDE) is a generic
term for any model-based development. Information and details about MDE are already provided
earlier.
The fact that there is a lack of transformation studies on inconsistency management is stated by several
researchers (Schmidt, 2006; Gray et al., 2006; Van Der Straeten, 2005). Moreover, the role of model
driven engineering at related conferences is becoming more significant (MODELS 2011, Transformation
Tool Contest 2011). The International Conference on Model Driven Engineering Languages and Systems

13
(MODELS) Conference only takes place since 2008, which is an observation that shows the newness of
the topic.
Based on these observations and based on the cited literature, it must have become clear why
consistency management is a relevant topic and why it is motivated to research this topic. The following
sections discuss how the report is exactly structured based on the background information and
motivation sections just described.
1.3. Objective
Figure 2 shows the focus of the topic of this study: maintaining consistency between textual
documentation and visual process models in both directions, and for separate process documents
internally. The tool in the center of the figure must be able to look for inconsistencies and more
important it must be able to manage inconsistency in a way that the right decisions are made regarding
the handling of inconsistencies, with a final objective to improve consistency. The main objective of this
study is to develop a prototype of generic transformation tool, which shows the advantages of using
these types of tools regarding already existing tools, but also the development of a well-argued
motivation why generic transformation tools can improve the current state-of-the-art of inconsistency
management tools.
Figure 2: The research objective
1.4. Problem Statement and Research Questions
For the consistency maintenance tool described in the objective, a generic transformation tool is used as
argued in the motivation and relevance section. Because of the fact that a generic tool uses a meta-
language which is shared between domain specific language tools, it is not the tool itself which is the
consistency maintenance tool, but creates an environment in which consistency maintenance plug-ins
can be written. Therefore the generic model tool has a supportive function. To become a bit more
specific, the generic model tool must be able to perform transformations. Transformations in the textual
documentation or in the business process diagrams. This leads to the main research question as follows:
“To what extent do generic model transformation tools support the writing of consistency maintenance
plug-ins for visual process models and textual documentation in the form of work instructions?”
To answer this question several underlying topics are researched. First, it is questioned what
information literature provides us about inconsistency management. Secondly, the determination of
which commericialized tools already exists and could contribute in consistency management. These two

14
topics are combined to check how literature about inconsistency management can be applied on the
existing commercialized tools. Furthermore, it is needed to decide which generic transformation tool is
appropriate for using it in this study. And finally, it is determined which practical examples of processes
are useful to show the contribution of generic transformation tools in inconsistency management and to
use in the prototype. These topics led to the following sub-questions:
- What is an inconsistency? What causes inconsistencies? What are the effects of inconsistencies?
How to manage inconsistencies? Which frameworks exist for managing inconsistencies?
- Which consistency maintenance tools do exist? Which tools can contribute in maintaining
consistency?
- To what extent do the existing consistency maintenance tools support the frameworks
recommended in literature?
- Which generic transformation tools are available to use in this study? Which criteria determine
which tool is used for building a prototype?
- From which domain do we need practical examples of processes to demonstrate the usefulness
of generic transformation tools in inconsistency management?
In the final stage, it is discussed how generic transformation tools can improve the current state-of-the-
art in consistency maintenance by discussing the results of using the prototype. Recommendation for
future research will discuss topics like external validation.
1.5. Methodology
The approach that is used in this study distinguishes eight phases. The parts that are distinguished are
already shortly introduced in the previous section. Before discussing each phase more extensively, the
methodology is visualized in figure 3.
Figure 3: Methodology used in the study
Stage 1: The state-of-the-art knowledge about inconsistency management is researched. Evaluation of
literature about this subject gives us an overview of the current knowledge in this field of research. This

15
literature review provides us answers to questions like: How is an inconsistency defined? What causes
inconsistencies? How to deal with inconsistencies? etc. Probably most important are the
recommendations from literature which discusses how to deal with inconsistencies. These are described
in frameworks. It will be discussed which framework will be used in the remainder of the study. The
online scientific literature databases are used to get the general literature about inconsistency
management. In case of relevant articles, more research is executed to other papers of the same
authors and to relevant references in these articles.
Key words: Inconsistency management, consistency maintenance, Finkelstein, Nuseibeh, Easterbrook
Stage 2: To provide an improvement in the domain of inconsistency management, it is necessary to
determine the state-of-the-art in commercialized tools for inconsistency management. Only when the
current situation is known, it is possible to demonstrate improvements. First, information of a business
consultant, who pleads for more attention for inconsistency management, is used to determine in which
domain commercialized tools could be found that could probably support in inconsistency management.
This expert pointed at the suppliers of modeling software for businesses. General online search engines
are used to search explicitly for inconsistency management tools, and to find business process modeling
software. An expert of one of the suppliers of these types of software (Casewise) was contacted and
asked to the existence of inconsistency management tools. None explicit tool could be mentioned and
the contact thought that the synchronization components of business processes, like the one that the
Casewise tool contains, comes closest to the tool we are looking for. Therefore more research was
performed to business process modeling packages that contains software components that could
support in inconsistency management. It is preferred that a tool can satisfy several criteria like: the tool
can handle visual process models and check internal consistency; the tool can handle work instructions
in textual form and check for internal consistency; the tool can check for inconsistencies between visual
process models and work instructions in textual form preferably in both directions; the tools is able to
inform the user in case of inconsistencies.
Key words: inconsistency management tool, business process modeling software, synchronization
Stage 3: In this stage the findings of the first two stages are combined. The framework that recommends
how to deal with inconsistencies is used to assess the commercialized products that are found in the
second stage. Mainly the shortcomings of these tools will be emphasized and will serve as a basis to
demonstrate the improvements in later stages by using a generic transformation tool.
Stage 4: The fourth stage contains research to the most appropriate generic transformation tool. It is not
in the scope of this study to search for a complete list of tools which are able to perform model
transformations, and to rate them along a set of criteria. The main focus is on to what extent a generic
model transformation tool can support the objective. All the same, it is needed to motivate the use for a
particular transformation tool. It will be shown that relevant sources are used to determine which tools
can be used in this study. Criteria that are used for the final choice are: can the tool handle XML files
without an underlying metamodel, supports the tool incremental development, is testing possible
during development, does the tool support bidirectional consistency maintenance, does the tool

16
support traceability. The XML files are the result of the transformations of work instructions in a semi-
structured tabular form and a visual process model (an EPC). Clarification of these criteria is done in the
particular section itself. Finally, more information about the chosen tool will be provided.
Stage 5: The fifth stage will demonstrate how the chosen generic transformation tool is better able to
satisfy the requirements in inconsistency management according to the literature discussed in the first
stage. A first version of a prototype for managing inconsistencies, produced in the chosen tool in the
fourth stage, is available. This first version is made at the MODELS 2010 Conference in Oslo: the
ACM/IEEE 13th
International Conference on Modeling Driven Engineering Languages and Systems
(MODELS). This prototype is built on process descriptions of German establishment of the IBM
Company. In only a few hours a prototype was built for checking internal consistency of textual
documentation, and for checking consistency between process diagrams and relating textual documents
of an IBM process. This first version of the prototype and the extensively changed version of the
prototype will be used to demonstrate how the tool is able to function according to the inconsistency
management framework from the first stage. However, the IBM process will also be used in this section
to show how the theory of the code lines can be applied in a real process. IBM is an example of a
company which could extremely benefit from inconsistency maintenance tools. In a meeting with one of
the researchers of IBM, who is also doing research in the field of consistency maintenance, it was
emphasized why an inconsistency management tool could be very useful for them. The company has
different process descriptions for the different stakeholders. They have visual process models which are
preferred by the IT employees of the company, but also work instructions in tabular form for the call
center employees at the helpdesks. It is necessary for IBM to keep these different descriptions types of
the same processes consistent. That is not always easy because the different stakeholders have different
views and different expectations of the process descriptions. Adjustments to these descriptions could
therefore lead to differentiation. IBM would be pleased when this could be prevented. Therefore, the
use of an IBM process for the evaluation of the prototype seems appropriate in the context of this study.
For the evaluation, several inconsistencies will deliberately build in to show the outcome of the
prototype.
Stage 6: The sixth stage is built up in the same way as stage five. The prototype will be evaluated by
deliberately building in several inconsistencies to check whether the outcome is satisfying. However, in
this stage new processes will be used. The choice is made to use two healthcare processes. First of all it
is logical to refer back to the healthcare domain, because it was the starting point for this study, as
already discussed in the background information section. And secondly, an inconsistency management
tool could also be very useful from a healthcare perspective. Healthcare processes can be very complex.
And many healthcare processes are also captured in different process descriptions like work instructions
in tabular form and visual process models. These descriptions can for example be used by doctors to
check how a particular process has to be executed, but also by others to check whether a doctor is
executing a particular process correctly. This clarifies the need for these descriptions and the relevance
for using them in this study. The first healthcare process that will be used is a process from frequently
cited article: the treatment of peripheral arterial disease. The second process is obtained from a Dutch
hospital and describes the screening of child abuse.

17
Stage 7: In these stages the improvements of the prototype will be discussed. The previous three stages
will be recapitulated and findings will be discussed. A generalized answer will be given to the main
research question of this study: To what extent do generic model transformation tools support the
writing of consistency maintenance plug-ins for visual process models and textual documentation in the
form of work instructions? This stage is the conclusion of this study.
Stage 8: This last stage discusses the recommendations for future research. Several possible directions
will be mentioned. Probably most important will be the topic of validation. An example of a possible
future research direction is a study that researches whether the formats of the work instructions in
tabular form are useful in practice, but also the need for inconsistency management in different
domains should be validated. These and some other aspects will be discussed in this section.

18
2. State-of-the-Art: Literature Inconsistency Management
2.1. Inconsistencies
2.1.1. Definition of an Inconsistency
Before inconsistency management is discussed, the meaning of an inconsistency is defined. Finkelstein
(2000) described an inconsistency in a freely manner by defining it as something in one place, while
there is something contradictory in the other place. The equivalent of the standard logical notion of an
inconsistency is like in ‘the sky is blue’ and ‘the sky is not blue’. However, Nuseibeh et al. (2000) tried to
give it a more formal definition by defining an inconsistency as follows:
“We use the term inconsistency to denote any situation in which a set of descriptions does not obey some
relationship that should hold between them. The relationship between descriptions can be expressed as a
consistency rule against which the descriptions can be checked” ((Nuseibeh et al., 2000), p.25)
Consistency rules are introduced to make these relationships more concrete. A consistency rule is an
explicit expression of the relationship between descriptions that is required to hold. Descriptions can be
checked against consistency rules. If and only if a consistency rule has been broken, an inconsistency
occurs. These consistency rules have a logical character. Therefore it can be stated that a logical
inconsistency occurs when two propositions are contradictory and lead to fact X and its negation not X
(as in ‘sky is blue’ and ‘the sky is not blue’).
There are several sources from which the consistency rules can be derived from. First source are the
constraints from a defined requirements engineering process. This means that rules originates from the
particular method used for managing inconsistencies. Secondly, rules are derived from the particular
modeling schemes that are used. The choice for particular modeling notations also determines which
consistency rules are necessary. Probably more rules are needed when the difference between two
types of notations is bigger. A final source for consistency checking rules is the experience gained from
the past where the application is used. Besides these, there are always contingencies which could lead
to other new consistency rules.
2.1.2. Causes of Inconsistencies
Inconsistencies can occur for several reasons. In literature, several causes are mentioned for the
occurrence of inconsistencies. Nuseibeh et al. (2000) noticed the problem of updating descriptions like
user guides and process models. These types of descriptions are often constructed and updated by
different developers, and at different moments in time. In the case of the IBM and healthcare processes
described earlier, improvement consultants, process quality managers, a committee of nurses, etc.
could be seen as the developers. But also other different involved people that have different that have
different expectations and different desires from a particular process description. This could be
problematic because it can become a source for several inconsistency problems. First, if descriptions are
developed by different developers, it is assumable that descriptions will vary in formality and precision.
Secondly, it may happen that descriptions are ill-formed or self-contradictory. Third, descriptions often
evolve during their lifecycle at different rates. It is not hard to imagine that inconsistencies between
different descriptions, which should describe the same, origins here. A final problem mentioned by

19
Nuseibeh et al. is the fact that it is expensive to check consistency for a large set of descriptions. This
problem is partly caused by the difficulty of executing the task. When the amount of descriptions is
growing, it becomes very quickly infeasible to check these complete descriptions. Nuseibeh et al. also
noticed that localized consistency does not guarantee global consistency. This means that it is not
enough to check consistency only at a lower level, but also the influence on the global picture should be
taken into account.
Earlier research (Spanoudakis & Zisman, 2001; Nuseibeh, 1996) also noticed the influence of different
stakeholders. A stakeholder often has its own view. They speak different languages what leads to
different notations, which differ in level of abstraction and formality. Furthermore, different
stakeholders have different perspectives, goals, and strategies. When a stakeholder has the possibility to
influence any description, it is likely a stakeholder’s view will affect the way the description is
influenced. Also Finkelstein (2000) sees the collaboration of multiple actors as one of the foremost
causes for inconsistencies. Each actor has its own opinion, view and interpretation on the real world.
2.1.3. Effects of Inconsistencies
Main objective of inconsistency management is reducing inconsistencies, because of the negative
effects. Inconsistencies can lead to delays, and delays obviously lead to an increase of costs
(Spanoudakis & Zisman, 2001). Inconsistencies in descriptions can also jeopardize properties which are
related to quality. You can think of reliability and safety for example. However, inconsistencies can also
have positive effects. Conflicts between views, perceptions, and goals of the involved stakeholders are
highlighted. These conflicts indicate which aspects of the descriptions need further analysis and it
therefore facilitates the exploration of alternatives. According to Nuseibeh et al. (2000), inconsistencies
can be used as a tool for improving the shared understanding of the development team, as a tool for
directing the process of requirements elicitation, and finally as a tool for assisting in verification and
validation. As earlier mentioned, a committee consisting of involved people who are affected by the
process descriptions could function as a development team in this context.
2.2. Inconsistency Management
Besides the negative effects of inconsistencies, inconsistencies can also have some positive effects. It
should be noted that, according to Nuseibeh et al., inconsistency management must become central in
the development process, before inconsistency can be turned into a tool.
2.2.1. Framework by Nuseibeh and Easterbrook (1999)
Nuseibeh and Easterbrook (1999) developed a framework which could be very useful for managing
inconsistencies. Their framework is shown in figure 4. Central in their approach is the use of consistency
checking rules. These rules are used as a basis for most inconsistency management activities. As
described before, the relationships that should hold within a set of requirements is captured by these
rules. As shown in the figure, the consistency checking rules can be expanded and refined during the
inconsistency management cycle.
The framework consists of four main activities. In the first stage inconsistencies are detected in the
monitoring phase. The detected inconsistencies are then diagnosed and handled. In the fourth stage the

20
consequences of the handling actions are evaluated to check what impact the handling had on the
circumstances. The ‘measuring inconsistency’ and ‘analyze impact & risk’ activities are seen as the
cornerstones of inconsistency management. Measuring in managing inconsistencies is important,
because the handling strategy depends on the availability of the measures about progress and impact.
Figure 4: Inconsistency fanagement framework ((Nuseibeh & Easterbrook, 1999), p. 2)
2.2.1.1. Monitoring for Inconsistency
Monitoring in Nuseibeh and Easterbrook’s framework is done using the consistency checking rules.
According to them, identification of consistency rules and the process of checking whether these rules
hold or not for a particular description, is the key to effective management of inconsistencies. It is
important to specify the consistency rules very precisely, because these rules are the only means by
which detection for inconsistencies is possible (when it is done automatically). The consistency checking
rules originates from the definition of the notations used, development methods or processes used,
from contingencies and the problem domain. The consistency rules are only an indication of possible
problems. The next step, diagnosing inconsistencies, must trace the real problem.
Linking this monitoring section to real world, one should think in what time frame monitoring should be
executed. It seems not necessary to monitor constantly. First, it seems not needed to monitor for
consistencies each moment of the day, because it is logical that processes are not adjusted every day.
Moreover, it should be questioned whether a process is immediately changed when the executors of a
particular process are instructed to execute a process in a different way. Probably they are instructed by
email how to perform particular tasks, and it takes much more time before the adjustments are adapted
21
in the process descriptions. Therefore it seems that monitoring in batches is more logical than
monitoring ‘live’.
2.2.1.2. Diagnosing Inconsistency
The diagnosis phase starts when an inconsistency is detected. As shown in figure 4, the diagnose stage
contains three sub-stages: locating the inconsistency, identifying the cause of the inconsistency, and
classifying the inconsistency. Locating the inconsistency is about determining which part of the
consistency has been broken, and therefore, what led to the contradiction. In the identification stage
the actions are located that led to the inconsistency. The classification step is very important toward the
right choice of which handling strategy will be used. Classification is based on the type of consistency
rule that was broken, the type of action that caused the inconsistency, and the impact of the
inconsistency.
2.2.1.3. Handling Inconsistency
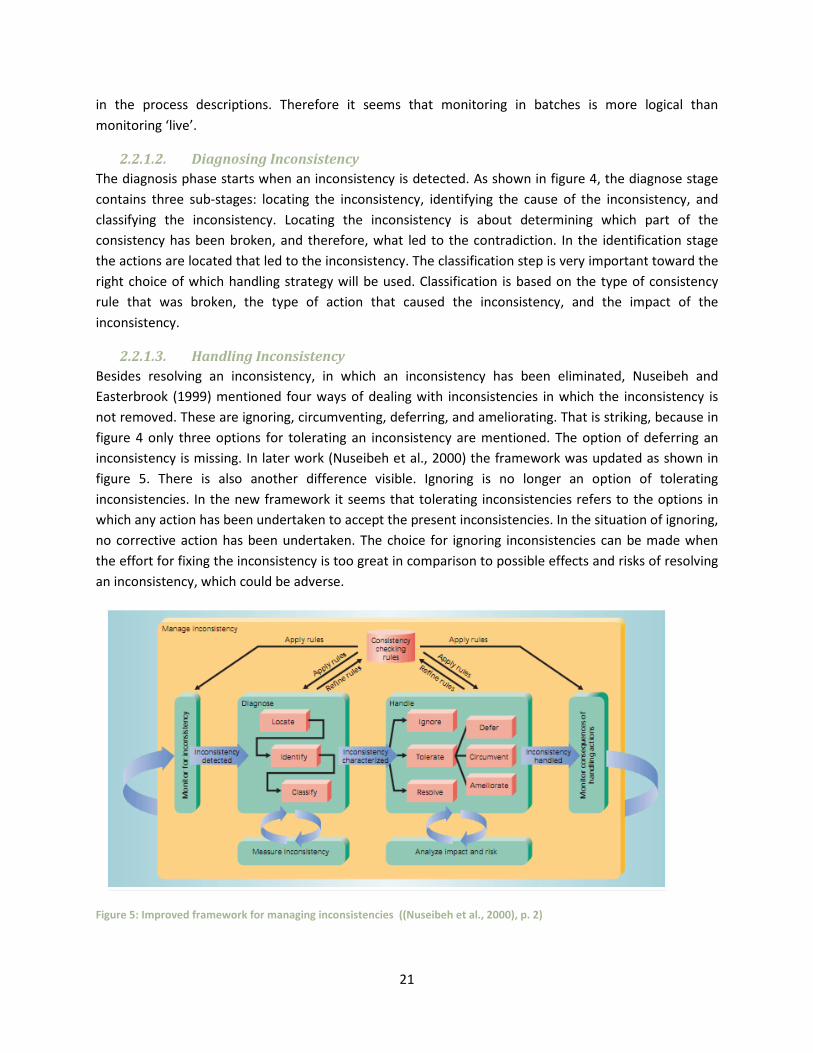
Besides resolving an inconsistency, in which an inconsistency has been eliminated, Nuseibeh and
Easterbrook (1999) mentioned four ways of dealing with inconsistencies in which the inconsistency is
not removed. These are ignoring, circumventing, deferring, and ameliorating. That is striking, because in
figure 4 only three options for tolerating an inconsistency are mentioned. The option of deferring an
inconsistency is missing. In later work (Nuseibeh et al., 2000) the framework was updated as shown in
figure 5. There is also another difference visible. Ignoring is no longer an option of tolerating
inconsistencies. In the new framework it seems that tolerating inconsistencies refers to the options in
which any action has been undertaken to accept the present inconsistencies. In the situation of ignoring,
no corrective action has been undertaken. The choice for ignoring inconsistencies can be made when
the effort for fixing the inconsistency is too great in comparison to possible effects and risks of resolving
an inconsistency, which could be adverse.
Figure 5: Improved framework for managing inconsistencies ((Nuseibeh et al., 2000), p. 2)

22
Next, the three possibilities of tolerating an inconsistency are discussed. First option is deferring.
Sometimes it may be necessary to defer an inconsistency when more time is needed, for example, to get
more information about the effects of resolving the inconsistency or labeling it as unimportant. Until
that information is available, the inconsistency can be deferred. A good handling strategy could be the
isolation of the inconsistency until further actions will be undertaken.
The second tolerating action is circumventing. Circumventing may be necessary when the consistency
rule is wrong or when the inconsistency is an exception to the rule and has therefore not been captured.
Two handling strategies that would be appropriate here, is the modification of the consistency rule or by
turning it off for a specific context.
The last manner of tolerating inconsistencies is to ameliorate them. Sometimes it may be enough to
ameliorate an inconsistency instead of resolving it completely regarding the cost-effective ratio. A
handling strategy could be the addition of information to the description to reduce adverse effects of
the inconsistency. Sometimes resolving other inconsistencies may also be a good handling strategy,
because of the side effects.
2.2.2. Framework by Finkelstein et al. (1996)
Finkelstein et. al. did also provide a framework (Finkelstein et al., 1996). However, they used their
framework for interference management instead of inconsistency management. They define
interference management as a process by which interferences are handled to support the goals of the
agents concerned. These agents can be concerned as the stakeholders who have to be satisfied. In other
words, there are people who care about the process diagrams and have several needs and expectations
from these process diagrams. The same applies for the people involved in the operational guides, the
textual documentation. And as stated earlier, these needs and expectations from the several
stakeholders can conflict.
Interference management according to Finkelstein et al. contains the following activities: overlap
identification, consistency relation construction, policy specification, policy application, detection,
analysis or diagnosis, tracking, resolution, and rationale provision. Many of the stages can also be placed
in the framework of Nuseibeh et al. (2000).
Overlap identification and consistency relation construction is about recognizing which elements are
overlapping and the creation of consistency relationships between these overlapping elements. These
two stages are quite similar to the creation of consistency rules. In the policy specification it is
determined which type of policy should be applied regarding interference management. These could be
preventive, remedial or toleration policies. Policy application is about monitoring the policy and
performing actions. The detection, and analysis or diagnosis stages are again similar to the monitoring
and diagnosing stages in the framework from figure 5. Tracking is about tracing inconsistencies and
preserving analytical information. This is comparable to what Nuseibeh and Easterbrook (1999) called
the cornerstones of their framework: measuring and analyzing. The resolution stage is similar to the
handling stage, in which several options are possible again. The last stage, rationale provision, cares
about the reasoning or argumentation of the choices that are made in interference management.

23
Figure 6: Difference between interference management and inconsistency management and framework according to
Spanoudakis and Zisman
The essential difference between interference management and inconsistency management is shown in
figure 6. Interference management can be seen as inconsistency management for the part where two
process descriptions overlap, shown by the orange rectangle. In the literature about inconsistency
management discussed so far, overlap is not a topic, and it seems to be assumed that both process
descriptions are completely overlapping. This means that both descriptions are supposed to describe
exactly the same.
2.2.3. Framework by Spanoudakis and Zisman (2001)
Spanoudakis and Zisman unify the two frameworks that are just described in one new framework
(Spanoudakis & Zisman, 2001). Their framework contains the following activities: detection of overlaps,
detection of inconsistencies, diagnosis of inconsistencies, handling of inconsistencies, tracking, and
specification and application of an inconsistency management policy.
Detection of overlaps is defined in the same way as Finkelstein et. al. (1996) did in their framework.
There must be overlap between two models, otherwise inconsistencies cannot occur. In the case of our
study, in which work instructions in textual form and process models are compared, the level of overlap
must be very high. Detections, diagnosis and handling of inconsistencies are similar to respectively the
monitoring, diagnosis and handling stage in the framework of Nuseibeh et al. (2000). The tracking
activity could be compared with the measuring and analyzing element. The last activity according to
Spanoudakis and Zisman is specification and application of an inconsistency management policy. This
policy must specify the following elements:
“(i) the agent(s) that should be used to identify the overlaps among the partial model (ii) the consistency
rules that should be checked against the models (iii) the circumstances that will trigger the detection of
the overlaps and the inconsistencies (iv) the mechanisms that should be used for diagnosing
inconsistencies and the circumstances that should trigger this activity (v) the mechanisms that should be
used for assessing the impact of inconsistencies and the circumstances that should trigger this activity
(vi) the mechanisms that should be used for assessing the cost, benefits and risks associated with
different inconsistency handling options, and (vii) the stakeholders who would have responsibility for
handling consistencies” ( (Spanoudakis & Zisman, 2001), p. 6)

24
In comparison to the framework of Nuseibeh et al. (2000) and to lesser extent to the framework of
Finkelstein et al. (1996), Spanoudakis and Zisman paid more attention to management policy and the
argumentation for particular choices in consistency management in their list of activities. This difference
is also shown in figure 6. However, it is assumable that also the choices made in the framework of
Nuseibeh et al. are well-thought choices and that, for example, a choice for a particular tolerating
strategy is not a random one.
2.2.4. Conclusion Regarding the Frameworks
It has become clear that the essences of the three frameworks overlap. All frameworks defined
relationships in consistency rules. When a consistency rule has been broken, it should be detected,
diagnosed, and handled. The frameworks of Finkelstein et al. and Spanoudakis and Zisman also included
the detection of overlaps and management policy. As just declared, it is assumable that a management
policy is also underlying the framework of Nuseibeh et al. However, detection of overlaps is less relevant
because from the perspective of our objective, overlap between process diagrams and textual
documentation will and must be very high. Because of this fact, and because of the fact that the
framework of Nuseibeh et al. focused solely on inconsistency management, in comparison to a broader
focus of the other frameworks (regarding interference management), the framework of Nuseibeh et al.
is a good alternative for using for the sequential steps in this research project. Another advantage of this
framework is the way it is visualized in figure 5, which makes it easier to understand the structure
underlying the framework. Therefore this framework is used to see how it is applicable in the
perspective of commercialized products, and how it can be used in the construction of a generic model
transformation tool.

25
3. State-of-the-Art: Commercialized Products After the exploration of the state-of-the-art regarding consistency management in literature, the focus
shifted toward the state-of-the-art regarding commercialized products. Several tools are described that
can check for consistency or can contribute in this task of keeping process diagrams and textual
documentation consistent. It should be noted that there are probably more of the same type of tools
that will get the attention here. However, main purpose of this section was to get an overview of the
type of systems that exists and probably can contribute in consistency maintenance. The research
method used was already described in the methodology section.
3.1. Visual Paradigm
Visual Paradigm is a company that provides software solutions in favor of developing quality
applications faster, better, and cheaper. The products developed by this company should remove
complexity, improve productivity, and compress development time frames. They describe their
company as follows:
“Visual Paradigm provides a suite of award-winning products that facilitates organizations to visually
and diagrammatically design, integrate and deploy their mission critical enterprise applications and their
underlying databases. Our award-winning products help your software development team to excel the
entire model-build-deploy software development process, maximizing and accelerating both team and
individual contributions.” (Visual Paradigm, 2011)
The product from their suite that seemed most interesting is the Business Process Visual ARCHITECT.
With this tool it is possible to identify business process elements by using textual analysis. As shown in
figure 6, a process description in textual form is used to model a process diagram. The important
elements in the text are selected and assigned to a particular element function it fulfills in the process
model.
Figure 7: Business process modeling using textual analysis (Visual Paradigm, 2011)

26
Consistency can be maintained in one direction: from the textual description to the process diagram.
The process model is produced by hand. Therefore this tool seems useful when the textual description is
considered as the leading document and when the process is small. When the process diagram is
considered as the leading document, this tool would not be useful, because it is not a bidirectional tool,
and producing textual documentation out of the process model is not possible. It would also be
problematic when the textual documentation is extensive. Because of the fact that the process model is
made manually, analysis would be very time consuming, and therefore very costly.
3.2. IBM integration tool
Rader and Vo discussed in their paper how the integration between two IBM solutions can be used to
achieve consistency between business process models and operation guides (Rader & Vo, 2008).
Because they explicitly focused on the subject of this research project, their solution could be very
interesting. Their idea of the integration is shown in figure 8. On the one hand they used WebSphere
Business Modeler software for the process modeling and simulation aspect, and on the other hand the
Rational Method Composer is used for defining processes and documentation. A third software
element, the Rational Asset Manager can also be helpful in the integration. By providing a centralized
repository that can be used to collaborate on process models and operational guides, it can help in
keeping operations manuals up to date.
Figure 8: Integration IBM tool ( (Rader & Vo, 2008), p. 5)
This IBM integration tool has the great advantage that it focuses on consistency maintenance and that it
is not a tool that has other objectives originally. It creates a supportive environment, in which mapping
can be done in both directions. However, there is also a big disadvantage: consistency maintenance is

27
done by hand. Therefore a large amount of changes is time consuming and costly. It is tried to reduce
this time consumption aspect in a way that the exact places of the changes are shown and that
descriptions can be copied from one document into the other. Therefore time needed is reduced as
much as possible and maintenance has become much easier.
3.3. Qmap
Qmap’s target is to support improvement programs of their customers by performing tasks like
visualizing and capturing processes simply and quickly, converting text-based procedures into process
maps, measuring, analyzing, optimizing, and controlling processes, and seamlessly link documentation
to processes (Qmap, 2011). Qmap seems to be a tool like many other existing tools, which try to support
in mapping the company and which have the possibility to perform several improvement activities.
Obviously, most important are the linking options between text-based procedures.
Figure 9 and 10 shows how textual documentation is converted into a process map. A list of tasks is
selected and copied in a Word file. By selecting the ‘Procedure Import’ button in the Qmap program, the
chain of processes is automatically loaded into the screen.
Figure 9: Text-based procedure in Qmap
Figure 10: Process model in Qmap
Getting the process map out of the documentation file is simple, and the opposite way would probably
be as easy. However, consistency maintenance between textual documentation and process diagrams
seems much harder here. First, Qmap is not focused on the consistency maintenance task. And
secondly, operation guides are often more difficult than a simple list of sequential tasks. It would be too
hard to include an operation guide which has an ID, title, and description for each task for example.
3.4. Casewise
Probably the most interesting commercialized tool that could support in consistency management is the
Auto Modeler tool which is a component of Corporate Modeler and designed by Casewise: a company
that supports in understanding and improving in customer’s business operations by providing software
and consultancy solutions. They describe their Auto Modeler tool as follows:

28
“The Auto Modeler component of Corporate Modeler provides an effective and rapid approach to
moving large amounts of information into and out of Corporate Modeler’s Central Repository. Its bi-
directional interface with MS Office facilitates a quick project start, as existing information stored in
these applications can be collected and re-used.” (Casewise, 2011)
An interesting part of this citation is the fact that the interface is bidirectional. This means that a
business process model is producible out of a table with tasks and descriptions, but the opposite way is
also possible. An example is shown in figure 11 and figure 12. Figure 11 shows a MS Word table in which
process information is gathered. This table is uploaded to build a process diagram which is shown in
figure 12. When an extra row is inserted into the description of the process information, the new table
can be uploaded and a new adapted process diagram can be produced. When new tasks are included in
the process diagram, and if the process diagram is uploaded, the description table will also include these
new tasks.
Figure 11: Auto Modeler: Use MS Word tables to gather
process information
Figure 12: Auto Modeler: Uploads completed tables to
build process diagrams
It seems that the Auto Modeler is unique in their bidirectional adaptations between table process
descriptions and process diagrams. It is notifying worthy that the table needs several symbols to make it
clear for the tool where process descriptions are placed. When everything is notated in a correct way,
synchronization between the two process documentations will be no problem. However, because of the
fact that there is a production of one document out of the other, we are not dealing with a consistency
maintenance tool.
3.5. Conclusion: Commercialized Products
The tools discussed differ on many characteristics. Most important is the difference in main objective
between the tools. Visual Paradigm, Qmap and Auto Modeler do not have their main focus on
inconsistency management. These tools provide software to support in modeling companies and to
improve the process flow. Therefore the components of the tools that can contribute to consistency
management differ in appropriateness.
Visual Paradigm supports consistency maintenance when the textual document is seen as the most
useful, and correct description of the process. A process diagram can be made based on this description.
However, this is done manually and can only be done in one direction. This makes the tool only

29
workable for small and simple processes. The same counts for Qmap. Bi-directionality would not be a
problem in this case, but only a simple list of tasks is workable in this program. When a task consists of
an ID, title and description, and when the process would contain several splits, it would be too hard for
Qmap to deal with this complexity.
The Auto Modeler tool seems most appropriate of the three tools that do not focus on consistency
management in core. Auto Modeler deals in a bi-directional way between process diagrams and textual
documentation. When a change is made in one of the two descriptions, and the other description is
produced, both will have the new change included. Another advantage of this tool compared to Visual
Paradigm and Qmap, is the possibility of dealing with more complex processes, because of the fact that
tasks are linked to each other. Each task includes the name of the previous task. However, this can also
be seen as a disadvantage. In an operation guide it is need to know what the next step is, and not the
name of the tasks that have been executed before. Another small disadvantage is the fact that some
symbols are needed for the Auto Modeler to understand how to read the table. It would be easier when
just the written text describing the process was needed.
The IBM tool is the only tool that has the main objective to maintain consistency. It tries to create an
environment in which it is easily seen when a change is made in the process diagram or operation guide.
Therefore it is a bi-directional tool. However, changes have to be executed manually. This could end in a
time consuming and costly task.
Generally, it was striking that only a few tools would be appropriate to support in consistency
management. It seems that consistency management is a topic which has been underestimated for a
long time, but for which attention increases. The currently available systems lack in appropriateness for
being a good consistency maintenance tool. Next section will discuss this in more detail.

30
4. Inconsistency Management Features in Practice Next step in this study is the comparison of the two state-of-the-arts. The question was how knowledge
about consistency management in literature can be applied to or is integrated in the commercialized
products that focused on or can contribute to consistency management. The framework of Nuseibeh et
al. (2000) was used to evaluate how the core elements in the framework are assimilated or not
assimilated in the commercialized tools. Therefore first the framework is showed again in figure 13.
Discussing each of the four commercialized tools separately for this framework seems unnecessary and
would constantly lead to recurrences. Therefore the three tools that could contribute in consistency
management by one of their components, Visual Paradigm, Qmap and Auto Modeler, are combined and
labeled as ‘suite tools’. The IBM tool is discussed separately.
Figure 13: Framework for Managing Inconsistencies ( (Nuseibeh, Easterbrook, & Russo, Leveraging Inconsistency in Software
Development, 2000), p. 2)
4.1. Criticizing the ‘Suite tools’
None of the tools seems to be designed according to the framework of Nuseibeh. et al. (or the other two
that are discussed). However, in the search for an appropriate tool that could support in consistency
management, these types of suite tools seems to come closest to support in this objective. The
commercialized tools have a synchronization element in which a process diagram can be synchronized
with text textual documents in one or both directions. However, we are still dealing with
synchronization tools and not with inconsistency management tools. Therefore, one should question
how reliable these outputs are. Because of the absence of a direct focus on consistency management,
there is no monitoring of the correct production of the process diagram out of the textual
documentation or for the opposite direction. Basically they assumed that the output of the
synchronization tool is correct, but for checking this assumption, they only option is to do it manually
again, because the facilities for consistency checking are not there. And this refers only the discussion
for the consistency between two documents. What about the internally consistency for each of the

31
documents separately? None of the suite tools considered this aspect. Because monitoring is a missing
aspect in the tools, start discussing about the diagnosing and handling aspect is not even possible.
4.2. Criticizing the IBM Tool
How can the framework be applied to the IBM tool, which is an inconsistency management tool? This
tool focused on consistency maintenance when one of the documents has been changed. If one
document undergoes a change, a notification to a central database will be sent. The particular person
that manages the document that is not changed yet sees this notification, and synchronizes the
document again. Will the notification disappear when both descriptions are similar again, or will the
notification disappear when an involved person has seen this notification and adapted? When this last
situation is the correct one, it seems more like to be a notification system instead of an inconsistency
management system, because the tool only recognizes modifications and the exact place of these
modifications.
4.3. Conclusion Commercialized Products for Inconsistency Management
It can be concluded that these types of systems fail in being a good inconsistency management tool
based on literature. Only a minimal number of systems seems to focus on inconsistency management.
The suite tools do not focus on inconsistency management, but provide an extra synchronization tool.
The IBM tool, that claimed to be an inconsistency tool, can better be described as a notification tool.
Like the suite tools, the IBM tool is that much differentiated from the managing inconsistency
framework, that it actually makes no sense to make a comparison between the IBM tool and the
framework. Therefore, it should be relatively easy to improve the current state-of-the-art regarding
available consistency maintenance tools.

32
5. Improving Inconsistency Management: Using Generic Tools
5.1. Selecting a Generic Transformation Tool
As already specified in the problem statement, a generic model transformation tool will be used to
support in the objective of maintaining consistency between textual documentation and process
diagrams. Jones et al. described what a generic model transformation tool should be able to do (Jones et
al., 2004):
“..a generic model transformation tool which accepts a set of transformation rules mapping language A
to language B, and a model in language A, and automatically produces a model in language B which is
behaviorally equivalent to the source model.” ((Jones et al., 2004), p. 5)
As already described in the methodology section, it is not in the scope to do an extensive study to the
available generic transformation tools that can be used in this context. Instead two appropriate and
relevant sources are used for obtaining an eligible transformation tool (Giese & Wagner, 2009;
Transformation Tool Contest 2010).
The first one examined many synchronization and transformation tools. MOFLON, a metamodeling
framework, gets the most positive feedback in the study of Giese & Wagner. Discussion points regarding
the other tools included the absence of explicit traceability information about the model transformation
and the fact that the tools were not appropriate for the specification of bidirectional model
transformation. These characteristics are included in the MOFLON tool.
Regarding the second source, the Transformation Tool Contest 2010, EPSILON seemed the most
appropriate transformation tool. The tool won first prices in on the transformation and migration
segments. Migration is also very relevant in the context of this project, because migration is about the
possibility to transform a model from one particular modeling language to another one. Also for the
consistency maintenance tool of this research project, two different types of the same description were
used.
Before justifying the choice for one of the two tools, both are described in table 1, to get a better
impression of what these tools are able of.
MOFLON “With the MOFLON tool set, you can perform a wide range of tasks in the fields of model
analysis, model transformation, and model integration for standard modeling languages like
UML or domain-specific modeling languages. You can create your domain-specific
engineering language (DSL) or model-driven software engineering solution (MDA/MDD)
today! To this end, MOFLON combines the comfort of using the well-known standard
languages MOF/UML 2.0, OCL 2.0, and QVT with intuitive visual graph transformation rules
and powerful declarative triple graph grammars.” (MOFLON)
EPSILON “Epsilon, the Extensible Platform for Specification of Integrated Languages for mOdel
maNagement, is a suite of tools and domain-specific languages for model-driven
development. Epsilon comprises a number of integrated model management languages,
based upon a common infrastructure, for performing tasks such as model merging, model
transformation and intermodel consistency checking. Whilst many model management

33
languages are bound to a particular subset of modelling technologies, limiting their
applicability, Epsilon is metamodel-agnostic – models written in any modelling language can
be manipulated by Epsilon’s model management languages. (Epsilon currently supports
models implemented using EMF, MOF 1.4, pure XML, or CZT.)” ( (Rose, Paige, Kolovos, &
Polack, 2008), p.256)
Table 1: Descriptions of possible transformation tools
The justification for using one of the two tools is based on several criteria. These criteria describe the
needs of a consistency maintenance tool as described in the context of this project. First, input for the
prototype will be two different documents. A way to do this is to transform both into XML. However,
these two XML files are not structured in a similar manner. The XML structure of the transformation of
the tabular work instructions differs from the XML structure of the transformed process model. The IBM
process is available in an EPC. The transformed version of an EPC into XML is called EPML. EPML stands
for EPC Markup Language which is an XML-based interchange format for Event-Driven Process Chains
(EPC) (Mendling & Nuttgens, 2005). Because of these different underlying structures, a tool is needed
which can handle XML files without having an underlying meta-model. This is a first selection criterion.
A second important aspect is about the possibility to execute transformations in an incremental way.
The framework in section 2.2.1., showed that each inconsistency is different and that an inconsistency
has several options in what way it should be handled. The big benefit of incremental transformations is
the characteristic that changes in de model or the transformations themselves can be directly linked to
their effects (Hearnden, 2006). This is a valuable feature in our context and linked to the next criterion.
It is preferred, when possible, to test the transformation tool during the development of the tool. It is
really time consuming, and therefore not practical, if a complete tool should be developed before
testing activities are possible.
Fourth, consistency maintenance must be executed in two directions. Our objective situation described
a situation in which both the textual documentation and the process diagram can be seen as the leading
models and as the model subject to improvements. Therefore the transformation tool must be able to
do transformations in both directions.
The last criterion is about traceability support. This criterion questions whether it is possible to get a
good overview of the relationships between the elements, as in the elements in the two XML files that
describe the same process. It would be good if these relationships are traceable in the transformation
tool that will be used.
MOFLON can only deal with XML when it is exchanged by the XML Metadata Interchange (XMI), while
EPSILON does support input in XML format. Incremental development is possible in EPSILON, but not in
MOFLON. Testing during development is possible in EPSILON but not in MOFLON. Maintaining
consistency in both directions is possible in both tools. However, it should be noted that bidirectional
transformations are standard in MOFLON, while both directions have to be defined in EPSILON.
Regarding the last criterion, MOFLON has better traceability support than EPSILON.

34
To get a better overview of the results of the two tools on these criteria, the scores of the MOFLON and
EPSILON tool are shown in table 2. A 3-point scale was used the express the score of each tool on a
criterion. The scores can be negative (-), moderate (0), or positive (+).
Criterion MOFLON EPSILON
1. Handles XML files without an underlying meta model - +
2. Supports incremental development 0 +
3. Testing is possible during development - +
4. Supports bidirectional consistency maintenance + 0
5. Supports traceability overview + -
Table 2: Scores of the MOFLON and EPSILON tool
Based on the scores in table 2, the EPSILON tool performed a little better. However, not each criterion
was as even important. In the context of our research, criterion 1, 2, and 3 are the most important.
Criterion 1 is important because a practical example of a transformation tool will be developed with
XML as input. Obviously it is really preferred that incremental development and testing during
development is possible, because of the fact that the prototype still have to be developed, instead of
having a finished one. This led to the conclusion that the EPSILON tool in this context was preferred
above MOFLON. In the next section some more information about the EPSILON tool is provided.
5.2. The EPSILON tool
,,Epsilon is a platform that provides the necessary infrastructure for developing task-specific languages
to support model management tasks such as transformation, merging, comparison and validation.
Currently, a number of task-specific languages are implemented atop Epsilon. Each language is
supported by an execution engine and a set of development tools for the Eclipse, that enable developers
to compose, execute and debug specifications in a user-friendly and practical environment” ((Kolovos et
al., 2006), p. 1)
The architecture of Epsilon is shown in figure 14. Each element in the framework addresses a particular
task. For example, the Epsilon Merging Language (EML) deals with merging models of common or
diverse meta-models and technologies, while the Epsilon Validation Language (EVL) deals with validity
constraints on models.

35
Figure 14: The Epsilon Architecture, from ((Kolovos et al., 2006), p.2)
Not the complete set of EPSILON components are needed to expand the existing prototype. The Epsilon
Object Language (EOL) and the Epsilon Validation Language (EVL) are the two particular components
that were used in the original prototype and that also will be used for the expansion of the prototype.
,,The primary aim of EOL is to provide a reusable set of common model management facilities, atop
which task-specific languages can be implemented. However, EOL can also be used as a general-purpose
standalone model management language for automating tasks that do not fall into the patterns
targeted by task-specific language…The aim of EVL is to contribute model validation capabilities to
Epsilon. More specifically, EVL can be used to specific and evaluate constraints on models of arbitrary
metamodels and modeling technologies.” ((Eclipse 2011), p. 22 and p.64)
In the next section it will be discussed how prototype will better be able to perform inconsistency
management in comparison to the earlier described commercialized tools.

36
6. Using the Prototype for Inconsistency Management This section clarifies how the generic transformation tool can be used to perform inconsistency
management. In this chapter the IBM process is used in the explanation, as referred to in the
methodology section.
6.1 The Original Prototype
The input for EPSILON contains work instructions in tabular form and an Event-driven Process Chain
(EPC) which are both converted to XML. It is not a simple process in which each task has one input and
one output. The process contains of several splits and joins what implicates the presence of several
parallel processes.
.. .. ..
4.
KP.INC.1.15.3
<Task title> <Task description>
5.
KP.INC.1.20.1
<Task title> <Task description>
When possible: Go to step 6
Otherwise: Go to step 7
.. .. ..
Table 3: Structure of Table Practical Example
In table 3 it is shown how the original table is
structured. It contains of three columns. The
first one gives the task number and task ID
(KP.INC….). The second column gives the title of
the task, while the third table column contains
the description of the task and the references to
the next step when this is not automatically the
next successive task step. Figure 15 shows the
same part of the process in an EPC. The green
blocks represent the tasks and includes the task
title. The pink blocks represent an event and
describe what has been happened after
execution of the preceding task. In the case of
task 5, the outcome can lead to step 6 or step 7,
as shown in table 3. This is shown in the EPC by
means of the XOR split and the two events.
Figure 15: Structure of EPC Practical Example
The original prototype has the possibility to execute three different tasks for checking consistency.
These are the three following tasks:
- An internal consistency can be checked for the table document. It checks whether the tasks with
the same ID also have the same title.
- A consistency can be check between the two process descriptions: check whether all tasks in the
table document also appear in the EPC document, based on their ID.

37
- A consistency can be check between the two process descriptions: it is checked whether each
task in the EPC document is the same as in the table document, based on their ID. When they
differ the task in the table document is updated.
Before discussing the expansion of this prototype, it is briefly showed how the first task just described
works. EVL is used for this task, what made it possible to include a fix to resolve the inconsistency that
was described in the quick-fix. The complete set of code line is shown in appendix A. With these code
lines it is checked whether the titles of the tasks with the same ID are similar. When this is not the case,
a message will be shown for which ID the titles are not similar. This message is shown in figure 16.
Figure 16: Validation output of EPSILON
There are multiple titles for the task that is described with the ID KP.INC.1.4.2. In an interactive way, the
correct title can be chosen and will be fixed in the document. In figure 17 it is shown how manually the
inconsistency can be resolved.
Figure 17: Resolving a Title Inconsistency
Right-clicking on the inconsistency message
gives the option to make the titles uniform. In
figure 18 it is shown which titles are in the table
and are having the same ID. Manually a choice
can be made for the correct title, and the wrong
title in the table will be corrected to the title
manually chosen. This way an inconsistency is
resolved. Because the input of a German
company is used, the contents of this input are
also in German.
Figure 18: EPSILON EVL Output
Until this point it is shown how MDE experts from the MODELS Conference, who are having a huge
amount of programming experience, are able to build a prototype that can already contribute in
inconsistency management. However, this study is executed from a perspective that has not the
objective to develop a tight tool that would be immediately useful in practice. Main objective is to show
how a generic transformation tool is better able to perform inconsistency management than the already
described commercialized tools. An ultimate prove for this is to show how the prototype can be
expanded, with only a minimum of programming experience. This is done next.

38
6.2. The Original Prototype Expanded
We expanded the prototype with tasks that go deeper into the structure of the table and the EPC
document. Instead of focusing at the superficial tasks like checking whether the tasks have the same
title in both descriptions, the focus was shifted to the structure of the process. This was done with the
following tasks:
- Checking whether a XOR split in the table document is also in the EPC document, and the
opposite way.
- Checking whether the steps after the XOR split in the table document are the same as in the EPC
document, and the opposite way.
We started with the first task where it is checked whether the XOR splits in the EPC document are also
present in the table document. EOL was used to define this task. The code lines in figure 18 can be seen
as a translation of the consistency checking rule for this task in which the following relationship is
defined: A XOR split in the EPC document, must also be in the table document.
Figure 19: Translation of the consistency checking rule in EOL
The code-lines in figure 19 check this relationship and will be clarified:
- Table!`t_w:tr`.all: collects all the table rows from the table and f always represents one row of
this collection on which the operations that follow are executed
- f.XorTest() = true: checks whether a table row represents a XOR split
- c1: is an empty collection
- f.getEPMLXorTitles(): gets all the titles of the XOR splits that are in the EPC document
- f.getXorTitle(): gets the title from the table row
This makes that figure 19 can be read as:
For each table row (f) in the collection of all table rows (Table!`t_w:tr`.all), if the table row represents a
XOR split (f.XorTest() = true) and the collection c1 does not already include the title of the table row
(c1.includes(f.getXorTitle())) and the collection of XOR splits titles in the EPC document does not include
the title of this XOR split (f.getEPMLXorTitles().includes(f.getXorTitle())) then print a line that says that
this XOR split title is missing in the EPC document (f.getXorTitle() + “ is a missing XOR split in the EPML
document”).println()), and add the XOR title of the table row to the collection c1
(c1.add(f.getXorTitle())).
The operations in figure 19 are defined by underlying operations, but it is not necessary to clarify all of
these operations. However, the operations are included in the report and can be found in the

39
appendices. The operations that can be applied at the EPC document are attached in appendix B. In
appendix C the operations that can be applied at the table document are attached, while the complete
sheet with the consistency checking rules that are explained in this section and a few additional needed
operations for these checking rules are attached in appendix D.
When all the XOR splits in the EPC document are also in the table document, no message will be showed
in the console. However, when a XOR split in the EPC document cannot be found in the table document
for a message will be shown in the console as defined in figure 19. This is the case when the complete
XOR split is not in the other document, but also when the titles are not spelled in a similar way. This can
be prevented by using consistency rules which correct the titles when they are the same but misspelled
as described in the original prototype earlier. If the XOR split title from the table cannot be found in the
EPC, the message shown in figure 20 will be displayed in the console. The message shown is similar to
the message defined in the code lines in figure 19.
Figure 20: EPSILON console output
When all the XOR splits in the table document are also the EPC document, this does not exclude that all
the XOR splits in the EPC document are also in the table document. That is why the opposite direction is
also specified. This relationship is defined as follows: A XOR split in the table document, must also be in
the EPC document. Again this relationship can be seen as a consistency checking rule. The translation of
this consistency rule in code lines is shown in figure 21.
Figure 21: Translation of the consistency checking rule in EOL
The code-lines in figure 20 check this relationship and will be clarified:
- EPML!`t_arc`.all: collects all the arcs from the EPC document and f always represents one arc of
this collection on which the operations that follow are executed
- f.checkCon(): checks whether the source ID of the arc is also in the collection of XOR IDs,
whether the amount of targets of the arc is bigger than one, and whether the arc target ID is
also in the collection of arc source IDs (to be sure that a XOR split does not end up in an event
instead of a function)

40
- f.checkCon2(): checks whether all outgoing arcs lead to another function
- var n: is a variable that determines the size of the amount of XOR splits
- c2: is an empty collection
- f.getTableXorTitles(): gets all titles of the XOR splits that are in the table document
- f.getFuncTitle(): gets the title from the XOR split
This makes that figure 21 can be read as:
For each arc (f) in the collection of all arc (EPML!`t_arc`.all), if the arc source represents a XOR split
(f.checkCon() = true and f.checkCon2()=true), the XOR title is not already in collection c2
(c2.includes(f.getFuncTitle())) and the collection of XOR splits titles in the table document does not
include the title of this XOR split (f.getTableXorTitles().includes(f.getFuncTitle())) then print a line that
says that this XOR split title is missing in the table document (f.getFuncTitle() + “ is a missing XOR split in
the Table document”).println()), and add the XOR title to the collection c2 (c2.add(f.getXorTitle())).
If the XOR split title from the table cannot be found in the table, the message shown in figure 22 will be
displayed in the console. The message shown is similar to the message defined in the code lines in figure
21. Also in this case the need for similar titles is relevant here.
Figure 22: EPSILON console output
As explained earlier, EPSILON supports bi-directional consistency maintenance management. This is not
done atomically, but instead both directions have to be specified. This is just shown. Separately checking
whether the XOR splits in the EPC document are in the table document, and checking whether the XOR
splits in the table document are in the EPC document.
This bi-directionality aspect is also shown in the following expansion of the prototype. The consistency
checking rule is defined as follows: a XOR split in the EPC document must have the same subsequent
step as the same XOR split in the table document.
Figure 23: Translation of the consistency checking rule in EOL
The code-lines in figure 22 check this relationship and will be clarified:
- Table!`t_w:tr`.all: collects all the table rows from the table and f always represents one row of
this collection on which the operations that follow are executed
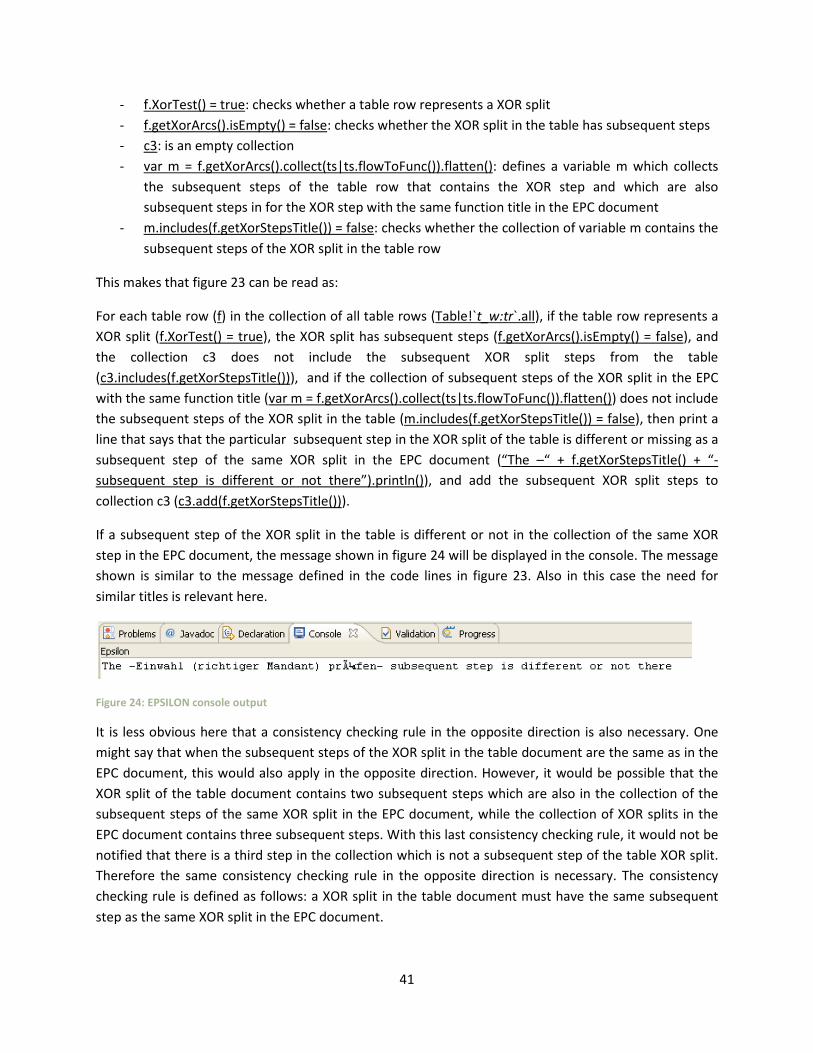
41
- f.XorTest() = true: checks whether a table row represents a XOR split
- f.getXorArcs().isEmpty() = false: checks whether the XOR split in the table has subsequent steps
- c3: is an empty collection
- var m = f.getXorArcs().collect(ts|ts.flowToFunc()).flatten(): defines a variable m which collects
the subsequent steps of the table row that contains the XOR step and which are also
subsequent steps in for the XOR step with the same function title in the EPC document
- m.includes(f.getXorStepsTitle()) = false: checks whether the collection of variable m contains the
subsequent steps of the XOR split in the table row
This makes that figure 23 can be read as:
For each table row (f) in the collection of all table rows (Table!`t_w:tr`.all), if the table row represents a
XOR split (f.XorTest() = true), the XOR split has subsequent steps (f.getXorArcs().isEmpty() = false), and
the collection c3 does not include the subsequent XOR split steps from the table
(c3.includes(f.getXorStepsTitle())), and if the collection of subsequent steps of the XOR split in the EPC
with the same function title (var m = f.getXorArcs().collect(ts|ts.flowToFunc()).flatten()) does not include
the subsequent steps of the XOR split in the table (m.includes(f.getXorStepsTitle()) = false), then print a
line that says that the particular subsequent step in the XOR split of the table is different or missing as a
subsequent step of the same XOR split in the EPC document (“The –“ + f.getXorStepsTitle() + “-
subsequent step is different or not there”).println()), and add the subsequent XOR split steps to
collection c3 (c3.add(f.getXorStepsTitle())).
If a subsequent step of the XOR split in the table is different or not in the collection of the same XOR
step in the EPC document, the message shown in figure 24 will be displayed in the console. The message
shown is similar to the message defined in the code lines in figure 23. Also in this case the need for
similar titles is relevant here.
Figure 24: EPSILON console output
It is less obvious here that a consistency checking rule in the opposite direction is also necessary. One
might say that when the subsequent steps of the XOR split in the table document are the same as in the
EPC document, this would also apply in the opposite direction. However, it would be possible that the
XOR split of the table document contains two subsequent steps which are also in the collection of the
subsequent steps of the same XOR split in the EPC document, while the collection of XOR splits in the
EPC document contains three subsequent steps. With this last consistency checking rule, it would not be
notified that there is a third step in the collection which is not a subsequent step of the table XOR split.
Therefore the same consistency checking rule in the opposite direction is necessary. The consistency
checking rule is defined as follows: a XOR split in the table document must have the same subsequent
step as the same XOR split in the EPC document.

42
Figure 25: Translation of the consistency checking rule in EOL
The code-lines in figure 25 check this relationship and will be clarified:
- EPML!`t_arc`.all: collects all the arcs from the EPC document and f always represents one arc of
this collection on which the operations that follow are executed
- f.checkCon(): checks whether an arc has a XOR split as a source
- f.getXorArcs2().isEmpty() = false: checks whether the XOR split in the EPC has subsequent steps
- var m = f.getXorArcs2().collect(ts|ts.getXorStepsTitle()): defines a variable m which collects the
subsequent steps of the arc in the EPC that contains the XOR step and which are also
subsequent steps in for the XOR step with the same function title in the table document
- var n = f.flowToFunc().flatten().size(): defines a variable n which determines the amount of
subsequent steps after the XOR split
- m.includes(f.flowToFunc()) = false: checks whether the collection of variable m contains the
subsequent steps of the XOR split in the arc of the EPC document
- c4: is an empty collection
This makes that figure 25 can be read as:
For each arc (f) in the collection of all arc (EPML!`t_arc`.all), if the arc contains a XOR split (f.checkCon() =
true) and the XOR split has subsequent steps (f.getXorArcs2().isEmpty() = false), and if the collection of
subsequent steps of the XOR split in the table with the same function title (var m =
f.getXorArcs2().collect(ts|ts.getXorStepsTitle())) does not include each subsequent step (var n =
f.flowToFunc().flatten().size()) of the XOR split in the EPC (m.includes(f.flowToFunc()) = false), then print
a line that says that the particular subsequent step in the XOR split of the EPC is different or missing as a
subsequent step of the same XOR split in the table document (“The –“ + f.flowToFunc() + “- subsequent
step is different or not there”).println()).
If a subsequent step of the XOR split in the EPC is different or not in the collection of the same XOR step
in the table document, the message shown in figure 26 will be displayed in the console. The message
shown is similar to the message defined in the code lines in figure 25. Also in this case the need for
similar titles is relevant here.

43
Figure 26: EPSILON console output
6.3. EPSILON in the Framework of Managing Inconsistencies
By applying the original and expanded prototype on the IBM process, it is shown how the generic
EPSILON tool can be used to perform consistency management between business process diagrams and
textual documentation. Based on these examples the EPSILON tool will be placed against the framework
of Nuseibeh et al. (2000). The main elements of this framework are consistency checking rules,
monitoring for inconsistencies, diagnosing inconsistencies, and handling inconsistencies.
From last section it already has become clear how consistency checking rules can be represented in
EPSILON. When you are little acquainted with the programming skills needed for EPSILON it is relatively
easy to translate the consistency checking rules to a consistency checking rule in EPSILON. The EPSILON
tool itself uses the consistency rule to monitor and diagnose. The complete XML files are monitored and
checks if the consistency rule is satisfied for every section where it applies on. When this is not the case,
it is immediately diagnosed for which part the consistency rule is not satisfied. This is communicated to
the user by showing a message in the console as described earlier.
The diagnosis of inconsistencies seems to be an activity that is done by the tool itself: it runs and it sends
a message to the console that tells us that an inconsistency is diagnosed. However, the diagnosing stage
could become a much more complex one, when aspects like the assignment of priorities to
inconsistencies are included. Priority characteristics for inconsistencies can for example be important to
determine which inconsistencies are needed to resolved first (Spanoudakis & Zisman, 2001). Regardless
of the fact that the priority of an inconsistency is not shown in the prototype, there are probably many
ways to include this. First, the tool executes the consistency checking rules from top to bottom. The
inconsistencies that occur according to upper checking rules will therefore be outputted first. This could
make one decide to place the most important consistency checking rules on top. Another option would
be the addition of a priority number to an inconsistency that depends on the particular checking rule
that detects the inconsistency. More important checking rules could for example assign higher priority
numbers to inconsistencies.
The handling of an inconsistency got less attention until now. In the explanation of the expanded
prototype it stopped when an inconsistency has been diagnosed. However the handling of
inconsistencies is also possible with EPSILON. This was already partly shown in the explanation of the
first task in the original prototype, in which the internal consistency of the table is checked and
improved regarding the same titles for similar IDs aspect. The inconsistency example showed that the
correct title can be chosen. However, when this example is translated this to the framework, it should
be concluded that the only possible handling option is ‘Resolve’ in this case, while the framework
provides five different handling choices.
By expanding the EVL file that describes the internal title consistency check for the table, which is shown
in appendix A, options can be added for dealing with occurring inconsistencies. The EVL contains one fix,

44
the resolving option, but EPSILON allows it to add more fixes in one constraint check. For example, an
option can be added that says that the inconsistency can be ignored, like in the framework. In doing this,
the rules must be added below the already existing ‘fix’ part (or above), as shown in table 4:
fix {
title : "Ignore this inconsistency"
do {…
} Table 4: Expansion of the EVL code
This part of the inconsistency part was not expanded, however it should be relatively easy to add a few
code lines to add this option. Adding these lines, without any extra code in the ‘do’-part, the console will
have an extra option regarding the inconsistency handling. When executing the expanded EVL file, this
expansion results in the message which is shown in figure 27.
Figure 27: EPSILON EVL output
When this option is executed, nothing happened to the table document. Execution of the same task
again would therefore result in the same option again. When the tool runs many times, it could be
annoying that for this inconsistency the ignoring option has to be executed each time. A possible
solution could be the creation of a particular collection that remembers the ignored inconsistencies, and
which is not emptied when a new runs starts. Furthermore it could also be possible to add a ‘*’ for
example to the particular inconsistencies that are ignored. In a new run it can be stated that
inconsistencies that include a ‘*’ can be skipped. Probably there will be more solutions for this type of
problem. However, most important is the fact that depending on the possible options needed for a
particular consistency checking rule, the needed options can be added in the same way as just shown.
This demonstrates that EPSILON also satisfies in the possibilities to handle inconsistencies according to
the model of Nuseibeh et al.

45
7. Using the Inconsistency Management Tool in Healthcare Processes As stated before, the consistency maintenance tool would be applied in the healthcare domain. Last
section shows us that a generic transformation tool could have positive contribution in developing
inconsistency management tools. However, until now the tool was only tested on the same process as it
was built on: the IBM process. Therefore two healthcare processes were taken: one from literature and
one from a Dutch hospital. For the process from literature an often cited article was taken about the
treatment strategy for peripheral arterial disease (Norgren, Hiatt, Dormandy, Nehler, Harris, & Fowkes,
2006). For the hospital process a description of the screening for child abuse was taken. Instead of
explaining the code lines extensively as done in previous section, the focus will be on some complex
situations in the new processes and what the output of the prototype will be in these cases. The exact
same code lines are used as in the previous section.
7.1. Healthcare Process: Peripheral Arterial Disease
The treatment strategy for peripheral arterial disease (PAD) is shown at the left figure of appendix E. It is
a relative small process, however interesting, because it includes a few XOR splits. To implement this
process into the prototype, it has to be transformed to an EPC. This EPC is shown at the right of
appendix E. It is the same process in a different notation. Also a tabular form is needed to perform
consistency maintenance between work instructions and the visual process model. Therefore the
process was translated into smei-structured work instructions, which is shown in appendix F.
Probably most complicated is the step in which
claudication medical therapy is executed. In this
small process this function is a first step after a
XOR split but it also initiates a new one. This
part of the process is shown in figure 28. To test
the inconsistency management tool, we
changed the particular step into ‘Something
else’. In the work instructions this change is not
applied. This creates a situation in which the
two descriptions of the same process are
different, and for which the tool should notify
that the two descriptions are not consistent.
Figure 28: Part of the PAD treatment process
The part of the tabular form which describes the same process is shown in table 5. Step 2 is the XOR
split that could lead to the execution of claudication medical therapy, while step 3 is the claudication
medical therapy step itself, which is again a XOR split.

46
Table 5: Part of the PAD treatment work instructions
The console output in figure 29 shows four messages. The first one says that claudication medical
therapy is a missing XOR split in the EPML document. This is true from the perspective of the work
instructions, because that XOR split was changed into ‘Something else’. However, from the perspective
of the EPML document one could also say that the ‘something else’ XOR split is missing in the work
instructions. This is shown by the second message in the console. However, as already stated, the
claudication medical therapy step is also a subsequent step from the preliminary XOR split. Because of
the change of the title, the third message clarifies that the step is different or not there. It might be clear
that this message is from the perspective of the work instructions. The last message is the result when
the EPC is seen as the leading document.
Figure 29: EPSILON console output PAD treatment process
We showed that the prototype works well on a new and different process, instead of the process on
which the prototype is build. However, it should also be noted that the process has no new elements
included which were not in the process of the IBM process. Therefore we expanded the original process
of PAD treatment by adding a side process, which is shown in appendix G. The new added part is
emphasized by the orange-colored frame. Also the work instructions have to be adapted to the new
situation. This is shown in appendix H. There are several new situations compared to the process on
which the prototype was build. First, a new situation is created in which the XOR split leads to three
events instead of a maximum of two. Secondly, instead of a XOR split or a function, an AND split was
added behind an event. Finally, this led to a situation in which it is possible that two functions have to be
performed after a XOR split, because of the AND split. After running the prototype on the new situation,
no messages were shown in the console. To perform a real test, some inconsistencies were included in
the new added part, to check whether the consistency maintenance tool really notifies the
inconsistencies.
In contrast to the last test of the tool, some changes were made in the work instructions instead of the
process model. In the new added part, the two functions that flow out of the AND split after the XOR

47
split are changed. Extra function 1 and extra function 2 are respectively changed into ‘Something else’
and ‘Something else 2’. The changes are shown in table 6.
Table 6: Part of the expanded PAD treatment work instructions
In figure 30 the original correct process is
shown in the process model. The XOR split has
three outgoing arcs, and could lead, because of
the AND split, to four subsequent steps. The
subsequent function of the middle outgoing arc
cannot be seen in the process model, but is
definitely there, as also shown in the work
instructions. Most interesting here is the
question whether the tool recognizes both extra
functions that flowing out of the outgoing XOR
split arc on the right.
Figure 30: Part of the expanded PAD treatment process
After running the inconsistency management tool, the output in figure 31 was shown. The result is
satisfying. From the perspective of the work instructions, the tool recognizes that both the ‘Something
else’ and the ‘Something else 2’ subsequent steps are different or not there. Obviously this is true,
because in the process model these steps are still called extra function 1 and extra function 2. Again the
third and fourth messages are equivalent messages, however in this case from the perspective of the
process model. This example shows that adding an AND split after a XOR split does not confuse the tool
and that both subsequent steps are recognized.
Figure 31: EPSILON console output expanded PAD treatment process
Until now it is shown that the inconsistency maintenance tool can deal with the German process model
on which it is build, on the small healthcare process in which the treatment of PAD is described, and on
an expansion of this healthcare process. Next section shows a new bigger healthcare process which
again includes new elements.

48
7.2. Healthcare process: Screening Child Abuse
The next process comes from a Dutch hospital and it describes the screening of child abuse. The original
process model is shown in appendix I. Also in this case, the original process model was transformed to
an EPC. This EPC is shown in appendix J. This process is far more extensive than the healthcare process
just described. The ‘screening child abuse’ process consists of many XOR splits. A very interesting part in
the process is the ‘Fill in screening questions’ –function. The function itself is a XOR split and can
therefore lead to two other functions. However, this function is also a subsequent step in four(!) other
XOR splits.
The part of the process which includes this
function is shown in figure 32. However, in this
figure it is already shown that the original title
of the function has been changed into
‘Something else’. In this figure it is not showed
that four XOR splits lead to this function, but
appendix J does. It should be clear that the
process model is changed in this situation and
that the work instructions in tabular form are
kept in the original state.
Figure 32: Part of screening child abuse process
Table 7 shows the function in task 2, but it also shows that the function is a subsequent step in task 1. It
was mentioned that there are three other XOR splits that also have this function as a subsequent step.
These are task 7, 8, and 10, and are shown in table 8. Based on earlier outcomes of the inconsistency
management tool one could expect that for each difference between the models a message is shown in
the console for both directions. This would lead to four times a difference in the subsequent step of the
XOR splits in both directions (4 x 2 = 8 messages) and a difference in both directions when the task
functions as a XOR split (1 x 2 = 2 messages). This would lead in to ten messages in total.
Table 7: Part of the screening child abuse work instructions
Table 8: Part of the screening child abuse work instructions

49
The result of running the inconsistency management tool on this process in this situation leads to the
outcome shown in figure 33. Instead of ten messages, only four are shown. Again the console notifies us
that the function differs in both directions when it functions as a subsequent step and when it functions
as a XOR split. This would lead to two times two messages. However, why shows the console four
messages instead of ten? Earlier it is described that the functions described in code lines also include
collection variables (c1, c2, c3, and c4). It was explained that these collections are used to check whether
a particular message is already shown in the console or not. The use of these collections is very useful
here, because they prevent the tool from showing the other six same messages here. Ten messages
would implicate many inconsistencies in the process, while there are only two inconsistencies in two
directions.
Figure 33: EPSILON console output screening child abuse process
A final interesting part of the process model is on the right bottom of the model where two XOR splits
are connected to each other. The functions ‘Determine level of suspicion’ and ‘Fill in screening
questions SPUTOVAMO form’ are both have the same XOR split here, what makes the process model
more complicated. The question is whether both functions are recognized as a XOR split, because they
both have the same subsequent steps, as shown in table 7. In this figure the titles of the functions are
already changed to ‘Something else’ and ‘Something else 2’.
Table 7: Part of the screening child abuse work instructions
The process model is kept in its original form and is shown in figure 34. Here it can be seen that two XOR
split have the same optional subsequent steps. Because of the fact that there are two XOR splits and
two outgoing subsequent steps, two XOR splits symbols are needed in the EPC process model. It is
important that in this created situation both XOR split functions are recognized, instead of a notification
of only one the functions in the console output.

50
Figure 34: Part of screening child abuse process
The output shown in figure 35, is the result of running the inconsistency maintenance tool. Again the
result is satisfying. The figure shows that both XOR splits are recognized and differ both in two
directions, which leads to two times two messages.
Figure 35: EPSILON console output screening child abuse process

51
8. Conclusion A consistency can be described as a relationship, a consistency checking rule, which should hold
between two elements. When the rule is broken an inconsistency occurs. In the perspective of textual
documentation of processes and business process diagrams, inconsistencies originate from several
sources. The involvement of different stakeholders is a main source. Different stakeholders need
different levels of formality and precision in process descriptions. This will influence their contribution to
the construction of development of these descriptions. Another source is the fact that the descriptions
evolve at different rates. If one description is improved, it not ensures that the other description is also
revised in the same way. These problems showed the need for a consistency management tool, because
doing consistency management manually is a time consuming and costly task.
The framework of Nuseibeh et. al. (2000) seems a perfect framework for dealing with inconsistencies. It
focuses solely on inconsistency management, while the other frameworks researched, also included
interference management. This means that factors like mapping were also included. However, these
seem not relevant here. Nuseibeh et. al.’s framework, including the four main components of
consistency checking rules, monitoring inconsistencies, diagnosing inconsistencies, and handling
consistencies, showed how the commercialized tools fails in inconsistency management.
This is caused by the fact that the subject of inconsistency management tools is not well researched yet.
The tools discussed that probably could contribute the most in inconsistency management failed in their
suitability according to the framework used. The suite tools do not focus on inconsistency management,
but offer an extra element which tries to synchronize between textual documentation and process
diagrams. The tools differed in direction of synchronization and the degree of complexity of the
description for which they can deal with. The suite tools actually cannot be labeled as inconsistency
management tools, because none of the elements from the framework are included in each of the tools.
Also the IBM tool, which claims to be an inconsistency management tool, cannot be seen as this type of
tool. It is a notification system which has not the possibility to do consistency management according to
the framework.
It was expected that a generic transformation tool could improve this current state-of-the-art regarding
available inconsistency management tools. And it did. It can be concluded that the EPSILON platform is
an appropriate platform for the construction of an inconsistency management tool. It is showed that the
four main elements in the framework are all implemented in the practical example that was
constructed. Consistency checking rules can perfectly be translated into the system. In the first place it
was shown that the original prototype, made by MDE experts, is better able to execute inconsistency
management in comparison to the discussed commercialized tools. But even more promising is the fact
that the prototype could relatively easy be expanded without having a programming background. This
shows the huge potential of the used generic transformation tool.
The use of the generic transformation tool showed several advantages. Because EPSILON is a
development platform, the tool can be developed to the needs of the user. The consistency checking
rules that are needed can be implemented in the tool. Also the different wished handling strategies can

52
be implemented in the tool. The practical example showed this. It is a tool which does not have a fixed
environment, but it can be developed and improved to the needs of the different stakeholders.
It is also tried to address the generalizability aspect. The prototype is built on the IBM process and
therefore it was questioned whether the tool would also work on other processes. Because of the fact
that the healthcare domain is a complex domain in which process descriptions can play an important
role (like in the IBM culture), and because of the fact that the healthcare perspective was a starting
point for this study, two processes from this domain were used to evaluate the prototype. Is has
become clear that the tool also worked appropriate on these two processes. This supports the
generalizability aspect positively.
However, it should also be noted that a particular semi-structured table form is used for the work
instructions in tabular form. The descriptions are translated into XML, but still have a particular
structure underlying that is affected by the semi-structured tabular form. The EPSILON tool was used to
explore this underlying structure and to design a prototype that handles this structure. The input of any
other underlying structure of the textual documentation or business process diagram would lead to
problems, because the tool is not built up to this structure. This would not become a problem when the
used semi-structured tabular form is seen as an appropriate one. However this topic is not discussed in
this study and should be validated. This and some other aspect are discussed in the next section.

53
9. Recommendations for Future Research Main focus in this research project was to demonstrate the ability of a generic transformation tool to
perform inconsistency management and to show how it can prove the current state-of-the-art regarding
consistency management tools. However, several aspects in the research project deserve more
attention and can be considered as possible starting points for further research.
This study started with research to transformation tools that were able to transform clinical guidelines
into formal story diagrams. It is concluded that the available tools were not developed that well that it
could already have a contribution in particular businesses. However, the topic of natural language
processing still remains an ambitious subject and more research to the available tools and their
possibilities would be appreciated. Generic tools like GATE and UIMA could be considered the same way
as it is done for EPSILON here, but with a focus on natural language processing instead of consistency
management.
The effects of inconsistencies, which can be negative as well as positive, are discussed already. However,
it remained at mentioning the superficial effects of inconsistencies like delays or lack of trust in
guidance. The performed studies lack in measuring the real effects of inconsistencies in companies
expressed for example in time and money. It has already become clear that inconsistency management
and supporting tools is not a well-researched topic. When it is shown what the real effects of
inconsistencies are, it probably excites researchers and companies to pay more attention to this subject.
A few sources were used to decide that the EPILSON tool and MOFLON tool could be used as a generic
transformation tool for showing improvements in consistency maintenance using these types of tools.
Main focus was to show how a generic tool could improve the current state-of-the-art. But it is also
interesting to question which of the available generic tools can support the best in inconsistency
management. Therefore it would be relevant to do more research to which generic transformation tools
are already there and what are the options with these tools.
In this research project EPSILON was used and it was showed that the platform can improve support in
inconsistency management based on literature. However, the expanded prototype focused only at
several inconsistencies. It should be questioned what the prototype would look like if it is fully adapted
to the needs of a particular company that wishes to use an inconsistency management tool. This also
leads to another aspect. In what degree would it be possible to use a well-developed prototype in
another company with other process descriptions? Are the process descriptions of other companies
transformed into a structure that is known to the prototype? Or can the generalizability of the prototype
be improved that it is also appropriate for other structures?
This leads to another important aspect for future research: validation. It was already mentioned that the
semi-structured tabular form used in this study needs to be validated. It should be questioned whether
the format used could satisfy the needs of the users in practice. One of the IBM experts in this field
already gave positive feedback on the used form, however more validation is needed. For example the
users of the medical process descriptions could contribute in the validation of this aspect by providing
feedback. If the used format is really useful in practice this strengthens the validity of this study.

54
10. Bibliography Branco, M., Xiong, Y., Czarnecki, K., Wong, J., & Lau, A. (2010). Effective collaboration and Consistency
Management in Business Process Modeling. Proceedings of the 2010 Conference of the Center for
Advanced Studies on Collaborative Research , 349-350.
Brill, E., & Mooney, R. (1997). An overview of empirical natural language processing. AI Magazine , 13-
24.
Brottier, E., Fleurey, F., Steel, J., Baudry, B., & Le Traon, Y. (2006). Metamodel-based Test Generation for
Model Transformations: an Algorithm and a Tool. Proceedings of the 17th International Symposium on
Software Reliability Engineering , 85-94.
Casewise. (n.d.). Retrieved June 2011, from Keller-Beratung: http://www.keller-
beratung.ch/cms/upload/pdf/Datasheet-Automodeler.pdf
Clark, T., & Bettin, J. (2009). The Knowledge Industry Survival Strategy Initiative (KISS). 1-15.
Clarke, L., Chen, Y., Avrunin, G., Chen, B., Cobleigh, R., Frederick, K., et al. (2005). Process Programming
to Support Medical Safety: A Case Study on Blood Transfusion. Proceedings of the Software Process
Workshop (SPW2005) .
Cunningham, H. (2002). GATE, a General Architecture for Text Engineering. Computers and the
Humanities , Vol. 36, 223-254.
Curtis, B., Kellner, M., & Over, J. (1992). Process Modeling. Communications of the ACM , 75-90.
Czarnecki, K., & Helsen, S. (2006). Feature-based survey of model transformation approaches. IBM
Systems Journal , 621-645.
Dreyer, J., & Zundorf, A. (2009). NT2OD: From natural text to object diagram.
Eclipse 2011. Retrieved 2011, from Eclipse:
http://dev.eclipse.org/svnroot/modeling/org.eclipse.gmt.epsilon/trunk/doc/org.eclipse.epsilon.book/Ep
silonBook.pdf
Ferrucci, D., & Lally, A. (2004). UIMA: an architectural approach to unstructured information processing
in the corporate research environment. Natural Language Engineering , 327-348.
Finkelstein, A. (2000). A foolish consistency: Technical challenges in consistency management.
Proceedings of the 11th International Conference on Database and Expert Systems Applications (DEXA) ,
1-5.
Finkelstein, A., Gabby, D., Hunter, A., Kramer, J., & Nuseibeh, B. (1994). Inconsistency Handling in
Multiperspective Specifications. IEEE Transactions on Sofware Engineering , 569-578.

55
Finkelstein, A., Kramer, J., Nuseibeh, B., Finkelstein, L., & Goedlicke, M. (1992). Viewpoints: A
Framework for Integrating Multiple Perspectives in System Development. International Journal of
Software Engineering and Knowledge Engineering , 31-58.
Finkelstein, A., Spanoudakis, G., & Till, D. (1996). Managing Interference. Joint Proceedings of the Sigsoft
‘96 Workshops , 172-174.
Gevins, A., & Smith, M. (2000). Neurophysiological Measures of Working Memory and Individual
Differences in Cognitive Ability and Cognitive Style. Cereb Cortex , 829-839.
Giese, H., & Wagner, R. (2009). From model transformation to incremental bidirectional model
synchronization. Software System Model , 21-43.
Grabner, R., Neubauer, A., & Stern, E. (2006). Superior performance and neural efficiency: the impact of
intelligence and expertise. Brain Res. Bull , 422-439.
Gray, J., Lin, Y., & Zhang, J. (2006). Automating Change Evolution in Model-Driven Engineering. IEEE
Computer Society , 51-58.
Hearnden, D., Lawley, M., & Raymond, K. (2006). Incremental model transformation for the evolution of
model-driven systems. Proceedings 9th International MoDELS Conference 2006 , 321-335.
Jones, V., Rensink, A., Ruys, T., E, B., & van Halteren, A. (2004). A formal MDA approach for mobile
health systems. Proceedings EWMDA-2, Second European Workshop on Model Driven Architecture
(MDA) with an emphasis on Methodologies and Transformations .
Kolovos, D., Paige, R., & Polack, F. (2006). Eclipse Development Tools for Epsilon. Eclipse Summit Europe,
Eclipse Modeling Symposium .
Krogstie, J., Dalberg, V., & Jensen, S. (2008). Process Modeling Value Framework. ICEIS , 309-321.
MEDLEE 2010. Retrieved June 2010, from MedLEE: A Medical Language Extraction and Encoding System:
http://www.cat.columbia.edu/pdfs/MedLEE_2006.pdf
Mendling, J., & Nuttgens, M. (2005). EPC Markup Language (EPML): An XML-Based Interchange Format
for Event-driven Process Chains (EPC). Technical Report JM .
Mens, T., & Van Gorp, P. (2005). A Taxonomy of Model Transformation and its Application to Graph
Transformation. Proceedings of the International Workshop on , 7-23.
MetaMap 2010. Retrieved June 2010, from MetaMap Portal: http://mmtx.nlm.nih.gov/
MLP 2010. Retrieved June 2010, from MLP Natural Language Processor:
http://cs.nyu.edu/cs/projects/lsp/index.html
MODELS. (2011). MODELS 2011. Retrieved July 2011, from ACM/IEEE 14th International Conference on
Model Driven Engineering Languages and Systems: http://www.modelsconference.org/

56
MOFLON 2011. Retrieved June 2011, from MOFLON: http://www.moflon.org/
Norgren, L., Hiatt, W., Dormandy, J., Nehler, M., Harris, K., & Fowkes, F. (2006). Inter-Society Consensus
for the Management of Peripheral Arterial Disease (TASC II). Eur J Vasc Endovasc Surg , s1-s70.
Nuseibeh, B. (1996). To Be and Not to Be: On Managing Inconsistency in Software Development.
Proceedings of the 8th IEEE International Workshop of Sotware Specification & Design , 164-169.
Nuseibeh, B., & Easterbrook, S. (1999). The Process of Inconsistency Management: A framework for
udnerstanding. IEEE of Computer Society: Proceedings of workshop on Database and Expert Systems
Applications , 364-368.
Nuseibeh, B., Easterbrook, S., & Russo, A. (2000). Leveraging Inconsistency in Software Development.
IEEE Computer , 24-29.
Qmap 2011. Retrieved June 2011, from Qmap: an E squared software product:
http://www.qmap.co.uk/about-us/why-qmap.aspx
Rader, G., & Vo, C. (2008). Achieving consistency between business process models and operational
guides: How Rational and Websphere software enable enterprises documentation in SOA environments.
Enterprise business process documentation white paper .
Rose, L., Paige, R., Kolovos, D., & Polack, F. (2008). The Epsilon Generation Language. Proceedings
European Conference in Model Driven Architecture (ECMDA) .
Schmidt, D. (2006). Model-Driven Engerineering. IEEE Computer , 25-31.
Sendall, S., & Kozaczynski, W. (2003). Model Transformation - The Heart and Soul of Model-Driven
Software Development. IEEE Software , 42-45.
Shiffman, R., Michel, G., Essaihi, A., & Thornquist, E. (2004). Bridging the Guideline Implementation Gap:
A Systematic, Document-centered Approach to Guideline Implementation. J Am Med Informatics Assoc ,
418-426.
Shiffman, R., Michel, G., Krauthammer, M., Fuchs, N., Kaljurand, K., & Kuhn, T. (2010). Writing Clinical
Practice Guidelines in Controlled Natural Language.
Song, X., Hwong, B., Matos, G., Rudorfer, A., Nelson, C., Han, M., et al. (2006, May). Understanding
Requirements for Computer-Aided Healthcare Workflows: Experiences and Challenges. ISCE'06 , 930-
933.
Spanoudakis, G., & Zisman, A. (2001). Inconsistency management in software engineering: Survey and
open research issues. Handbook of Softare Engineering and Knowledge Engineering , 24-29.
Transformation Tool Contest 2011. Retrieved June 2011, from Transformation Tool Contest 2010:
http://planet-
research20.org/ttc2010/index.php?option=com_content&view=article&id=103&Itemid=128

57
Van Der Straeten, R. (2005). Inconsistency Management in Model-Driven Engineering. PhD thesis,
Department of Computer Science, Vrije Universiteit Brussel .
Visual Paradigm 2011. Retrieved June 2011, from Visual Paradigm: http://www.visual-
paradigm.com/aboutus/
Woolf, S., Grol, R., Hutchinson, A., Eccles, M., & Grimshaw, J. (1999). Potential benefits, limitations, and
harms of clinical guidelines. British Medical Journal , 527-530.

58
Appendix A: Word.evl import "WordLib.eol";
pre {
var checkedIds : Sequence;
}
context Word!`t_w:tr` {
constraint SameTitles {
guard : self.isTask()
check {
if (checkedIds.includes(self.getInternalId())) return true;
else {checkedIds.add(self.getInternalId());}
var withSameId = getAllWordTasks().
select(tr|tr.getInternalId() = self.getInternalId());
return withSameId.size() = 1 or
withSameId.forAll(tr|tr.getTitle() = withSameId.at(0).getTitle());
}
message : 'Multiple titles for id: ' + self.getInternalId()
fix {
title : "Make titles uniform"
do {
var selected = UserInput.choose("Select the title",
withSameId.collect(tr|tr.getTitle()).asSet());
for (tr in withSameId) {
tr.setTitle(selected);
}
}
}
}
}

59
Appendix B: EPML.eol //get all IDs from the functions (<sv345....>)
operation EPML!`t_epc` getFuncIds(){
return self.collect(ef|ef.`c_function`).flatten.
collect(ei|ei.`a_id`).flatten;
}
//get all IDs from the AND splits
operation EPML!`t_epc` getAndIds(){
return self.collect(ex|ex.`c_and`).flatten.
collect(ei|ei.`a_id`).flatten;
}
//get the titles from all functions
operation EPML!`t_epc` getFuncTitles(){
return self.collect(ef|ef.`c_function`).flatten.
collect(ei|ei.`c_name`.first.text).flatten;
}
//get the IDs from the XOR splits
operation EPML!`t_epc` getXorIds(){
return self.collect(ex|ex.`c_xor`).flatten.
collect(ei|ei.`a_id`).flatten;
}
//get all source IDs from the the arcs
operation EPML!`t_epc` getFlowSourceIds(){
return self.collect(ea|ea.`c_arc`).flatten.
collect(ef|ef.`c_flow`).flatten.
collect(es|es.`a_source`).flatten;
}
//get the id from the arc
operation EPML!`t_arc` getArcId(){
return self.`a_id`;
}
//get the source from the arc
operation EPML!`t_arc` getArcSource(){
return self.`e_flow`.`a_source`;
}
//get the target from the arc
operation EPML!`t_arc` getArcTarget(){
return self.`e_flow`.a_target;
}

60
//get the arc flowing out of the arc target of the self-arc
operation EPML!`t_arc` getTargets(){
return EPML!`t_arc`.all.select(tr|tr.getArcSource()=self.getArcTarget());
}
//get the arc flowing into the arc source of the self-arc
operation EPML!`t_arc` getSources(){
return EPML!`t_arc`.all.select(tr|tr.getArcTarget()=self.getArcSource());
}
//get the number of targets of the arc source
operation EPML!`t_arc` getAmountOfTargets(){
return self.getParentNode().getFlowSourceIds().count(self.getArcSource());
}
//get the functions which are the next steps after the XOR split (down))
operation EPML!`t_arc` flowToFunc(){
if(self.getParentNode().getFuncIds().includes(self.getArcTarget())){
return self.getTitle2();
}
else{
var x = EPML!`t_arc`.all.select(tr|tr.getArcSource()=self.getArcTarget());
return x.collect(ts|ts.flowToFunc());
}
}
//get the title of the XOR split function if he conditons for a XOR split are met (up)
operation EPML!`t_arc` getXORfunc(){
if(self.getParentNode().getXorIds().includes(self.getArcSource()) and
self.getAmountOfTargets() > 1 and
self.getParentNode().getFlowSourceIds().includes(self.getArcTarget())){
return self.getFuncTitle3();
}
}
//get true if the conditions are met for a XOR split
operation EPML!`t_arc` checkCon(){
if(self.getParentNode().getXorIds().includes(self.getArcSource()) and
self.getAmountOfTargets() > 1 and
self.getParentNode().getFlowSourceIds().includes(self.getArcTarget())){
return true;
}
}
//get true if all outgoing arcs of a XOR split lead to another function
operation EPML!`t_arc` checkCon2(){
var c = EPML!`t_arc`.all.select(ts|ts.getArcSource() = self.getArcSource());
if(c.forAll(tr|self.getParentNode().getFlowSourceIds().includes(tr.getArcTarget()))){

61
return true;
}
}
//get the function title (up)
operation EPML!`t_arc` getFuncTitle(){
if(self.getParentNode().getFuncIds().includes(self.getArcSource())){
return self.getTitle();
}
else{
var x = EPML!`t_arc`.all.select(tr|tr.getArcTarget()=self.getArcSource());
return x.collect(ts|ts.getFuncTitle()).flatten();
}
}
// used in getFuncTitle
operation EPML!`t_arc` getTitle(){
var n = self.getParentNode().getFuncTitles().size();
for(i in Sequence{0..n-1}){
if(self.getArcSource() = self.getParentNode().getFuncIds().at(i)){
return self.getParentNode().getFuncTitles().at(i);
}
}
}
// used in flowToFunc
operation EPML!`t_arc` getTitle2(){
var n = self.getParentNode().getFuncTitles().size();
for(i in Sequence{0..n-1}){
if(self.getArcTarget() = self.getParentNode().getFuncIds().at(i)){
return self.getParentNode().getFuncTitles().at(i);
}
}
}

62
Appendix C: Table.eol // get all w:t from a w:tr
operation Table!`t_w:tr` getCells() {
return self.`c_w:tc`.collect(tc|tc.`c_w:p`).flatten().
collect(p|p.`c_w:r`).flatten().
collect(r|r.`c_w:t`).flatten();
}
//get true if the w:tr is a tr in the XOR split
operation Table!`t_w:tr` XorTest(){
var n = self.getCells().size();
for (i in Sequence{0..n-1}){
if(self.getCells().at(i).text.startsWith("Weiter mit")
or self.getCells().at(i).text.startsWith("Move on to")){
return true;
}
}
}
//get title of the next step after the XOR split
operation Table!`t_w:tr` getXorStepsTitle(){
var n = self.getCells().size();
for (i in Sequence{0..n-1}){
if(self.getCells().at(i).text.startsWith("Weiter mit")
or self.getCells().at(i).text.startsWith("Move on to")){
return self.getCells().at(i+1).text;
}
}
}
//get the title of the XOR split
operation Table!`t_w:tr` getXorTitle(){
if(self.getCells().at(1).text.startsWith("Weiter mit") or
self.getCells().at(1).text.startsWith("Move on to")or
self.getCells().at(2).text.startsWith("Weiter mit") or
self.getCells().at(2).text.startsWith("Move on to")){
return self.getParentNode().getParentNode().getParentNode().getCells().at(2).text;
}
}

63
Appendix D: Execute.eol import "Table.eol";
import "EPML.eol";
var c1 = Collection{};
var c2 = Collection{};
var c3 = Collection{};
var c4 = Collection{};
//check whether a XOR split in the EPML document is also in the TABLE document, and the opposite way
for (f in Table!`t_w:tr`.all){
if(f.XorTest() = true and not c1.includes(f.getXorTitle())
and not f.getEPMLXorTitles().includes(f.getXorTitle())){
(f.getXorTitle() + " is a missing XOR split in the EPML document").println();
c1.add(f.getXorTitle());
}
}
for (f in EPML!`t_arc`.all){
if(f.checkCon() = true and f.checkCon2() = true){
var n = f.getFuncTitle().size();
for(i in Sequence{0..n-1}){
if(not c2.includes(f.getFuncTitle().at(i))and not
f.getTableXorTitles().includes(f.getFuncTitle().at(i))){
(f.getFuncTitle().at(i) + " is a missing XOR split in the Table
document").println();
c2.add(f.getFuncTitle().at(i));
}
}
}
}
//checks wether the steps after the XOR split in the TABLE document are the same in the EPML
document
for (f in Table!`t_w:tr`.all){
if(f.XorTest()=true and f.getXorArcs().isEmpty() = false and not c3.includes(f.getXorStepsTitle())){
var m = f.getXorArcs().collect(ts|ts.flowToFunc()).flatten();
if(m.includes(f.getXorStepsTitle())=false){
("The -" + f.getXorStepsTitle() + "- subsequent step is different or not
there").println();
c3.add(f.getXorStepsTitle());
}
}
}

64
//checks wether the steps after the XOR split in the EPML document are the same in the TABLE
document
for (f in EPML!`t_arc`.all){
if(f.checkCon()=true and f.getXorArcs2().isEmpty()=false){
var m = f.getXorArcs2().collect(ts|ts.getXorStepsTitle());
var n = f.flowToFunc().flatten().size();
for(i in Sequence{0..n-1}){
if(m.includes(f.flowToFunc().flatten().at(i))=false and not
c4.includes(f.flowToFunc().flatten().at(i))){
("The -" + f.flowToFunc().flatten().at(i) + "- subsequent step is
different or not there").println();
c4.add(f.flowToFunc().flatten().at(i));
}
}
}
}
//additional needed functions
operation Table!`t_w:tr` getEPMLXorTitles(){
return EPML!`t_arc`.all.collect(tr|tr.getXORfunc()).flatten();
}
operation EPML!`t_arc` getTableXorTitles(){
return Table!`t_w:tr`.all.collect(tr|tr.getXorTitle()).flatten();
}
operation Table!`t_w:tr` getXorArcs(){
return EPML!`t_arc`.all.select(tr|tr.checkCon()=true and
tr.getFuncTitle().includes(self.getXorTitle())).asSet();
}
operation EPML!`t_arc` getXorArcs2(){
return Table!`t_w:tr`.all.select(tr|tr.XorTest()=true and
self.getFuncTitle().includes(tr.getXorTitle())).asSet();
}

Appendix E: PAD Visual Processes
From: ((Norgren et al., 2006),, p. 25)

Appendix F: PAD Tabular Form
Task ID Title Explanation
1. 1 Risk factor modification Smoking cessation. LDL cholesterol <100 mg/dL. LDL < 70 mg/dL if high risk. HbA1c
<7.0%. BP < 140/90 mmHg. BP < 130/80 mmHg if diabetic or renal disease. Antiplatelet
therapy.
2. 2 Determine treatment based on
limitations
CONDITION STEP NAME
Claudication medical therapy
most appropriate
Move on to step 3 Claudication medical therapy
Proximal lesion suspected Move on to step 5 Localize the lesion
3. 3 Claudication medical therapy CONDITION STEP NAME
If symptoms are improved Move on to step 4 Continue treatment
If symptoms are not improved Move on to step 5 Localize the lesion
4. 4 Continue treatment Continue supervised exercise or pharmacotherapy (see section C.2.4.1)
5. 5 Localize the lesion Conventional angio. MRA or CTA. Ultrasoun. Hemodynamic localization.
6. 6 Revascularization Endovascular. Surgical.
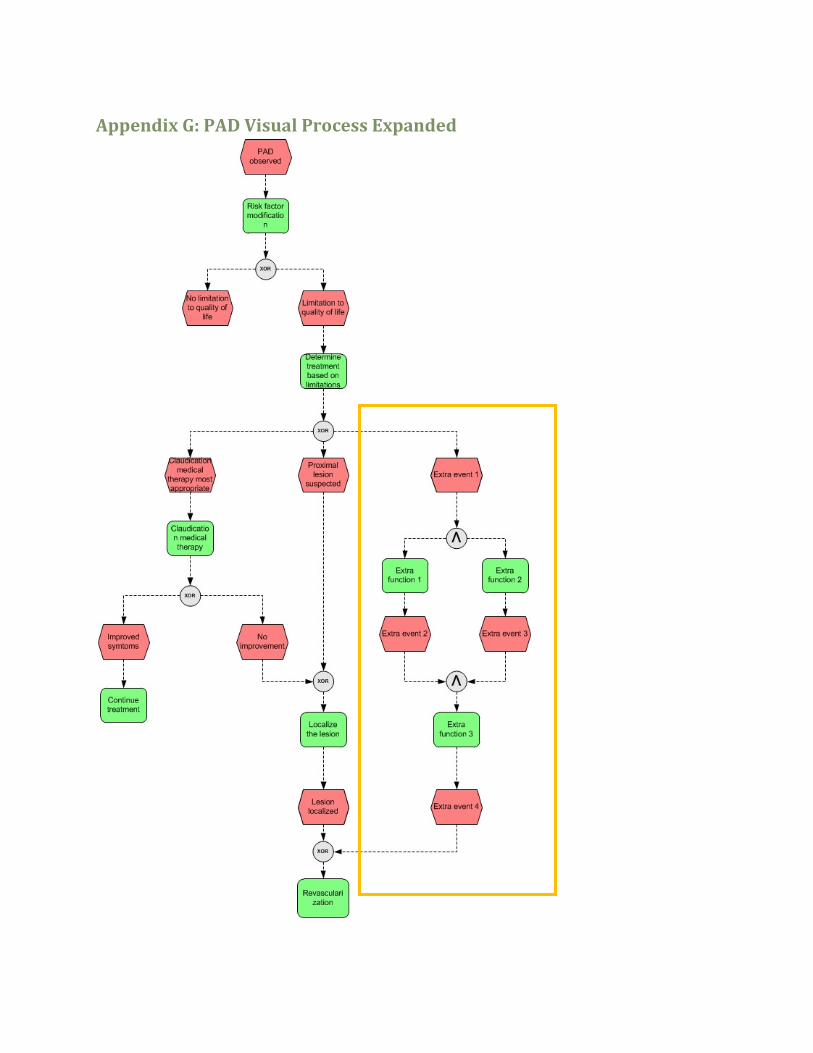
Appendix G: PAD Visual Process Expanded

Appendix H: PAD Tabular Form Expanded
Task ID Title Explanation
1. 1 Risk factor modification Smoking cessation. LDL cholesterol <100 mg/dL. LDL < 70 mg/dL if high risk. HbA1c
<7.0%. BP < 140/90 mmHg. BP < 130/80 mmHg if diabetic or renal disease. Antiplatelet
therapy.
2. 2 Determine treatment based on
limitations
CONDITION STEP NAME
Claudication medical therapy
most appropriate
Move on to step 3 Claudication medical therapy
Proximal lesion suspected Move on to step 5 Localize the lesion
Extra event 1 Move on to step 6 Extra function 1
Extra event 1 Move on to step 7 Extra function 2
3. 3 Claudication medical therapy CONDITION STEP NAME
If symptoms are improved Move on to step 4 Continue treatment
If symptoms are not improved Move on to step 5 Localize the lesion
4. 4 Continue treatment Continue supervised exercise or pharmacotherapy (see section C.2.4.1)
5. 5 Localize the lesion Conventional angio. MRA or CTA. Ultrasoun. Hemodynamic localization.
6. 6 Extra function 1 Description of extra function 1.
7. 7 Extra function 2 Description of extra function 2.
8. 8 Extra function 3 Description of extra function 3.
9. 9 Revascularization Endovascular. Surgical.

Appendix I: Process Model Screening Child Abuse

70
Appendix J: EPC Screening Child Abuse

Appendix K: Screening Child Abuse Tabular Form
Task ID Title Explanation
1. 1 Conduct full body inspection CONDITION STEP NAME
No fracture observed Move on to step 2 Fill in screening questions
Fracture observed Move on to step 7 Check age of child
2. 2 Fill in screening questions CONDITION STEP NAME
SPUTOVAMO form not necessary Move on to step 17 Stop
SPUTOVAMO form necessary Move on to step 3 Fill in SPUTOVATO form
3. 3 Fill in SPUTOVATO form Description of task 3
4. 4 Discuss case CONDITION STEP NAME
Child abuse not expected (2) Move on to step 17 Stop
Child abuse expected (2) Move on to step 5 Conversation between main
consultant and parents
5. 5 Conversation between main
consultant and parents
Description of task 5
6. 6 Consult of pediatrician CONDITION STEP NAME
Child abuse not expected (3) Move on to step 16 Close conversation
Child abuse expected (3) Move on to step 15 Determine level of suspicion
7. 7 Check age of child CONDITION STEP NAME
> 2 years old Move on to step 2 Fill in screening questions
1-2 years old Move on to step 8 Check if fracture is suspicious
< 1 year old Move on to step 11 Inform pediatrician (2)
8. 8 Check if fracture is suspicious CONDITION STEP NAME
Fracture is not suspicious Move on to step 2 Fill in screening questions
Fracture is suspicious Move on to step 9 Inform pediatrician
9. 9 Inform pediatrician Description of task 9
10. 10 Ask AMK for advice CONDITION STEP NAME
Child abuse not suspected Move on to step 2 Fill in screening questions
Child abuse suspected Move on to step 12 Report to AMK

72
11. 11 Inform pediatrician (2) Description of task 11
12. 12 Report to AMK Description of task 12
13. 13 Request for skeleton pictures on
behalf of pediatrician
Description of task 13
14. 14 Fill in screening question
SPUTOVAMO form
CONDITION STEP NAME
Weak suspicion Move on to step 18 Conduct protocol 509
Strong suspicion Move on to step 19 Conduct protocol 508
15. 15 Determine level of suspicion CONDITION STEP NAME
Weak suspicion Move on to step 18 Conduct protocol 509
Strong suspicion Move on to step 19 Conduct protocol 508
16. 16 Close conversation Description of task 16
17. 17 Stop Description of task 17
18. 18 Conduct protocol 509 Description of task 18
19. 19 Conduct protocol 508 Description of task 19