mainland tanzania july 2008 – june 2009 - tzdpg.or.tz tanzania july 2008 – june 2009 ... hmis...
TRANSCRIPT
Health Sector Performance Profile Report 2009 Update
Mainland Tanzania July 2008 – June 2009
Ministry of Health and Social Welfare October 6, 2009
B
FINAL DRAFT
1
HEALTH SECTOR PERFORMANCE PROFILE REPORT
2009 UPDATE Mainland Tanzania July 2008 – June 2009
Acronyms ANC Antenatal Clinic ART Antiretroviral Therapy CCHP Comprehensive Council Health Plan CFS Consolidated Fund Services CHF Community Health Fund CHMT Council Health Management Team DDH District Designated Hospital DPP Department of Policy and Planning EmOC Emergency Obstetric Care FBO Faith Based Organization HMIS Health Management Information System HSF Health Services Fund HSSP III Health Sector Strategic Plan III HRIS Human Resource Information System ILS Integrated Logistics System iPTP Intermittent Presumptive Treatment (for pregnant mothers ITN Insect side Treated Net JAHSR Joint Annual Health Sector Review LGA Local Government Authority MKUKUTA Mkakati wa Kukuza Uchumi na Kupunguza Umaskini Tanzania MMAM Mpango wa Maendeleo wa Afya ya Msingi MMR Maternal Mortality Ratio MOFEA Ministry of Finance and Economic Affairs MOHSW Ministry of Health and Social Welfare MSD Medical Stores Department MTEF Medium Term Expenditure Framework NACTE National Council of Technical Education NHIF National Health Insurance Fund NBS National Bureau of Statistics OPD Outpatient Department P4P Pay for Performance PER Public Expenditure Review PMO-RALG Prime Minister’s Office-Regional Administration and Local Government PMTCT Prevention of Mother to Child Transmission POPSM President’s Office, Public Service Management PPP Public Private Partnership RCH Reproductive and Child Health RDT Rapid Diagnostic Test (for malaria) RHMT Regional Health Management Team SWAp Sector Wide Approach TB Tuberculosis TDHS Tanzania Demographic and Health Survey THMIS Tanzania HIV/AIDS and Malaria Indicator Survey TIKA Tiba kwa Kadi

Table of Contents ACRONYMS .................................................................................................................... 1
TABLE OF CONTENTS ........................................................................................................ 2
FOREWORD .................................................................................................................... 3
EXECUTIVE SUMMARY ....................................................................................................... 5
CHAPTER 1: INTRODUCTION ............................................................................................... 8
CHAPTER 2: HEALTH SECTOR PERFORMANCE INDICATORS........................................................... 10
2.1 PROGRESS TOWARDS HEALTH STATUS OF THE POPULATION ................................................. 10
2.2 PROGRESS TOWARDS SERVICE DELIVERY ........................................................................ 12
2.2.1 GENERAL INDICATOR ......................................................................................... 12
2.2.2 VACCINATIONS ................................................................................................ 13
2.2.3 REPRODUCTIVE HEALTH ..................................................................................... 15
2.2.4 HIV AND AIDS ................................................................................................. 19
2.2.5 MALARIA ........................................................................................................ 19
2.2.6 TUBERCULOSIS AND LEPROSY ............................................................................... 20
2.2.7 INFECTIOUS AND NON-COMMUNICABLE DISEASES ....................................................... 21
2.3 PROGRESS TOWARDS HEALTH SYSTEM INDICATORS ........................................................... 22
2.3.1 FINANCIAL RESOURCES ....................................................................................... 22
2.3.2 HUMAN RESOURCE FOR HEALTH ........................................................................... 24
2.3.3 LOGISTICS ....................................................................................................... 24
CHAPTER 3: PROGRESS TOWARDS MILESTONES 2008/2009.......................................................... 26
CHAPTER 4: MTEF IMPLEMENTATION STATUS .......................................................................... 32
CHAPTER 5: REVIEW OF COUNCIL HEALTH PERFORMANCE .......................................................... 34
CHAPTER 6: HIGHLIGHTS OF THE PER UPDATE ........................................................................ 37
CHAPTER 7: HUMAN RESOURCE STATUS IN THE HEALTH SECTOR ................................................... 42
CHAPTER 8: CONCLUSION, ISSUES AND CHALLENGES (STILL UNDER MAKING) ..................................... 45
ANNEX 1: HSSP III INDICATORS......................................................................................... 0
3
Foreword
This Health Sector Performance Profile Report Update 2009 presents the assessment of health system performance in Mainland Tanzania for the financial year 2008/09, an update of the previous year’s report. The Ministry of Health and Social Welfare (MoHSW) considers Monitoring and Evaluation as an important means for measuring effectiveness of the various inputs, processes, outcomes and ultimately their impact on the health system. In this way progress towards the National Health Policy objectives and international commitments can be measured with a high degree of certainty. The monitoring and evaluation process also identifies areas where performance has been lower than expected and so requiring remedial measures to be taken, on a continual basis. This year’s report covers an update of all the areas included in last year’s Performance Assessment report and includes some new ones arising from the new Health Sector Strategic Plan III Indicator Matrix. The major components of the assessment are:
• Performance against the 43 health sector performance indicators (including MKUKUTA and PAF indicators)
• Assessment of progress towards achieving the Milestones agreed at last year’s Joint Annual Health Sector Review meeting
• Implementation status of activities, targets and strategic objectives set out in the Medium Term Expenditure Framework (MTEF)
• Assessment of health service performance at the Council level
• Highlight of key findings of the Public Expenditure Review for the Health Sector
• Assessment of the current status of Human Resources for the sector
• Conclusions (including outstanding issues and challenges) Every effort has been made in this report to assemble available information, check it, and report accurately on the various indicators. Multiple sources of information have been used. The milestone assessment is a narrative report on actions taken and achievements registered. The MTEF report draws upon the implementation status of all of the activities in the current year MOHSW plan and budget (grouped according to strategic objectives). The health financing section draws from latest health sector Public Expenditure Review while the section on Council health sector performance draws upon the analysis of 21 Regional reports covering the implementation progress of the 132 Comprehensive Council Health Plans (CCHPs). The chapter on Human Resources is an update of the Human Resource situation based upon various sources, including data derived from the 132 CCHPs. Reporting on the 43 health sector performance indicators has drawn upon data from a number of sources including PER, and reports on performance of various health programs e.g. TB control, EPI , Reproductive Health and ART for HIV patients as recorded and maintained by the respective programs within the MOHSW. While this update report makes a major contribution to the MOHSW efforts towards effective and sustainable Monitoring and Evaluation, the scope of the analysis has been limited by some constraints, notably problems with the availability of robust and credible routine data. This chronic weakness highlights the critical importance of strengthening the Health Management Information System. The work was conducted under the coordination of the Directorate of Policy and Planning through the Monitoring and Evaluation Section in collaboration with Joint Annual Health Sector Review Organizing

Committee. Many thanks are extended to all who participated in one way or another in this endeavor. My sincere appreciation is also extended to the Ifakara Health Institute (IHI) who assisted with checking and assembling data, compiling the text and editing the final version. Following the finalization of this report, the challenge ahead of us is in the use of the situation described for further improving on health sector performance for improved health service delivery that ensures availability, accessibility and quality, for the benefit of the population of Tanzania. Blandina S. J. Nyoni Permanent Secretary, Ministry of Health and Social Welfare, Mainland Tanzania

5
Executive Summary This report provides an updated comprehensive and objective assessment of the performance of the health sector for the financial year 2008/09. In line with HSSP III indicators, data presented in this report have been updated or added for the agreed 43 health sector performance indicators and a subset of MKUKUTA and PAF indicators. A few of the indicators have not been updated due to limitations of the routine data systems. The other reason is that other data source such as surveys are either ongoing or not yet due. The general picture emerging from this report is that of progressive in the health sector performance. Some of the key indicators included in this report include maternal and child survival, service delivery, immunization coverage, PAF (DPT and Hep B, births attend by skilled health workers, TB completion rate and number of PLWHA receiving ART) and heath systems (finance, human resources for health and logistics) indicators. Important highlights include:
1. Areas of good performance
Confirmed Gains in Child Survival
� As indicate in the last year’s report, Tanzania is highly commended for the continuing spectacular gains in child survival with progressive and significant decline in under five and infant mortality which makes Tanzania well on track for the MKUKUTA and MDG indicators. However, for more than ten years there has been little or no improvement in neonatal mortality. Newborn deaths are still a challenge and account for almost 30% of all deaths in children younger than five years in Tanzania.
� Positive developments in terms of increased public spending on health with a slight greater share for the district level, process initiated towards further decentralization of planning and budgeting to lower level facilities, IMCI coverage, increased vaccination coverage, further scaling up of proven interventions including malaria prevention and case management that will further contribute to positive and sustained improvements in the Child Survival indicators.
Tuberculosis
� TB treatment success rate is high at 84.7%, one of the highest in the world.
Malaria
� Various studies indicate major reductions in the incidence of malaria.
HIV and AIDS
� About 34% of HIV positive pregnant women were receiving ARVs to prevent MTCT in 2007 which increased to 55% in 2008
� A total of 80,628 persons with advanced HIV infection were receiving ARV combination treatment by the end of 2007 but by the end of May 2009 a total of 248,280 people were receiving ART.
Major Policy Developments
� The implementation of the Primary Health Services Development Program, commonly known by its Kiswahili acronym of MMAM is ongoing with increased student enrolment in health training institutions, posting of trained staff to Councils and building of more dispensaries and health centers to increase access to services.

Service Delivery Developments
� Vaccination against measles remains high (88%) and set to rise towards the target of 90% by 2010. � Year 2008 shows a reversal of DPT-HB3 vaccination downward trend with a 3 percentage point
increase in coverage from 83% in 2007 to 86% in 2008 � ANC attendance among pregnant women before 16 weeks of gestation has improved (48%) but
reaching a target of 60% by 2010 remains a challenge.
1. Areas of Weak Performance
� There is no improvement in the skilled attendance at birth. � There is still no evidence to suggest decline in Maternal Mortality Ratio. � At present, there is no net increase in the skilled human resource situation with the new hire rate
practically equaling normal attrition (retirements, deaths, dismissals). The health sector will require a threefold increase in workforce with an annual tenfold increase hire rate over the next 10 years if it were to successfully implement MMAM!
� The chronic problem of mal distribution of skilled staff still remains, compounded by deficiencies of accountability, absenteeism and productivity.
� A large number of the new health workers recruited and posted have not reported especially in underserved regions and salary payments for the newly posted staff is still taking between 6 to 9 months!
� The functioning of the routine data system remains weak making the need for the review and strengthening exercise of HMIS more urgent.
� Supportive supervision to include on the job training and mentoring remains weak at all levels contributing to weak management especially for the critical issue of human resources.
� The regular supply of quality medicines, vaccines, medical supplies, equipment and technologies remains a challenge thus negatively affecting service delivery
� The functioning of accountability structures (Health Facility Committees and Boards) remain weak with resultant weaknesses in the functioning of Community Health Fund schemes.
2. Recommendations and Way Forward � Urgent and sustained strengthening of Emergency Obstetric, Neonatal and Child care (EmONC) at
all levels to address the high maternal and newborn mortality in Tanzania. Presently only 5% of the health facilities provide EmOC services.
� Continued implementation of the MMAM, particularly the human resource component. Operationalise existing new non functioning health facilities in collaboration with PMO-RALG.
� Urgent need to review and strengthen the functioning of HMIS. � Urgent solution needs to be worked to remove bottlenecks in salary payments for newly posted
staff, as well as delays in transfer of the development and OC share of their budget to the districts and regions.
� Introduction of the long delayed Result Based Bonus scheme for good targeted performance (Pay
for Performance) to motivate and possibly retain skilled staff especially in rural, isolated and hard to reach areas of Tanzania.

7
� Strengthening of sustained supportive supervision at all levels for improved management including the strengthening of Health Facility Governing Committees and Boards to facilitate community voice and ownership of service planning and delivery.
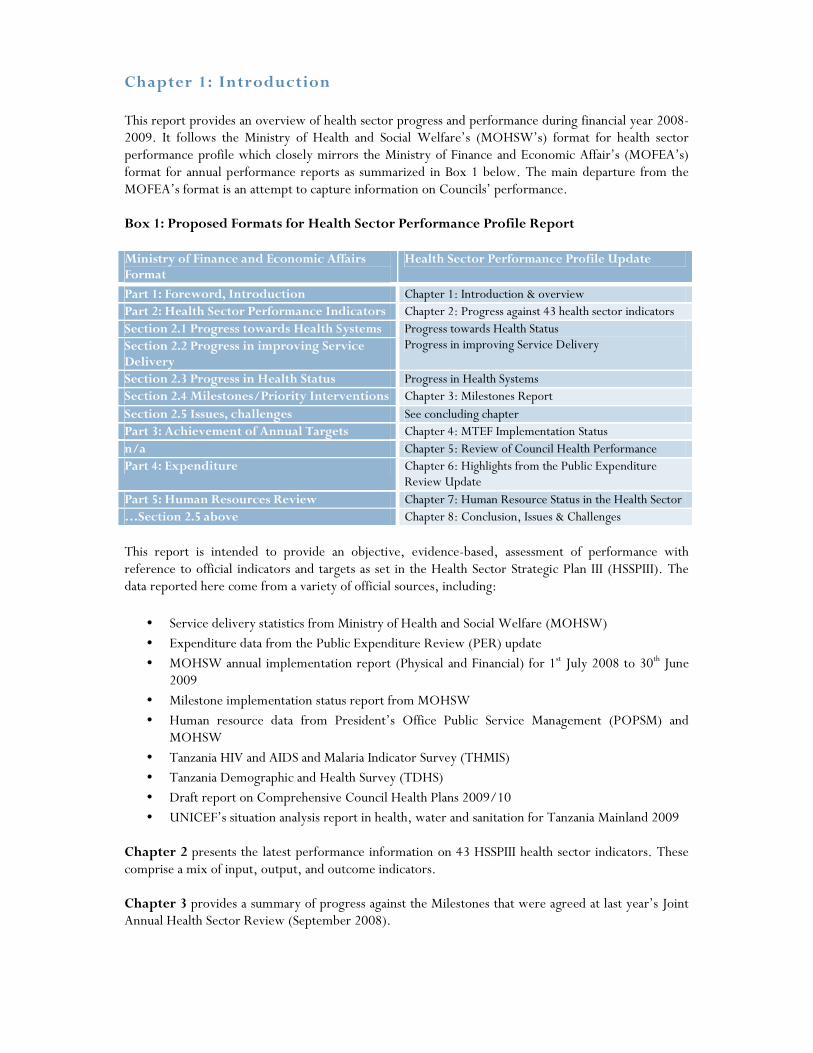
Chapter 1: Introduction This report provides an overview of health sector progress and performance during financial year 2008-2009. It follows the Ministry of Health and Social Welfare’s (MOHSW’s) format for health sector performance profile which closely mirrors the Ministry of Finance and Economic Affair’s (MOFEA’s) format for annual performance reports as summarized in Box 1 below. The main departure from the MOFEA’s format is an attempt to capture information on Councils’ performance. Box 1: Proposed Formats for Health Sector Performance Profile Report Ministry of Finance and Economic Affairs Format
Health Sector Performance Profile Update
Part 1: Foreword, Introduction Chapter 1: Introduction & overview Part 2: Health Sector Performance Indicators Chapter 2: Progress against 43 health sector indicators Section 2.1 Progress towards Health Systems Progress towards Health Status
Progress in improving Service Delivery Section 2.2 Progress in improving Service Delivery Section 2.3 Progress in Health Status Progress in Health Systems Section 2.4 Milestones/Priority Interventions Chapter 3: Milestones Report Section 2.5 Issues, challenges See concluding chapter Part 3: Achievement of Annual Targets Chapter 4: MTEF Implementation Status n/a Chapter 5: Review of Council Health Performance Part 4: Expenditure Chapter 6: Highlights from the Public Expenditure
Review Update Part 5: Human Resources Review Chapter 7: Human Resource Status in the Health Sector …Section 2.5 above Chapter 8: Conclusion, Issues & Challenges
This report is intended to provide an objective, evidence-based, assessment of performance with reference to official indicators and targets as set in the Health Sector Strategic Plan III (HSSPIII). The data reported here come from a variety of official sources, including:
• Service delivery statistics from Ministry of Health and Social Welfare (MOHSW)
• Expenditure data from the Public Expenditure Review (PER) update
• MOHSW annual implementation report (Physical and Financial) for 1st July 2008 to 30th June 2009
• Milestone implementation status report from MOHSW
• Human resource data from President’s Office Public Service Management (POPSM) and MOHSW
• Tanzania HIV and AIDS and Malaria Indicator Survey (THMIS)
• Tanzania Demographic and Health Survey (TDHS)
• Draft report on Comprehensive Council Health Plans 2009/10
• UNICEF’s situation analysis report in health, water and sanitation for Tanzania Mainland 2009 Chapter 2 presents the latest performance information on 43 HSSPIII health sector indicators. These comprise a mix of input, output, and outcome indicators. Chapter 3 provides a summary of progress against the Milestones that were agreed at last year’s Joint Annual Health Sector Review (September 2008).

9
Chapter 4 examines implementation performance against the strategies, objectives and targets set out in the Medium Term Expenditure Framework (MTEF) of the MOHSW for financial year 2008/09. Chapter 5 reviews Councils’ health performance, drawing upon the Regional/Central review of Council Comprehensive Health Plans (CCHPs) and their implementation. Chapter 6 provides highlights on health sector expenditure, based on the 2008 Public Expenditure Review (PER) update. Chapter 7 summarizes pertinent information on Human Resources for Health. Chapter 8 provides conclusions and highlights outstanding issues and challenges

Chapter 2: Health Sector Performance Indicators In the following chapters of this report we present the latest available information against the 43 health sector performance indicators as presented in HSSP III. This is a new set of indicators evaluating the new Health Sector Strategic Plan III (see Annex 1 for the list of HSSP III indicators with baseline and target figures). HSSP III has 43 performance indicators clustered under the following thematic areas; health status of the population; service delivery; and health system performance indicators.
2.1 Progress towards Health Status of the Population There are 12 indicators which are meant to measure the performance of the health status of some population groups. This thematic area includes indicators on mortality rates (neonatal, infant, and maternal mortality), HIV prevalence, life expectancy, fertility rate, and child nutrition performance indicators. Indicators Number 1-12 Table 1 summarizes the 12 indicators meant to measure the health status of the population. It is worth noting that most of the data needed to measure these indicators are collected periodically; thus no nationally representative update is available. However, data from the Regions are used to shade some light on the progress of some of these indicators as presented below. Table 1: Performance of Health Status Indicators NO. INDICATOR Other
Sources DHS (04/05)
THMIS (07/08)
MKUKUTA Target 2010
HSSPIII Target 2015
1. Neonatal mortality rate (per 1,000 live births) - 32 29 35 19
2. Infant mortality rate (per 1,000 live births) - 68 58 41 -
3. Under-five morality rate (per 1,000 live births) - 112 91 79 54
4. Proportion of under-fives who are underweight - 22% - 25% 14%
5. Proportion of under-fives who are stunted - 38% - 20% 6. Maternal mortality ratio (per 100,000 live births - 578 265 199
7. Life expectancy at birth 52 (F) 51 (M) (Census 01/02)
- - - 62 (F) 59(M)
(by 2025)
8. Proportion of pregnant women who are under 20 yrs
54% - 39.2% -
9. Total fertility rate of women 15-49 years 5.7 - 5.4 5.2
10. HIV Prevalence among 15-24 year old pregnant women tested
6.8% (NACP 05/06)
- - 8.5% 5%
11. HIV Prevalence among 15-24 year old population male/female
3.6% (F)
1.1% (M)
- 5%
12. HIV prevalence among 15 - 49 years old population male/female
6.8% (F)
4.7% (M)
- -

11
Indicator Number 6: Maternal Mortality Ratio This indicator is measured periodically through Tanzania Demographic and Health Surveys (TDHS). The latest estimate is from TDHS 2004/5 which showed the estimate of Maternal Mortality Ratio (MMR) to be 578 maternal deaths per 100,000 live births. Figure 1 shows crude MMR as obtained from the health facilities routine data, which shows the trend for each Region for the year 2007 and 2008. Although no reliable estimates of the MMR can be obtained from routine data, these regional ratios echo the need to develop strategies and interventions requisite to improve maternal heath and thus reduce the ratio to 265 by 2010 as per MKUKUTA target. However, these data need to be interpreted with caution because first they are facility based and secondly we are not sure whether the dominators used by the regions are from the standard projections from National Bureau of Statistics (NBS). Figure 1: Maternal Mortality Ratio, by Region
Indicator Number 7: Life expectancy at birth Projections of life expectancy at birth are estimated at 53 and 56 for males and females respectively for the year 2008. This is an improvement of 2 and 4 years in life expectancy for males and females from the 2002 census respectively. Indicator Number 8: Proportion of pregnant women who are under 20 years This indicator is defined as the number of women below 20 years who became pregnant in a year specified as a proportion of total number of all women below age 20. The figure as indicated in the TDHS 2004/05 is 54%; no update figure is available. However, information on pregnant women who were below age 20 and attended ANC was obtained from the Health Management Information System (HMIS) and presented in Figure 2. On average, the proportion of pregnant women who attended Antenatal Clinic (ANC) and were under 20 years was 11.3% which is quite low. Arusha region has the highest proportion of women who attended ANC and who were under 20 (65%).
0
50
100
150
200
250
300
350

Figure 2: Percent of Pregnant Mothers attended ANC and who were <20 years, by Region
2.2 Progress towards Service Delivery Service Delivery indicators include outpatient attendance, vaccination coverage, access to reproductive health services, and indicators measuring HIV and AIDS, malaria, tuberculosis and leprosy, infectious and non-communicable disease performance.
2.2.1 General Indicator Indicator Number13: Outpatient attendance per capita
One of the key indicators to assess performance on provision of health services to the entire population
is getting information on the number of people attending and getting services at health facilities
whenever they fall ill. The outpatient attendance per capita is a good indicator on showing the extent of
utilization of health facilities by the population. If Out Patient Department (OPD) attendance is found
to be high in the public health facilities it implies the population is highly satisfied by provision of services in these facilities. Figure 3 below shows the OPD attendances per capita in the Regions of
Tanzania Mainland calculated using the denominator of population projections for 2007. The OPD
attendance per capita is high in Mtwara (1.3) and Kilimanjaro (1.01) regions. The lowest OPD per
capita is observed in three regions namely Shinyanga (0.28), Rukwa (0.37) and Ruvuma (0.38). The
Tanzania Mainland OPD attendance per capita is 0.68.
0%
10%
20%
30%
40%
50%
60%
70%
DSM
Ma
ny
ara
Do
do
ma
Ru
kw
a
Sin
gid
a
Mb
ey
a
Lin
di
Irin
ga
Mw
an
za
K'lim
an
jaro
Ka
ge
ra
Mo
rog
oro
Mtw
ara
Kig
om
a
Ta
ng
a
Sh
inya
ng
a
Ru
vu
ma
Ma
ra
Ta
bo
ra
Pw
an
i
Aru
sha
To
tal

13
Figure 3: OPD Attendance per capita, by Region
2.2.2 Vaccinations Indicator Number 14: Proportion of children under one year vaccinated against measles
This indicator measures the percentage of total number of children under one year of age vaccinated against measles in a given population. It enables monitoring of immunization of children against the preventable diseases. Immunization is considered to have high impact on child mortality reduction. Numerator is the total number of children under one year vaccinated against measles and denominator is total number of children under one year in a specified year. The indicator value in 2008 is 88% which is a slight decline from 2007 (89.6%). However, the figure is more than the threshold value of 75% approaching the target of 90% by 2010. Indicator Number 15: Proportion of children under one year vaccinated 3 times against DPT-HB3
Figure 4 shows the DPT-HB3 coverage by age 12 months from 2001. By 2004 the coverage reached a
peak of 94% for all the three antigens. However, this was followed by a steady decline to 83% in 2007.
Programme data for 2008 shows a reversal of this downward trend with a 3 percentage point increase in
coverage from 83% in 2007 to 86% in 2008. Overall, Tanzania is performing much better in
immunization coverage compared to its neighbours in the region. However, more improvement can be
achieved if more focus is put in regions with low coverage.
OPD Attendances per Capita
0.280.37 0.38
0.46 0.48 0.490.51
0.58 0.60 0.620.65
0.73 0.740.81 0.84 0.84
0.89 0.910.94
1.01
1.30
0.00
0.20
0.40
0.60
0.80
1.00
1.20
1.40
Shinyan
ga
Rukwa
Ruvuma
Kigoma
Dodoma
Lindi
Mbeya
Arusha
Mwan
za
Morogoro
Mara
Pwan
i
Singida
Iringa
Man
yara
Tab
ora
Tan
ga
Dar-es-salaam
Kag
era
Kilim
anjaro
Mtw
ara
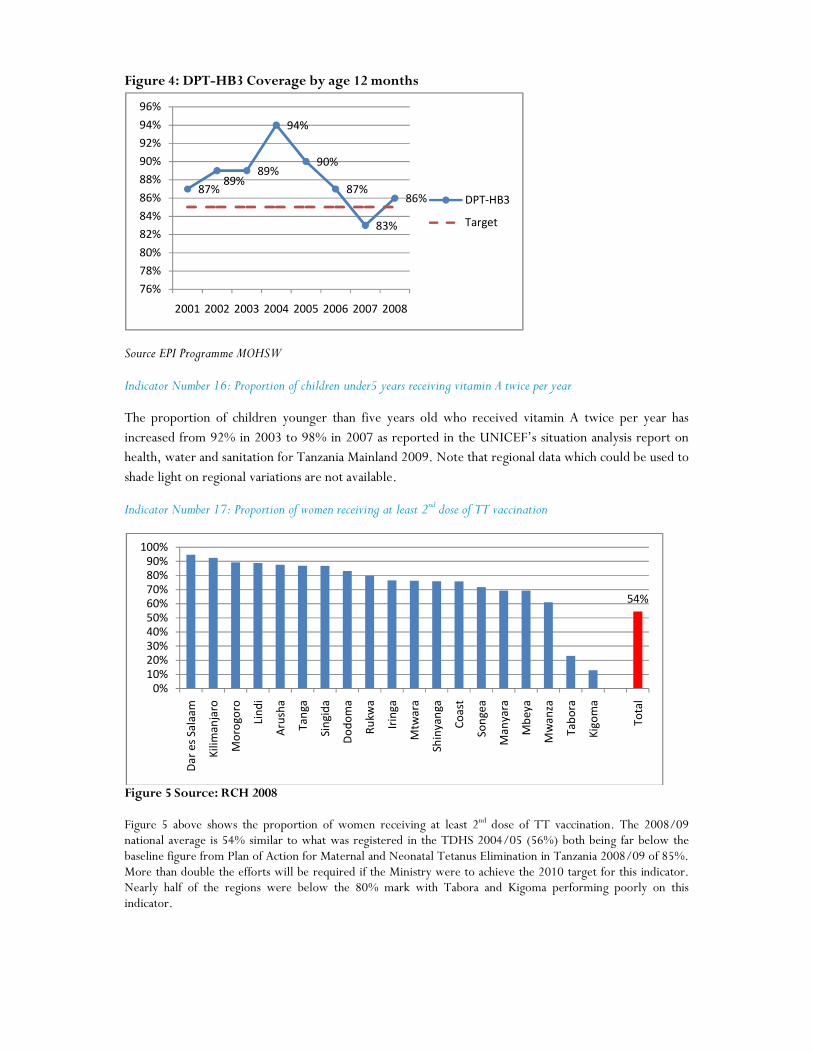
Figure 4: DPT-HB3 Coverage by age 12 months
Source EPI Programme MOHSW
Indicator Number 16: Proportion of children under5 years receiving vitamin A twice per year
The proportion of children younger than five years old who received vitamin A twice per year has
increased from 92% in 2003 to 98% in 2007 as reported in the UNICEF’s situation analysis report on health, water and sanitation for Tanzania Mainland 2009. Note that regional data which could be used to
shade light on regional variations are not available.
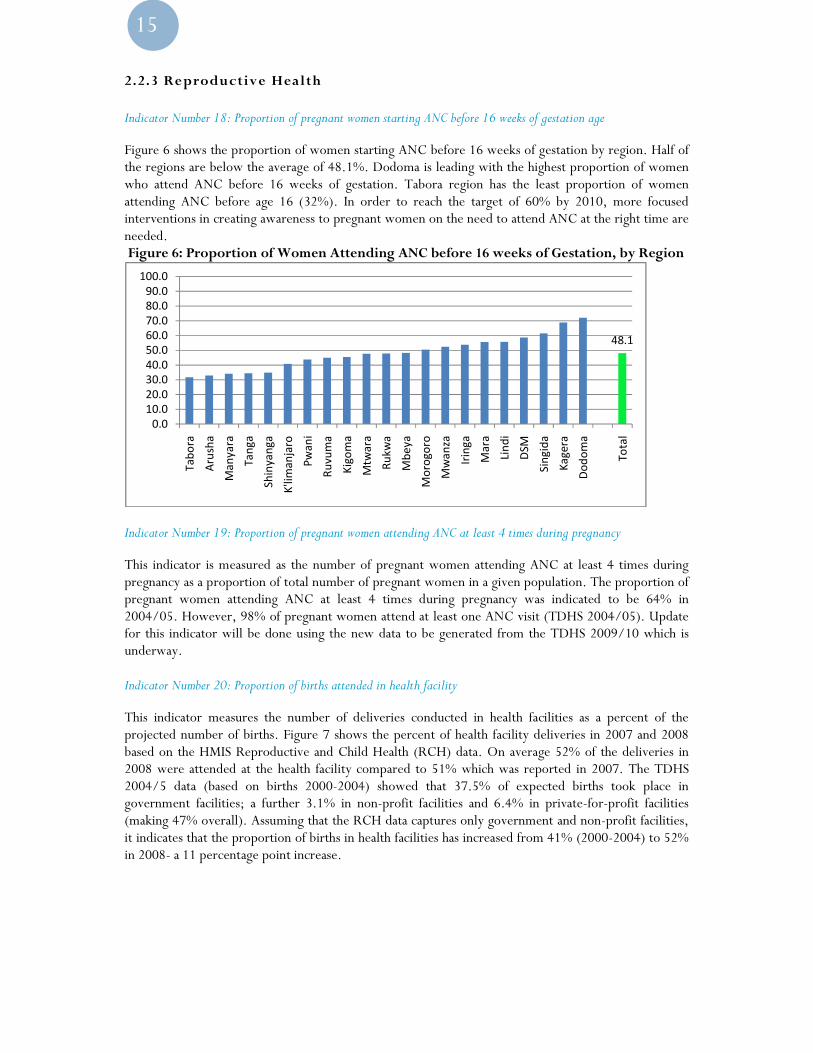
Indicator Number 17: Proportion of women receiving at least 2nd dose of TT vaccination
Figure 5 Source: RCH 2008 Figure 5 above shows the proportion of women receiving at least 2nd dose of TT vaccination. The 2008/09 national average is 54% similar to what was registered in the TDHS 2004/05 (56%) both being far below the baseline figure from Plan of Action for Maternal and Neonatal Tetanus Elimination in Tanzania 2008/09 of 85%. More than double the efforts will be required if the Ministry were to achieve the 2010 target for this indicator. Nearly half of the regions were below the 80% mark with Tabora and Kigoma performing poorly on this indicator.
87%89%
89%
94%
90%
87%
83%
86%
76%
78%
80%
82%
84%
86%
88%
90%
92%
94%
96%
2001 2002 2003 2004 2005 2006 2007 2008
DPT-HB3
Target
54%
0%
10%
20%
30%
40%
50%
60%
70%
80%
90%
100%
Da
r e
s S
ala
am
Kil
ima
nja
ro
Mo
rog
oro
Lin
di
Aru
sha
Ta
ng
a
Sin
gid
a
Do
do
ma
Ru
kw
a
Irin
ga
Mtw
ara
Sh
iny
an
ga
Co
ast
So
ng
ea
Ma
nya
ra
Mb
ey
a
Mw
an
za
Ta
bo
ra
Kig
om
a
To
tal
15
2.2.3 Reproductive Health Indicator Number 18: Proportion of pregnant women starting ANC before 16 weeks of gestation age
Figure 6 shows the proportion of women starting ANC before 16 weeks of gestation by region. Half of the regions are below the average of 48.1%. Dodoma is leading with the highest proportion of women who attend ANC before 16 weeks of gestation. Tabora region has the least proportion of women attending ANC before age 16 (32%). In order to reach the target of 60% by 2010, more focused interventions in creating awareness to pregnant women on the need to attend ANC at the right time are needed. Figure 6: Proportion of Women Attending ANC before 16 weeks of Gestation, by Region
Indicator Number 19: Proportion of pregnant women attending ANC at least 4 times during pregnancy
This indicator is measured as the number of pregnant women attending ANC at least 4 times during pregnancy as a proportion of total number of pregnant women in a given population. The proportion of pregnant women attending ANC at least 4 times during pregnancy was indicated to be 64% in 2004/05. However, 98% of pregnant women attend at least one ANC visit (TDHS 2004/05). Update for this indicator will be done using the new data to be generated from the TDHS 2009/10 which is underway. Indicator Number 20: Proportion of births attended in health facility
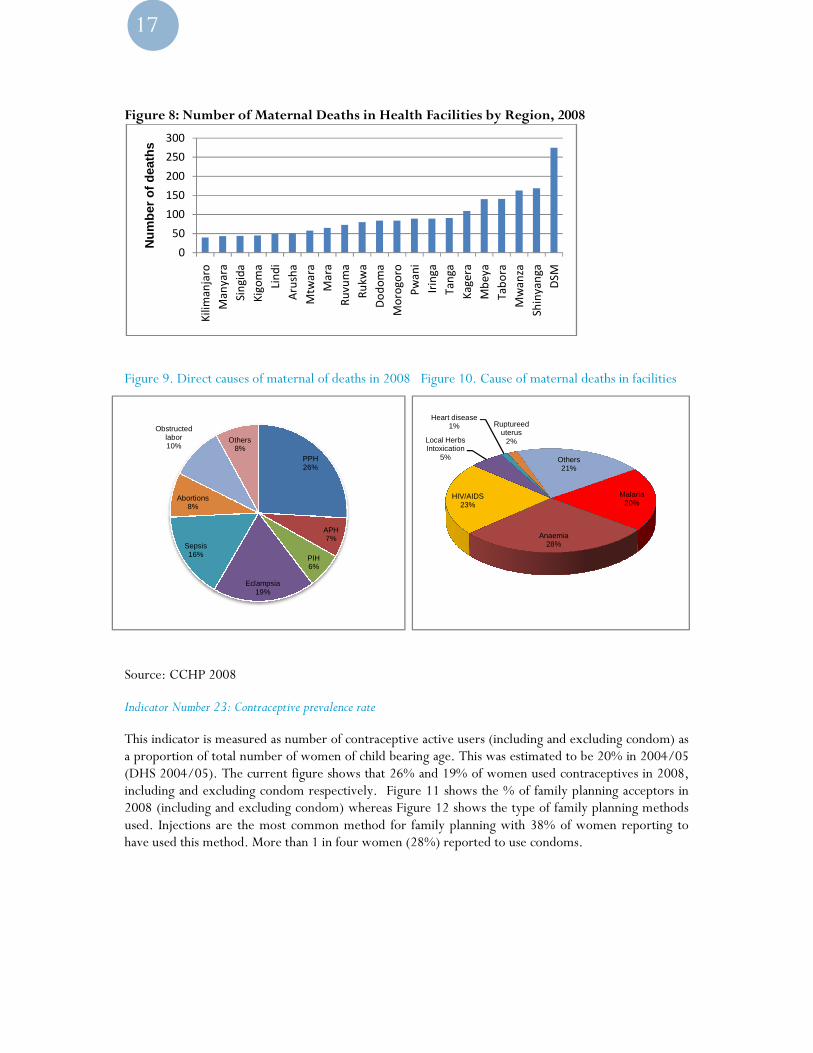
This indicator measures the number of deliveries conducted in health facilities as a percent of the projected number of births. Figure 7 shows the percent of health facility deliveries in 2007 and 2008 based on the HMIS Reproductive and Child Health (RCH) data. On average 52% of the deliveries in 2008 were attended at the health facility compared to 51% which was reported in 2007. The TDHS 2004/5 data (based on births 2000-2004) showed that 37.5% of expected births took place in government facilities; a further 3.1% in non-profit facilities and 6.4% in private-for-profit facilities (making 47% overall). Assuming that the RCH data captures only government and non-profit facilities, it indicates that the proportion of births in health facilities has increased from 41% (2000-2004) to 52% in 2008- a 11 percentage point increase.
48.1
0.0
10.0
20.0
30.0
40.0
50.0
60.0
70.0
80.0
90.0
100.0
Ta
bo
ra
Aru
sha
Ma
ny
ara
Ta
ng
a
Sh
inya
ng
a
K'lim
an
jaro
Pw
an
i
Ru
vu
ma
Kig
om
a
Mtw
ara
Ru
kw
a
Mb
ey
a
Mo
rog
oro
Mw
an
za
Irin
ga
Ma
ra
Lin
di
DSM
Sin
gid
a
Ka
ge
ra
Do
do
ma
To
tal
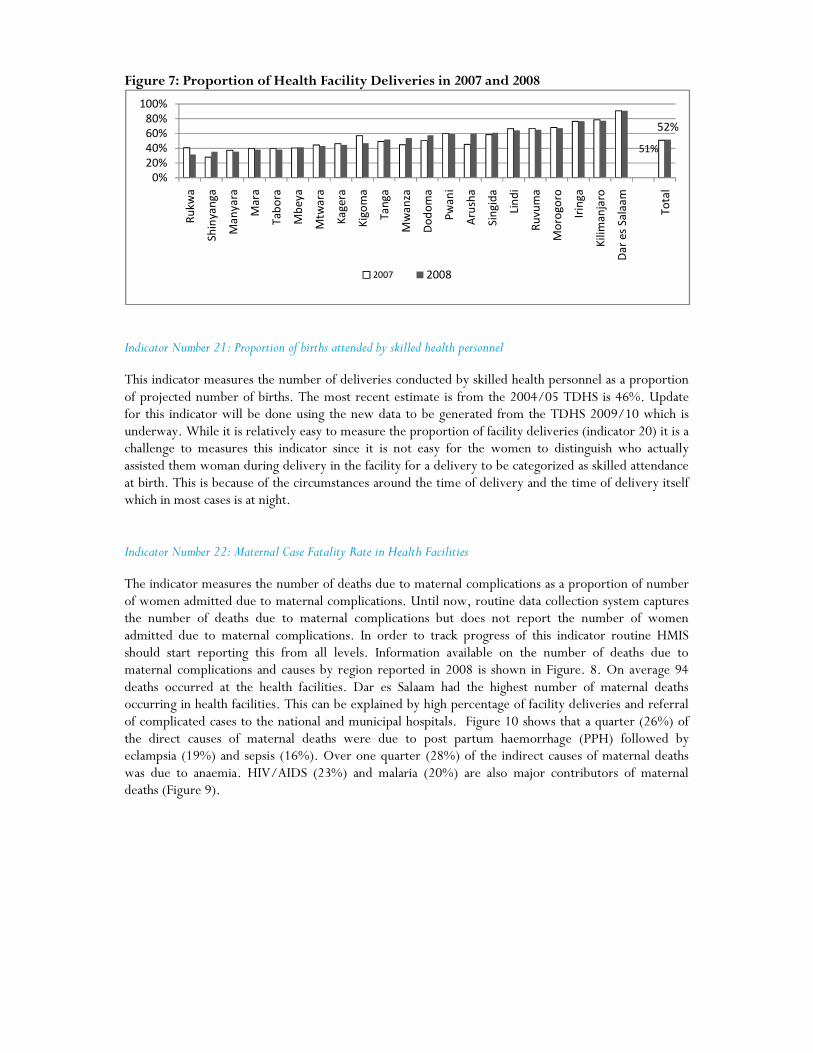
Figure 7: Proportion of Health Facility Deliveries in 2007 and 2008
Indicator Number 21: Proportion of births attended by skilled health personnel
This indicator measures the number of deliveries conducted by skilled health personnel as a proportion of projected number of births. The most recent estimate is from the 2004/05 TDHS is 46%. Update for this indicator will be done using the new data to be generated from the TDHS 2009/10 which is underway. While it is relatively easy to measure the proportion of facility deliveries (indicator 20) it is a challenge to measures this indicator since it is not easy for the women to distinguish who actually assisted them woman during delivery in the facility for a delivery to be categorized as skilled attendance at birth. This is because of the circumstances around the time of delivery and the time of delivery itself which in most cases is at night. Indicator Number 22: Maternal Case Fatality Rate in Health Facilities
The indicator measures the number of deaths due to maternal complications as a proportion of number of women admitted due to maternal complications. Until now, routine data collection system captures the number of deaths due to maternal complications but does not report the number of women admitted due to maternal complications. In order to track progress of this indicator routine HMIS should start reporting this from all levels. Information available on the number of deaths due to maternal complications and causes by region reported in 2008 is shown in Figure. 8. On average 94 deaths occurred at the health facilities. Dar es Salaam had the highest number of maternal deaths occurring in health facilities. This can be explained by high percentage of facility deliveries and referral of complicated cases to the national and municipal hospitals. Figure 10 shows that a quarter (26%) of the direct causes of maternal deaths were due to post partum haemorrhage (PPH) followed by eclampsia (19%) and sepsis (16%). Over one quarter (28%) of the indirect causes of maternal deaths was due to anaemia. HIV/AIDS (23%) and malaria (20%) are also major contributors of maternal deaths (Figure 9).
51%
52%
0%
20%
40%
60%
80%
100%
Ru
kw
a
Sh
inya
ng
a
Ma
ny
ara
Ma
ra
Ta
bo
ra
Mb
ey
a
Mtw
ara
Ka
ge
ra
Kig
om
a
Ta
ng
a
Mw
an
za
Do
do
ma
Pw
an
i
Aru
sha
Sin
gid
a
Lin
di
Ru
vu
ma
Mo
rog
oro
Irin
ga
Kil
ima
nja
ro
Da
r e
s S
ala
am
To
tal
2007 2008
17
Figure 8: Number of Maternal Death
Figure 9. Direct causes of maternal of deaths in 2008
Source: CCHP 2008
Indicator Number 23: Contraceptive prevalence rate
This indicator is measured as number of contraceptive active users a proportion of total number of women of child bearing a(DHS 2004/05). The current figure shows that 26% including and excluding condom respectively. 2008 (including and excluding condom) whereasused. Injections are the most common method for family planning with 38% of women reporting to have used this method. More than 1
0
50
100
150
200
250
300
Kil
ima
nja
ro
Ma
nya
ra
Sin
gid
a
Kig
om
a
Lin
di
Aru
sha
Mtw
ara
Ma
ra
Nu
mb
er o
f d
eath
s
PPH26%
PIH6%
Eclampsia19%
Sepsis16%
Abortions8%
Obstructed labor10%
Others8%
: Number of Maternal Deaths in Health Facilities by Region, 2008
causes of maternal of deaths in 2008 Figure 10. Cause of maternal deaths in
Indicator Number 23: Contraceptive prevalence rate
This indicator is measured as number of contraceptive active users (including and excludingon of total number of women of child bearing age. This was estimated to be 20
(DHS 2004/05). The current figure shows that 26% and 19% of women used contraceptives in 2008, including and excluding condom respectively. Figure 11 shows the % of family planning acceptors in
excluding condom) whereas Figure 12 shows the type of family planning methods Injections are the most common method for family planning with 38% of women reporting to
have used this method. More than 1 in four women (28%) reported to use condoms.
Ma
ra
Ru
vu
ma
Ru
kw
a
Do
do
ma
Mo
rog
oro
Pw
an
i
Irin
ga
Ta
ng
a
Ka
ge
ra
Mb
ey
a
Ta
bo
ra
Mw
an
za
Sh
iny
an
ga
DS
M
Anaemia28%
HIV/AIDS23%
Local Herbs Intoxication
5%
Heart disease1% Ruptureed
uterus2%
Others21%
APH7%
. Cause of maternal deaths in facilities
excluding condom) as ge. This was estimated to be 20% in 2004/05
and 19% of women used contraceptives in 2008, amily planning acceptors in
shows the type of family planning methods Injections are the most common method for family planning with 38% of women reporting to
Malaria20%

Figure 11: Percent of Family Planning Acceptors against Projections, 2008
Source: RCH 2008 Figure 12: Family Planning Use by Methods, 2008
Source:RCH 2008
Indicator Number 24: Percentage of health facilities that can p
This was estimated to be 5 % in 2004/05 (TDHS 2004/05).become available after the completion of TDHS 2009/10
0%
10%
20%
30%
40%
50%
60%
70%
Aru
sha
Do
do
ma
DSM
Irin
ga
Ka
ge
ra
Kig
om
a
Kil
ima
nja
ro
Lin
di
Ma
nya
ra
FP excl condoms
Traditional Methods, 0.2
Implants, 2.8
BTL, 1.6
Condom, 28.0
: Percent of Family Planning Acceptors against Projections, 2008
: Family Planning Use by Methods, 2008
Indicator Number 24: Percentage of health facilities that can provide Emergency Obstetric Care (EmOC)
This was estimated to be 5 % in 2004/05 (TDHS 2004/05). New data to update this indicator after the completion of TDHS 2009/10 which is currently underway.
Ma
nya
ra
Ma
ra
Mb
ey
a
Mo
rog
oro
Mtw
ara
Mw
an
za
Pw
an
i
Ru
kw
a
Ru
vu
ma
Sh
iny
an
ga
Sin
gid
a
Ta
bo
ra
Ta
ng
a
To
tal
FP excl condoms With
Pills, 27.8
IUCD, 0.6
Injection, 38.8
Others, 0.2
rovide Emergency Obstetric Care (EmOC)
to update this indicator will
19
2.2.4 HIV and AIDS Indicator Number 25: Percentage of HIV positive women receiving ARVs to prevent Maternal to Child Transmission
(MTCT)
This indicator measures the number of HIV positive women receiving ARV for Prevention of Mother to Child Transmission (PMTCT) as a proportion of total number of HIV positive pregnant women per year. About 34% of HIV positive women were receiving ARVs to prevent MTCT in 2007 (NACP, 2007). The proportion has increased to 55% by the end of 2008. This increase is significant and if the same pace is maintained, the target of 80% by 2012 could be reached. Indicator Number 26: Number of persons with HIV infection receiving ARV combination therapy
A total of 80,628 persons with advanced HIV infection were receiving ARV combination treatment by the end of 2007. By the end of May 2009 a total of 248,280 people were receiving ART (229,764 adults and 18,516 children) which is a significant increase (32%). It should be noted that this is a cumulative figure which includes those who have died and those who have stopped or interrupted treatment. Despite this significant increase, the number is far below the 440,000 target to be reached by 2010.
2.2.5 Malaria Indicators Number 27, 28, 29, and 30
Five independent malaria surveys were conducted between October 2007 and September 2008. These were the Tanzania HIV and Malaria Indicators Survey (Oct 2007-Feb 2008), National Institute for Medical Research (Feb-May 2008) Survey, Population Service International (Mar-May 2008) Survey, National Malaria Control Program (year) Survey, and Tanzania National Bed net Strategy Survey (Jul-Sep 2008). Estimates from these surveys vary from one another because of the methodology and timing of data collection. However, these estimates are still useful for NMCP M&E plan. Official statistics for measuring the progress in malaria related indicators are obtained from the Tanzania HIV/AIDS and Malaria Indicators Survey (THMIS 2007/08). Table 2 below shows the performance of the four malaria related indicators as reported in THMIS 2007/08. Indicator 27 measures the number of mothers receiving 2 doses of SP during pregnancy as a proportion of total number of mothers attending ANC. This was estimated to be 57% in 2007/8 (2008 THMIS), indicating improvements in the indicator from 22% in 2004/05 (2004-05 TDHS). The current figure shows that we are on the right track to achieving the target of 60% set for 2010.
Indicator 28 measures the proportion of vulnerable groups (pregnant women 15-49 years of age and children under 5) sleeping under an Insecticide Treated Net (ITN) the previous night. This was estimated to be 26% for children under 5 years and 27% for pregnant women (2008 THMIS). New data to measure the performance of this indicator will be available in the coming ongoing TDHS 2009/10 survey.
Indicator number 29 measures the number of positive by microscopy or Rapid Diagnostic Test (RDT) as a proportion of number of OPD visits. RDT have not been rolled out nationally except in few pilot areas.

No new data are available to measure the performance of indicator 30 which measures the prevalence of
malaria parasitemia in under 5 years. The most current estimate is 18% from the 2007/08 (2008
THMIS).
Table 2: Performance of Malaria related Indicators No Indicator Value (%) Source
27 Proportion of mothers who received two doses of preventive
intermittent treatment for malaria during last pregnancy
57 THMIS 2007-08
28 (a) Proportion of vulnerable groups (pregnant women 15-49 years of
age) sleeping under an ITN previous night
27 THMIS 2007-08
28 (b)
Proportion of vulnerable groups (children under 5) sleeping under an ITN previous night
26 THMIS 2007-08
29 Proportion of laboratory confirmed malaria cases among all OPD visits (disaggregated under 5 and over 5)
- -
30 Prevalence of malaria parasitaemia (under 5 years) 18 THMIS 2007-08
The severity of malaria problem varies by Council. Based on the sample of 78 Councils, Kilosa DC has
the highest malaria cases in 2008 (Figure 13).
Figure 13: Top 10 Councils Reporting High Number of Malaria Cases, June 2008
2.2.6 Tuberculosis and Leprosy The Tanzania National Tuberculosis and Leprosy Program is one of the most successful TB programs in the world. TB notification rates, treatment success and the proportion of leprosy cases diagnosed and successfully completed treatment have improved for the current analysis period—2008. Indicator Number 31: Tuberculosis Notification rate per 100,000 population This indicator is measured as number of tuberculosis cases diagnosed as a proportion of total population. This was estimated to be 163/100,000 in 2006 (TB&LP2006) and has remained the same in 2008 (162/100,000).
-10.0 20.0 30.0 40.0 50.0 60.0 70.0 80.0 90.0
100.0

21
Indicator Number 32: Percent of TB treatment success rate
This is measured as number of patients who successfully completed treatment as a proportion of tuberculosis cases diagnosed. New data from the program for the year 2007 shows an improvement in treatment success rate of 87.7% (Figure 14) from 84.7% in 2006 (TB&LP 2006). The program has surpassed the global target set at 85%. Maintaining these high rates will continue to be a challenge to the program. Figure 14: TB Treatment Success Rate
Indicator Number 33: Proportion of leprosy cases diagnosed and successfully completed treatment
This is measured as number of leprosy cases diagnosed and successfully treated as a proportion of total number of notified leprosy cases. This was estimated to be PB 97.2% and MB 91.7%.
2.2.7 Infectious and Non-communicable Diseases Indicators Number 34: Incidence of cholera cases per 100,000 people
This indicator measures the number of cholera cases in a year as a proportion of the total population at risk. The incidence of cholera cases per 100,000 people was estimated to be 3,284 in 2005 and no updated figure is available. However, data on number of cholera cases per region are available from the HMIS. As figure 15 shows, majority of the cholera cases were reported in Kigoma (688 cases) and Morogoro (453 cases).A total of 2,391 cases were reported from all regions in 2008 with an average of 119 cases.
Indicator Number 35: Proportion of treated cases of cholera who died This indicator measures the proportion of treated cases of cholera but the individuals died. Out of the 2,391 cases identified in 2008, 73 treated cases died. Figure 16 shows the number of treated cases but died where majority of dead cases are from Kigoma, Lindi and Morogoro regions.
87.7%
0.0%
10.0%
20.0%
30.0%
40.0%
50.0%
60.0%
70.0%
80.0%
90.0%
100.0%
DSM
-Ila
la I
I
Irin
ga
Kil
ima
nja
ro
Ta
bo
ra
Sh
iny
an
ga
Mw
an
za
Da
r e
s S
ala
am
Pw
an
i
DS
M-I
lala
I
DS
M-K
ino
nd
on
i
Ru
vu
ma
DS
M-T
em
eke
Ma
ra
Ma
nya
ra
Aru
sha
Kig
om
a
Lin
di
Do
do
ma
Ru
kw
a
Mb
ey
a
Ta
ng
a
Ka
ge
ra
Sin
gid
a
Mo
rog
oro
Mtw
ara
Ta
nza
nia
-Ma
inla
nd

Figure 15: Number of Reported Cholera Cases, by Region
Figure 16: Number of Cholera Treated Cases but Died, by Region
2.3 Progress towards Health System Indicators Selected indicators to evaluate health systems include financial and human resources and performance of the logistic system. These are input indicators which show how much the government is investing in health sector in terms of financing health activities as well as human capital and in facilitating delivering of requisite services.
2.3.1 Financial Resources Indicators on financial performances are amongst key and important monitoring and evaluation indicators. By understanding the problem, the Government of Tanzania has explored a number of approaches in an attempt to bridge existing financial gaps. Tanzania has a mixed type of financing its health systems. It largely relies upon a tax financial system of which about 70% is from public financing and foreign financing. These two sources are complemented by health insurance in form of National Health Insurance Fund (NHIF), and Community Health Fund (CHF), and user fees in the form of cost sharing. The essence of having financial indicators is to permit close monitoring to ensure that all the funds channelled to the health sector from all sources are used effectively and efficiently.
0
100
200
300
400
500
600
700
800
Do
do
ma
Irin
ga
Ka
ge
ra
Mw
an
za
Ru
vu
ma
Sh
iny
an
ga
Ta
bo
ra
Mtw
ara
Kil
ima
nja
ro
Pw
an
i
Ru
kw
a
Ma
ny
ara
Mb
ey
a
D`s
ala
am
Ma
ra
Ta
ng
a
Lin
di
Aru
sha
Sin
gid
a
Mo
rog
oro
Kig
om
aNu
mb
er
of
cho
lera
ca
ses
1 12 2 2
6
89
1314
15
0
2
4
6
8
10
12
14
16
Aru
sha
Do
do
ma
Irin
ga
Ka
ge
ra
Ma
ny
ara
Mtw
ara
Mw
an
za
Ru
vu
ma
Sh
iny
an
ga
Ta
bo
ra
D`s
ala
am
Mb
ey
a
Kil
ima
nja
ro
Pw
an
i
Ru
kw
a
Ta
ng
a
Sin
gid
a
Ma
ra
Mo
rog
oro
Lin
di
Kig
om
aNu
mb
er
of
pe
op
le w
ho
die
d
wit
h c
ho
lera
23
Indicator Number 36: Proportion of the national budget spen Statistics on proportion of the national budget speninformation was taken from Health Sector Public Expenditure Review (PER)Over the past four financial years, together with the budgeted amount f2008/09, the share of the health sector in total government budget and expenditures has remained well below the 15% target of Abuja Declaration. Actual health expenditure had increased from 10% of total government spending including Consolidated Fund2005/06, and this has so far been the peak11% of actual spending in 2007/08, the (including CFS) dropped to 10% in 2008/09.because the total government budget increasethe health sector (19%). 1 Figure 17: Proportion of the National Budget Spent on Health
Indicator Number 37: Total Government and Donor The per capita spending has been increasing over the review period (Figure capita health spending is still low, at an average of about TShs 14,215 in nominal terms, while in real terms (2001 constant prices), is still below TShs 10,000. In Dollar terms, the average per capita health spending is about US$ 11.23 over the review period and with healththe government budget, reaching the WHO’s estimated per capita spending of US$34 in order to adequately address health challenges, remains an uphill task. Also, the level of spending is still far short of HSSP III projection of achieving US$15.75 per capita spending by 2009/10.
1 Consolidated Fund Services (CFS) which is largely
Proportion of the national budget spent on health
s on proportion of the national budget spent on health are presented in Figure 1information was taken from Health Sector Public Expenditure Review (PER) update of August
the past four financial years, together with the budgeted amount for the current financial year 2008/09, the share of the health sector in total government budget and expenditures has remained well below the 15% target of Abuja Declaration. Actual health expenditure had increased from 10% of total
Consolidated Fund Services (CFS)1 in 2004/05 to , and this has so far been the peak for the entire review period. Despite a modest increase to
11% of actual spending in 2007/08, the share of health sector budget in total governmeto 10% in 2008/09. This decline in the share of health budget is aggravated
total government budget increased slightly (20%) than the increase in budget allocations to
portion of the National Budget Spent on Health
: Total Government and Donor on Budget Allocation to health capita
The per capita spending has been increasing over the review period (Figure 18). However, the ping is still low, at an average of about TShs 14,215 in nominal terms, while in real
terms (2001 constant prices), is still below TShs 10,000. In Dollar terms, the average per capita health spending is about US$ 11.23 over the review period and with health sector claiming about 10the government budget, reaching the WHO’s estimated per capita spending of US$34 in order to adequately address health challenges, remains an uphill task. Also, the level of spending is still far short
n of achieving US$15.75 per capita spending by 2009/10.
which is largely funds used to pay public debt.
igure 17. This of August 2009.
or the current financial year 2008/09, the share of the health sector in total government budget and expenditures has remained well below the 15% target of Abuja Declaration. Actual health expenditure had increased from 10% of total
in 2004/05 to about 12% in Despite a modest increase to
share of health sector budget in total government budget budget is aggravated
(20%) than the increase in budget allocations to
). However, the per ing is still low, at an average of about TShs 14,215 in nominal terms, while in real
terms (2001 constant prices), is still below TShs 10,000. In Dollar terms, the average per capita health sector claiming about 10-11% of
the government budget, reaching the WHO’s estimated per capita spending of US$34 in order to adequately address health challenges, remains an uphill task. Also, the level of spending is still far short
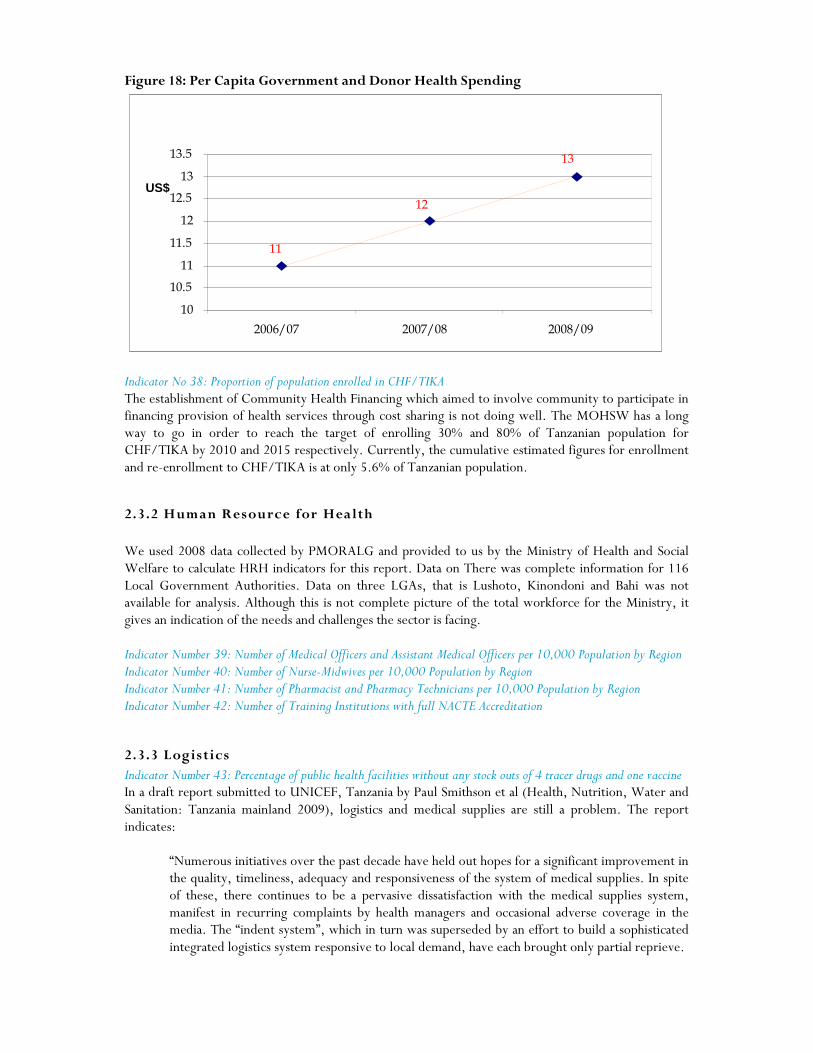
Figure 18: Per Capita Government and Donor Health Spending
Indicator No 38: Proportion of population enrolled in CHF/TIKA The establishment of Community Health Financing which aimed to involve community to participate in financing provision of health services through cost sharing is not doing well. The MOHSW has a long way to go in order to reach the target of enrolling 30% and 80% of Tanzanian population for CHF/TIKA by 2010 and 2015 respectively. Currently, the cumulative estimated figures for enrollment and re-enrollment to CHF/TIKA is at only 5.6% of Tanzanian population.
2.3.2 Human Resource for Health We used 2008 data collected by PMORALG and provided to us by the Ministry of Health and Social Welfare to calculate HRH indicators for this report. Data on There was complete information for 116 Local Government Authorities. Data on three LGAs, that is Lushoto, Kinondoni and Bahi was not available for analysis. Although this is not complete picture of the total workforce for the Ministry, it gives an indication of the needs and challenges the sector is facing. Indicator Number 39: Number of Medical Officers and Assistant Medical Officers per 10,000 Population by Region Indicator Number 40: Number of Nurse-Midwives per 10,000 Population by Region Indicator Number 41: Number of Pharmacist and Pharmacy Technicians per 10,000 Population by Region Indicator Number 42: Number of Training Institutions with full NACTE Accreditation
2.3.3 Logistics Indicator Number 43: Percentage of public health facilities without any stock outs of 4 tracer drugs and one vaccine In a draft report submitted to UNICEF, Tanzania by Paul Smithson et al (Health, Nutrition, Water and Sanitation: Tanzania mainland 2009), logistics and medical supplies are still a problem. The report indicates:
“Numerous initiatives over the past decade have held out hopes for a significant improvement in the quality, timeliness, adequacy and responsiveness of the system of medical supplies. In spite of these, there continues to be a pervasive dissatisfaction with the medical supplies system, manifest in recurring complaints by health managers and occasional adverse coverage in the media. The “indent system”, which in turn was superseded by an effort to build a sophisticated integrated logistics system responsive to local demand, have each brought only partial reprieve.
13
12
11
10
10.5
11
11.5
12
12.5
13
13.5
2006/07 2007/08 2008/09
US$

25
Stock outs, affecting the full range of essential commodities, remain disappointingly common. Ironically, such shortages are accompanied by expiry of excess stocks. In both cases, the symptoms point towards a chronically under-performing medical supply system. Related to this is the chronic problem with supply of adequate medical equipment – including items as basic as BP machines – as well as maintenance or replacement of non-functional equipment. The medical supply system has a direct bearing on access as well as quality of services. If women are expected to bring with them a plethora of supplies in order to deliver at a health facility, it is not surprising that many cannot afford to do so and choose to deliver at home”.
This situation is compounded by deficiencies in the supportive supervision systems at all levels of the health system. If the supervision systems were to be more effective, health managers would be able to pick up early problems and challenges with logistics and take the necessary remedial measures. However shortages of medicines, supplies and equipment are common throughout the year and affect the health system at all levels. Much more needs to be undertaken to address this situation.

Chapter 3: Progress towards Milestones 2008/09 This chapter presents progress against the Milestones adopted at last year’s Joint Annual Health Sector Review. Out of the 14 milestones:
• Only 3 milestones were fully achieved (21% )
• 7 milestones were partially achieved4 milestones were not achieved Compared to last year’s progress of implementation of the 15 set Milestones, where only three (3) Milestones were fully achieved, there has been no significant improvement in the proportion of Milestones fully achieved, during the previous year (2008/09). As with last year’s Milestones, the more detailed assessment in the Table 3 below indicates that there was some partial progress was registered in all areas – even in cases where the Milestone itself was not fully achieved. Table 3: Summary Progress towards Milestones, FY2008/09
No Milestones Implementation Status
Level of Achievement
Constraints Way forward
1 The budget section under DPP is staffed to take responsibility of the PER and of the development of health financing strategy by December 2008.
Two economists have been recruited. They are both involved in PER and health financing activities. Two more Economists will be recruited in the year 2009-10. The Head of Budget and the Coordinator for Health Basket Fund have been appointed.
On progress
The names of the appointees will be availed to the stakeholders.
2 A comprehensive health financing strategy is developed and ready to be approved by September 2009.
TOR for Development of Health Financing Strategy has been developed and discussed by the Health Financing working group. The WB has accepted to fund the financing strategy development and the procurement process for consultancy services has started. Health Sector Strategic Plan III was launched on 30th June 2009 to give room for the Health Financing Strategy to be developed.
On progress
The deadline for the Milestone was ambitious, because supplementary budget was delayed and could not be accessed; the launching was done in 30th June 2009 and there was no way to develop the Strategy between July and August 2009, without funds. This Milestone will be achieved in the year 2009-10.
3 A public/private partnership mechanism for recruitment, retention and to fund and expand Private
1.Districts have been empowered to hire Health staff and second them to the FBO facilities depending on the Districts’ budget. This is in the Budget Guidelines and in line with
1. On progress

27
Training Institutions in line with the MMAM is established by March 2009.
the principles of Decentralisation by Devolution. (D by D). 2.All the health staff in Volunteer Agency health facilities including District Designated Hospitals who have previously been given staff grants by the Government have now been entered into the Government payroll to avoid mismanagement of funds given as grants for salaries. 3.Support to the Private sector training Institution for increased enrolment to meet MMAM targets is expected to be implemented through the health workforce Initiative. The proposal as well as modalities have been developed and is in the process of review and soliciting views for finalization. 4.The effort by Govt includes an increase of Grants to students as well as sponsoring students to the Private higher learning Institutions. The Ministry has convened a stakeholders meeting between the Ministry and Private sector to deliberate on operational issues for the training Institutions.
2.Good progress = recognition 3.On progress 4.On progress
4. Payment for Performance contributions to the motivation and productivity of staff are documented and presented to the next JAHSR by September 2009.
Regional and Districts Teams members (RHMTs & CHMTs) including members from the zonal resource centers has been trained on implementation of P4P. A draft report on baseline data on Performance indicators for P4P implementation is planned to be submitted to the Senior Management when finalized.
Not achieved
The Milestone was endorsed on the condition that, Basket Funds will be used. However, BF was not approved for this activity.
5. The mapping of public and private health service providers is completed by December 2008.
The implementation of this milestone is ongoing. However, the implementation has started in phases as follows: - 1.Development of data collection tool is completed. The tool was developed using Service Availability Mapping tool model. The tool is a standard tool to be used for health facility data collection. Type of information to be collected will be on human resource, drugs, type of services provided, equipment etc. 2.Listing of all health facilities in the
1.Achieved 2.Achieved

country completed. The purpose of this exercise was to know the distribution of health facilities according to villages/Streets, wards, divisions, districts, and ownership. The listing will be used during field work of collecting Geo-code information for each facility as well as more information on each facility. 3.The University of Dar es Salaam Computing Center are developing web – system to be used to maintain health facility data base which would be automatically updated by districts. This work is funded by WHO and is ongoing activity as planned 4.GTZ has assisted in doing Mapping work in Mbeya region. They used standard tool to collect HF information – Completed. 5.MoHSW through M & E section in collaboration with CSSC and NIMR are planning to conduct a Service Availability Mapping (SAM) in 3 – 5 regions. Financial support is expected to be provided by WHO – Planned to be completed before end of December 2009.
3.Is being Achieved 4.Achieved 5.On progress
6. Operation of a HR information system (including public and private sector) and presentation of the national overview of human resource situation at JAHSR in September 2009
The process of establishing HR information System is ongoing. The system will have a link with different data base such Public,(MOHSW, POPSM, PMO-RALG) Private, FBO and Training Institution data base. Department of Computer Science – University of Dar es Salaam is the consulting Institutions. The following task has been done;
• Human Resource Information System prototype has been developed with capacity to link to existing systems.
Training Information system has been developed. Data collection exercise from all Training Institutions is on-going; the coverage is 80%.
On progress
The Management and stakeholders retreated on this milestone. The establishment of operational HR Information is a huge undertaking and therefore the presentation on the human resource overview will be done based on different data sources (Government Pay roll, APHTA and CSSC data bases).

29
7. CCHP guidelines, assessment tools and National Essential Health Interventions Packages are revised in line with HSSP III and facilitate implementation of service agreement by March 2009.
The HSSPIII was launched on 30th June 2009. Part of the CCHP guidelines were reviewed and amended ahead of the CCHP 2009/10 planning. A desk study for translating HSSP III to next generation of CCHP was done by consultants and submitted to the Ministry by 1st September 2009. The findings and recommendations fed into the discussion of the Technical Review Meeting held on 15th to 17th September 2009 and will feed into the JAHSR Main Meeting to be done on 7th to 9th October 2009. It is expected that, subsequent to the JASHR, the CCHP guidelines (including assessment tools) will be revised as soon as this activity can be financed.
On progress
The deadline set was ambitious due to the fact that the HSSP was launched on 30th June 2009 and the funds in the MTEF could not be used. However, this milestone will be implemented in the year 2009-10. A budget has been set in the MTEF. Also the National Essential Health Interventions Packages will be reviewed to be in line with the HSSPIII and be used as reference in the CCHP Guidelines.
8. HSSPIII document translated into Kiswahili and disseminated to all levels of the health sector in order to input into their respective annual plans for 2009/10 by March 2009.
Dissemination has started by using the English version. This version of HSSP III was launched on the 30th June 2009 by the President of the United Public of Tanzania Honourable Dr. Jakaya Mrisho Kikwete. The document has been circulated to all Councils, CHMTs, RHMTs, CMO’s/RMO’s, Sector Ministries, Universities and Private Sector. Public dissemination was also done during the Saba-Saba and Nane-Nane celebrations where the public was informed about the 11 strategies and how the strategic plan is expected to benefit the public. The HSSP III document can be accessed on http://www.moh.go.tz The RHMTs have been oriented on HSSPIII and trained in strategic planning by the Ministry through TC-RRHM.
On progress
The deadline set for the Milestone was ambitious due to the fact that the HSSPIII English version was launched on 30th June, 2009. Translation to Swahili of the document will be done in the year 2009-10. In addition, the CHMTs will use the reviewed CCHP Guidelines that are in line with HSSPIII to prepare their CCH Plans starting from March 2010.
9. A full time PPP Secretariat established and tasked with drafting policy guidelines (including the Strategic Plans) by March 2009.
Office space for the Secretariat which is a pressing problem has been obtained. It needs renovation. Assessment for renovation of Office space has been done. Financial requirement is USD 50,000. Job descriptions for the NPPPSC Secretary and Administrator have been developed. ToR for developing the PPP Strategic Plan were developed and were given to a
On progress

Consultant who developed a Draft Strategic Plan for implementing PPP in Health. The draft is being circulated for comments before being presented to Stakeholders. A full time personnel has been appointed.
10. Number of Hospitals, Health Centres and Dispensaries that are providing basic and comprehensive EmOC and neonatal resuscitation by June 2009.
A comprehensive assessment is planned to assess and document the number of facilities providing basic and comprehensive EmONC. The assessment will take 12 months to be completed. A consultant from WHO has been identified and a country core team with technical expertise is selected. Mobilization of resources is initiated as it will cost approximately 600,000,000 Tsh. A questionnaire has been sent to DMO`S, requesting them to fill in questions with regard to EmONC, and return them back to MOHSW by 25th September 2009. Findings from the questionnaire will form a baseline to the assessment that will be conducted later.
On progress .
11. HMIS strengthening plan finalized and strategic implementation in line with HSSP III and ready for scaling up including allocations in 2009-2010 MTEF by March 2009
HMIS strengthening Plan was finalized in accordance with the HSSP III strategic objective and presented to the Senior Management meeting of the MOHSW. It was also presented to the TC SWAp held in April 2009 and biannual SWAp meeting held in May 2009. On 3rd September, 2009, the plan was presented to stakeholders meeting which discussed the M&E strengthening initiatives. In the meeting, it was agreed that implementation of the plan should start officially on 1st November, 2009 after the HMIS consortium team has finalised biannual plan and budget. The Ministry is in the process of opening of a special account for the HMIS project.
Delayed but somehow on progress
12 Medicines allocation formula is implemented and medicines budget from MoFEA to MSD is fully disbursed by MoHSW as per quarter.
• Resource allocation formula for medicines and related supplies has been developed. The formula requires adjustment in order be applicable to all levels – District, Regional and Central (Referral Hospitals). Currently, it can only be used to allocate funds to district level based on population, poverty index and
Proposal by C. Msemo and J. Boex (Dec. 07) Horizontal allocation is applied. The proposed vertical allocation: Central Gov
Ministry will study the findings and see on how it fits with the implementation of as the study has been overtaken by events (MMAM and HSSPIII).

31
The progress report on progress on agreed milestones demonstrates the jointly agreed milestones set were rather ambitious considering the time, capacity and resources available to achieve them fully as planned.
morbidity/mortality (70:15:15). There is need to establish parameters to be used to allocate funds to Regional, Referral and Special Hospitals.
• During 2008/09, the MoHSW disbursed 97% of the funds allocated for medicines and related supplies to MSD
Hosp: 15% Regional Hosp: 5% Distr. Hosp & PHFs: 80%. The. On progress
13. Identify areas within MoHSW needing strengthening in order to adapt the core roles and functions to respond to HSSP III requirements by March 2009.
• Training Plan has been developed and consolidated. Staff was involved in identifying areas of weakness and training needs.
• M&E – HIS is linked to include information on Human Resources.
On progress
14. Monitor key health development challenges for example in the areas of maternal, new born, child health, human resources and health infrastructure through joint yearly field visits by June 2009.
The Joint Field Visit was carried out from 7th to 9th September 2009. In addition the Technical Working Group on Human Resources has conducted several Field Visits during the first half of 2009.
Achieved

Chapter 4: MTEF Implementation Status Summary This chapter reviews proposed Ministry of Health and Social Welfare for the FY 2008/09 objectives by all directorates and institutions. It is worth noting that in the annual report, budget and expenditures are tied to MoHSW objectives and the targets to be achieved. Using the information from the MoHSW (Vote 52) Annual Implementation Report for the FY 2008/09 we present the MoHSW budget and expenditure by Departments. Box 2 below provides MoHSW strategic objectives as presented in the annual report. Box 2: Strategic Objectives in the FY 2007/08 MOHSW Budget 52A 52B 52C 52D 52E 52F 52G 52H 52I
Services improved and HIV infection reduced Equitable and gender sensitive health and social welfare services ensured Quality essential health and social welfare services provided Research, training and continuous professional development for improved performance, enhanced Burden of Disease reduced Institutional, capacity and organization of the Ministry to implement its core functions enhanced Policies, legislation, regulation for efficient and effective service delivery improved An efficient and effective governance system for the delivery of services in place Enhance financing alternatives for provision of health service
The performance of activities by different departments is categorized in four levels as follows:
• Level 1: Departments with funds utilization rate above 80% are considered to have fully implemented the activities as stipulated in the MTEF (excellent performance)
• Level 2: Departments with funds utilization rate between 61%-80% are considered to have partially implemented the activities as stipulated in the MTEF (very good performance)
• Level 3: Departments with funds utilization rate between 41% -60% are considered to have partially implemented the activities as stipulated in the MTEF (average performance)
• Level 4: Departments with funds utilization rate between 0% - 40% are considered as poor performers.
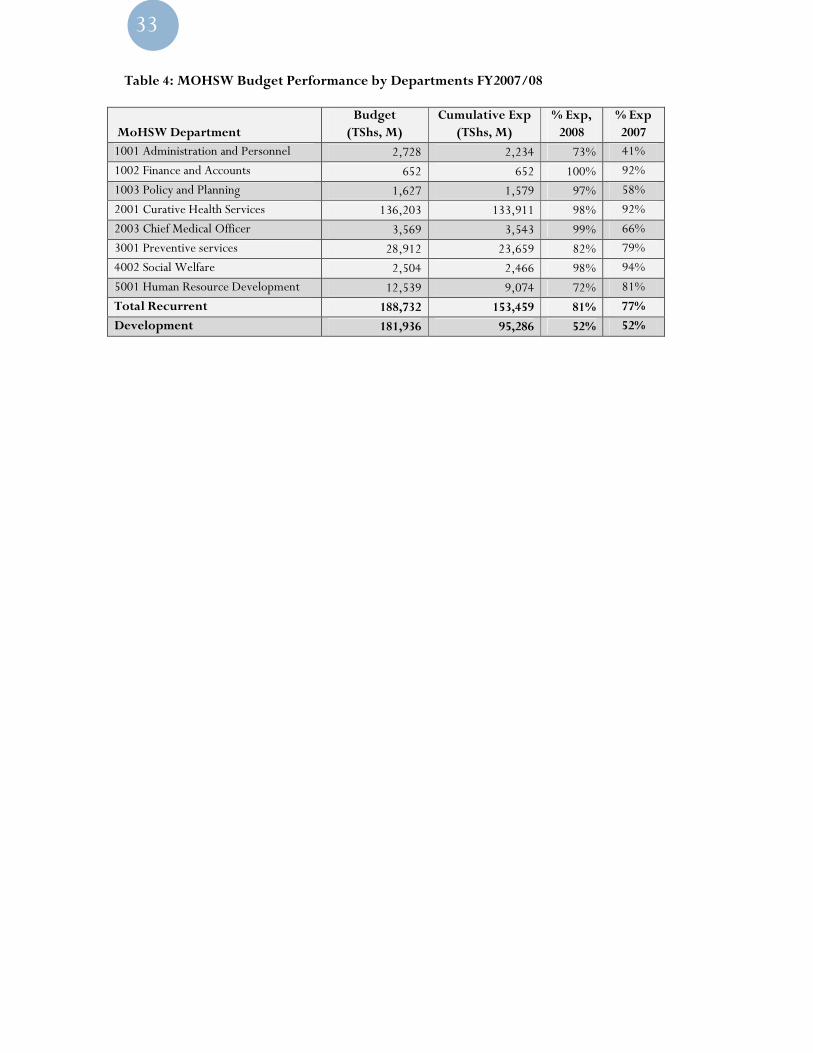
Table 4 provides a summary of budget and expenditure by MoHSW departments. It can be noted from the Table that, the overall performance of MoHSW recurrent budget by departments was excellent based on the above classification (81%). This is an improvement over last year’s performance which was 77%. All the Departments had an excellent score except Administration and Personnel and Human Resource Development which have a very good score. Of particular concern at this juncture would be the average performance of the development budget (52%), which could be partly explained by lapses in implementation of development projects in the face of stringent procurement procedures, and challenges which are beyond MOHSW capacity including no release of funds from some sources, and late disbursement of funds.
33
Table 4: MOHSW Budget Performance by Departments FY2007/08
MoHSW Department Budget (TShs, M)
Cumulative Exp (TShs, M)
% Exp, 2008
% Exp 2007
1001 Administration and Personnel 2,728 2,234 73% 41%
1002 Finance and Accounts 652 652 100% 92%
1003 Policy and Planning 1,627 1,579 97% 58%
2001 Curative Health Services 136,203 133,911 98% 92%
2003 Chief Medical Officer 3,569 3,543 99% 66%
3001 Preventive services 28,912 23,659 82% 79%
4002 Social Welfare 2,504 2,466 98% 94%
5001 Human Resource Development 12,539 9,074 72% 81%
Total Recurrent 188,732 153,459 81% 77%
Development 181,936 95,286 52% 52%
Chapter 5: Review of Council Health Performance This chapter presents the performance of some Council specific indicators that are related to the HSSP III indicators presented in chapter 2 above. The information is based on the analysis of Comprehensive Council Health Plans by MOHSW.
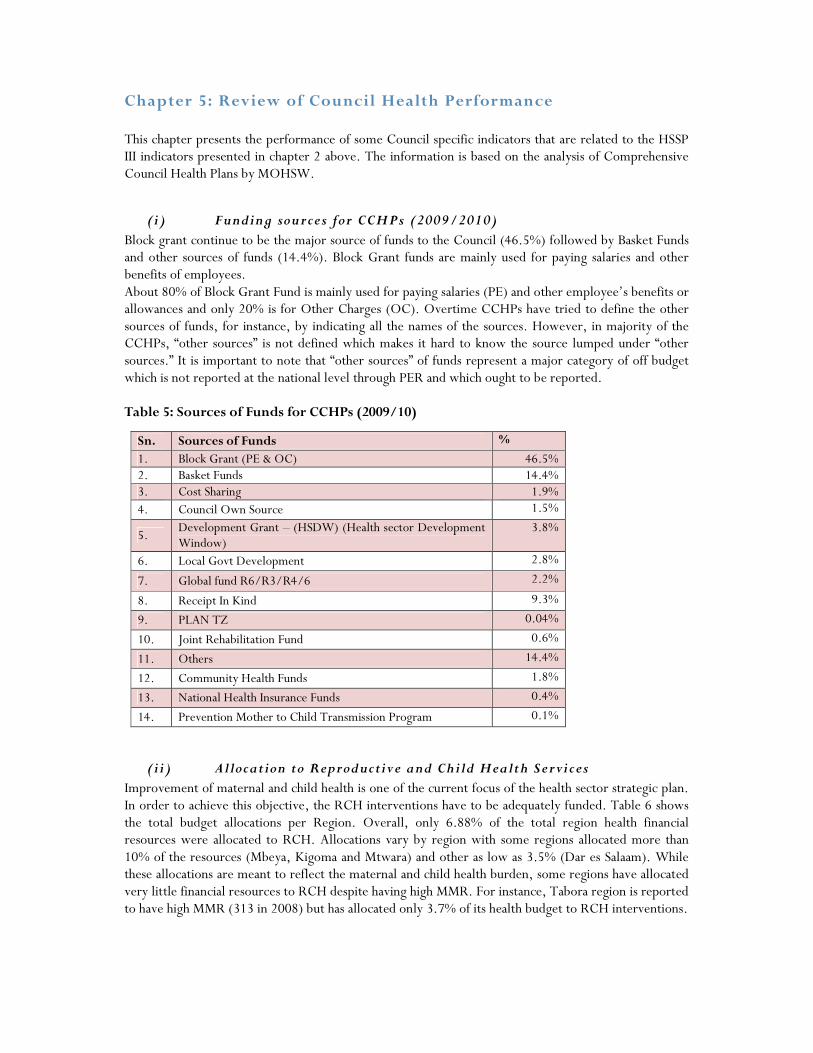
(i) Funding sources for CCHPs (2009/2010) Block grant continue to be the major source of funds to the Council (46.5%) followed by Basket Funds and other sources of funds (14.4%). Block Grant funds are mainly used for paying salaries and other benefits of employees. About 80% of Block Grant Fund is mainly used for paying salaries (PE) and other employee’s benefits or allowances and only 20% is for Other Charges (OC). Overtime CCHPs have tried to define the other sources of funds, for instance, by indicating all the names of the sources. However, in majority of the CCHPs, “other sources” is not defined which makes it hard to know the source lumped under “other sources.” It is important to note that “other sources” of funds represent a major category of off budget which is not reported at the national level through PER and which ought to be reported. Table 5: Sources of Funds for CCHPs (2009/10)
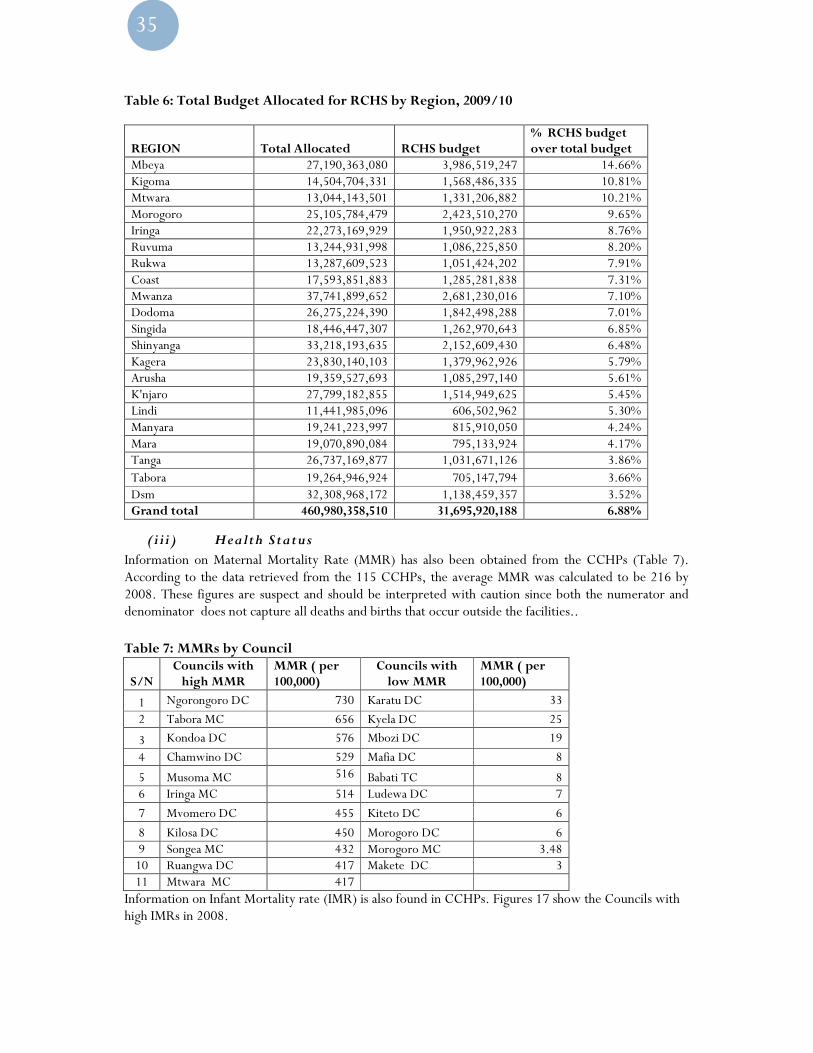
(i i) Allocation to Reproductive and Child Health Services Improvement of maternal and child health is one of the current focus of the health sector strategic plan. In order to achieve this objective, the RCH interventions have to be adequately funded. Table 6 shows the total budget allocations per Region. Overall, only 6.88% of the total region health financial resources were allocated to RCH. Allocations vary by region with some regions allocated more than 10% of the resources (Mbeya, Kigoma and Mtwara) and other as low as 3.5% (Dar es Salaam). While these allocations are meant to reflect the maternal and child health burden, some regions have allocated very little financial resources to RCH despite having high MMR. For instance, Tabora region is reported to have high MMR (313 in 2008) but has allocated only 3.7% of its health budget to RCH interventions.
Sn. Sources of Funds %
1. Block Grant (PE & OC) 46.5% 2. Basket Funds 14.4% 3. Cost Sharing 1.9% 4. Council Own Source 1.5%
5. Development Grant – (HSDW) (Health sector Development Window)
3.8%
6. Local Govt Development 2.8%
7. Global fund R6/R3/R4/6 2.2%
8. Receipt In Kind 9.3%
9. PLAN TZ 0.04%
10. Joint Rehabilitation Fund 0.6%
11. Others 14.4%
12. Community Health Funds 1.8%
13. National Health Insurance Funds 0.4%
14. Prevention Mother to Child Transmission Program 0.1%
35
Table 6: Total Budget Allocated for RCHS by Region, 2009/10
REGION Total Allocated RCHS budget % RCHS budget over total budget
Mbeya 27,190,363,080 3,986,519,247 14.66% Kigoma 14,504,704,331 1,568,486,335 10.81% Mtwara 13,044,143,501 1,331,206,882 10.21% Morogoro 25,105,784,479 2,423,510,270 9.65% Iringa 22,273,169,929 1,950,922,283 8.76% Ruvuma 13,244,931,998 1,086,225,850 8.20% Rukwa 13,287,609,523 1,051,424,202 7.91% Coast 17,593,851,883 1,285,281,838 7.31% Mwanza 37,741,899,652 2,681,230,016 7.10% Dodoma 26,275,224,390 1,842,498,288 7.01% Singida 18,446,447,307 1,262,970,643 6.85% Shinyanga 33,218,193,635 2,152,609,430 6.48% Kagera 23,830,140,103 1,379,962,926 5.79% Arusha 19,359,527,693 1,085,297,140 5.61% K'njaro 27,799,182,855 1,514,949,625 5.45% Lindi 11,441,985,096 606,502,962 5.30% Manyara 19,241,223,997 815,910,050 4.24% Mara 19,070,890,084 795,133,924 4.17% Tanga 26,737,169,877 1,031,671,126 3.86% Tabora 19,264,946,924 705,147,794 3.66% Dsm 32,308,968,172 1,138,459,357 3.52% Grand total 460,980,358,510 31,695,920,188 6.88%
(iii) Health Status Information on Maternal Mortality Rate (MMR) has also been obtained from the CCHPs (Table 7). According to the data retrieved from the 115 CCHPs, the average MMR was calculated to be 216 by 2008. These figures are suspect and should be interpreted with caution since both the numerator and denominator does not capture all deaths and births that occur outside the facilities..
Table 7: MMRs by Council
S/N Councils with high MMR
MMR ( per 100,000)
Councils with low MMR
MMR ( per 100,000)
1 Ngorongoro DC 730 Karatu DC 33
2 Tabora MC 656 Kyela DC 25
3 Kondoa DC 576 Mbozi DC 19
4 Chamwino DC 529 Mafia DC 8
5 Musoma MC 516 Babati TC 8 6 Iringa MC 514 Ludewa DC 7
7 Mvomero DC 455 Kiteto DC 6
8 Kilosa DC 450 Morogoro DC 6 9 Songea MC 432 Morogoro MC 3.48 10 Ruangwa DC 417 Makete DC 3 11 Mtwara MC 417
Information on Infant Mortality rate (IMR) is also found in CCHPs. Figures 17 show the Councils with high IMRs in 2008.
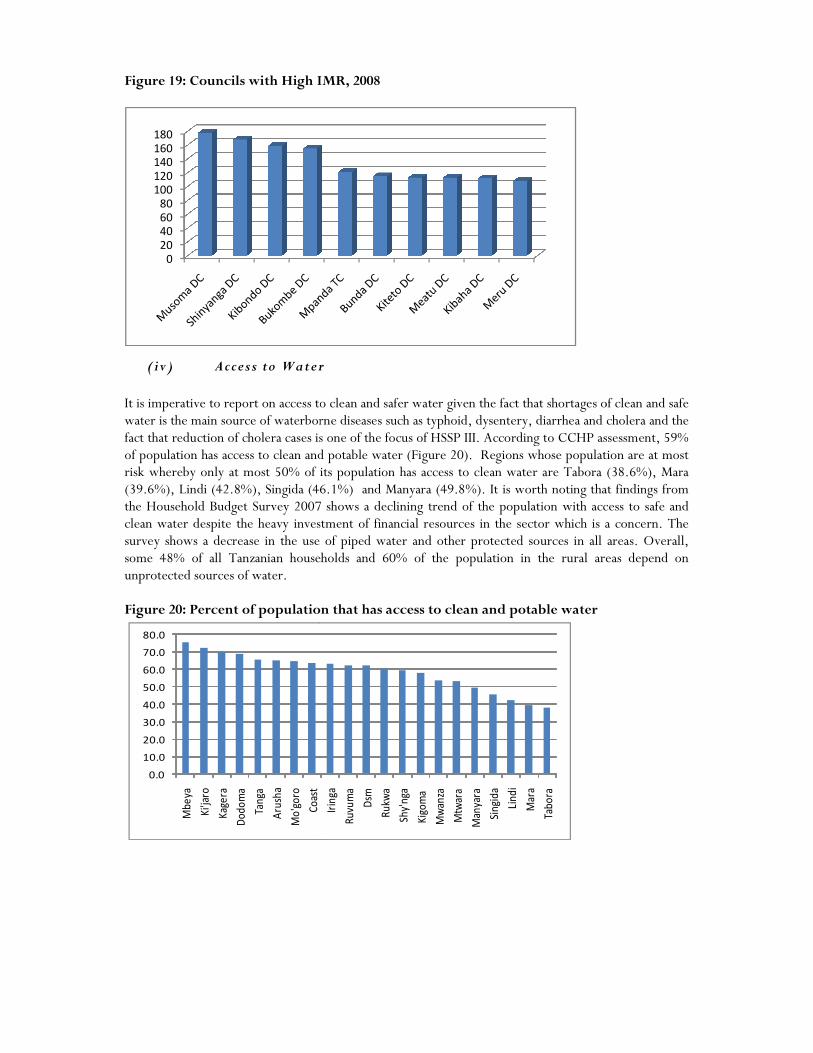
Figure 19: Councils with High IMR
(iv) Access to Water It is imperative to report on access to clean and safer water givewater is the main source of waterborne diseases such as typhoid, dysentery, diarrhea and cholera and the fact that reduction of cholera cases is one of the focus of HSSP III. According to CCHP assessment, 59% of population has access to clean and potable water (Figure risk whereby only at most 50% of its population has access to clean water are Tabora (38.6%), Mara (39.6%), Lindi (42.8%), Singida (46.1%) and Manyara (49.the Household Budget Survey 2007 shows a declining trend of the population with access to safe and clean water despite the heavy investment of financial resources in the sector which is a concern.survey shows a decrease in the use of piped water and other protected sources in all areas. Overall, some 48% of all Tanzanian households and 60% of the population in the rural areas depend on unprotected sources of water. Figure 20: Percent of population that has a
0.0
10.0
20.0
30.0
40.0
50.0
60.0
70.0
80.0
Mb
eya
Ki'j
aro
Kag
era
Do
do
ma
Tan
ga
Aru
sha
Mo
'go
ro
Co
ast
0
20
40
60
80
100
120
140
160
180
igh IMR, 2008
Access to Water
It is imperative to report on access to clean and safer water given the fact that shortages of clean and safe water is the main source of waterborne diseases such as typhoid, dysentery, diarrhea and cholera and the fact that reduction of cholera cases is one of the focus of HSSP III. According to CCHP assessment, 59% population has access to clean and potable water (Figure 20). Regions whose population are at most
risk whereby only at most 50% of its population has access to clean water are Tabora (38.6%), Mara (39.6%), Lindi (42.8%), Singida (46.1%) and Manyara (49.8%). It is worth noting that findings from the Household Budget Survey 2007 shows a declining trend of the population with access to safe and clean water despite the heavy investment of financial resources in the sector which is a concern.
a decrease in the use of piped water and other protected sources in all areas. Overall, some 48% of all Tanzanian households and 60% of the population in the rural areas depend on
: Percent of population that has access to clean and potable water
Irin
ga
Ru
vum
a
Dsm
Ru
kwa
Shy'
nga
Kig
om
a
Mw
anza
Mtw
ara
Man
yara
Sin
gid
a
Lin
di
Mar
a
Tab
ora
n the fact that shortages of clean and safe water is the main source of waterborne diseases such as typhoid, dysentery, diarrhea and cholera and the fact that reduction of cholera cases is one of the focus of HSSP III. According to CCHP assessment, 59%
Regions whose population are at most risk whereby only at most 50% of its population has access to clean water are Tabora (38.6%), Mara
8%). It is worth noting that findings from the Household Budget Survey 2007 shows a declining trend of the population with access to safe and clean water despite the heavy investment of financial resources in the sector which is a concern. The
a decrease in the use of piped water and other protected sources in all areas. Overall, some 48% of all Tanzanian households and 60% of the population in the rural areas depend on

37
Chapter 6: Highlights of the PER Update
The Health Sector Public Expenditure Review (2008 Update) provides a detailed analysis of the level, composition and trends in health sector spending at the central, regional and council levels. The following are the key highlights from the PER 2008.
(i) Allocations and expenditures in health have increased, but the share of health in government budget remains below 15% recommended in Abuja Declaration. The 2008 PER has shown an upward trend of expenditures and allocations of available resources, which is a reflection of the commitment by the government and development partners to increase health spending and to ensure that the expenditures are allocated to support the primary health care approach to health sector development (Table 8). It further indicates that the actual health expenditure grew by 41% in 2005/06, then by 20% in 2006/07 and by 12% in 2007/08. Also, the allocation of budget resources for health grew by 18% in 2007/08 and by 19% in 2008/09. It is worth noting that the budget allocations are lower than the HSSP III predicted annual growth rates of 24% on on-budget allocations. In total, the share of health sector budget in the total government budget has averaged around 11% over the review period, which is well below the 15% recommended in the Abuja Declaration (Figure 22). Table 8: General Health Spending by Financing Sources (in Million TShs)
2004/05 2005/06 2006/07 2007/08 2008/09
Actual expendit
ure
Actual Expenditu
re
Approved
estimates
Actual expendit
ure
Approved
estimates
Actual expendit
ure
Estimates
Government Funds 206,554 296,819 370,991 348,890 413,258 378,113 459,496
Foreign 94,673 129,555 148,880 164,715 202,490 192,959 274,383
Basket 91,777 68,299 99,911 103,204 80,956 80,956 97,629
Non Basket 2,896 61,257 48,969 61,512 121,534 112,003 176,753
Off-Budget2 3,384 3,363 - 2,964 - 5,696 -
Total 304,612 429,738 519,871 516,570 615,748 576,769 733,878
Figure 21: Trend of Nominal and Real Expenditure in health 2004/05-2008/09
2 The off-budget captured here is mainly the Health Services Fund (HSF)
A: Approved Estimates trend
-
100
200
300
400
500
600
700
800
06/07 07/08 08/09NOMINAL REAL
B: Actual Expenditure trend
-
100
200
300
400
500
600
04/05 05/06 06/07 07/08
NOMINAL

(ii) Composition of financing sources for the health sector has remained unchanged, though the share of foreign financing has increased during the review period. The expenditures from the main sources of public spending: government, donors, and user fees have increased over the years, and despite the government remaining the largest source of public spending, external resources by bilateral and multilateral agencies have become significant, accounting for up to 37% of the total expenditures (Figure 22). User fee revenues have also increased reaching well over US$5 million in 2007/08, and despite being small compared with government and donor contributions, user fees constitute an important source of expenditures in the facilities where it is collected and spent. In total, the off-budget financing component (mainly in form of Health Services Fund—HSF) accounts for an average of about 1% of the entire health sector financing. Figure 22: Shares of Government and Foreign Funds in Health Sector Financing
(iii) Per capita health spending is st ill low, and falls s ignificantly short of WHO recommended target of US$ 34 to address health challenges, and is well below the HSSP III projections of US$ 15.75 per capita spending by 2009/10. Per capita health spending is still low, at an average of about TShs 14,215 in nominal terms, while in real terms (2001 constant prices), is still below TShs 10,000 (Table 9). In Dollar terms, the average per capita health spending is about US$ 11.23 over the review period and with health sector claiming about 10-11% of the government budget, reaching the WHO’s estimated per capita spending of US$34 in order to adequately address health challenges, remains an uphill task. Also, the level of spending is still far short of HSSP III projection of achieving US$15.75 per capita spending by 2009/10. Table 9: Per Capita Health Spending
2004/05 2005/06 2006/07 2007/08 2008/09 Actual Actual Approved Actual Approved Actual Estimates NOMINAL (TShs) 8,235 11,308 13,375 13,214 15,368 14,253 17,768 REAL (TSHS) 6,412 8,321 9,177 9,067 10,120 9,386 11,400
NOMINAL USD 7.42 9.49 10.71 10.58 12.18 11.29 13.46 REAL USD 5.78 6.98 7.35 7.26 8.02 7.44 8.64 Deflator 1.28 1.36 1.46 1.46 1.52 1.52 1.56 Exchange Rate 1,109 1,192 1,249 1,249 1,262 1,262 1,320
Population 36,576,738 37,704,872 38,867,802 38,867,802 40,066,599 40,066,599 41,302,370
69% 70% 71% 66% 64% 65% 63%
31% 30% 29% 34% 36% 35% 37%
Actual
expenditure
Actual
Expenditure
Approved
estimates
Actual
expenditure
Approved
estimates
Actual
expenditure
Estimates
Government Funds
Foreign Funds (Basket &Non-Basket)

39
(iv) Budget performance has been satisfactory; but difficultiprocurement and procedures for works and contract management continue to affect the performance of development budget. Generally, budget performance has been good, with actual total expenditures reaching 99% of the approved estimates in 2006/07, but declining to 93% of the estimates for 2007/08. Budget performance was much lower in 2007/08 compared to 2006/07, with recurrent budget performance declining from 98.5% in 2006/07 to 91.2 in 2007/08, while development budget performance slipped down to 95.4% in 2007/08 from 99.7% in 2006/07. While issues related to failure to release funds for budget execution, late disbursement of the funds, and reallocation of the funds to other activities were the major reasons for failure to fully execute the reexecute the development budget is cumbersome procurement procedures (delays in tendering and awarding processes), and failure to get funding from other sources which the disbursement is beyond the capacity of the Ministry of Health and Social Welfare (MoHSW).
(v) The share of development health spending has increased The share of recurrent expenditure in total health expenditure declined from about 80% of actual expenditure in 2004/05 to 55% of thedevelopment expenditure has increased from about 19% of the actual expenditure in 2004/05 to about 36% of the actual expenditure in 2007/08 and about 45% of the estimates in 2008/09. These trecurrent and development budget indicate a significant boom in financing for development projects in the health sector, largely by the Development Partners. Figure 23: Trend of Recurrent Expenditure: 2004/05
(vi) Shares of resources managed centrally (by MoHSW) and locally (by LGAs) have changed slightly, indicating a slow pace in decentralization of health sector f inancing In FY2005/06, about 67% of total health spending was centrally managed (by MoHSW), while Local Government Authorities (LGAs) managed only about 33% of the spending in health (Figure situation improved in FY 2007/08, with the share of health spending managed centrally (by MoHSW) declining to 58%, while the share managed by LGAs increased to about 42%. So
80%72%
76%
19%28%
0%
10%
20%
30%
40%
50%
60%
70%
80%
90%
100%
Actual Actual Approved
2004/05 2005/06
Budget performance has been satisfactory; but difficulties related to procurement and procedures for works and contract management continue to affect the performance of development budget.
Generally, budget performance has been good, with actual total expenditures reaching 99% of the /07, but declining to 93% of the estimates for 2007/08. Budget
performance was much lower in 2007/08 compared to 2006/07, with recurrent budget performance declining from 98.5% in 2006/07 to 91.2 in 2007/08, while development budget performance slipped
n to 95.4% in 2007/08 from 99.7% in 2006/07. While issues related to failure to release funds for budget execution, late disbursement of the funds, and reallocation of the funds to other activities were the major reasons for failure to fully execute the recurrent budget , the major reason for failure to fully execute the development budget is cumbersome procurement procedures (delays in tendering and awarding processes), and failure to get funding from other sources which the disbursement is beyond
city of the Ministry of Health and Social Welfare (MoHSW).
The share of development health spending has increased
The share of recurrent expenditure in total health expenditure declined from about 80% of actual expenditure in 2004/05 to 55% of the estimates in 2008/09 (Figure 23). At the same time, the share of development expenditure has increased from about 19% of the actual expenditure in 2004/05 to about 36% of the actual expenditure in 2007/08 and about 45% of the estimates in 2008/09. These trecurrent and development budget indicate a significant boom in financing for development projects in the health sector, largely by the Development Partners.
: Trend of Recurrent Expenditure: 2004/05 – 2008/09
s managed centrally (by MoHSW) and locally (by LGAs) have changed slightly, indicating a s low pace in decentralization of health
In FY2005/06, about 67% of total health spending was centrally managed (by MoHSW), while Local horities (LGAs) managed only about 33% of the spending in health (Figure
situation improved in FY 2007/08, with the share of health spending managed centrally (by MoHSW) declining to 58%, while the share managed by LGAs increased to about 42%. So far, the share of health
76% 73%
61% 63%55%
24% 26%
39% 36%
45%
Approved Actual Approved Actual Approved
2006/07 2007/08 2008/09
Recurrent Development
es related to procurement and procedures for works and contract management continue to
Generally, budget performance has been good, with actual total expenditures reaching 99% of the /07, but declining to 93% of the estimates for 2007/08. Budget
performance was much lower in 2007/08 compared to 2006/07, with recurrent budget performance declining from 98.5% in 2006/07 to 91.2 in 2007/08, while development budget performance slipped
n to 95.4% in 2007/08 from 99.7% in 2006/07. While issues related to failure to release funds for budget execution, late disbursement of the funds, and reallocation of the funds to other activities were
current budget , the major reason for failure to fully execute the development budget is cumbersome procurement procedures (delays in tendering and awarding processes), and failure to get funding from other sources which the disbursement is beyond
The share of recurrent expenditure in total health expenditure declined from about 80% of actual ). At the same time, the share of
development expenditure has increased from about 19% of the actual expenditure in 2004/05 to about 36% of the actual expenditure in 2007/08 and about 45% of the estimates in 2008/09. These trends in recurrent and development budget indicate a significant boom in financing for development projects in
s managed centrally (by MoHSW) and locally (by LGAs) have changed slightly, indicating a s low pace in decentralization of health
In FY2005/06, about 67% of total health spending was centrally managed (by MoHSW), while Local horities (LGAs) managed only about 33% of the spending in health (Figure 24). The
situation improved in FY 2007/08, with the share of health spending managed centrally (by MoHSW) far, the share of health
45%
Approved
2008/09

sector financing managed centrally has averaged around 60%, with the Councils and Regions managing about 40% of the resources. However, this separation does not take into account expenditures by the MoHSW on drugs and supplies whicrelated financing that is channeled through PMOAuthorities, then the share of locally managed resources could increase. Figure 24: Trend of Distribution of Resources between Central and Local Government
(vii) Complementary health financing is becoming increasingly important in health sector financing, but there is significant amount of unused funds both at the National Health Insurance Fu(HSF). Total receipts for HSF almost doubled between 2006/07 and 2007/08, and about 89% of the receipts were used for health service delivery in 2007/08. NHIF contributions have also grown significantly from TShs 45.5 billion in 2006/07 to TShs 55.5 billion in 2007/08 (Table significant amount of resources are unused both at the NHIF and HSF. This review has found that less than 15% of NHIF annual income is utilized by health facilities. Also,are perceived to be insignificant, the LGA subCharges (OC) allocations in some specific LGAs. But, in total, HSF was approximately 2% of OC allocations to the LGAs in 2006/07, and increased to about 4% of the OC allocations to the LGAs in 2007/08.
62% 67%
38% 33%
0%10%20%30%40%50%60%70%80%90%
100%
Actual Actual Approved
2004/05 2005/06
sector financing managed centrally has averaged around 60%, with the Councils and Regions managing about 40% of the resources. However, this separation does not take into account expenditures by the MoHSW on drugs and supplies which eventually go to the LGAs. Also, if it is assumed that the health related financing that is channeled through PMO-RALG eventually go down to the local Government Authorities, then the share of locally managed resources could increase.
f Distribution of Resources between Central and Local Government
Complementary health f inancing is becoming increasingly important in health sector financing, but there is significant amount of unused funds both at the National Health Insurance Fund (NHIF), and Health Services Fund
Total receipts for HSF almost doubled between 2006/07 and 2007/08, and about 89% of the receipts were used for health service delivery in 2007/08. NHIF contributions have also grown significantly
illion in 2006/07 to TShs 55.5 billion in 2007/08 (Table 10). Despite such increase, significant amount of resources are unused both at the NHIF and HSF. This review has found that less than 15% of NHIF annual income is utilized by health facilities. Also, although cost sharing collections are perceived to be insignificant, the LGA sub-study has found that cost sharing funds exceed Other Charges (OC) allocations in some specific LGAs. But, in total, HSF was approximately 2% of OC
2006/07, and increased to about 4% of the OC allocations to the LGAs in
62% 61% 59% 58% 60%
38% 39% 41% 42% 40%
Approved Actual Approved Actual Estimates
2006/07 2007/08 2008/09
MoHSW
LGAs
sector financing managed centrally has averaged around 60%, with the Councils and Regions managing about 40% of the resources. However, this separation does not take into account expenditures by the
h eventually go to the LGAs. Also, if it is assumed that the health RALG eventually go down to the local Government
f Distribution of Resources between Central and Local Government
Complementary health f inancing is becoming increasingly important in health sector financing, but there is significant amount of unused funds both
nd (NHIF), and Health Services Fund
Total receipts for HSF almost doubled between 2006/07 and 2007/08, and about 89% of the receipts were used for health service delivery in 2007/08. NHIF contributions have also grown significantly
). Despite such increase, significant amount of resources are unused both at the NHIF and HSF. This review has found that less
although cost sharing collections study has found that cost sharing funds exceed Other
Charges (OC) allocations in some specific LGAs. But, in total, HSF was approximately 2% of OC 2006/07, and increased to about 4% of the OC allocations to the LGAs in
60%
40%
Estimates
2008/09

41
Table10: NHIF Income and Reimbursements 2004/5 to 2007/8)3
2004/2005 2005/2006 2006/2007 2007/08
Contributions (Million TZS) 24,670 31,733 45,516 55,472 Total income (incl. Income from investments and others) (Million TZS)
28,610 39,142 56,884 72,168
Claims lodged (Million TZS) 4,900 5,400 9,600 10,800 Percentage of claims lodged against total income of NHIF
17.13% 13.80% 16.88% 14.97%
Reimbursements paid (Million TZS) 4,100 4,900 8,200 10,200 Reimbursement rate 83.67% 90.74% 85.42% 94.44% Percentage of funds paid out to health services against total income of NHIF
14.33% 12.52% 14.42% 14.13%
3 See URT (2009), Report on Training of Health Facilities in Lake Zone on Improvement of NHIF Claiming and Financing Management, Ministry of Health and Social Welfare, Health Sector Program Support.

Chapter 7: Human Resource Status in the Health Sector Summary It has been quite a challenge to write this chapter as data to summarize information on human resources for health for the period 2008/09 from relevant sources was not provided despite several attempts. The previous report 2007/08 providedemployees of MOHSW, its sub-vented institutions, and health departments of regions and districts2009, the President’s Office Public Service Management (POPSM) conducted a census of all health workers in the sector. Therefore,monitoring progress of four HRH indicators a This chapter provides the status of human resource for health indicator as defined in thedocument. Four HRH indicators were identified for monitoring progress, namely
� Number of Medical Officers and Assistant Medical Officers per 10,000 population (by region)� Number of Nurse-Midwives per 10,000 population (by region)� Pharmacists and pharmacy-technicians per 10,000 population (by region)� Number of training institutions with full NACTE accreditation
Data for first three indicators comes primarily from the the National Accreditation of (NACTEdifferent stages of the process instead of showing only institutions which have full NACTE accreditation as this is more informative. Figure 25: Number of Medical Officers and Assistant Medi
Source: PMORALG 2008 Figure 25 shows the number of medical officers and medical assistants per 10,000 population by region. The national average is 0.36. Kilimanjaro region has almost double the ratio (0,91) and AMOs compared to the second highest region Dar es Salaam (0.54) and almost six and half times compared to the lowest region which is Mara (0.14). More than national average of 0.36 MO and AMO per
0.9
1
0.5
4
0.5
2
0.4
7
0.4
6
0.4
6
0.4
6
0.00
0.10
0.20
0.30
0.40
0.50
0.60
0.70
0.80
0.90
1.00
Kil
ima
nja
ro
Da
r e
s S
ala
am
Pw
an
i
Ru
vu
ma
Aru
sha
Mw
an
za
Ta
ng
a
Ra
tio
pe
r 1
0,0
00
: Human Resource Status in the Health Sector
een quite a challenge to write this chapter as data to summarize information on human resources for health for the period 2008/09 from relevant sources was not provided despite several attempts. The
provided an analysis of HRH using the public service payroll for health vented institutions, and health departments of regions and districts
2009, the President’s Office Public Service Management (POPSM) conducted a census of all health refore, current report 2008/09 aimed at establishing a baseline for
monitoring progress of four HRH indicators as agreed in the Health Sector Strategic Plan 3.
the status of human resource for health indicator as defined in theindicators were identified for monitoring progress, namely
Number of Medical Officers and Assistant Medical Officers per 10,000 population (by region)Midwives per 10,000 population (by region)
technicians per 10,000 population (by region) Number of training institutions with full NACTE accreditation
Data for first three indicators comes primarily from the MOH&SW for the last indicator is derived fromNACTE). Accreditation of institutions is a process. We have presented
different stages of the process instead of showing only institutions which have full NACTE accreditation
: Number of Medical Officers and Assistant Medical Officers per 10,000 Population by Region
the number of medical officers and medical assistants per 10,000 population by region. Kilimanjaro region has almost double the ratio (0,91) of number of MOs
and AMOs compared to the second highest region Dar es Salaam (0.54) and almost six and half times compared to the lowest region which is Mara (0.14). More than (12) 50% of the regions are below the
average of 0.36 MO and AMO per 10,000 population.
0.4
6
0.4
0
0.3
4
0.2
9
0.2
9
0.2
9
0.2
7
0.2
6
0.2
6
0.2
4
0.2
3
0.2
0
0.1
8
0.1
4
0.3
6
Sin
gid
a
Ma
ny
ara
Mb
ey
a
Mtw
ara
Mo
rog
oro
Irin
ga
Ka
ge
ra
Do
do
ma
Lin
di
Ta
bo
ra
Ru
kw
a
Kig
om
a
Sh
iny
an
ga
Ma
ra
Na
tio
na
l
een quite a challenge to write this chapter as data to summarize information on human resources for health for the period 2008/09 from relevant sources was not provided despite several attempts. The
ic service payroll for health vented institutions, and health departments of regions and districts. In
2009, the President’s Office Public Service Management (POPSM) conducted a census of all health aimed at establishing a baseline for
agreed in the Health Sector Strategic Plan 3.
the status of human resource for health indicator as defined in the HSSP III
Number of Medical Officers and Assistant Medical Officers per 10,000 population (by region)
for the last indicator is derived from . Accreditation of institutions is a process. We have presented
different stages of the process instead of showing only institutions which have full NACTE accreditation
cal Officers per 10,000 Population by Region
the number of medical officers and medical assistants per 10,000 population by region. of number of MOs
and AMOs compared to the second highest region Dar es Salaam (0.54) and almost six and half times 50% of the regions are below the
0.3
6N
ati
on
al

43
Figure 26: Number of Nurse-Midwives per 10,000 Population by Region
Source: PMORALG 2008
Figure 26 shows the number of nurseis 3.1 nurse-midwives per 10,000 populationurse-midwives compared to the other regions. This wasthan half (52%) of the regions were and Mara had less than two midwives per 10 Figure 27: Number of Pharmacist and Pharmacy Technicians per 10,000 Population by Region
Source: PMORALG 2008
Figure 27 show the number of pharmacist and pharmacy technicians per 10,000 populatiOverall, there was less than one (0.06) pharmacist or pharmacy technician per 10,000 population
7.6
4.5
4.4
4.3
4.2
3.7
3.6
0.0
1.0
2.0
3.0
4.0
5.0
6.0
7.0
8.0
9.0
10.0
Kil
ima
nja
ro
Sin
gid
a
Ma
nya
ra
Pw
an
i
Ru
vu
ma
Irin
ga
Aru
sha
Ra
tio
pe
r 1
0,0
00
po
pu
lati
on
0.1
8
0.1
1
0.1
0
0.0
9
0.0
9
0.0
8
-
0.05
0.10
0.15
0.20
0.25
0.30
0.35
0.40
0.45
0.50
Kil
ima
nja
ro
Ma
ny
ara
Aru
sha
Pw
an
i
Mb
ey
a
Ka
ge
ra
Nu
mb
er
pe
r 1
0,0
00
po
pu
lati
on
Midwives per 10,000 Population by Region
shows the number of nurse-midwives per 10,000 population by region. The national average midwives per 10,000 population. Kilimanjaro region had the highest number (7.6) of
midwives compared to the other regions. This was more than double the national averageof the regions were below the national average for this indicator. Shinyanga, Kigoma
idwives per 10,000 population.
: Number of Pharmacist and Pharmacy Technicians per 10,000 Population by Region
show the number of pharmacist and pharmacy technicians per 10,000 populatiOverall, there was less than one (0.06) pharmacist or pharmacy technician per 10,000 population
3.6
3.4
3.3
3.1
2.9
2.8
2.7
2.6
2.5
2.5
2.4
2.3
1.8
1.8
1.5
Aru
sha
Mw
an
za
Mtw
ara
Mb
ey
a
Da
r e
s S
ala
am
Lin
di
Ta
ng
a
Ka
ge
ra
Mo
rog
oro
Do
do
ma
Ta
bo
ra
Ru
kw
a
Ma
ra
Kig
om
a
Sh
iny
an
ga
0.0
8
0.0
6
0.0
6
0.0
5
0.0
5
0.0
5
0.0
5
0.0
5
0.0
4
0.0
4
0.0
4
0.0
4
0.0
3
0.0
2
0.0
2
Ka
ge
ra
Mw
an
za
Irin
ga
Mo
rog
oro
Kig
om
a
Mtw
ara
Ta
bo
ra
Ru
vu
ma
Da
r e
s S
ala
am
Sh
inya
ng
a
Ma
ra
Sin
gid
a
Ta
ng
a
Do
do
ma
Lin
di
midwives per 10,000 population by region. The national average had the highest number (7.6) of
more than double the national average. More the national average for this indicator. Shinyanga, Kigoma
show the number of pharmacist and pharmacy technicians per 10,000 population by region. Overall, there was less than one (0.06) pharmacist or pharmacy technician per 10,000 population.
3.1
Na
tio
na
l
0.0
1 0
.06
Ru
kw
a
Na
tio
na
l
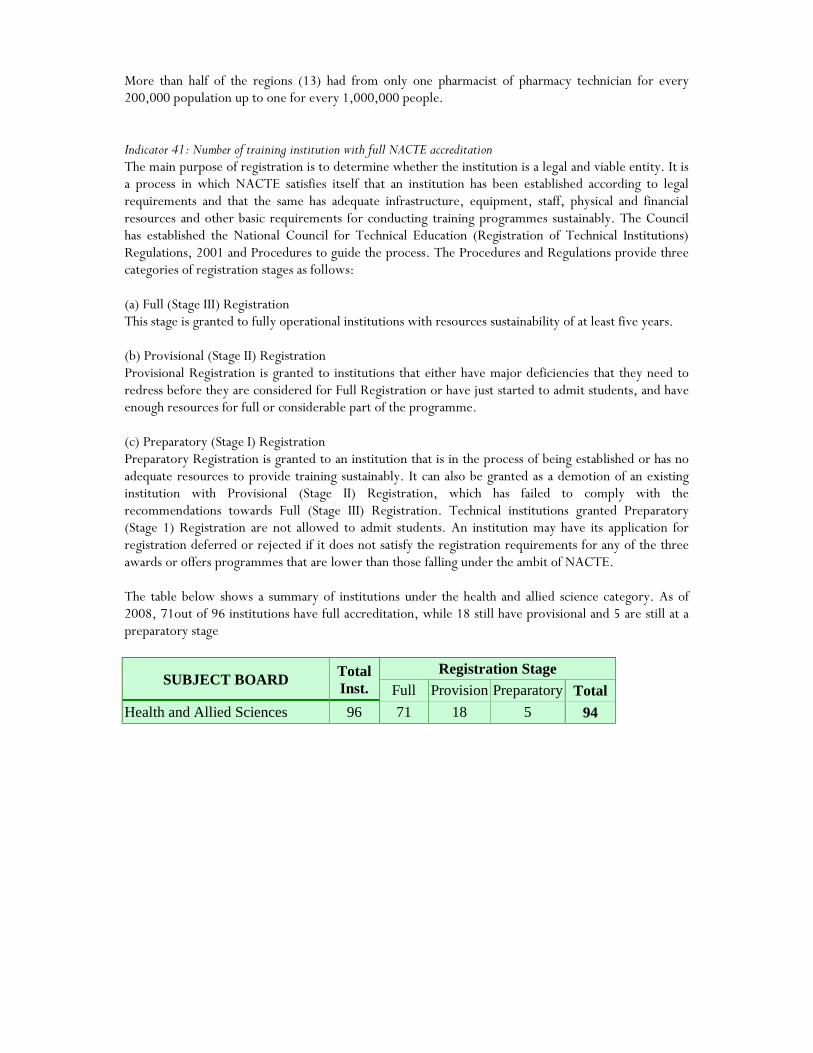
More than half of the regions (13) had from only one pharmacist of pharmacy technician for every 200,000 population up to one for every 1,000,000 people. Indicator 41: Number of training institution with full NACTE accreditation The main purpose of registration is to determine whether the institution is a legal and viable entity. It is a process in which NACTE satisfies itself that an institution has been established according to legal requirements and that the same has adequate infrastructure, equipment, staff, physical and financial resources and other basic requirements for conducting training programmes sustainably. The Council has established the National Council for Technical Education (Registration of Technical Institutions) Regulations, 2001 and Procedures to guide the process. The Procedures and Regulations provide three categories of registration stages as follows: (a) Full (Stage III) Registration This stage is granted to fully operational institutions with resources sustainability of at least five years. (b) Provisional (Stage II) Registration Provisional Registration is granted to institutions that either have major deficiencies that they need to redress before they are considered for Full Registration or have just started to admit students, and have enough resources for full or considerable part of the programme. (c) Preparatory (Stage I) Registration Preparatory Registration is granted to an institution that is in the process of being established or has no adequate resources to provide training sustainably. It can also be granted as a demotion of an existing institution with Provisional (Stage II) Registration, which has failed to comply with the recommendations towards Full (Stage III) Registration. Technical institutions granted Preparatory (Stage 1) Registration are not allowed to admit students. An institution may have its application for registration deferred or rejected if it does not satisfy the registration requirements for any of the three awards or offers programmes that are lower than those falling under the ambit of NACTE. The table below shows a summary of institutions under the health and allied science category. As of 2008, 71out of 96 institutions have full accreditation, while 18 still have provisional and 5 are still at a preparatory stage
SUBJECT BOARD Total Inst.
Registration Stage
Full Provision Preparatory Total Health and Allied Sciences 96 71 18 5 94

45
Chapter 8: Conclusion, Issues and Challenges Key messages on health sector performance in the year 2008/2009
1. Health status Tanzania has achieved spectacular gains in Child Survival with significant decline in Under Five Mortality Rate. However high neonatal deaths still remain a major challenge accounting for 30% of all under five deaths in Tanzania. Maternal mortality ratios remain very high; however information from health facilities indicates a declining trend. This may be a proxy indicator of overall decline in maternal mortality which will be investigated further in the next Demographic and Health Survey beginning in October, 2009
2. Service delivery TB treatment success rate have improved (88%) and so has DPT- HB3 immunization rates which increased to 86% in 2008 compared to 83% in 2007.
3. Health system Health budget as a proportion of the national budget has increased but still remains below the Abuja Declaration of committing 15% of the national budget for health. Per capita spending on health is still low and falls significantly short of WHO recommended target of US $ 34 and well below the HSSP III projections of US $ 15.75 per capita spending on health by 2010.
4. Milestones Implementation of the agreed Milestones has improved significantly compared to last year. During 2008/2009, the majority of the Milestones (10 out of the total of 14), were fully achieved, with the remaining 4 being partially implemented. This is a great credit to the MOHSW and its partners, particularly when taking into account the need to have working partnerships for most of the Milestones to be achieved, in time for the next Joint Annual Health Sector Review.
5. Medium Term Expenditure Framework (MTEF) A particular concern on MTEF execution is the average performance of the development budget (52%) which could be partly explained by cumbersome procurement procedures, late disbursement of funds and at times no release of development funds.
6. Human resources
Analyses from the 2008 PMORALG data show the staffing situation of skilled human resources remains glaringly deficient. Indicators for the number medical doctors and AMOs, nurse midwives, pharmacists and pharmacy technicians per 10,000 population are still below acceptable levels. It should be noted that the energy and effort to get reliable data for Human Resources for Health from POPSM which we believe is the source was huge. However, we were not successful and hence had to use data from PMORALG which does not give a full picture of HRH situation in the sector. In the future annual performance evaluations of the sector, we

urge the Ministry to be more forthcoming in providing reliable sources of data in order to conduct an objective assessment of the sector for the benefit of the people of Tanzania
7. Comprehensive Council Health Plan performance The Block from the government remains the major source of funding of CCHPs.


Annex 1: HSSP III Indicators
s/n Indicator Numerator Denominator Baseline 2008 Target by 2010 Target by 2015 Data Source Type Frequency Health Status 1 Neonatal mortality rate (per 1,000
live births) Number of children who die within a first month of life
Number of live births in a year
29per 1000 live births (2007/08 (THIMI)
35 per 1000 live births4
19 per 1000 live births5
TDHS, THMIS Population census
Impact TTDHS and THMIS intervals
2 Infant mortality rate (per 1,000 live births)
Number of children who die before reaching one year of age
Number of live births in a year
58 per 1000 live births (2007/08 THMIS )
41 per 1000 live births6
X TDHS, THMIS , Population Census
Impact TDHS interval
3 Under-five mortality rate (per 1,000 live births)
Number of children who die before reaching five years of age
Number of live births within five years
94 per 1000 live births (TDHS 2004/05)
79 per 10003 54 per 1000 live births2
TDHS, HMIS, Population census
Impact TDHS interval
4 Proportion of under-fives with underweight (weight for age)
Number of children under five years who were underweight
Number of under five children during the survey
22% (TDHS 2004/05) 25%1
14%2
TDHS, HMIS
Impact TDHS interval
5 Proportion of under-fives stunted (height for age)
Number of children under five years who were stunted
Number of under five children during the survey
38% (TDHS 2004/05) X 22%2 TDHS Impact TDHS interval
6 Maternal mortality ratio (per 100,000 live births)-
Number of maternal deaths Number of women years of exposure (15 – 49)
578/100,000 live births TDHS 2004/5
265/100,0001 193/100,0002
TDHS Impact TDHS interval
7 Life expectancy at birth Life Expectancy module. Life Expectancy module. Female 52 Male 51 (Census 2005)
X
Female 62, Male 59, by 2025.4
Census Impact Census Interval
8 Proportional of pregnant women who are under 20 years
Number of women under 20 who became pregnant in a years specified by the survey
Total number of women under 20 years as specified by the survey
54% (TDHS 2004/05)
39.2%1
X
HMIS/TDHS
Process Annual/ TDHS interval
9 Total fertility rate of women 15-49 years
Total of fertility at a given point in time Total number of women in the reproductive age group 15 – 49 years
5.7 TDHS 2004/05
5.4 7
5.24
TDHS Impact TDHS interval
4 Reproductive and Child Health Strategic Plan 2005-2010. 5 National Road Map Strategic Plan To Accelerate Reduction of Maternal, Newborn and Child Deaths in Tanzania 2008 – 2015. 6 National Road Map Strategic Plan To Accelerate Reduction of Maternal, Newborn and Child Deaths in Tanzania 2006 – 2010 7 Tanzania Population Projection, 2003 – 2025.

1
s/n Indicator Numerator Denominator Baseline 2008 Target by 2010 Target by 2015 Data Source Type Frequency 10 HIV Prevalence Among 15-24 year
old pregnant women tested Number of pregnant women aged 15 – 24 years who were tested to be HIV positive
Total number of pregnant women who were tested in the age group 15 – 24 years during the survey period
6.8% ANC surveillance 2005/06
8.5% by 20108
X
TDHS
Impact Every two years
11 HIV Prevalence Among 15-24 year old population male/female
Number of people aged 15 – 24 years who were tested to be HIV positive
Total population in the age group 15 – 24 years who were tested during the survey period
3.6 Female 1.1 Male (THMIS 2007/08)
X
X
THMIS Impact THMIS interval
12 HIV prevalence among 15 - 49 years old population male/female
Number of people aged 15 – 49 years who were tested to be HIV positive
Total population in the age group 15 – 49 years who were tested during the survey period
Female 6.8% Male 4.7% All 5.8% (THMIS 2007/08)
X
X
THMIS Impact THMIS interval
Service delivery General 13 Outpatient attendance per capita Total number of OPD attendance in a year Total population in a year 0.68 (Health Indicator
Profile 2007/08)
X X
HMIS Output Annual
Vaccinations 14 Proportion of children under one
vaccinated against measles Total number of children under one year vaccinated against measles
Total number of children under one year in a year
92% (HMIS 2007) 90%1
90% in 90% of the districts2
HMIS TDHS
Outcome
Annual TDHS interval
15 Proportion of children under one vaccinated 3 times against DPT –Hb3
Total number of children under one year vaccinated 3 times against DPT - Hb
Total number of children under one year in a year
91% (HMIS 2007) 90%1
90% in 90% of the districts2
HMIS - EPI report 2007
Outcome
Annual TDHS interval
16 Proportion of children under 5 receiving vitamin A twice per year
Number of children under 5 years who received vitamin A twice
Total number of children under 5 years in a year
95% (HMIS 2007) 80%1
90%2 HMIS TDHS
Outcome
Annual TDHS interval
17 Proportion of women receiving at least 2nd doses of TT vaccination
Number of pregnant women who has received at least 2 doses of TT vaccination during pregnancy
Total number of pregnant women
85 % (HMIS 2007) 90% 9
90% in 90% of the districts6
HMIS TDHS
Outcome
Annual TDHS interval
Reproductive Health 18 Proportion of pregnant women
start ANC before 16 weeks of gestation age
Number of pregnant women who start ANC before 16 weeks of gestation age
Total number pregnant women
14% (TDHS 2004/05) 60%1
X
HMIS TDHS Process Annual TDHS interval
19 Proportion of pregnant women attending ANC at least 4 times during pregnancy
Number of pregnant women attending ANC al least 4 times during pregnancy
Total number of pregnant women
64% (TDHS 2004/05)
X
90%2
HMIS
Outcome
Annual TDHS interval
8 WHO Projected numbers from EPP 9 Plan of Action for Maternal and Neonatal Tetanus Elimination in Tanzania 2008/09
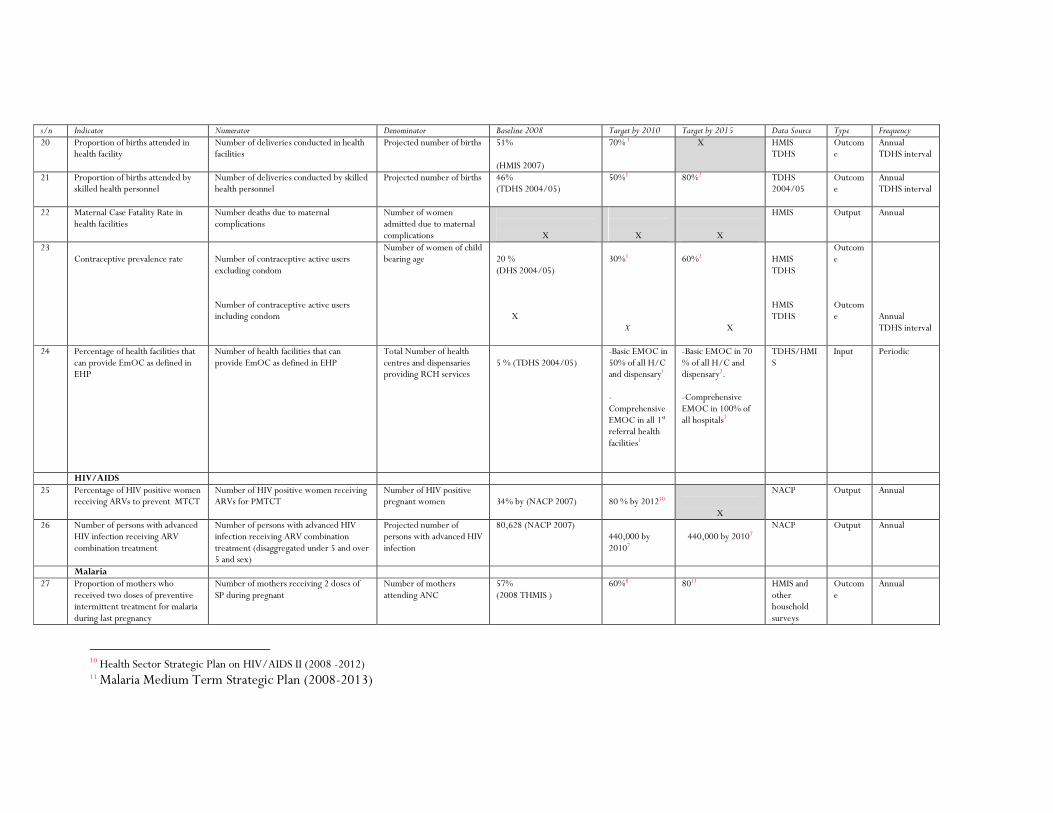
s/n Indicator Numerator Denominator Baseline 2008 Target by 2010 Target by 2015 Data Source Type Frequency 20 Proportion of births attended in
health facility Number of deliveries conducted in health facilities
Projected number of births 51% (HMIS 2007)
70% 1
X HMIS TDHS
Outcome
Annual TDHS interval
21 Proportion of births attended by skilled health personnel
Number of deliveries conducted by skilled health personnel
Projected number of births 46% (TDHS 2004/05)
50%1
80%2
TDHS 2004/05
Outcome
Annual TDHS interval
22 Maternal Case Fatality Rate in health facilities
Number deaths due to maternal complications
Number of women admitted due to maternal complications
X
X
X
HMIS Output Annual
23 Contraceptive prevalence rate
Number of contraceptive active users excluding condom Number of contraceptive active users including condom
Number of women of child bearing age
20 % (DHS 2004/05) X
30%1 X
60%2
X
HMIS TDHS HMIS TDHS
Outcome Outcome
Annual TDHS interval
24 Percentage of health facilities that can provide EmOC as defined in EHP
Number of health facilities that can provide EmOC as defined in EHP
Total Number of health centres and dispensaries providing RCH services
5 % (TDHS 2004/05)
-Basic EMOC in 50% of all H/C and dispensary1 -Comprehensive EMOC in all 1st referral health facilities1
-Basic EMOC in 70 % of all H/C and dispensary2. -Comprehensive EMOC in 100% of all hospitals2
TDHS/HMIS
Input Periodic
HIV/AIDS 25 Percentage of HIV positive women
receiving ARVs to prevent MTCT Number of HIV positive women receiving ARVs for PMTCT
Number of HIV positive pregnant women
34% by (NACP 2007)
80 % by 201210
X
NACP Output Annual
26 Number of persons with advanced HIV infection receiving ARV combination treatment
Number of persons with advanced HIV infection receiving ARV combination treatment (disaggregated under 5 and over 5 and sex)
Projected number of persons with advanced HIV infection
80,628 (NACP 2007) 440,000 by 20107
440,000 by 20107
NACP Output Annual
Malaria 27 Proportion of mothers who
received two doses of preventive intermittent treatment for malaria during last pregnancy
Number of mothers receiving 2 doses of SP during pregnant
Number of mothers attending ANC
57% (2008 THMIS )
60%8
8011 HMIS and other household surveys
Outcome
Annual
10 Health Sector Strategic Plan on HIV/AIDS II (2008 -2012) 11 Malaria Medium Term Strategic Plan (2008-2013)

3
s/n Indicator Numerator Denominator Baseline 2008 Target by 2010 Target by 2015 Data Source Type Frequency 28 Proportion of vulnerable groups
(pregnant women 15-49 yrs of age, children under 5) sleeping under an ITN the previous night
Number of children <5 or pregnant women 15-49 yrs sleeping under ITN night before survey
Number of children <5 or pregnant women 15-49 yrs who reside in surveyed households
<5 yrs: 26% 2008 THMIS ) PW: 27% (2008 THMIS )
608 PW 60%1
PW 80%2 80%8
MIS and other household surveys
Outcome
Annual
29 Proportion of laboratory confirmed malaria cases among all OPD visits (disaggregated under 5 and over 5)
Number of positive by microscopy or RDT
Number of OPD visits Pending 2008 data under analysis
Pending X HMIS/Sentinel surveillance
Impact Annual
30 Prevalence of Malaria parasitemia (under 5 years)
# children positive by microscopy # children tested by microscopy
18% (2008 THMIS )
10% 8 5%8 MIS and other household surveys
Impact Biannual
Tuberculosis and Leprosy 31
TB Notification rate per 100,000 population
Number of tuberculosis cases diagnosed
Total population
163/100,000 (TB &LP2006)
70% 12 70%9 NTLCP Output Annual
32 Percent of Treatment success
Number of tuberculosis cases diagnosed
Number of patients who successfully completed treatment
84.7% (TB&LP 2006) 85%9
85%9
33 Proportion of Leprosy cases diagnosed and successfully completed treatment
Number of Leprosy cases diagnosed and successfully treated
Number of notified leprosy cases
PB 97.2% MB 91.7%
X X NTLCP 2006 and 2005 report
output Annual
Infectious and non-communicable diseases
34 Incidence of cholera cases per 100,000 people
Number of cholera cases in a year Total population at risk 3,284 (HMIS 2005) Reduced by half by 2010
X HMIS Outcome
Annual
35 Proportion of treated cases of cholera who died
Total number of treated cases of cholera who died
Total number of treated cholera cases
X X X HMIS Output Annual
12 World Health Assembly 2000
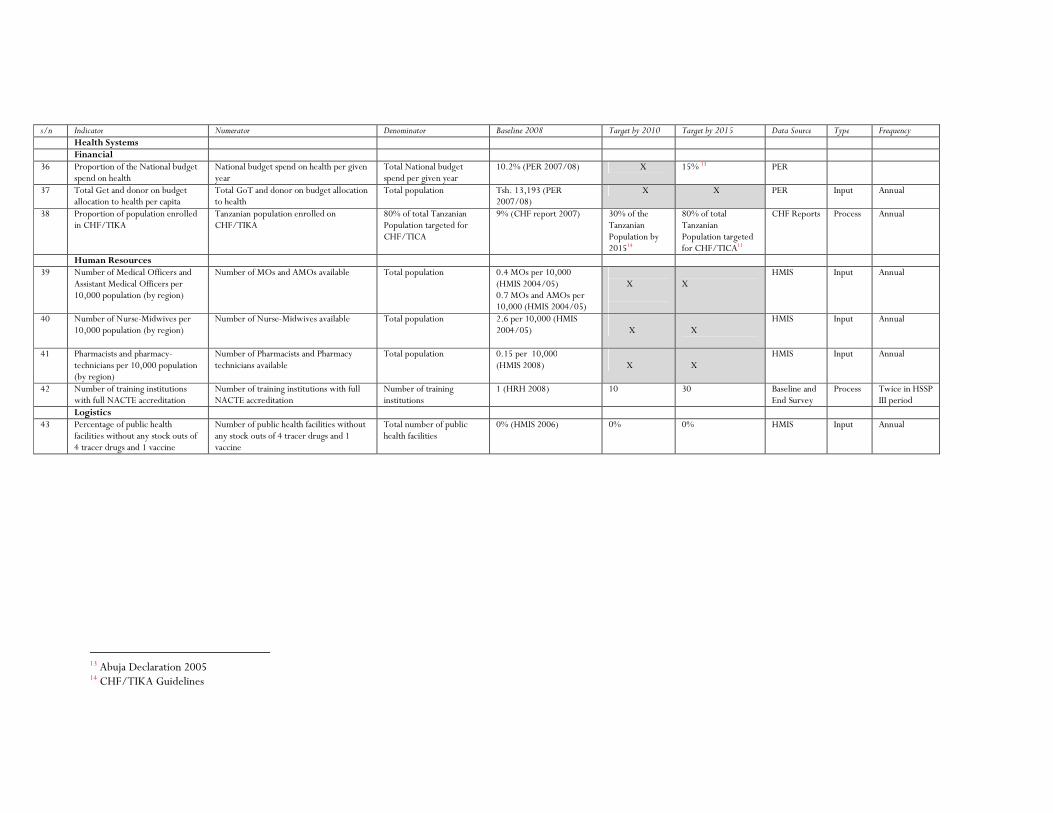
s/n Indicator Numerator Denominator Baseline 2008 Target by 2010 Target by 2015 Data Source Type Frequency Health Systems Financial 36 Proportion of the National budget
spend on health National budget spend on health per given year
Total National budget spend per given year
10.2% (PER 2007/08) X 15% 13 PER
37 Total Get and donor on budget allocation to health per capita
Total GoT and donor on budget allocation to health
Total population Tsh. 13,193 (PER 2007/08)
X X PER Input Annual
38 Proportion of population enrolled in CHF/TIKA
Tanzanian population enrolled on CHF/TIKA
80% of total Tanzanian Population targeted for CHF/TICA
9% (CHF report 2007) 30% of the Tanzanian Population by 201514
80% of total Tanzanian Population targeted for CHF/TICA11
CHF Reports Process Annual
Human Resources 39 Number of Medical Officers and
Assistant Medical Officers per 10,000 population (by region)
Number of MOs and AMOs available Total population 0.4 MOs per 10,000 (HMIS 2004/05) 0.7 MOs and AMOs per 10,000 (HMIS 2004/05)
X
X
HMIS Input Annual
40 Number of Nurse-Midwives per 10,000 population (by region)
Number of Nurse-Midwives available Total population 2.6 per 10,000 (HMIS 2004/05)
X
X
HMIS Input Annual
41 Pharmacists and pharmacy-technicians per 10,000 population (by region)
Number of Pharmacists and Pharmacy technicians available
Total population 0.15 per 10,000 (HMIS 2008)
X
X
HMIS Input Annual
42 Number of training institutions with full NACTE accreditation
Number of training institutions with full NACTE accreditation
Number of training institutions
1 (HRH 2008) 10 30 Baseline and End Survey
Process Twice in HSSP III period
Logistics 43 Percentage of public health
facilities without any stock outs of 4 tracer drugs and 1 vaccine
Number of public health facilities without any stock outs of 4 tracer drugs and 1 vaccine
Total number of public health facilities
0% (HMIS 2006) 0% 0% HMIS Input Annual
13 Abuja Declaration 2005 14 CHF/TIKA Guidelines