main points traumatic effect of school shootings
TRANSCRIPT

May 16, 2018
Dewey Cornell, Ph.D. 1
School Climate and Safety
School Climate and Safety
Dewey Cornell, Ph.D.Curry School of Education
University of Virginia
434-924-8929Email: [email protected]
Website: youthviolence.edschool.virginia.edu
Dewey G. Cornell, Ph. D.• Professor of Education in the Curry
School of Education at the University of Virginia.
• Director of the UVa Youth Violence Project and faculty associate of the Institute of Law, Psychiatry, and Public Policy.
• Trained as forensic clinical psychologist
• Lead author of Authoritative School Climate Survey
• Developed Virginia Student Threat Assessment Guidelines
Main Points 1. School violence is a small part of the larger
problem of gun violence. Schools are safer than the public perceives.
2. The fear of school violence has stimulated harmful consequences in school discipline and security.
3. We need a multi-tiered approach to school violence prevention, including:
• Safe and supportive school climate
• School threat assessment
Traumatic Effect of School Shootings
School shootings are so traumatic that they convince everyone that we extensive schools are unsafe and require extensive security measures.
We need both recovery from trauma and a factual analysis of the best way to prevent more shootings.

May 16, 2018
Dewey Cornell, Ph.D. 2
School Climate and Safety
Annual Gun Toll- 33,000 deaths- 67,000 injuries100,000 total
275 Shootings per day
APA report is available at http://www.apa.org/pubs/info/reports/gun-violence-prevention.aspxShooting deaths from: National Vital Statistics http://webappa.cdc.gov/sasweb/ncipc/dataRestriction_inj.htmlShooting injuries from: http://webappa.cdc.gov/sasweb/ncipc/nfirates2001.html
5 yrs x 100,000 =
500,000 outside of schools
For every shooting in a school, there are 1,600+ outside of
schools
If schools were impregnable, it would only stop .06% of
shootings
Less than 1 tenth of 1 percent
The real problem is gun violence,
not school violence.
March for Our Lives
Youth from across the country emphasize the gun violence they experienced both in and out of school.

May 16, 2018
Dewey Cornell, Ph.D. 3
School Climate and Safety
2150
1965
1651
1478
1338 1354 1361 1379 1365
1479
1661 1641
15051426
1303
1143 1127
1014 1002
1110
0
500
1000
1500
2000
2500
1996 1997 1998 1999 2000 2001 2002 2003 2004 2005 2006 2007 2008 2009 2010 2011 2012 2013 2014 2015
Homicides of School‐Aged Youth
Sources: Kaplan, Jacob. Uniform Crime Reporting Program Data: Supplementary Homicide Reports, 1976‐2015. Ann Arbor, MI: Inter‐university Consortium for Political and Social Research [distributor], 2017‐06‐01. https://doi.org/10.3886/E100699V1. Data on 22 homicides per year in schools based on years 1994‐95 to 2013‐14 in Zhang, A., Wang, K., Zhang, J., & Oudekerk, B. A. (2017). Indicators of School Crime and Safety: 2016. NCES 2017‐064/NCJ 250650. National Center for Education Statistics. https://nces.ed.gov/pubs2017/2017064.pdf
Average of 22 homicides per year in schools Average of 1,480 homicides outside of schools Homicides outside of school are 67x more likely
9847
4455
1209
629
533
492
288
211
49
0 2000 4000 6000 8000 10000 12000
Residence
Street
Parking lot/garage
Outdoors
Restaurant/bar
Store/gas station
Public building/business
Hotel/motel
School
2005‐2010 Homicides in 37 States
Restaurants are 10x more dangerous than schools.
Homes are 200x more dangerous than schools.
Source: FBI National Incident-Based Reporting System (NIBRS) database. Selected locations. School includes colleges. See Nekvasil & Cornell (2015) Psychology of Violence, 5, 236-245.
Why the Fear of School Violence Matters
http://www.bloomberg.com/news/articles/2013-11-14/schools-boosting-security-spending-after-newtown-massacreHigh Security Military Entrances
(DeAngelis, Brent, & Ianni, 2011)
School security measures are expensive and deprive schools of resources that could be allocated to preventive measures such as anti-bullying programs and counseling services.

May 16, 2018
Dewey Cornell, Ph.D. 4
School Climate and Safety
The Expansion of Zero Tolerance
From No Guns to• No Toy Guns• No Nail clippers• No Plastic utensils• No Finger-pointing• No Jokes• No Drawings• No Rubber band
shootingNo accidental violations
3.3 Million Suspensions Per Year Fuel the School to Prison Pipeline
Latest available data April 2018https://ocrdata.ed.gov/StateNationalEstimations/Estimations_2013_14
We should prevent shootings rather than
simply prepare for them.
Prevention means“to keep something from
happening”
Crisis response is not prevention.
A crisis occurs when prevention has failed.
May 16, 2018
Dewey Cornell, Ph.D. 5
School Climate and Safety
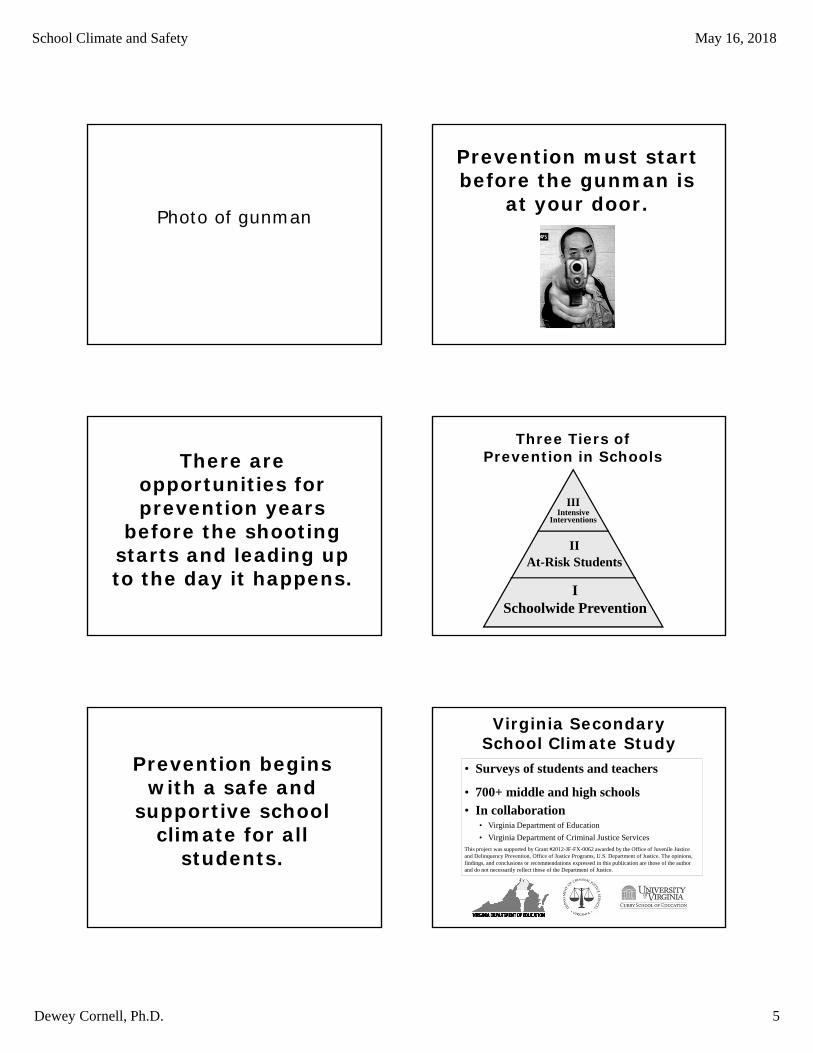
Photo of gunman
Prevention must start before the gunman is
at your door.
There are opportunities for prevention years
before the shooting starts and leading up to the day it happens.
IIIIntensive
Interventions
IIAt-Risk Students
ISchoolwide Prevention
Three Tiers of Prevention in Schools
Prevention begins with a safe and
supportive school climate for all
students.
Virginia Secondary School Climate Study
• Surveys of students and teachers
• 700+ middle and high schools
• In collaboration• Virginia Department of Education
• Virginia Department of Criminal Justice ServicesThis project was supported by Grant #2012-JF-FX-0062 awarded by the Office of Juvenile Justice and Delinquency Prevention, Office of Justice Programs, U.S. Department of Justice. The opinions, findings, and conclusions or recommendations expressed in this publication are those of the author and do not necessarily reflect those of the Department of Justice.
May 16, 2018
Dewey Cornell, Ph.D. 6
School Climate and Safety
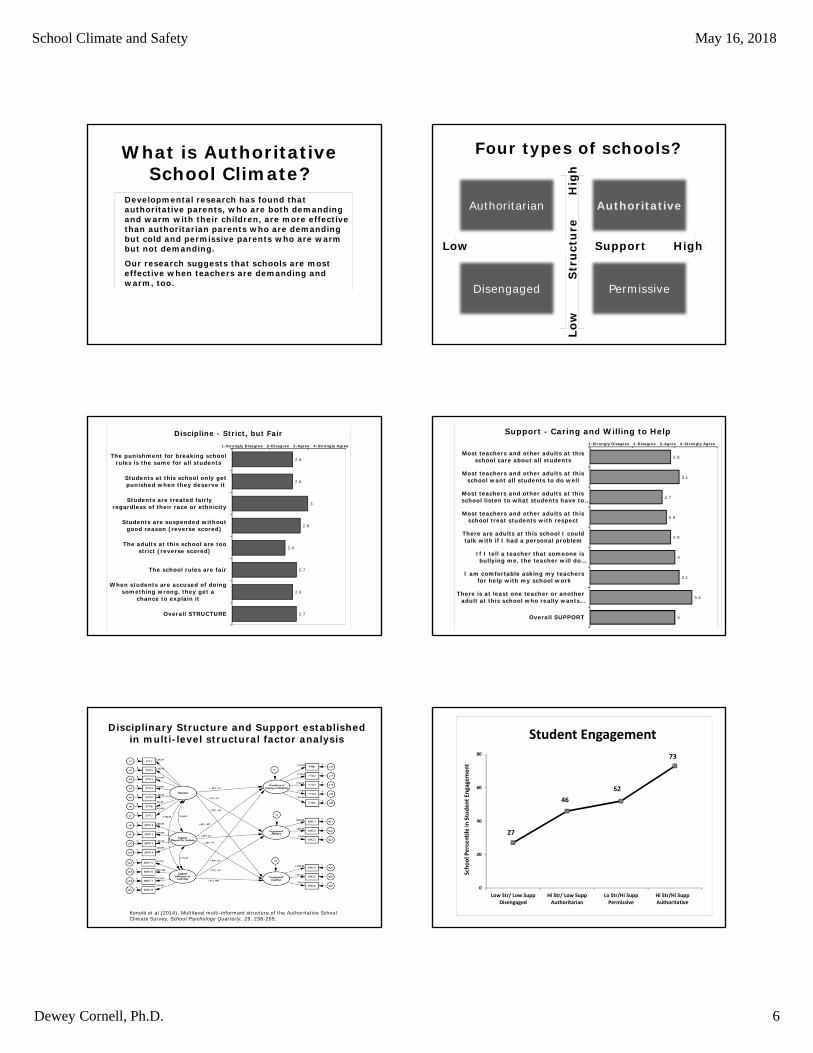
What is Authoritative School Climate?
Developmental research has found that authoritative parents, who are both demanding and warm with their children, are more effective than authoritarian parents who are demanding but cold and permissive parents who are warm but not demanding.
Our research suggests that schools are most effective when teachers are demanding and warm, too.
Four types of schools?
Structure
Low Support High
Authoritarian Authoritative
Disengaged Permissive
Low
S
tru
ctu
re
H
igh
2.6
2.6
3
2.8
2.4
2.7
2.6
2.7
The punishment for breaking schoolrules is the same for all students
Students at this school only getpunished when they deserve it
Students are treated fairlyregardless of their race or ethnicity
Students are suspended withoutgood reason (reverse scored)
The adults at this school are toostrict (reverse scored)
The school rules are fair
When students are accused of doingsomething wrong, they get a
chance to explain it
Overall STRUCTURE
1-Strongly Disagree 2-Disagree 3-Agree 4-Strongly Agree
Discipline - Strict, but Fair
2.9
3.1
2.7
2.8
2.9
3
3.1
3.4
3
Most teachers and other adults at thisschool care about all students
Most teachers and other adults at thisschool want all students to do well
Most teachers and other adults at thisschool listen to what students have to…
Most teachers and other adults at thisschool treat students with respect
There are adults at this school I couldtalk with if I had a personal problem
If I tell a teacher that someone isbullying me, the teacher will do…
I am comfortable asking my teachersfor help with my school work
There is at least one teacher or anotheradult at this school who really wants…
Overall SUPPORT
1-Strongly Disagree 2-Disagree 3-Agree 4-Strongly Agree
Support - Caring and Willing to Help
Disciplinary Structure and Support established in multi-level structural factor analysis
Konold et al (2014), Multilevel multi-informant structure of the Authoritative School Climate Survey, School Psychology Quarterly, 29, 238-255.
27
46
52
73
0
20
40
60
80
Low Str/ Low SuppDisengaged
Hi Str/ Low SuppAuthoritarian
Lo Str/Hi SuppPermissive
Hi Str/Hi SuppAuthoritative
School Percentile in
Student En
gagemen
t
Student Engagement

May 16, 2018
Dewey Cornell, Ph.D. 7
School Climate and Safety
2013-14 school year

May 16, 2018
Dewey Cornell, Ph.D. 8
School Climate and Safety
Authoritative School Climate
• Higher student engagement• Less teasing, bullying, and sexual
harassment• Teachers report less aggression by
students• Less fighting and weapon carrying• Lower suspension rates
Authoritative School Climate
Findings consistent across schools varying in:
• School size• Student poverty %• Minority students %• Urbanicity
School threat assessment is an
alternative to zero tolerance.
The FBI, Secret Service, and Dept of Education recommended a threat assessment approach nearly 20 years ago.
What is Threat Assessment?
Threat assessment is a problem-solving approach to violence prevention that involves assessment and intervention with students who have threatened violence in some way.
Threat Assessment is a violence prevention strategy.
1. Family members, friends, or others seek help when concerned about someone in distress or who is threatening violence.
2. The threat assessment team evaluates the seriousness of the threat.
3. The team initiates assistance to address the underlying problem, conflict or need. In the most serious cases, protective action is taken.

May 16, 2018
Dewey Cornell, Ph.D. 9
School Climate and Safety
Threat Assessment Takes a Problem-Solving Approach
The team takes action based on the seriousness of the threat.• What protective action, if any, is needed?
• What problem stimulated the threat?
• What can be done to resolve that problem?
•Threat assessment must be adapted for schools.
•Recognize developmental issues in children, social context of school.
•Goal is not punishment but successful education and healthy development.
Available from amazon.com
Accurate Threat Assessment Avoids 2 Errors …
1.Over-reaction
Accurate Threat Assessment Avoids 2 Errors …
2. Under-Reaction
Continuum of Threats
• Warning of impending violence• Attempts to intimidate or frighten• Thrill of causing a disruption• Attention-seeking, boasting• Fleeting expressions of anger• Jokes• Figures of speech
Tran
sien
t
S
ub
stan
tive
Key Point
In a threat assessment, we try to determine why a student made a threat, and therefore how we can prevent the threat from being carried out.

May 16, 2018
Dewey Cornell, Ph.D. 10
School Climate and Safety
Research on Threat Assessment
1. Cornell, D., Sheras, P. Kaplan, S., McConville, D., Douglass, J., Elkon, A., McKnight, L., Branson, C., & Cole, J. (2004). Guidelines for student threat assessment: Field-test findings. School Psychology Review, 33, 527-546.
2. Kaplan, S., & Cornell, D. (2005). Threats of violence by students in special education. Behavioral Disorders, 31, 107-119.3. Strong, K., & Cornell, D. (2008). Student threat assessment in Memphis City Schools: A descriptive report. Behavioral Disorders,
34, 42-54. 4. Allen, K., Cornell, D., Lorek, E., & Sheras, P. (2008). Response of school personnel to student threat assessment training. School
Effectiveness and School Improvement, 19, 319-332. 5. Cornell, D., Sheras, P., Gregory, A., & Fan, X. (2009). A retrospective study of school safety conditions in high schools using the
Virginia Threat Assessment Guidelines versus alternative approaches. School Psychology Quarterly, 24, 119-129. 6. Cornell, D., Gregory, A., & Fan, X. (2011). Reductions in long-term suspensions following adoption of the Virginia Student
Threat Assessment Guidelines. Bulletin of the National Association of Secondary School Principals, 95, 175-194.7. Cornell, D., Allen, K., & Fan, X. (2012). A randomized controlled study of the Virginia Student Threat Assessment Guidelines in
grades K-12. School Psychology Review, 41, 100-115.8. Cornell, D. & Lovegrove, P. (2015). Student threat assessment as a method for reducing student suspensions. In D. Losen (Ed.).
Closing the School Discipline Gap: Research for Policymakers. New York, NY: Teachers College Press.9. Nekvasil, E., Cornell, D. (2015). Student threat assessment associated with positive school climate in middle schools. Journal of
Threat Assessment and Management 2, 98-113. http://dx.doi.org/10.1037/tam000003810. Burnette, A. G., Datta, P. & Cornell, D. G. (2017). The distinction between transient and substantive student threats. Journal of
Threat Assessment and Management. http://psycnet.apa.org/record/2017-56103-00111. Cornell, D., Maeng, J., Burnette, A.G., Jia, Y., Huang, F., Konold, T., Datta, P., Malone, M., Meyer, P. (2017). Student threat
assessment as a standard school safety practice: Results from a statewide implementation study. School Psychology Quarterly. http://dx.doi.org/10.1037/spq0000220
12. Cornell, D., Maeng, J., Huang, F., Shukla, K., & Konold, T. (in press). Racial/ethnic parity in disciplinary consequences using student threat assessment. School Psychology Review.
Research on Threat Assessment
1. 99% of threats not carried out.2. Only 1% expelled, 1% arrested.3. Suspension rates decreased.4. Racial disparities reduced or absent. 5. Counseling used more often.6. More positive school climate.
Virginia mandates K-12 threat assessment in 2013
Student Threat Assessment as a Safe and Supportive Prevention Strategy
4-year project (2015-2018)
This project supported by Grant #NIJ 2014-CK-BX-0004 awarded by the National Institute of Justice, Office of Justice Programs, U.S. Department of Justice. The opinions, findings, and conclusions or recommendations expressed in this publication/program/exhibition are those of the author(s) and do not necessarily reflect those of the Department of Justice.
Selected sample of 1,865 threat assessment cases reported by 785 Virginia public schools during the 2014-15 school year
Percentages for 1,865 threat cases from 785 schools. One case can involve more than one type of threat.
33
23
21
18
13
5
1
1
0 5 10 15 20 25 30 35
Unspecified
Kill
Use weapon
Hit, beat
Stab, cut
Bomb
Arson
Sexual
Types of Threats (%)n= 1,865

May 16, 2018
Dewey Cornell, Ph.D. 11
School Climate and Safety
Percentages for 1,8765 threat cases from 785 schools. One case can involve more than one victim.
68
15
13
7
4
0 20 40 60
Student
Teacher
Whole school/group
Staff/administrator
Other
Intended Victim (%)n = 1,865
97.7
2.6
0.7
0 20 40 60 80 100
Threat NotAttempted
Attempted andAverted
Threat CarriedOut
Threat Outcomes (%)n = 1,865 cases
Percentages for 1,865 threat cases from 785 schools. One case can involve more than one outcome.
53
44
16
5
3
3
1
1
0 10 20 30 40 50
Reprimand
Suspension out of school
Suspension in school
Expulsion reduced to…
Detention after school
Placed in juvenile detention
Arrested
Expelled
Disciplinary Outcome (%)n= 1,865
84
8
5
1
2
0 20 40 60 80
No Change
Transferred to alternativeschool
Homebound instruction
Transferred to regularschool
Other
School Placement Outcome (%)n = 1,865 cases
No statistically significant differences for White vs Black or White vs Hispanic students
45
15
0.5 0.7 0.8
46
18
1.4 1.2 0.7
43
16
1.5 0.8 00
10
20
30
40
50
Suspension Change inPlacement
Expulsion Arrest Incarceration
Percent of Studen
ts
No Racial Differences in Disciplinary Outcomes for Students Receiving a Threat Asesssment
n = 785 schools
White
Black
Hispanic
Key Points about School Threat Assessment
1.Must be adapted for schools.2.Avoid criminalizing students.3. Provide help where needed.4.Need systematic training and
research to maintain effectiveness.

May 16, 2018
Dewey Cornell, Ph.D. 12
School Climate and Safety
Concluding Points
1. School violence is a small part of a larger problem of gun violence.
2. Schools are much safer than the public thinks.
3. Prevention begins with a positive school climate.
4. Threat assessment can help schools respond to student threats.
http://youthviolence.edschool.virginia.edu