mahindra & mahindranovember 11,...
TRANSCRIPT

ICIC
I S
ecurit
ies –
Retail E
quit
y R
esearch
Result
Update
November 11, 2019
CMP: | 580 Target: | 680 (17%) Target Period: 12 months
Mahindra & Mahindra (MAHMAH)
BUY
Better placed among OEM pack to tide downturn…
Mahindra & Mahindra (M&M) reported a relatively decent performance in
Q2FY20. Standalone net sales for the quarter were at | 11,076 crore (down
14.7% YoY), tracking automotive and tractor segment volume declines of
20.6% YoY & 8.0% YoY, respectively. Encouragingly, standalone EBITDA
margins were unchanged QoQ at 12.6% (automotive EBIT margins down 70
bps to 4%, tractor EBIT margins unchanged at 19.3%). Consequent
standalone PAT at | 1,213 crore (down 26.5% YoY) was aided by a jump in
other income (| 605 crore received as dividends).
Product profile augurs well for incremental market share gains!
M&M is uniquely positioned among Indian automakers wherein the
company’s PV and CV presence is tilted towards the faster growing
segments within those industries, i.e. UV and LCV, respectively, (as of FY19,
M&M’s UV share in PV portfolio 92% vs. 27% for industry; LCV share in CV
portfolio 95% vs. 60% for industry). By virtue of this product profile, M&M
has been able to limit volume decline during the ongoing sharp slowdown
in the domestic auto space (as of September 2019 on YTD basis, M&M PV
domestic sales volumes down 14.3% YoY vs. 20%+ decline for most major
peers; M&M CV volumes down 15.4% vs. 25%+ decline for major peers).
This places M&M well in terms of gaining incremental market share.
Tractor segment to buffer automotive pains!
M&M is poised to realise the benefits of its diversified presence across the
automotive and farm equipment segments. The domestic tractor industry is
seen posting flattish to negative single digit growth in FY20E on the back of
a high base courtesy ~50% rise in industry volumes in FY16-19, slowing
farm incomes and inherent industry cyclicality. However, in the short-term,
excellent monsoons and expected subsidy support from various state
governments are seen aiding industry volumes in H2FY20E. M&M as the
dominant player in the industry (~40%+ domestic market share) would also
benefit, with the segment supporting total company volumes while
automotive sector drags. Going forward, we build in tractor sales volume of
3.09 lakh units in FY20E, down 7% YoY & 3.24 lakh units in FY21E.
Valuation & Outlook
We expect sales to grow at 2.5% CAGR for M&M in FY19-21E (with PAT seen
declining to ~| 4,287 crore in FY21E). While M&M remains better placed
among the OEM pack with regard to its product segments vis-à-vis industry
prospects, absolute growth still remains a challenge. Valuations, however,
offer comfort. We retain our BUY rating on the stock with a revised target
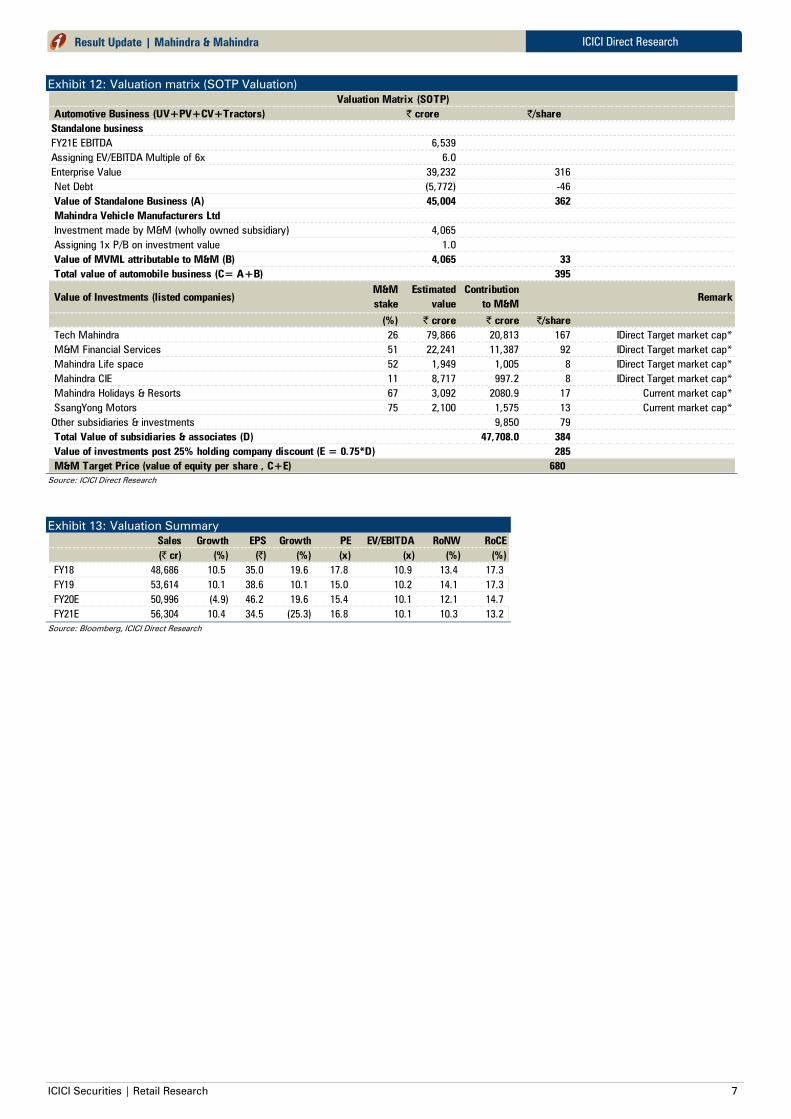
price of | 680/share wherein we value standalone operations at 6x
EV/EBITDA (FY21E basis) and value its investments at 25% holdco discount.
Key Financials FY17 FY18 FY19 FY20E FY21E CAGR (FY19-21E)
Net Sales 44,053.5 48,685.6 53,614.0 50,996.3 56,304.3 2.5%
EBITDA 4,514.7 6,224.1 6,639.6 6,616.5 6,538.7 -0.8%
EBITDA Margins (%) 10.2 12.8 12.4 13.0 11.6
Net Profit 3,643.4 4,356.0 4,796.1 5,738.4 4,287.4 -5.5%
EPS (|) 29.3 35.0 38.6 46.2 34.5
P/E 19.8 16.6 15.0 12.6 16.8
RoNW (%) 12.0 13.4 14.1 12.1 10.3
RoCE (%) 14.7 17.3 17.3 14.7 13.2
Key Financial Summary
Source: ICICI Direct Research, Company
Particulars
Particular Amount
Market Capitalization (| crore) 72,105.6
Total Debt (FY19, | crore) 2,480.3
Cash and Investments (FY19, | crore) 6,733.9
EV (FY19, | crore) 67,852.0
52 week H/L (|) 814 / 503
Equity capital (| crore) (FY19) 595.8
Face value (|) | 5
Key Highlights
Sales decline of 14.7% YoY in
Q2FY20 tracks 20.6%, 8% dip in
automotive & tractor volumes,
respectively
Margins unchanged sequentially at
12.6%
UV, LCV heavy product profile to
help contain volume loss vis-à-vis
industry on automotive side;
relatively better prospects for
tractor segment to help
Healthy B/S, reasonable valuations,
proactive approach towards EV
remain further positives
Maintain BUY with revised target
price of | 680 on SOTP basis
Research Analyst
Shashank Kanodia, CFA
Jaimin Desai

ICICI Securities | Retail Research 2
ICICI Direct Research
Result Update | Mahindra & Mahindra
Exhibit 1: Variance Analysis
Q2FY20 Q2FY20E Q2FY19 YoY (%) Q1FY20 QoQ (%) Comments
Total Operating Income 11076.1 11260.3 12988.6 -14.7 12922.7 -14.3Topline performance broadly in line with estimates, dragged by
automotive segment
Raw Material Expenses 7677.1 7899 9256 -17.1 9159 -16.2
Employee Expenses 718.8 704 742 -3 784 -8
Other expenses 1289.2 1,295 1,386 -7.0 1,357 -5.0
EBITDA 1391.0 1,362.6 1,605.0 -13.3 1,622.7 -14.3
EBITDA Margin (%) 12.6 12.1 12.4 20 bps 12.6 0 bps
Margins surprise positively as the company realises better
gross margins than anticipated (160 bps QoQ expansion).
Negative operating leverage, however, neutralises the impact.
Overall margins remain unchanged QoQ, a credible development
Other income 827.7 335.8 846.3 -2.2 319.1 159.4
Depreciation 539.9 537 461 17.0 545 -1.0
Interest 30.2 29 28 9 27 11
Tax 436.0 351 447 -2.4 423 3.2
PAT 1212.6 781 1649 -26.5 2314 -47.6
Comprehensive beat on profitability front on account of higher-
than-expected margins and large dividend income received from
related parties during quarter
EPS 9.8 6.3 12.4 -21.5 9.3 4.7
Key Metrics
Auto revenues (| crore) 7029.7 7,208 8,639 -18.6 8,101 -13.2 A 20.6% volume drop weighs on auto revenues for quarter
FES revenues (| crore) 3631.5 3,663 4,028 -9.8 4,382 -17.1 FES segment volumes dip 8% YoY
EBITDA margins (%) 12.6 12.1 12.4 20 bps 12.6 0 bps
Source: Company, ICICI Direct Research
Exhibit 2: Change in estimates
(| Crore) Old New % Change Old New % Change Comments
Revenue 55,380 50,996 -7.9 61,460 56,304 -8.4We revise our revenue estimates downward, tracking
persistent pain in industry and upcoming transition to BS-VI
EBITDA 6,966 6,617 -5.0 6,884 6,539 -5.0
EBITDA Margin (%) 12.6 13.0 37 bps 11.2 11.6 41 bps We expect M&M to experience some relief on margin front,
going ahead, amid supportive prices of input commodities
PAT 5,470 5,738 4.9 4,251 4,287 0.9
EPS (|) 44.0 46.2 4.9 34.2 34.5 0.9
FY20E FY21E
Source: Company, ICICI Direct Research
Exhibit 3: Assumptions
Comments
Units FY18 FY19 FY20E FY21E FY20E FY21E
Automotive volumes 548,664 608,597 556,692 572,165 611,015 630,142
While our automotive segment volume estimates have been
pared, they continue to factor in dominant UV share at M&M,
with it expected to outperform industry over FY19-21E
Automotive ASP's (|) 580,009 580,892 605,374 660,681 617,579 679,472Automotive ASPs seen rising ~10% YoY in FY21E on the back of
transition to BS-VI norms
FES Volumes 318,538 330,436 308,692 324,127 317,087 332,322
FES volumes seen declining in single digit for the industry, with
market leader M&M expected to consolidate its market share via
relative outperformance
FES ASPs (|) 505,232 510,679 503,688 510,396 505,643 510,001
Current Earlier
Source: ICICI Direct Research

ICICI Securities | Retail Research 3
ICICI Direct Research
Result Update | Mahindra & Mahindra
Conference Call Highlights
Management outlook
The management sees UV segment growing 10% YoY in H2FY20E, with passenger car (PC) segment, de-growing
~12-13% in that time, leading to ~5% decline for PV industry. The auto outlook has improved slightly for
remaining five months of FY20
Decline on CV side expected to continue at similar rates as present
M&M lowered FY20E tractor industry outlook to ~ (-) 7-8%. November would be decent for the industry (pent up
demand from delayed harvest) while February-March expected to be strong
Festive demand
While industry retails grew ~14% YoY, M&M posted 23% rise in automotive and 4% decline in tractors
M&M festive discounts were higher by ~| 4,000/unit (auto), ~| 1,500/unit (tractors) (QoQ basis)
Pickups retailed ~22,000 units in October
BS-VI & powertrain related discussion
Logistic issues are brewing surrounding BS-VI grade fuel availability in run-up to April switchover. M&M would
want diesel fuel to be available six to eight weeks before deadline (product dispatch to begin in January 2020 with
feasible holding capacity of about three weeks at dealers)
Under BS-VI, diesel is expected to vanish from 1.2L & lower engines; for 1.2-1.5L engines existing gasoline to
diesel mix is seen reversing. Diesel is expected to be the dominant fuel in 1.5L & above engines
M&M is exploring gasoline/CNG/EV options for SCV segment due to BS-VI pricing increase impact
The company expects most 3-W to be electric in three years (with CNG co-existing). Primary e-3-W markets today
are northern & eastern metros
Product development
All new M&M products to be in UV, have gasoline and diesel variants
Three new product launches are in the pipeline starting Q4FY20
Electric Vehicles (EV)
M&M retailed ~2,000 units in October (~1,300 e-Alfa, ~700 e-Treo, ~150 ~e-Verito); expects continued growth
Electric KUV to be launched in Q4FY20, an electric last mile vehicle around Q3FY21 and electric XUV by Q1FY22
SsangYong, Jawa update
Losses at SsangYong have mounted in recent quarters due to – a) economic slowdown and rapid shift towards
gasoline in home Korean market, b) region specific issues in large export markets, viz. Iran, Egypt & West Europe
and c) high development costs and high variable expenses amid negative operating leverage
M&M is working on reducing material costs and exploring new export markets
EBITDA/EBT breakeven levels for SsangYong are at 140,000 units/155,000 units
Jawa production has been ramped up to ~5,000 units per month
Inventory situation
Auto inventory at a multi month low level; tractor inventory could correct by further ~1,500 units
Others
SCV market share crossed 50%, LCV market share up 200 bps to 9.5%

ICICI Securities | Retail Research 4
ICICI Direct Research
Result Update | Mahindra & Mahindra
Financial story in charts
Exhibit 4: Topline trend
40875
44054
48686
53614
50996
56304
5.0
7.8
10.5 10.1
(4.9)
10.4
(6)
(4)
(2)
-
2
4
6
8
10
12
14
-
10,000
20,000
30,000
40,000
50,000
60,000
FY16 FY17 FY18 FY19 FY20E FY21E
(%
)
(| crore)
Total Operating Income Growth (%)
Source: Company, ICICI Direct Research
Exhibit 5: Segment wise revenue trend
7,890
7,115
9,136
8,188
8,639
8,084
10,442
8,101
7,030
3,958
4,098
3,716
5,007
4,028
4,634
3,206
4,382
3,631
0
1,500
3,000
4,500
6,000
7,500
9,000
10,500
12,000
Q2FY18 Q3FY18 Q4FY18 Q1FY19 Q2FY19 Q3FY19 Q4FY19 Q1FY20 Q2FY20
(| crore)
Automotive Farm Equipment
Source: Company, ICICI Direct Research
Exhibit 6: Segment wise volume trend
138
129
165
140
151
143
175
132
120
81
82
71
101
78
91
61
86
72
0
20
40
60
80
100
120
140
160
180
200
Q2FY18
Q3FY18
Q4FY18
Q1FY19
Q2FY19
Q3FY19
Q4FY19
Q1FY20
Q2FY20
(000's
)
Automotive Farm Equipment
Source: Company, ICICI Direct Research
We expect sales to grow at a CAGR of 2.5% over
FY19-21E
Segment wise revenue mix for quarter i.e. Q2FY20
was at automotive: tractor: others: 63:33: 4
In Q2FY20; automotive segment volumes declined
20.6% YoY to 120,000 units while sales for tractors
declined 8.0% YoY to ~72,000 units

ICICI Securities | Retail Research 5
ICICI Direct Research
Result Update | Mahindra & Mahindra
Exhibit 7: M&M tractor market share movement
222
203
250
304
317
550
491
598
728
787
40.4
41.3 41.8 41.8
40.3
30.0
32.0
34.0
36.0
38.0
40.0
42.0
44.0
100
200
300
400
500
600
700
800
900
FY15 FY16 FY17 FY18 FY19
(%
)
('0
00 units)
M&M Domestic tractor industry M&M market share (RHS)
Source: CRISIL, ICICI Direct Research
Exhibit 8: M&M UV market share movement
207
222
223
234
235
552
587
762
922
941
37.5 37.9
29.2
25.4 25.0
20.0
22.0
24.0
26.0
28.0
30.0
32.0
34.0
36.0
38.0
40.0
100
200
300
400
500
600
700
800
900
1,000
FY15 FY16 FY17 FY18 FY19
(%
)
('0
00 units)
M&M Domestic UV segment M&M market share (RHS)
Source: SIAM, ICICI Direct Research
Exhibit 9: EBITDA and EBITDA margin trend
4620
4515
6224
6640
6617
6539
11.3
10.2
12.8
12.4
13.0
11.6
8
10
12
14
-
1,000
2,000
3,000
4,000
5,000
6,000
7,000
FY16 FY17 FY18 FY19 FY20E FY21E
(%
)
(| crore)
EBITDA EBITDA Margins (%)
Source: Company, ICICI Direct Research
M&M’s tractor market share was at 40.3% as of
FY19
M&M’s UV market share was at 25% as of FY19
We build in 13.0% & 11.6% as EBITDA margins in
FY20E and FY21E, respectively

ICICI Securities | Retail Research 6
ICICI Direct Research
Result Update | Mahindra & Mahindra
Exhibit 10: Profitability (adjusted PAT) trend
3153
3220
4046
4819
4670
4287
3.2 2.1
25.7
19.1
(3.1)
(8.2) (10)
(5)
-
5
10
15
20
25
30
-
1,000
2,000
3,000
4,000
5,000
6,000
FY16 FY17 FY18 FY19 FY20E FY21E
(%
)
(| crore)
PAT Growth (%)
Source: Company, ICICI Direct Research
Exhibit 11: Return ratios trend
17.5
14.7
17.3 17.3
14.7
13.2
14.3
12.0
13.4
14.1
12.1
10.3
8
11
14
17
20
FY16 FY17 FY18 FY19 FY20E FY21E
(%
)
RoCE RoE
Source: Company, ICICI Direct Research
Adjusted PAT CAGR is in negative territory for M&M
over FY19-21E primarily tracking high base in FY19
RoCE profile at M&M seen deteriorating to ~13% by
FY21E
ICICI Securities | Retail Research 7
ICICI Direct Research
Result Update | Mahindra & Mahindra
Exhibit 12: Valuation matrix (SOTP Valuation)
Automotive Business (UV+PV+CV+Tractors) | crore |/share
Standalone business
FY21E EBITDA 6,539
Assigning EV/EBITDA Multiple of 6x 6.0
Enterprise Value 39,232 316
Net Debt (5,772) -46
Value of Standalone Business (A) 45,004 362
Mahindra Vehicle Manufacturers Ltd
Investment made by M&M (wholly owned subsidiary) 4,065
Assigning 1x P/B on investment value 1.0
Value of MVML attributable to M&M (B) 4,065 33
Total value of automobile business (C= A+B) 395
Value of Investments (listed companies)
M&M
stake
Estimated
value
Contribution
to M&M Remark
(%) | crore | crore |/share
Tech Mahindra 26 79,866 20,813 167 IDirect Target market cap*
M&M Financial Services 51 22,241 11,387 92 IDirect Target market cap*
Mahindra Life space 52 1,949 1,005 8 IDirect Target market cap*
Mahindra CIE 11 8,717 997.2 8 IDirect Target market cap*
Mahindra Holidays & Resorts 67 3,092 2080.9 17 Current market cap*
SsangYong Motors 75 2,100 1,575 13 Current market cap*
Other subsidiaries & investments 9,850 79
Total Value of subsidiaries & associates (D) 47,708.0 384
Value of investments post 25% holding company discount (E = 0.75*D) 285
M&M Target Price (value of equity per share , C+E) 680
Valuation Matrix (SOTP)
Source: ICICI Direct Research
Exhibit 13: Valuation Summary
Sales Growth EPS Growth PE EV/EBITDA RoNW RoCE
(| cr) (%) (|) (%) (x) (x) (%) (%)
FY18 48,686 10.5 35.0 19.6 17.8 10.9 13.4 17.3
FY19 53,614 10.1 38.6 10.1 15.0 10.2 14.1 17.3
FY20E 50,996 (4.9) 46.2 19.6 15.4 10.1 12.1 14.7
FY21E 56,304 10.4 34.5 (25.3) 16.8 10.1 10.3 13.2
Source: Bloomberg, ICICI Direct Research

ICICI Securities | Retail Research 8
ICICI Direct Research
Result Update | Mahindra & Mahindra
Exhibit 14: Recommendation history vs. consensus
0.0
10.0
20.0
30.0
40.0
50.0
60.0
70.0
80.0
90.0
100.0
0
200
400
600
800
1,000
1,200
Nov-19Aug-19Jun-19Mar-19Jan-19Oct-18Aug-18May-18Mar-18Jan-18Oct-17Aug-17May-17Mar-17Dec-16
(%
)(|)
Price Idirect target Consensus Target Mean % Consensus with BUY
Source: Reuters, ICICI Direct Research
Exhibit 15: Top 10 shareholders
Rank Name Latest Filing Date % O/S Position (m) Change (m)
1 Prudential Management & Services Pvt. Ltd. 30-Sep-19 11.9 141.5 0.00
2 Life Insurance Corporation of India 30-Sep-19 11.3 134.2 0.73
3 M&M Benefit Trust 30-Sep-19 7.1 84.5 0.00
4 M&M Farm Equipment Employees Welfare Fund 3-Jun-19 7.1 84.5 84.47
5 Stewart Investors 31-Jul-19 4.9 57.8 4.82
6 Mahindra & Mahindra Employees Stock Option Trust 22-Oct-19 4.3 50.9 -0.06
7 SBI Funds Management Pvt. Ltd. 30-Sep-19 2.6 30.6 1.26
8 Caisse de Depot et Placement du Quebec 30-Sep-19 2.0 23.9 0.50
9 The Vanguard Group, Inc. 30-Sep-19 1.8 21.0 -0.33
10 BlackRock Institutional Trust Company, N.A. 30-Sep-19 1.7 20.8 0.09
Source: Reuters, ICICI Direct Research, ICICI Direct Research
Exhibit 16: Recent activity
Investor name Value Shares Investor name Value Shares
M&M Farm Equipment Employees Welfare Fund +802.98M +84.47M ICICI Prudential Life Insurance Company Ltd. -125.08M -13.16M
NPS Trust +97.93M +12.64M GIC Private Limited -27.42M -3.54M
RBC Global Asset Management (UK) Limited +71.61M +9.25M FIL Investment Management (Hong Kong) Limited -15.63M -1.68M
Stewart Investors +38.46M +4.82M Franklin Templeton Asset Management (India) Pvt. Ltd. -12.34M -1.59M
ICICI Prudential Asset Management Co. Ltd. +18.75M +2.42M UTI Asset Management Co. Ltd. -11.92M -1.54M
Buys Sells
Source: Reuters, ICICI Direct Research
Exhibit 17: Shareholding pattern
(in %) Sep-18 Dec-18 Mar-19 Jun-19 Sep-19
Promoter 21.6 21.6 21.5 19.9 19.8
FII 34.0 33.0 31.3 34.5 34.2
DII 21.2 21.9 23.4 24.1 27.8
Others 23.2 23.6 23.8 21.6 18.1
Source: Company, ICICI Direct Research

ICICI Securities | Retail Research 9
ICICI Direct Research
Result Update | Mahindra & Mahindra
Financial Summary
Exhibit 18: Profit and loss statement | crore
(Year-end March) FY18 FY19 FY20E FY21E
Total operating Income 48,685.6 53,614.0 50,996.3 56,304.3
Growth (%) 10.5 10.1 -4.9 10.4
Raw Material Expenses 34,134.7 38,256.5 35,686.0 40,614.0
Employee Expenses 2,840.9 2,980.2 3,015.0 3,111.7
Other Expenses 5,486.0 5,737.7 5,678.8 6,039.9
Total Operating Expenditure 42,461.5 46,974.4 44,379.8 49,765.6
EBITDA 6,224.1 6,639.6 6,616.5 6,538.7
Growth (%) 37.9 6.7 -0.3 -1.2
Depreciation 1,479.4 1,860.4 2,167.3 2,392.9
Interest 112.2 113.4 115.6 97.5
Other Income 1,036.4 1,689.0 1,641.6 1,683.5
PBT 5,668.8 6,354.8 5,975.1 5,731.8
Others (incl exceptional item) -433.6 29.7 -1,367.1 0.0
Total Tax 1,746.4 1,529.0 1,603.8 1,444.4
PAT 4,356.0 4,796.1 5,738.4 4,287.4
Growth (%) 19.6 10.1 19.6 -25.3
EPS (|) 35.0 38.6 46.2 34.5
Source: Company, ICICI Direct Research
Exhibit 19: Cash flow statement | crore
(Year-end March) FY18 FY19 FY20E FY21E
Profit after Tax 4,356.0 4,796.1 5,738.4 4,287.4
Add: Depreciation 1,479.4 1,860.4 2,167.3 2,392.9
(Inc)/dec in Current Assets -2,219.3 -1,803.9 733.0 -1,045.8
Inc/(dec) in CL and Provisions 3,559.6 1,230.8 -1,356.5 1,227.0
CF from operating activities 7,175.7 6,083.4 7,282.2 6,861.4
(Inc)/dec in Investments -2,784.7 -1,341.3 -2,700.0 -2,100.0
(Inc)/dec in Fixed Assets -2,658.7 -3,373.7 -3,000.0 -3,000.0
Others 227.4 734.7 13.8 -28.0
CF from investing activities (5,216.0) (3,980.4) (5,686.2) (5,128.0)
Issue/(Buy back) of Equity -2.5 -195.9 0.0 0.0
Inc/(dec) in loan funds 91.5 -384.1 -300.0 -300.0
Dividend paid & dividend tax -1,118.9 -1,268.1 -1,268.1 -1,342.7
Others 276.4 582.9 -0.2 -0.2
CF from financing activities (753.5) (1,265.2) (1,568.3) (1,642.9)
Net Cash flow 1,206.2 837.8 27.7 90.6
Opening Cash 1,687.5 2,893.7 3,731.5 3,759.3
Closing Cash 2,893.7 3,731.5 3,759.3 3,849.9
Source: Company, ICICI Direct Research
Exhibit 20: Balance Sheet | crore
(Year-end March) FY18 FY19 FY20E FY21E
Liabilities
Equity Capital 595.0 595.8 595.8 595.8
Reserve and Surplus 29,699.1 33,613.4 38,083.7 41,028.4
Total Shareholders funds 30,294.0 34,209.2 38,679.5 41,624.2
Total Debt 2,864.4 2,480.3 2,180.3 1,880.3
Deferred Tax Liability 277.2 634.1 634.1 634.1
Others 1,326.4 1,487.9 1,415.2 1,562.5
Total Liabilities 34,762.0 38,811.5 42,909.2 45,701.2
Assets
Gross Block 17,892.0 21,974.6 25,394.4 28,394.4
Less: Acc Depreciation 10,032.5 11,892.9 14,060.2 16,453.2
Net Block 7,859.5 10,081.7 11,334.2 11,941.3
Capital WIP 3,128.7 2,419.8 2,000.0 2,000.0
Total Fixed Assets 10,988.3 12,501.5 13,334.2 13,941.3
Other investments 16,645.5 19,032.1 21,032.1 23,032.1
Liquid Investments 4,047.6 3,002.4 3,702.4 3,802.4
Inventory 2,701.7 3,839.3 3,772.3 4,165.0
Debtors 3,173.0 3,946.3 4,191.5 4,627.8
Loans and Advances 975.2 673.4 385.5 425.7
Other current assets 581.4 539.2 2,061.8 2,321.8
Cash 2,893.7 3,731.5 3,759.3 3,849.9
Total Current Assets 9,549.0 9,001.3 12,426.9 15,068.6
Creditors 6,881.1 8,603.4 9,678.2 8,662.4
Provisions 565.5 667.4 688.7 703.0
Total Current Liabilities 7,446.6 9,270.8 10,366.9 9,365.4
Net Current Assets 2,102.5 (269.5) 2,060.0 5,703.2
Application of Funds 34,762.0 38,811.5 42,909.2 45,701.2
Source: Company, ICICI Direct Research
Exhibit 21: Key ratios
(Year-end March) FY18 FY19 FY20E FY21E
Per share data (|)
EPS 35.0 38.6 46.2 34.5
Cash EPS 46.9 53.5 63.6 53.7
BV 243.7 275.2 311.1 334.8
DPS 7.5 8.5 8.5 9.0
Cash Per Share 23.3 30.0 30.2 31.0
Operating Ratios (%)
EBITDA Margin 12.8 12.4 13.0 11.6
PBT / Net sales 9.7 8.9 8.7 7.4
PAT Margin 11.3 11.3 9.0 8.3
Inventory days 20.3 26.1 27.0 27.0
Debtor days 23.8 26.9 30.0 30.0
Creditor days 64.5 65.9 62.0 62.0
Return Ratios (%)
RoE 13.4 14.1 12.1 10.3
RoCE 17.3 17.3 14.7 13.2
RoIC 94.5 60.2 45.2 40.3
Valuation Ratios (x)
P/E 16.6 15.0 12.6 16.8
EV / EBITDA 10.9 10.2 10.1 10.1
EV / Net Sales 1.4 1.3 1.3 1.2
Market Cap / Sales 1.5 1.3 1.4 1.3
Price to Book Value 2.4 2.1 1.9 1.7
Solvency Ratios
Debt/Equity 0.1 0.1 0.1 0.0
Current Ratio 0.8 0.8 0.9 0.9
Quick Ratio 0.5 0.5 0.5 0.5
Source: Company, ICICI Direct Research

ICICI Securities | Retail Research 10
ICICI Direct Research
Result Update | Mahindra & Mahindra
Exhibit 22: ICICI Direct coverage universe (Auto & Auto Ancillary)
Sector / Company CMP M Cap
(|) TP(|) Rating (| Cr) FY19 FY20E FY21E FY19 FY20E FY21E FY19 FY20E FY21E FY19 FY20E FY21E FY19 FY20E FY21E
Apollo Tyre (APOTYR) 165 180 Hold 9447 11.9 10.3 12.0 13.9 16.0 13.7 7.5 7.5 6.3 8.0 5.8 6.7 8.3 5.7 6.3
Ashok Leyland (ASHLEY) 77 75 Hold 22471 6.8 5.8 6.2 11.3 13.1 12.4 5.8 6.3 5.8 26.9 22.7 22.2 24.3 18.8 18.1
Bajaj Auto (BAAUTO) 3246 3300 Hold 93916 161.6 175.0 189.0 19.6 18.1 16.7 14.9 13.9 11.9 21.0 19.5 25.9 19.9 20.6 19.8
Bharat Forge (BHAFOR) 427 515 Buy 19864 22.2 23.5 24.9 19.2 18.1 17.1 11.5 11.5 10.8 17.9 16.0 16.3 19.1 17.6 16.9
Eicher Motors (EICMOT) 21700 22215 Hold 59154 808.1 848.2 1007.4 26.9 25.6 21.5 19.3 20.4 16.0 32.5 25.7 26.5 24.8 21.5 21.1
Exide Industries (EXIIND) 187 230 Buy 16150 9.9 11.2 12.7 18.8 16.6 14.6 11.2 9.8 8.5 18.4 18.8 19.2 12.9 14.3 14.6
Hero Moto (HERHON) 2700 3110 Buy 53919 169.5 195.0 182.9 15.9 13.8 14.8 10.0 10.5 9.7 37.1 30.1 29.8 26.3 23.9 23.0
M&M (MAHMAH) 580 680 Buy 72106 38.6 46.2 34.5 15.0 12.6 16.8 10.2 10.1 10.1 17.3 14.7 13.2 14.1 12.1 10.3
Maruti Suzuki (MARUTI) 7396 6420 Reduce 223418 248.3 212.7 257.9 29.8 34.8 28.7 17.1 21.7 17.6 16.3 9.4 11.5 16.3 12.9 14.3
Tata Motors (TATMOT) 169 175 Hold 54330 -84.6 -2.3 8.9 -2.0 -73.8 18.9 4.0 4.0 3.5 5.4 7.7 8.9 7.1 0.0 10.8
RoE (%)EPS (|) P/E (x) EV/EBITDA (x) RoCE (%)
Source: Reuters, ICICI Direct Research

ICICI Securities | Retail Research 11
ICICI Direct Research
Result Update | Mahindra & Mahindra
RATING RATIONALE
ICICI Direct endeavors to provide objective opinions and recommendations. ICICI Direct assigns ratings to its
stocks according to their notional target price vs. current market price and then categorizes them as Buy, Hold,
Reduce and Sell. The performance horizon is two years unless specified and the notional target price is defined
as the analysts' valuation for a stock
Buy: >15%
Hold: -5% to 15%;
Reduce: -15% to -5%;
Sell: <-15%
Pankaj Pandey Head – Research [email protected]
ICICI Direct Research Desk,
ICICI Securities Limited,
1st Floor, Akruti Trade Centre,
Road No 7, MIDC,
Andheri (East)
Mumbai – 400 093

ICICI Securities | Retail Research 12
ICICI Direct Research
Result Update | Mahindra & Mahindra
ANALYST CERTIFICATION
I/We, Shashank Kanodia, CFA, MBA (Capital Markets), and Jaimin Desai, CA, Research Analysts, authors and the names subscribed to this report, hereby certify that all of the views expressed in this research report accurately reflect
our views about the subject issuer(s) or securities. We also certify that no part of our compensation was, is, or will be directly or indirectly related to the specific recommendation(s) or view(s) in this report. It is also confirmed that
above mentioned Analysts of this report have not received any compensation from the companies mentioned in the report in the preceding twelve months and do not serve as an officer, director or employee of the companies
mentioned in the report.
Terms & conditions and other disclosures:
ICICI Securities Limited (ICICI Securities) is a full-service, integrated investment banking and is, inter alia, engaged in the business of stock brokering and distribution of financial products. ICICI Securities Limited is a SEBI registered
Research Analyst with SEBI Registration Number – INH000000990. ICICI Securities Limited SEBI Registration is INZ000183631 for stock broker. ICICI Securities is a subsidiary of ICICI Bank which is India’s largest private sector bank
and has its various subsidiaries engaged in businesses of housing finance, asset management, life insurance, general insurance, venture capital fund management, etc. (“associates”), the details in respect of which are available on
www.icicibank.com
ICICI Securities is one of the leading merchant bankers/ underwriters of securities and participate in virtually all securities trading markets in India. We and our associates might have investment banking and other business relationship
with a significant percentage of companies covered by our Investment Research Department. ICICI Securities generally prohibits its analysts, persons reporting to analysts and their relatives from maintaining a financial interest in the
securities or derivatives of any companies that the analysts cover.
Recommendation in reports based on technical and derivative analysis centre on studying charts of a stock's price movement, outstanding positions, trading volume etc as opposed to focusing on a company's fundamentals and, as
such, may not match with the recommendation in fundamental reports. Investors may visit icicidirect.com to view the Fundamental and Technical Research Reports.
Our proprietary trading and investment businesses may make investment decisions that are inconsistent with the recommendations expressed herein.
ICICI Securities Limited has two independent equity research groups: Institutional Research and Retail Research. This report has been prepared by the Retail Research. The views and opinions expressed in this document may or may
not match or may be contrary with the views, estimates, rating, target price of the Institutional Research.
The information and opinions in this report have been prepared by ICICI Securities and are subject to change without any notice. The report and information contained herein is strictly confidential and meant solely for the selected
recipient and may not be altered in any way, transmitted to, copied or distributed, in part or in whole, to any other person or to the media or reproduced in any form, without prior written consent of ICICI Securities. While we would
endeavour to update the information herein on a reasonable basis, ICICI Securities is under no obligation to update or keep the information current. Also, there may be regulatory, compliance or other reasons that may prevent ICICI
Securities from doing so. Non-rated securities indicate that rating on a particular security has been suspended temporarily and such suspension is in compliance with applicable regulations and/or ICICI Securities policies, in
circumstances where ICICI Securities might be acting in an advisory capacity to this company, or in certain other circumstances.
This report is based on information obtained from public sources and sources believed to be reliable, but no independent verification has been made nor is its accuracy or completeness guaranteed. This report and information herein
is solely for informational purpose and shall not be used or considered as an offer document or solicitation of offer to buy or sell or subscribe for securities or other financial instruments. Though disseminated to all the customers
simultaneously, not all customers may receive this report at the same time. ICICI Securities will not treat recipients as customers by virtue of their receiving this report. Nothing in this report constitutes investment, legal, accounting
and tax advice or a representation that any investment or strategy is suitable or appropriate to your specific circumstances. The securities discussed and opinions expressed in this report may not be suitable for all investors, who
must make their own investment decisions, based on their own investment objectives, financial positions and needs of specific recipient. This may not be taken in substitution for the exercise of independent judgment by any recipient.
The recipient should independently evaluate the investment risks. The value and return on investment may vary because of changes in interest rates, foreign exchange rates or any other reason. ICICI Securities accepts no liabilities
whatsoever for any loss or damage of any kind arising out of the use of this report. Past performance is not necessarily a guide to future performance. Investors are advised to see Risk Disclosure Document to understand the risks
associated before investing in the securities markets. Actual results may differ materially from those set forth in projections. Forward-looking statements are not predictions and may be subject to change without notice.
ICICI Securities or its associates might have managed or co-managed public offering of securities for the subject company or might have been mandated by the subject company for any other assignment in the past twelve months.
ICICI Securities or its associates might have received any compensation from the companies mentioned in the report during the period preceding twelve months from the date of this report for services in respect of managing or co-
managing public offerings, corporate finance, investment banking or merchant banking, brokerage services or other advisory service in a merger or specific transaction.
ICICI Securities encourages independence in research report preparation and strives to minimize conflict in preparation of research report. ICICI Securities or its associates or its analysts did not receive any compensation or other
benefits from the companies mentioned in the report or third party in connection with preparation of the research report. Accordingly, neither ICICI Securities nor Research Analysts and their relatives have any material conflict of
interest at the time of publication of this report.
Compensation of our Research Analysts is not based on any specific merchant banking, investment banking or brokerage service transactions.
ICICI Securities or its subsidiaries collectively or Research Analysts or their relatives do not own 1% or more of the equity securities of the Company mentioned in the report as of the last day of the month preceding the publication of
the research report.
Since associates of ICICI Securities are engaged in various financial service businesses, they might have financial interests or beneficial ownership in various companies including the subject company/companies mentioned in this
report.
ICICI Securities may have issued other reports that are inconsistent with and reach different conclusion from the information presented in this report.
Neither the Research Analysts nor ICICI Securities have been engaged in market making activity for the companies mentioned in the report.
We submit that no material disciplinary action has been taken on ICICI Securities by any Regulatory Authority impacting Equity Research Analysis activities.
This report is not directed or intended for distribution to, or use by, any person or entity who is a citizen or resident of or located in any locality, state, country or other jurisdiction, where such distribution, publication, availability or
use would be contrary to law, regulation or which would subject ICICI Securities and affiliates to any registration or licensing requirement within such jurisdiction. The securities described herein may or may not be eligible for sale in
all jurisdictions or to certain category of investors. Persons in whose possession this document may come are required to inform themselves of and to observe such restriction.