mahatma phule krishi vidyapeeth, rahuri (maharashtra) · mahatma phule krishi vidyapeeth, rahuri...
TRANSCRIPT

(For office use only)
Mahatma Phule Krishi Vidyapeeth, Rahuri
(Maharashtra)
AALLLL IINNDDIIAA CCOO--OORRDDIINNAATTEEDD RREESSEEAARRCCHH
PPRROOJJEECCTT
OONN
SSSUUUGGGAAARRRCCCAAANNNEEE AAAGGGRRROOONNNOOOMMMYYY
AAANNNNNNUUUAAALLL RRREEEPPPOOORRRTTT
(2012-13)
CCOOMMPPIILLEEDD
BBYY
PPPrrrooofff... RRR...MMM...DDDiiixxxiiittt
SSSuuugggaaarrrcccaaannneee AAAgggrrrooonnnooommmiiisssttt
CENTRAL SUGARCANE RESEARCH STATION,
PADEGAON – 415 521 , Tal – Phaltan , Dist – Satara
(Maharashtra)

CENTRAL SUGARCANE RESEARCH STATION,
PADEGAON – 415 521 , Tal – Phaltan , Dist – Satara
(Maharashtra)
SUGARCANE AGRONOMY
Contents
Sr.No. Particulars Page No.
1 Introduction i-ii
2 Season and Climate iii-vii
3 Staff Position viii
6 Research Highlights xi-xiii
7 Research Report on AICRP Agronomy 1-50
8 Technical Programme (2013-14) 51-59

INTRODUCTION
INTRODUCTION

Sugarcane is the most important cash crop in the state of Maharashtra. Sugar
industry plays a pivotal role in the socio-economic and educational development in the
rural areas of the state. In general, since last 3 years the rainfall situation in Maharashtra
was satisfactory which resulted in the increase in area under sugarcane. Therefore, during
2010-11, the area of sugarcane is at the highest peak level in the state i.e. 10.22 lakh
hectares with 802.15 lakh ton Sugarcane production and 78.48 t/ha average productivity
and 11.31 % average sugar recovery. The sugar industry is facing the problem of crushing
excess cane during 2010-11. Therefore, it is the need of hour to increase the production
and decrease the area and cost of production.
The sugarcane productivity has declined from 83.3 t /ha during 2000-01 to 74.10 t
/ha during 2008-09. However, it increases during the year 2009-10 (83.0 t/ha) and again
slightly decreases during the year 2010-11 (78.48 t/ha). For higher returns from the
sugarcane crop, the productivity as well as quality of the sugarcane needs to be improved
with adoption of the advanced technologies viz., use of high yielding and high sugar
varieties, improved planting methods, better water management, trash recycling, INM and
IPM, use of improved management techniques and use of quality seed.
For providing the high yielding and high sugar varieties and new techniques for
increasing yield, the Central Sugarcane Research Station, Padegaon is conducting research
on varietal improvement along with development of new techniques especially planting
systems, paired row planting, intercropping, ratoon management, IPM and INM, water
management, drought and salinity management, sugarcane based farming system and
cropping system. The need based future research strategies are development of extra early
sugarcane varieties maturing at 10 –11 months, development of sugarcane varieties for
better juice quality, identification of varieties for specific characteristics i.e. flood
tolerance / drought and salt tolerance, woolly aphid tolerance/resistance, higher production
of fiber for co-generation, higher percentage of brix in early age of crop for higher ethanol
production. The efforts are also being made to develop non-flowering/ sparse flowering
varieties with higher cane yield, CCS yield and sugar recovery. Similarly, the attention
will be given for development of anti-inversion varieties to withstand the delayed
crushing. Special emphasis will be given for varietal development considering the global
warming and the climate change.
Table. 1. ) In Maharashtra State, there are five major sub-ecological zones for
sugarcane viz.

Sr.No. Sub-ecological zone Particulars/Remarks
1. South Western Maharashtra State Adequate resources-high recovery zone
2. Central Western Maharashtra State Adequate resources-medium recovery zone
3. North Western Maharashtra State Insufficient irrigation and other resources.
low recovery zone 4. East middle Maharashtra State
5. East Maharashtra State
Table.2) : The area, production, productivity, sugar production and sugarcane
recovery in Maharashtra from 2001 to 2012.
Year
Area
(‘000’
ha)
Sugarcane
production
(Lakh ton)
Sugarcane
productivity
(t /ha)
Sugar
production
(Lakh ton)
Sugar
recovery
(%)
2000-01 595 495.89 83.3 67.05 11.64
2001-02 578 451.40 78.1 56.13 11.60
2002-03 599 370.15 61.8 65.19 11.66
2003-04 548 290.66 51.0 30.39 10.91
2004-05 320 204.00 63.0 22.62 11.45
2005-06 415 388.14 68.22 51.98 11.68
2006-07 840 626.00 76.00 90.95 11.40
2007-08 1046 735.69 70.33 87.63 11.91
2008-09 770 410 74.10 46.00 11.46
2009-10 756 641.59 83.00 70.66 11.54
2010-11 1022 802.15 78.48 90.52 11.31
2011-12* 1008 77.87 78.03 89.50 11.55
* : Estimated.

Season
and climate
Central Sugarcane Research Station, Padegaon.

Season & Climate
( 2010 - 2012)
The Central Sugarcane Research Station, Padegaon is located in sub
tropical zone, geographically at an elevation of 556 m above mean sea level on
18o-12"N latitude and 74o-10"E longitude.
The total rainfall received during July, 2010 to March, 2012 (21 months)
was 1002.4 mm in 69 rainy days as against the normal rainfall of 1087.0 mm (21
months) indicating that the rainfall received during the season was 7.8 % less than
normal. The data on climatic parameters during the crop season (July, 2010 to
March, 2012 ) along with averages based on last 79 years (1932-33 to 2010-11 )
recorded at the meteorological observatory located at this research station are
presented in Table 1 and graphically shown in Fig.1. The effect of the season on
sugarcane at various growth phases has been elucidated below.
1) Germination phase for Adsali crop (Jul. to Sept., 2010)
The rainfall received during germination phase was 320.6 mm in 24 rainy
days as against the normal of 301.6 mm. The average maximum temperature
during this period was 29.5 oC and minimum temperature was 21.7 oC. The
average relative humidity (morning) during this phase was 98 % which was 11 %
more than the normal.
Evenly distributed rainfall and high humidity resulted in good germination
of Adsali crop of sugarcane.
2) Tillering phase (Oct-Dec., 2010) for Adsali and Germination phase for Preseason
crop:
Total rainfall received during tillering phase was 240.1 mm which was 58
% more than the normal of last 79 years. The average maximum and minimum
temperatures during this phase were 29.2 oC and 17.7 oC respectively. The
morning humidity was 98 % as against the normal 86 %. High humidity and high
rainfall was favourable for the tillering of Adsali sugarcane. High humidity was
also favourable for good germination of preseasonal sugarcane.
3) Early growth for (Adsali) and Tillering phase for Preseason and
Germination phase for Suru (Jan-Mar.2011)

During this phase the average maximum temperature was 31.5 oC which
was slightly less than the normal i.e 32.4 oC .The average minimum temperature
was 13.0 oC, which was more than the normal i.e 12.6 oC. These temperatures were
favourable for Adsali crop growth. Due to higher humidity (97 %) than the average
(78 %), tillering of preseasonal sugarcane and germination/tillering of Suru
sugarcane was also satisfactory.
4) Desiccation phase (April to May, 2011)
The mean maximum temperature was lower (37.0 oC ) than the normal
(39.9oC) while the mean minimum temperature ( 22.0 oC ) was more than the
normal (21.2oC). The total rainfall received during this phase was 28.5 mm in 2
rainy days.
5) Grand growth for Adsali and Early growth phase for (Preseason and Suru)
(June to Sept., 2011)
During this phase, the average maximum and minimum temperatures were
29.9 oC and 22.9 oC respectively i.e. optimum for crop growth. The total rainfall
received during this phase was 362.4 mm in 28 rainy days as against the normal
rainfall of 371.9 mm. The grand growth of Adsali, preseasonal and Suru sugarcane
was satisfactory due to good rains coupled with high humidity.
6) Flowering and Maturity for Adsali and Preseason /Grand growth phase for Suru
(Oct -Dec., 2011)
During this phase, the mean maximum and minimum temperatures were
31.5 oC and 16.3 oC respectively. Total rainfall received during this phase was 50.8
mm in 2 rainy days as against 165.5 mm average of last 79 years. The high
humidity and optimum temperatures favoured early and profuse flowering for all
season planted crop.
During Jan 2012 to March 2012, the mean maximum and minimum
temperatures were 32.4 oC and 13.1 oC respectively. The high humidity and
optimum temperatures favoured maturity of sugarcane crop.
At maturity of Adsali, preseasonal and Suru sugarcane, the minimum
temperature was more (16.3 oC) than average (15.5 oC) which affected sugarcane
productivity . The overall crop growth during this year was satisfactory due to
favourable climate. However, due to temperature fluctuations there was effect on
cane yield. However, due to more number of cooler days, the sugar recovery was
satisfactory.

The incidence of pests and diseases, in general, was as under.
1) Incidence of insect pests on sugarcane during 2011-12
Sr.No. Name of pest Extent of incidence (%)
1 Early shoot borer 16 to 18
2 Internode borer 18 to 20
3 Top shoot borer 0 to 2
4 Mealy bugs 20 to 30
5 Wooly aphids Traces to Low
6 Scale insect 0 to 2
7 White fly 1 to 2.5
2) Incidence of diseases on sugarcane during 2011-12
Sr.No. Name of disease Extent of incidence (%)
1 Rust 1.0 to 30.0
2 G.S.D 1.0 to 12.00
3 Smut 1.0 to 48.00
4 Ring spot 4.0 to 15.0
5 Pokka boeng 1.0 to 18.0
6 Eye spot 2.0

Table 3. Average weather parameters at CSRS, Padegaon during June 10 to March 12
Sr. No. Temperature (oC) Humidity (%) Sunshine Hrs.
Rainfall (mm)
Rainy days Max. Min. Mor. Eve.
June 10 32.5 22.8 97 75 06.1 222.3 8
1. Germination phase for Adsali crop (Jul. to Sept., 2010)
July 10 28.8 22.2 98 89 02.9 093.9 9
Aug 10 29.6 21.7 98 90 03.6 077.0 8
Sept 10 30.1 21.3 98 88 05.3 149.7 7
Average 29.5 21.7 98 89 03.9 320.6 24
Last 79 yrs avg 29.2 21.8 88 64 4.9 301.6 --
2. Tillering phase (Oct-Dec., 2010) for Adsali/Germination phase for Preseason crop
Oct 10 30.7 20.2 98 83 07.1 193.0 7
Nov 10 29.5 19.9 98 74 06.4 047.1 5
Dec 10 27.5 12.9 97 60 07.8 -- --
Average 29.2 17.7 98 72 07.1 240.1 12
Last 79 yrs avg 31.6 15.5 86 40 09.6 151.8 --
3. Early growth (Adsali)/Tillering (Preseason) and Germination phase (Suru) (Jan-Mar.2011)
Jan 11 28.7 10.3 96 62 07.9 -- --
Feb 11 30.7 12.6 97 74 08.9 -- --
Mar 11 35.2 16.2 98 65 08.3 -- --
Average 31.5 13.0 97 67 08.4 -- --
Last 79 yrs avg 32.4 12.6 78 28 10.0 13.1 --
4. Desiccation phase (April to May, 2011)
April 11 36.9 21.0 94 51 07.3 -- --
May 11 37.1 22.9 93 59 07.9 028.5 3
Average 37.0 22.0 94 55 07.6 28.5 3
Last 79 yrs avg 39.9 21.2 69 26 11.6 69.9 --
5. Grand growth (Adsali)/Early growth phase (Preseason and Suru) (June to Sept., 2011)
June 11 30.6 24.2 95 85 07.5 106.6 7
July 11 29.6 23.4 97 89 03.3 098.3 8
Aug 11 29.3 22.8 97 80 03.0 040.2 7
Sept 11 30.0 21.0 98 77 05.2 117.3 6
Average 29.9 22.9 97 83 04.8 362.4 28
Last 79 yrs avg 30.9 22.0 87 61 05.3 371.9 --
6. Flowering and Maturity (Adsali and Preseason)/Grand growth phase (Suru) (Oct-Dec., 2011)
Oct 11 31.1 20.9 98 72 06.3 050.8 2
Nov 11 30.3 15.8 98 74 08.0 -- --
Dec 11 33.0 12.1 98 75 08.1 -- --
Average 31.5 16.3 98 74 07.5 050.8 2
Last 79 yrs avg 31.6 15.5 86 40 09.6 165.5 --
Jan 12 29.1 11.1 97 85 08.5 -- --
Feb 12 32.5 12.9 97 51 08.6 -- --
Mar 12 35.6 15.2 93 51 07.4 -- --
Average 32.4 13.1 96 62 08.2 -- --
Last 80 yrs avg 32.4 12.6 78 28 10.0 12.9 --

Central Sugarcane Research Station, Padegaon.
Months
Figure 1: Weather parameters 2010 - 2012

Staff Position
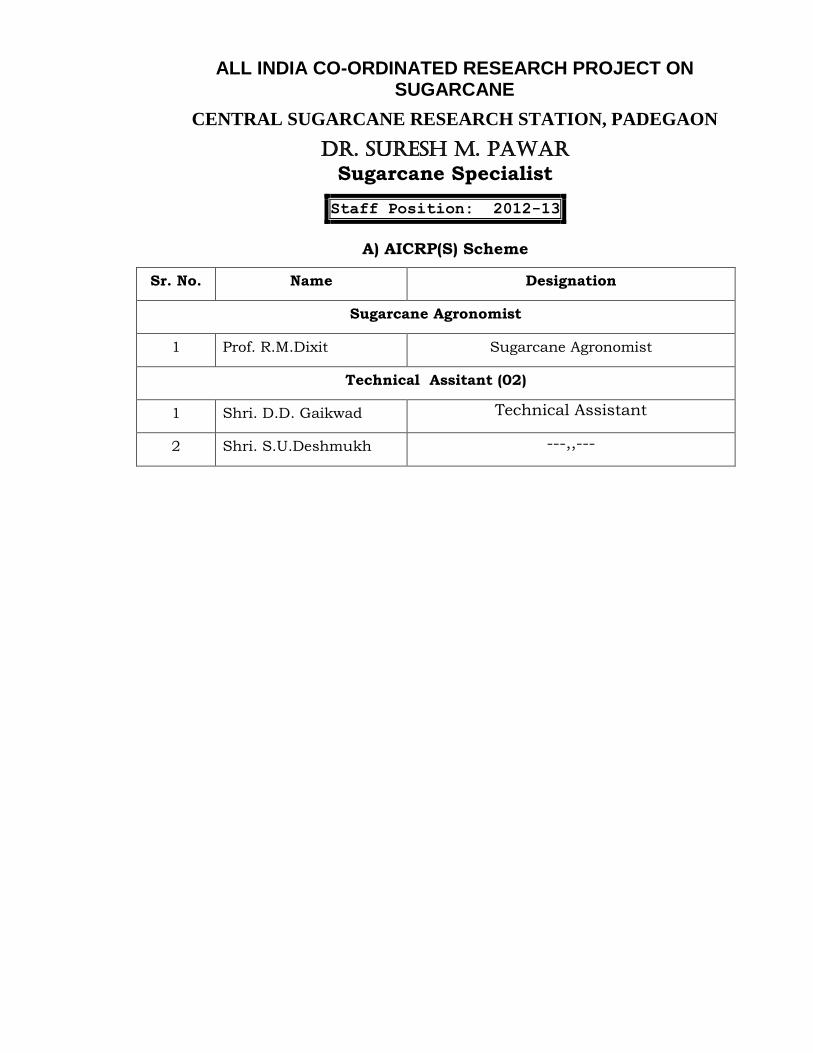
ALL INDIA CO-ORDINATED RESEARCH PROJECT ON SUGARCANE
CENTRAL SUGARCANE RESEARCH STATION, PADEGAON
Dr. Suresh M. Pawar
Sugarcane Specialist
Staff Position: 2012-13
A) AICRP(S) Scheme
Sr. No. Name Designation
Sugarcane Agronomist
1 Prof. R.M.Dixit Sugarcane Agronomist
Technical Assitant (02)
1 Shri. D.D. Gaikwad Technical Assistant
2 Shri. S.U.Deshmukh ---,,---


Research
Highlghts
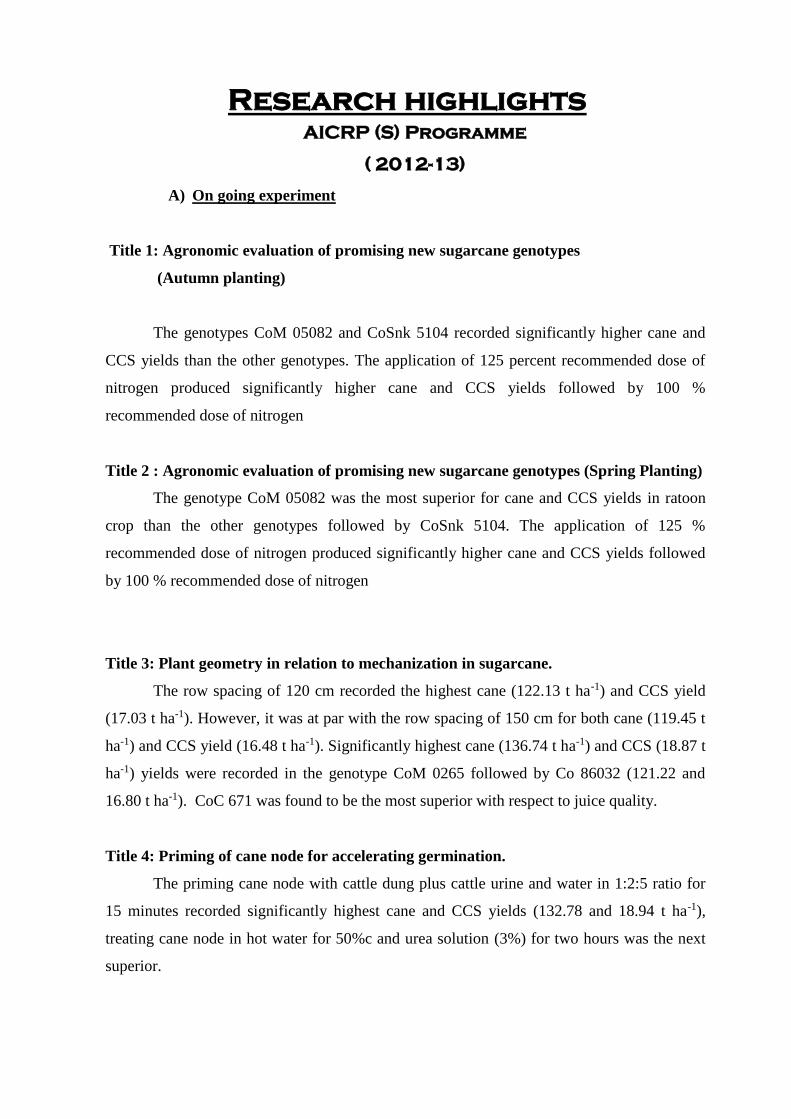
Research highlights
AICRP (S) Programme
( 2012-13)
A) On going experiment
Title 1: Agronomic evaluation of promising new sugarcane genotypes
(Autumn planting)
The genotypes CoM 05082 and CoSnk 5104 recorded significantly higher cane and
CCS yields than the other genotypes. The application of 125 percent recommended dose of
nitrogen produced significantly higher cane and CCS yields followed by 100 %
recommended dose of nitrogen
Title 2 : Agronomic evaluation of promising new sugarcane genotypes (Spring Planting)
The genotype CoM 05082 was the most superior for cane and CCS yields in ratoon
crop than the other genotypes followed by CoSnk 5104. The application of 125 %
recommended dose of nitrogen produced significantly higher cane and CCS yields followed
by 100 % recommended dose of nitrogen
Title 3: Plant geometry in relation to mechanization in sugarcane.
The row spacing of 120 cm recorded the highest cane (122.13 t ha-1) and CCS yield
(17.03 t ha-1). However, it was at par with the row spacing of 150 cm for both cane (119.45 t
ha-1) and CCS yield (16.48 t ha-1). Significantly highest cane (136.74 t ha-1) and CCS (18.87 t
ha-1) yields were recorded in the genotype CoM 0265 followed by Co 86032 (121.22 and
16.80 t ha-1). CoC 671 was found to be the most superior with respect to juice quality.
Title 4: Priming of cane node for accelerating germination.
The priming cane node with cattle dung plus cattle urine and water in 1:2:5 ratio for
15 minutes recorded significantly highest cane and CCS yields (132.78 and 18.94 t ha-1),
treating cane node in hot water for 50%c and urea solution (3%) for two hours was the next
superior.

B) Completed experiment
Title 1: Agronomic evaluation of promising new sugarcane genotypes
(Autumn Pooled)
The genotypes CoM 05082 recorded significantly higher cane and CCS yields than
the other genotypes. However, it was at par with CoSnk 5104 in respect of CCS yield
The application of 125 percent recommended dose of nitrogen produced significantly
higher cane and CCS yields followed by 100 % recommended dose of nitrogen.
Title 2: Agronomic evaluation of promising new sugarcane genotypes
(Spring Pooled)
During spring season the genotype CoM 05082 recorded significantly higher cane and
CCS yields than the other genotypes. However, it was at par with CoSnk 5104 in respect of
CCS yield
The application of 125 percent recommended dose of nitrogen to spring sugarcane
produced significantly higher cane and CCS yields , followed by 100 % recommended dose
of nitrogen .
Research report
on
AICRP(S) Agronomy

Project No. AS – 42
Title 1: Agronomic evaluation of promising new sugarcane genotypes
(Autumn planting)
Objective: To work out Agronomy of sugarcane genotypes from advanced varietal trial
(AVT)
[
Experimental Details :
Place : CSRS, Padegaon,
Design : Split plot,
Replication : 3
Plot Size : Gross : 10 x 6 m2,
Net : 08 x 4 m2,
Fertilizer dose : 340:170:170 kg N, P2O5, K2O ha-1,
Date of planting : 11/11/2011,
Date of harvesting :16/02/2013,
Soil Status : Irrigated, Medium black soil.
Treatment details :
A) Main plot treatments –Genotypes -5
V1 CoSnk 5103
V2 CoM 05082
V3 CoSnk 5104
V4 Co 99004
V5 CoC 671
B) Sub plot treatments – N levels – 3
F1 75% RD of N
F2 100% RD of N
F3 125% RD of N
Results:
The results of the second year of the experiment on cane and CCS yields, growth
observations and quality parameters are presented in Table 1 to 3.
Effect of genotypes:
Data presented in Table 1 revealed that the genotype CoM 05082 recorded the highest
cane (134.40 t ha-1) and CCS yield (18.33 t ha-1). However, it was at par with CoSnk 5104 in
respect of CCS yield (18.16 t ha-1).
Effect of nitrogen levels:
The N levels had a significant effect on both cane and CCS yields. The highest cane
(133.82 t ha-1) and CCS (18.31 t ha-1) yields were recorded with application of 125%
recommended dose of N. However, it was at par with 100% recommanded dose of N in
respect of CCS yield (17.65 t ha-1).

Effect of interactions:
The interactions between genotypes and fertilizer levels were found to be non
significant for both cane and CCS yields.
Growth and yield attributes:
The data regarding growth and yield attributes are presented in Table 2.
Effect of genotypes:
The data presented in Table 2 revealed that the effect of genotypes was significant for
all the parameters except no. of millable canes and average cane weight. The genotype,
CoM 05082 recorded the highest germination (70.58 %), tillering ratio (1.83), millable height
(296 cm), cane girth (9.6 cm), no. of internodes per cane (24), millable canes per hectare
(96750 ha-1) and weight per cane (1.39 kg). However, it was at par with CoSnk 5104 in
respect of germination and cane girth .
Effect of nitrogen levels:
Effect of N levels was significant for the millable height, no. of internodes per cane and
average cane weight. Application of 125% recommended dose of nitrogen recorded the
highest millable height (288 cm), no. of internodes per cane (25.0) and the average cane
weight (1.39 kg) and was significantly superior to other levels. It was closely followed by
100 % recommended dose of nitrogen for all these parameters.
Effect of interactions:
The interactions between genotypes and nitrogen levels in respect of all the parameter
were found to be non significant.
Quality parameters:
The genotypes, N levels and their interactions did not have significant influence on
juice quality parameters (Table 3).
Conclusion:
The genotypes CoM 05082 and CoSnk 5104 recorded significantly higher cane and
CCS yields than the other genotypes. The application of 125 percent recommended dose of
nitrogen produced significantly higher cane and CCS yields followed by 100 %
recommended dose of nitrogen .

Table 1. Cane and CCS yield of sugarcane genotypes at varying N levels
(Autumn Planting)
Treatments Cane yield
(t ha-1)
CCS yield
(t ha-1)
A) Genotypes
V1– CoSnk 5103 128.63 17.55
V2 – CoM 05082 134.40 18.33 V3– CoSnk 5104 130.32 18.16 V4 – Co 99004 123.60 17.29 V5 – CoC 671 122.36 17.01
SE± 0.39 0.18
C.D. at 5% 1.24 0.56
B) N levels
F1 - 75% N 122.24 16.98 F2 - 100% N 127.51 17.65 F3 – 125 % N 133.82 18.31
SE± 2.14 0.29
C.D. at 5% 6.00 0.88
C) Interactions
SE± 4.34 0.38
C.D. at 5% NS NS
C.V. % 6.98 6.74
General Mean 127.86 17.64
Table 2. Growth and yield attributes of sugarcane genotypes at varying N levels
Treatments Germination
%
Tillering
ratio
Height
(cm)
Girth
(cm)
No of
internodes
cane-1
Millable
canes
(000 ha-1)
Avg.
cane
wt. (kg)
A) Genotypes
V1– CoSnk 5103 66.86 1.69 283 9.3 23 94.14 1.34
V2 – CoM 05082 70.58 1.83 296 9.6 24 96.75 1.39
V3– CoSnk 5104 70.57 1.74 285 9.4 23 95.02 1.39
V4 – Co 99004 66.60 1.63 279 9.1 22 94.04 1.29
V5 – CoC 671 64.52 1.54 267 9.0 22 92.71 1.24
SE± 0.80 0.03 1.02 0.08 0.11 1.40 0.04
C.D. at 5% 2.68 0.08 3.09 0.22 0.32 NS NS
B) N levels
F1 - 75% N 65.62 1.64 275 9.0 21 93.52 1.28
F2 - 100% N 67.85 1.69 282 9.3 23 93.60 1.32
F3 – 125 % N 70.03 1.73 288 9.6 25 96.47 1.39
SE± 2.02 0.04 2.22 0.24 0.18 1.86 0.03
C.D. at 5% NS NS 6.50 NS 0.60 NS 0.08
C) Interactions
SE± 4.60 0.06 5.02 0.54 0.58 4.16 0.03
C.D. at 5% NS NS NS NS NS NS NS
General Mean 67.83 1.69 282 9.3 23 94.53 1.33

Table 3. Quality parameters of sugarcane genotypes at varying N levels
Treatments Brix (c ) Sucrose (%) Purity ( %) CCS (%)
A) Genotypes
V1– CoSnk 5103 21.46 19.66 92.23 13.90
V2 – CoM 05082 22.12 19.78 92.79 13.93
V3– CoSnk 5104 21.68 19.73 92.71 13.65
V4 – Co 99004 21.28 19.58 90.49 13.90
V5 – CoC 671 21.12 19.55 90.29 13.63
SE± 0.38 0.18 1.06 0.14
C.D. at 5% NS NS NS NS
B) N levels
F1 - 75% N 21.23 19.62 90.43 13.69
F2 - 100% N 21.40 19.62 91.97 13.83
F3 – 125 % N 21.97 19.73 92.70 13.88
SE± 0.34 0.12 0.88 0.07
C.D. at 5% NS NS NS NS
C) Interactions
SE± 0.54 0.24 0.98 0.16
C.D. at 5% NS NS NS NS
General Mean 21.53 19.65 91.70 13.80
Table 4. Soil properties at harvest in different genotypes at varying N levels
Treatments pH EC
(dsm-1) O.C.%
Available nutrient status (kg ha-1)
N P2O5 K2O
A) Genotypes
V1– CoSnk 5103 8.10 0.36 0.60 186 17.3 263
V2 – CoM 05082 8.11 0.36 0.58 182 16.1 245
V3– CoSnk 5104 8.07 0.35 0.61 183 16.9 255
V4 – Co 99004 8.08 0.38 0.56 188 17.9 269
V5 – CoC 671 8.08 0.40 0.57 194 19.0 277
B) N levels
F1 - 75% N 8.07 0.36 0.59 182 18.3 270
F2 - 100% N 8.08 0.36 0.59 186 17.4 264
F3 – 125 % N 8.11 0.38 0.57 194 16.5 252
General Mean 8.09 0.37 0.58 187 17.4 262
Initial 8.13 0.38 0.66 266 17.8 306

Project No. AS – 42
Title 2 : Agronomic evaluation of promising new sugarcane genotypes (Spring planting)
Objective: To work out Agronomy of sugarcane genotypes from advanced varietal trial (AVT)
Experimental Details :
Place : CSRS, Padegaon,
Design : Split plot,
Replication : 3
Plot Size : Gross : 10 x 6 m2,
Net : 08 x 4 m2,
Fertilizer dose : 250:115:115 kg N, P2O5, K2O ha-1,
Date of planting : 05/01/2012
Date of harvesting :17/02/2013
Soil Status : Irrigated, Medium black soil.
Treatment details :
B) Main plot treatments –Genotypes -5
V1 CoSnk 5103
V2 CoM 05082
V3 CoSnk 5104
V4 Co 99004
V5 CoC 671
B) Sub plot treatments – N levels – 3
F1 75% RD of N
F2 100% RD of N
F3 125% RD of N
Results:
The data on second year trial cane and CCS yields, growth observations and quality
parameters are presented in Table 1 to 3.
Effect of genotypes:
Data presented in Table 1 revealed that the genotype CoM 05082 recorded the highest
cane (119.97 t ha-1) and CCS yield (15.85 t ha-1) and was significantly superior to all other
genotypes. It was followed by CoSnk 5104 (113.30 t ha-1 cane and 15.35 t ha-1 CCS).
Effect of nitrogen levels:
The nitrogen levels had a significant effect on both cane and CCS yields.
Significantly highest cane (121.77 t ha-1) and CCS (16.44 t ha-1) yields were recorded with
application of 125% recommended dose of dose of nitrogen . It was followed by 100 %
recommended dose of nitrogen (112.35 and 15.07 t ha-1).

Effect of interactions:
The interactions between genotypes and fertilizer levels were found to be non
significant for both cane and CCS yields.
Growth and yield attributes:
The data regarding growth and yield attributes are presented in Table 2.
Effect of genotypes:
The data presented in Table 2 revealed that the effect of genotypes was significant for
all the parameters except germination % and millable cane height. The genotype, CoM 05082
recorded the highest germination (70.47 %), tillering ratio (1.63), cane girth (9.4 cm), no. of
internodes per cane (23), millable canes per hectare (1,03,000 ha-1) and weight per cane (1.17
kg). However, it was at par with CoSnk 5104 in respect of cane girth, and average weight per
cane.
Effect of nitrogen levels:
Effect of N levels was significant for the tillering ratio, no. of internodes per cane, NMC
and average cane weight. Application of 125% recommended dose of nitrogen recorded the
highest tillering ratio (1.63), no. of internodes per cane (22), NMC (1,03,080 ha-1) and average
cane weight (1.20 kg cane-1). The 100 % recommended N was at par with 125 % N in respect
of tillering ratio.
Effect of interactions:
The interactions between genotypes and N levels in respect of all the parameter were
found to be non significant.
Quality parameters:
The genotypes, N levels and their interactions did not have any significant influence on
juice quality parameters (Table 3).
Conclusion:
The genotype CoM 05082 was the most superior for cane and CCS yields in ratoon
crop than the other genotypes followed by CoSnk 5104. The application of 125 %
recommended dose of nitrogen produced significantly higher cane and CCS yields followed
by 100 % recommended dose of nitrogen .

Table 1. Cane and CCS yield of sugarcane genotypes at varying N levels
(Spring planting)
Treatments Cane yield
(t ha-1)
CCS yield
(t ha-1)
A) Genotypes
V1– CoSnk 5103 111.14 14.81 V2 – CoM 05082 119.97 15.85 V3– CoSnk 5104 113.30 15.35 V4 – Co 99004 108.61 14.74 V5 – CoC 671 105.94 14.23
SE± 0.52 0.27
C.D. at 5% 1.48 0.78
B) N levels
F1 - 75% N 101.27 13.48
F2 - 100% N 112.35 15.07 F3 – 125 % N 121.77 16.44
SE± 2.11 0.48
C.D. at 5% 5.84 1.02
C) Interactions
SE± 4.18 0.73
C.D. at 5% NS NS
C.V.% 6.62 7.14
General Mean 111.79 15.00
Table 2. Growth and yield attributes of sugarcane genotypes at varying N levels
Treatments Germination
(% )
Tillering
ratio
Height
(cm)
Girth
(cm)
No of
internodes
cane-1
Millable
canes
(000 ha-1)
Avg.
cane wt.
(kg)
A) Genotypes
V1– CoSnk 5103 65.67 1.59 271 9.2 22 97.97 1.13 V2 – CoM 05082 70.47 1.63 281 9.4 23 103.00 1.17 V3– CoSnk 5104 69.20 1.59 278 9.3 22 98.66 1.16 V4 – Co 99004 65.27 1.56 267 9.1 22 97.04 1.12 V5 – CoC 671 65.30 1.55 261 8.7 20 94.66 1.12
SE± 1.85 0.006 8.12 0.06 0.12 0.54 0.003
C.D. at 5% NS 0.015 NS 0.20 0.34 1.63 0.010
B) N levels F1 - 75% N 64.72 1.53 258 8.9 19 93.05 1.09 F2 - 100% N 67.96 1.58 270 9.2 21 98.68 1.16 F3 – 125 % N 68.86 1.63 286 9.3 22 103.08 1.20
SE± 2.03 0.02 9.75 0.20 0.24 0.98 0.012
C.D. at 5% NS 0.05 NS NS 0.68 2.69 0.035
C) Interactions
SE± 4.70 0.08 4.76 0.54 0.53 2.36 0.05
C.D. at 5% NS NS NS NS NS NS NS
General Mean 67.18 1.58 271 9.2 21 98.27 1.13

Table 3. Quality parameters of sugarcane genotypes at varying N levels
Treatments Brix (c ) Sucrose (%) Purity ( %) CCS (%)
A) Genotypes
V1– CoSnk 5103 23.09 19.62 86.97 13.44
V2 – CoM 05082 23.37 19.60 89.05 13.56 V3– CoSnk 5104 21.97 19.54 87.25 13.55 V4 – Co 99004 22.69 19.75 85.06 13.31 V5 – CoC 671 22.54 19.59 84.03 13.21
SE± 1.38 0.88 1.93 0.30
C.D. at 5% NS NS NS NS
B) N levels F1 - 75% N 23.02 19.61 85.29 13.32
F2 - 100% N 22.69 19.62 86.70 13.42 F3 – 125 % N 22.59 19.63 87.42 13.50
SE± 0.36 0.15 1.04 0.10
C.D. at 5% NS NS NS NS
C) Interactions
SE± 0.74 0.31 0.86 0.24
C.D. at 5% NS NS NS NS
General Mean 22.73 19.61 86.47 13.41
Table 4. Soil properties at harvest in different genotypes at varying N levels
Treatments pH
EC
(dsm-1) O.C.%
Available nutrient status (kg ha-1)
N P2O5 K2O
A) Genotypes
V1– CoSnk 5103 8.05 0.32 0.58 181 15.6 240
V2 – CoM 05082 8.06 0.32 0.56 177 14.9 240
V3– CoSnk 5104 8.03 0.31 0.59 178 15.4 248
V4 – Co 99004 8.03 0.34 0.54 183 17.1 262
V5 – CoC 671 8.01 0.36 0.55 189 18.2 272
B) N levels
F1 - 75% N 8.01 0.32 0.56 177 17.7 265
F2 - 100% N 8.03 0.32 0.56 181 15.6 257
F3 – 125 % N 8.07 0.34 0.54 189 15.4 247
General Mean 8.04 0.33 0.55 182 16.2 256
Initial 8.10 0.37 0.68 256 17.9 314

Project No. AS – 63
Title 5: Plant geometry in relation to mechanization in sugarcane.
Objectives: 1. To workout optimum plant geometry for use of farm machinery.
2. To study varietal response to different planting geometry.
Experimental Details:
Place : CSRS, Padegaon,
Design : Split plot,
Replication : 3
Plot Size : Gross : 10 x 6 m2,
Net : 08 x 4 m2,
Fertilizer dose : 250:115:115 kg N, P2O5, K2O ha-1,
Date of planting : 25.02.2012
Date of harvesting :07.03.2013
Soil Status : Irrigated, Medium black soil.
Treatment details :
A) Main plot treatments –-5 inter-row spacings
P1 100 cm row distance
P2 120 cm row distance
P3 150 cm row distance
P4 30 x 150 cm row distance
B) Sub plot treatments – Genotypes -4
V1 CoM 0265
V2 Co 86032
V3 Co 94012
V4 CoC 671
Results:
The data on second year trial on cane and CCS yields, growth observations and
quality parameters are presented in Table 1 to 3.
Effect of planting geometry:
Data presented in Table 1 revealed that the row spacing of 120 cm recorded
significantly highest cane (122.13 t ha-1) and CCS yield (17.03 t ha-1). However, it was at
par with the row spacing of 150 cm for both cane (119.45 t ha-1) and CCS yields (16.48 t
ha-1) respectively.
Effect of genotypes:
Significantly highest cane (136.74 t ha-1) and CCS (18.87 t ha-1) yields were
recorded with the variety, CoM 0265. It was followed by Co 86032 (121.22 and 16.80 t
ha-1).
Effect of interactions:
The interactions between planting geometry and the genotypes in respect of cane
and CCS yields were found to be non significant.
Growth and yield attributes:
The data regarding growth and yield attributes are presented in Table 2.
Effect of planting geometry:
The effect of row spacing was significant for the millable height, cane girth and no.
of millable canes .The row spacing of 120 cm recorded the highest millable height (299
cm) but it was at par with 150 cm row spacing. A similar trend was noticed for the cane
girth (10.7 cm) and no of millable canes ha-1. ( 89030 ha-1. )
Effect of Genotypes:
The effect of genotypes was significant on all the growth parameters except
germination percentage and no.of internodes. The genotype CoM 0265 registered
significantly higher tillering ratio(1.75), millable height (310 cm), cane girth (11.0 cm),
NMC (94250 ha-1) and the average cane weight (1.45 kg cane-1). Co 86032 was the next
superior genotype in respect of all the growth attributes.
Effect of interactions:
The interactions between the planting geometry and genotypes was found to be
non significant for all the growth parameters.
Quality parameters:
The data pertaining to juice quality parameters are presented in Table 3.
Effect of planting geometry:
The effect of planting geometry on juice quality parameters was found to be not
significant.
Effect of Genotypes:
The genotype CoC 671 recorded significantly higher brix (21.94), sucrose
(19.95%) and CCS (14.42%) than the other genotypes.
Effect of interactions:
There were no significant interactions among the planting geometries and the
genotypes for different juice quality parameters.
Conclusion:
The row spacing of 120 cm recorded the highest cane (122.13 t ha-1) and CCS
yield (17.03 t ha-1). However, it was at par with the row spacing of 150 cm for both cane
(119.45 t ha-1) and CCS yields (16.48 t ha-1). Significantly highest cane (136.74 t ha-1)

and CCS (18.87 t ha-1) yields were recorded by the variety CoM 0265 followed by Co
86032 (121.22 and 16.80 t ha-1). The sugarcane variety CoC 671 was found to be the most
superior with respect to juice quality.
Table. 1. Mean cane and CCS yield as affected by various treatments
Treatments Cane yield (t ha-1) CCS yield (t ha-1)
A) Planting geometry
P1 100 cm row distance 112.09 15.69
P2 120 cm row distance 122.13 17.03
P3 150 cm row distance 119.45 16.48
P4 30 x 150 cm row distance 107.52 14.81
SE+ 1.64 0.42
C.D at 5% 4.78 1.14
B) Genotypes
V1 CoM 0265 136.74 18.87
V2 Co 86032 121.22 16.80
V3 Co 94012 104.12 14.42
V4 CoC 671 99.18 13.90
SE+ 2.64 0.65
C.D at 5% 7.18 1.78
C) Interaction
SE+ 5.02 0.85
C.D at 5% NS NS
General mean 115.30 16.00

Table 2. Growth and yield attributes as affected by various treatments.
Treatments Germ.
(% )
Tillering
ratio
Height
(cm)
Girth
(cm)
No. of
internodes
cane-1
Millable
canes
(000ha-1)
Wt.
cane-1
(kg)
A) Planting geometry
P1 100 cm row distance 73.69 1.54 295 10.3 27 82.34 1.36
P2 120 cm row distance 75.32 1.69 299 10.7 28 89.03 1.39 P3 150 cm row distance 75.02 1.64 297 10.4 28 86.94 1.37
P4 30 x 150 cm row
distance 72.27 1.55 281 9.8 25 80.52 1.31
S.E.+ 1.03 0.05 1.04 0.12 1.68 1.36 0.02
C.D. at 5% NS NS 3.20 0.35 NS 3.75 NS
B) Genotypes
V1 CoM 0265 75.96 1.75 310 11.0 30 94.25 1.45 V2 Co 86032 75.18 1.66 300 10.6 28 86.70 1.39 V3 Co 94012 73.57 1.56 286 10.1 26 80.33 1.31
V4 CoC 671 71.51 1.46 276 9.6 25 77.55 1.28
S.E.+ 1.98 0.06 2.18 0.15 1.88 1.68 0.03
C.D. at 5% NS 0.15 5.68 0.42 NS 4.72 0.10
C ) Interaction
S.E.+ 4.01 0.08 4.72 0.52 2.56 4.34 0.05
C.D. at 5% NS NS NS NS NS NS NS
General mean 74.07 1.61 293 10.3 27 84.71 1.36
Table 3. Quality parameters as affected by various treatments.
Treatments Brix(c ) Sucrose (%) Purity( %) CCS (%)
A) Planting geometry
P1 100 cm row distance 21.47 19.80 92.76 14.00
P2 120 cm row distance 21.17 19.73 92.77 13.95 P3 150 cm row distance 21.26 19.61 91.89 13.80 P4 30 x 150 cm row
distance 21.22 19.49 92.64 13.78
S.E.+ 0.14 0.12 0.78 0.28
C.D. at 5% NS NS NS NS
B) Genotypes
V1 CoM 0265 21.09 19.54 92.52 13.80 V2 Co 86032 21.55 19.62 92.70 13.86 V3 Co 94012 20.53 19.52 91.79 13.45
V4 CoC 671 21.94 19.95 93.04 14.42
S.E.+ 0.12 0.08 0.62 0.16
C.D. at 5% 0.34 0.24 NS 0.50
C) Interaction
S.E.+ 0.35 0.26 0.85 0.33
C.D. at 5% NS NS NS NS
General mean 21.27 19.65 92.51 13.88

Project No. : AS 66
Title : Priming of cane node for accelerating germination.
Objective :
1) To find out suitable cane node priming technique.
2) To assess the effect of cane node on acceleration of germination
Experimental details:
Place : CSRS, Padegaon,
Design : Randomized Block Design
Replication : 4
Plot Size : Gross : 10 x 6 m2,
Net : 08 x 4 m2,
Variety : Phule 265
Date of planting : 25.02.2012
Date of harvesting :07.03.2013
Soil Status : Irrigated, Medium black soil.
Treatments: 6
T1 : Un-primed cane node.
T2 :Treating cane node in hot water in 50oc for 2 hours.
T3 : Treating cane node in hot water in 50oc and urea solution (3%) for 2hours
T4 : Priming cane node with cattle dung, cattle urine and water in 1:2:5 ratio
T5 : Conventional 3 bud setts planting.
T6 : Primed and sprouted cane node ( Incubated for four days after priming )
( put the single cane node in the slurry of cattle dung, cattle urine and water
for 15 minutes. take out the buds and put in decomposedFYM and covered it
with sugarcane trash for 4-5 days for sprouting.)
Results :
The data of first year trial on cane and CCS yields, growth bservations and
quality parameters of different treatments are presented in Table 1 & 2.
Effect of cane and CCS yields:
The data on cane and CCS yields presented in Table 1 revealed that the treatment T4
i.e. Priming cane node with cattle dung plus cattle urine and water in 1:2:5 ratio
recorded significantly highest cane and CCS yield (132.78 and 18.94 t/ha). However, it
was at par with the treatment T3 i.e. Treating cane node in hot water in 50oc and urea
solution (3%) for 2 hours with respect to cane and ccs yield (129.97 and 18.44 t/ha),T2
i.e.Treating cane node in hot water in 50oc for 2 hours. (127.36 and 17.26 t/ha) and T5
i.e. Conventional 3 bud setts planting. (122.78 and 17.35 t/ha).

Growth and yield attributes:
The data regarding growth and yield attributes are presented in Table 2 .The data
revealed that Priming cane node with cattle dung plus cattle urine and water in 1:2:5
ratio recorded significantly higher germination (73.80 %), tillering ratio (1.72), millable
height (299 cm), cane girth (11.0 cm), internodes (25) ,millable canes (116140/ha) and
weight per cane (1.17 kg).
Quality parameters:
The data regarding juice quality parameters are presented in Table 2 revealed that
the treatment T4 i.e. Priming cane node with cattle dung, cattle urine and water in
1:2:5 ratio recorded the significantly highest brix (22.23), sucrose (20.31 %), and
CCS (14.27 %).While purity(92.12%) was recorded significantly highest by the
treatment T5 i e. Conventional 3 bud setts planting.
Conclusion:
The Priming cane node with cattle dung plus cattle urine and water in 1:2:5
ratio for 15 minutes recorded significantly highest cane and CCS yields (132.78 and
18.94 t/ha), treating cane node in hot water for 50oc and urea solution (3%) for 2 hours
was the next superior.
Table 1. Mean cane and CCS yields as affected by various treatments
Treatment Cane yield
(t/ha)
CCS yield
(t/ha))
T1 : Un-primed cane node. 115.26 15.71
T2 :Treating cane node in hot water in 50oc for 2 hours. 127.36 17.26
T3 : Treating cane node in hot water in 50oc urea solution (3%)
for 2hours 129.97 18.44
T4 : Priming cane node with cattle dung, cattle urine and water in
1:2:5 ratio 132.78 18.94
T5 : Conventional 3 bud setts planting. 122.78 17.35
T6 Primed and sprouted cane node ( Incubated for four days
after priming ) 118.00 16.28
SE+ 4.06 0.58
C.D at 5% 12.23 1.73
CV% 10.53 11.64
General Mean 124.36 17.33

Table : 2 Growth and juice quality attributes as affected by various treatments
Treatments Germ.
(%)
Tillering
ratio
Height
(cm)
Girth
(cm)
No. of
interno
des
Millable
canes
(000 ha)
Av.
cane wt.
(kg)
Brix
(c )
Sucrose
(%)
Purity
(%)
CCS
(%)
T1 : Un-primed cane node. 62.55 1.48 275 9.0 21 107909 1.09 20.73 19.27 93.00 13.64
T2 :Treating cane node in hot
water in 50oc for 2 hours. 69.30 1.58 281 9.5 23 113011 1.13 20.35 19.09 93.90 13.57
T3 : Treating cane node in hot
water in 50oc urea solution
(3%) for 2hours
71.90 1.61 289 10.0 25 114824 1.13 21.23 19.95 94.01 14.19
T4 : Priming cane node with
cattle dung, cattle urine and
water in 1:2:5 ratio
73.80 1.72 299 11.0 25 116140 1.14 22.23 20.31 91.41 14.27
T5 : Conventional 3 bud setts
planting. 67.53 1.32 265 9.5 21 111329 1.11 20.10 19.56 97.37 14.12
T6 Primed and sprouted cane
node ( Incubated for four
days after priming )
64.08 1.27 261 9.2 19 107175 1.10 20.23 19.28 95.35 13.80
SE+ 3.34 0.03 3.20 0.35 2.88 3889 0.05 0.21 0.03 1.02 0.08
C.D at 5% 10.07 0.09 9.64 1.05 8.68 11722 0.16 0.63 0.08 3.08 0.24
General Mean 68.19 1.50 278 9.7 22 111731 1.12 20.81 19.58 94.17 13.93

SOil Science
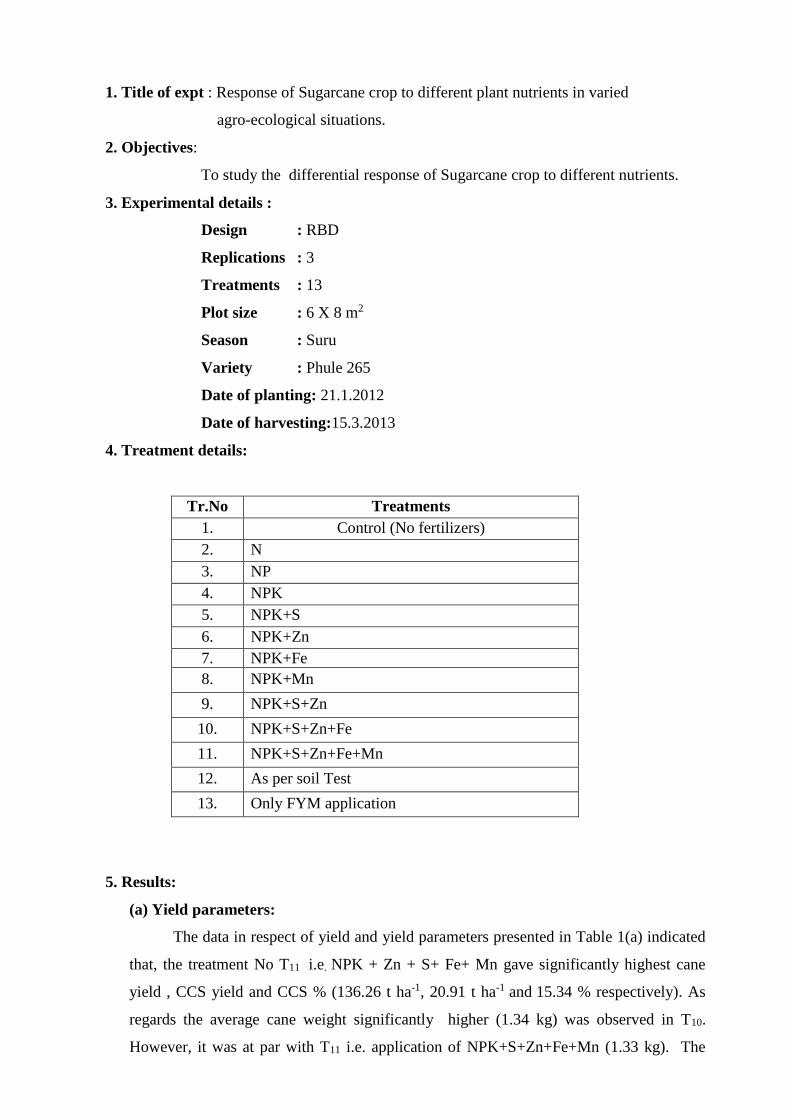
1. Title of expt : Response of Sugarcane crop to different plant nutrients in varied
agro-ecological situations.
2. Objectives:
To study the differential response of Sugarcane crop to different nutrients.
3. Experimental details :
Design : RBD
Replications : 3
Treatments : 13
Plot size : 6 X 8 m2
Season : Suru
Variety : Phule 265
Date of planting: 21.1.2012
Date of harvesting:15.3.2013
4. Treatment details:
Tr.No Treatments
1. Control (No fertilizers)
2. N
3. NP
4. NPK
5. NPK+S
6. NPK+Zn
7. NPK+Fe
8. NPK+Mn
9. NPK+S+Zn
10. NPK+S+Zn+Fe
11. NPK+S+Zn+Fe+Mn
12. As per soil Test
13. Only FYM application
5. Results:
(a) Yield parameters:
The data in respect of yield and yield parameters presented in Table 1(a) indicated
that, the treatment No T11 i.e. NPK + Zn + S+ Fe+ Mn gave significantly highest cane
yield , CCS yield and CCS % (136.26 t ha-1, 20.91 t ha-1 and 15.34 % respectively). As
regards the average cane weight significantly higher (1.34 kg) was observed in T10.
However, it was at par with T11 i.e. application of NPK+S+Zn+Fe+Mn (1.33 kg). The

results on the number of millable canes indicated that the treatment T6 was the most
superior.
(b) Soil chemical properties :
All the chemical properties of soil were significantly influenced by the treatments
(Table1(b)). The least pH of 7.30 was recorded in T13. The lowest EC of 1.51 dSm-1 was
recorded in T1. As regards the soil O.C. content, T11 and T12 (1.03 % each) were the
superior. The available N status of soil was the highest in case of T9 (207.05 kg ha-1)
whereas T12 ( 27.07 kg ha-1) was superior in respect of available P status of soil. The
treatment T12 recorded the highest available K (249.71 kg ha-1) in soil.
(c) Nutrient uptake :
Data presented in Table 1(c) indicated that significantly higher uptake of NPK
was noticed when NPK fertilizer with micronutrients was applied through (T12) which
was superior to all other treatments. In general, 1.72 to 3.04 Kg N, 0.24 to 0.41 Kg P and
2.00 to 3.06 Kg K were required to produce one ton of cane yield.
(d) Conclusion:
Considering the higher yields of cane , commercial cane sugar and CCS %, the
application of recommended dose of NPK along with ferrous sulphate, Zinc sulphate,
Manganese Sulphate and Sulphur found to be superior than other treatments.
Table 1(a). Effect of different treatments on yield and yield parameters of
sugarcane.
Treat. Yield
(t ha-1)
CCS
(t ha-1)
ACW
(kg)
NMC
(000 ha-1)
CCS %
T1 66.30 9.52 0.99 67.35 14.35
T2 88.45 12.46 1.01 87.50 14.09
T3 98.30 14.14 1.07 92.93 14.38
T4 108.70 15.49 1.05 103.65 14.25
T5 115.40 17.04 1.08 107.68 14.77
T6 120.45 16.98 1.08 112.09 14.10
T7 114.13 16.67 1.12 101.94 14.60
T8 110.52 16.44 1.06 104.29 14.87
T9 119.40 17.90 1.27 94.12 14.99
T10 128.96 19.47 1.34 96.55 15.10
T11 136.26 20.91 1.33 102.90 15.34
T12 112.91 16.87 1.26 90.53 14.94
T13 74.56 10.78 1.02 73.04 14.46
SE+ 3.28 0.52 0.028 2.85 0.075
CD at 5% 9.58 1.51 0.081 8.33 0.21
CV 5.30 5.71 4.30 5.20 0.89

Table 1(b). Effect of different treatments on soil chemical properties at harvest
Treat. pH EC
(dS m-1)
Org. C.
(%)
Av. Nutrients
( kg ha-1)
N P K
Initial 7.28 1.61 0.87 176 22 182
T1 7.51 1.51 0.86 167.76 20.82 173.79
T2 7.43 1.59 0.91 195.51 21.70 204.43
T3 7.50 1.65 0.91 201.64 23.09 212.02 T4 7.40 1.66 0.99 201.09 23.84 228.19
T5 7.46 1.56 0.91 202.14 22.36 235.78
T6 7.36 1.64 1.00 196.71 24.23 236.30
T7 7.33 1.62 0.94 198.70 23.60 239.65
T8 7.41 1.63 0.93 199.63 24.73 242.18
T9 7.40 1.54 0.96 207.05 25.63 236.38
T10 7.44 1.61 1.01 200.52 25.62 240.71
T11 7.40 1.65 1.03 200.48 26.05 244.08
T12 7.49 1.68 1.03 203.68 27.07 249.71
T13 7.30 1.53 0.89 187.56 22.32 179.95
SE+ 0.01 0.01 0.03 1.46 0.34 0.84
CD at 5% 0.03 0.03 0.08 4.25 1.01 2.44
Table 1(c). Effect of different treatments on nutrient uptake by sugarcane
Treat. kg ha-1 kg t -1
N P K N P K
T1 200.97 27.20 202.40 3.04 0.41 3.06
T2 228.72 28.08 233.04 2.59 0.32 2.64
T3 234.85 29.47 240.63 2.39 0.30 2.45
T4 234.30 30.22 256.80 2.16 0.28 2.36
T5 235.35 28.74 264.39 2.04 0.25 2.29
T6 229.92 30.61 264.91 1.91 0.25 2.20
T7 231.91 29.98 268.26 2.03 0.26 2.35
T8 232.84 31.11 270.79 2.11 0.28 2.45
T9 240.26 32.01 264.99 2.01 0.27 2.22
T10 233.73 32.00 269.32 1.81 0.25 2.09
T11 233.69 32.43 272.69 1.72 0.24 2.00
T12 236.89 33.45 278.32 2.10 0.30 2.47
T13 220.77 28.70 208.56 2.97 0.39 2.80
SE+ 1.45 0.34 0.83 -- -- --
CD at 5% 4.25 1.01 2.43 -- -- --

Table 2 (a). Cost of different inputs (Rs./ha)
Table 2(b). Economics of different treatments
Treat. Yield
(t ha-1)
Gross monetary returns
( Rs. ha-1)
Prod. cost
( Rs. ha-1)
Net returns
( Rs. ha-1)
B : C
Ratio
T1 66.30 ---- 79850 65790 0.82
T2 88.45 194597 132904 61693 0.46
T3 98.30 216260 138654 77606 0.56
T4 108.70 239140 142042 97098 0.68
T5 115.40 253880 142322 111558 0.78
T6 120.45 264983 142105 122877 0.86
T7 114.13 251093 142087 109197 0.77
T8 110.52 243144 142087 101057 0.71
T9 119.40 262687 142385 120295 0.84 T10 128.96 283705 142430 141275 0.99 T11 136.26 299779 142474 157305 1.10 T12 112.91 248395 118056 130339 1.10
T13 74.56 164039 129850 34189 0.26
SE + 1.96 4315.578 ---- 4315.578 0.12
CD at 5 % 5.72 12596.16 ---- 12596.16 0.36
Rates of fertilizers:
Urea = Rs. 5.63 kg -1 SSP = Rs.8.00 kg -1 MOP = Rs. 17.64 kg -1
PMC = Rs.500/ ton Vermicompost = Rs. 5000/ ton FYM = Rs. 3700/ton
FeSO4 = 8.90/kg ZnSO4 = 31.70/ kg
Cost of cultivation: Rs.79,850 ha -1 (Excluding cost of fertilizers)
Cane price: Rs. 2200 t -1
Treat Cost of
FYM
(Rs.)
Nutrient applied
(kg ha-1)
Fert.
cost
(Rs)
Cost of
Cultivation
(Rs)
Production
Cost
(Rs) N P K
T1 0 0 0 0 0 79850 79850
T2 50000 250 0 0 53054 79850 132904
T3 50000 250 115 0 58804 79850 138654
T4 50000 250 115 115 62192 79850 142042
T5 50000 250 115 115 62472 79850 142322
T6 50000 250 115 115 62255 79850 142105
T7 50000 250 115 115 62237 79850 142087
T8 50000 250 115 115 62237 79850 142087
T9 50000 250 115 115 62535 79850 142385
T10 50000 250 115 115 62580 79850 142430
T11 50000 250 115 115 62624 79850 142474
T12 25000 313 115 115 38206 79850 118056
T13 50000 0 0 0 50000 79850 129850

Project No. AS – 42
Title 1: Agronomic evaluation of promising new sugarcane genotypes
(Autumn Pooled)
Objective: To work out Agronomy of sugarcane genotypes selected from advanced varietal
trial (AVT)
Experimental Details : Place : CSRS, Padegaon,
Design : Split plot,
Main Plot : 5
Sub Plot : 3
Replication : 3
Plot Size : Gross : 10 x 6 m2,
Net : 08 x 4 m2,
Fertilizer dose : 340:170:170 kg N, P2O5, K2O ha-1,
for Planting
Date of planting : 09.12.2010
Date of harvesting :11.02.2012
Date of planting : 11.11.2011
Date of harvesting :16.02.2013
Soil Status : Irrigated, Medium black soil.
Treatment details :
B) Main plot treatments –Genotypes -5
V1 CoSnk 5103
V2 CoM 05082
V3 CoSnk 5104
V4 Co 99004
V5 CoC 671
B) Sub plot treatments – N levels – 3
F1 75% RD of N
F2 100% RD of N
F3 125% RD of N
Results:
The pooled data pertaining to cane and CCS yield, growth observation and quality
parameters are presented in table 1 to 3.
Effect of genotypes:
Pooled data presented in Table 1 revealed that the genotype CoM 05082 produced
significantly highest cane and CCS yields (135.70 and 18.35 t ha-1,respectively) than rest of
the genotypes. However, it was at par with CoSnk 5104 in respect of CCS yield (17.99 t ha-1).
Effect of nitrogen levels:
The application of 125% of recommended fertilizer dose of nitrogen to autumn
sugarcane produced significantly higher cane and CCS yield (135.23 and 18.40 t ha-

1,respectively) than rest of the nitrogen levels.However, it was at par with 100% of
recommanded fertilizer dose of nitrogen in respect of CCS yield (17.70 t ha-1).
Effect of interactions: The interactions between genotypes and fertilizer levels for the
pooled cane and CCS yields were found to be non significant.
Growth and yield attributes: The pooled mean data regarding growth and yield attributes
are presented in Table 2.
Effect of genotypes:
The pooled mean data revealed that the genotype CoM 05082 recorded significantly
highest germination (71.76%), tillaring ratio (1.84), millible height (298 cm), cane girth (9.8
cm), no of internodes per cane (25) . However, it was at par with CoSnk 5104 in respect of
germination, milliable height and no of internodes per cane. The effect between genotypes
were found to be non significant regarding millable canes and avarage cane weight.
Effect of nitrogen levels:
Application of 125% of recommended dose of nitrogen to autumn sugarcane recorded
significantly highest millable height (288 cm), cane girth (9.7 cm), no. of internodes per cane
(26) and the average cane weight (1.40 kg) than other levels. It was followed by 100 %
recommended dose of nitrogen in all these parameters.
Effect of interactions:
In pooled results, interaction effect between the genotypes and nitrogen levels were
non significant in all these parameters.
Quality parameters:
The genotypes ,nitrogen levels and their interactions did not have significant influence
on juice quality parameters (Table. 3)
Conclusion:
The genotypes CoM 05082 recorded significantly higher cane and CCS yields than
the other genotypes. However, it was at par with CoSnk 5104 in respect of CCS yield
The application of 125 percent recommended dose of nitrogen produced significantly
higher cane and CCS yields followed by 100 % recommended dose of nitrogen.
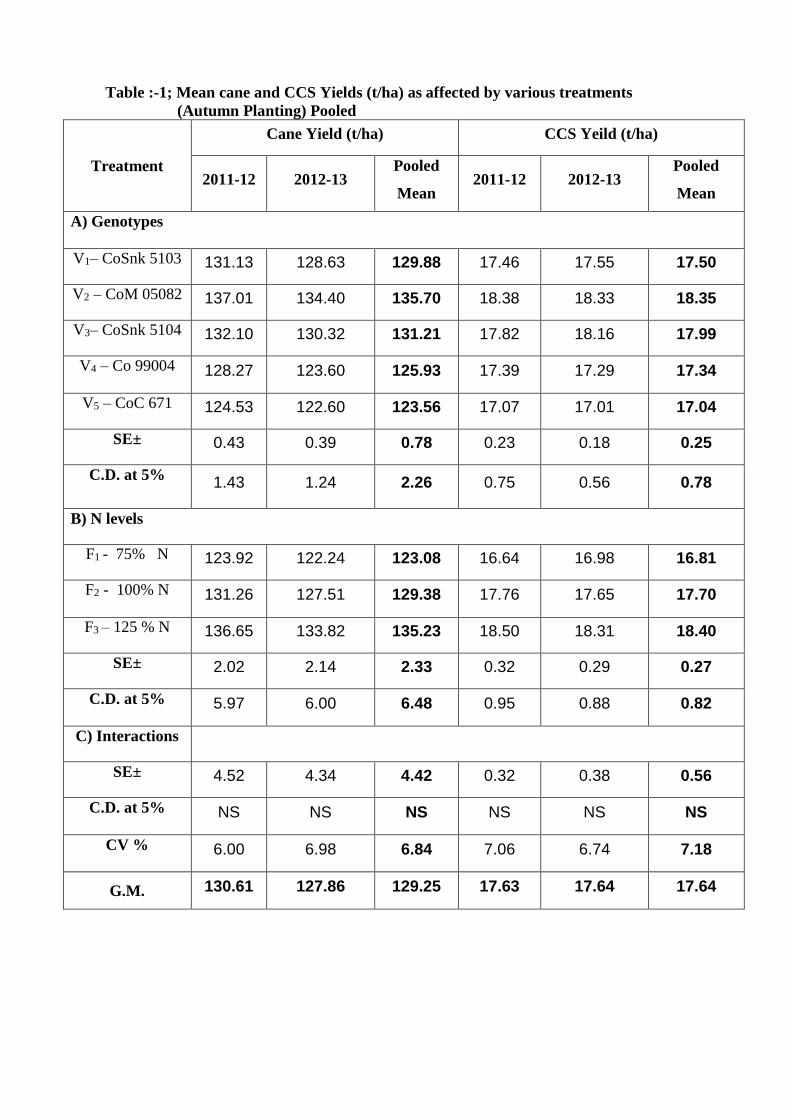
Table :-1; Mean cane and CCS Yields (t/ha) as affected by various treatments
(Autumn Planting) Pooled
Treatment
Cane Yield (t/ha) CCS Yeild (t/ha)
2011-12 2012-13 Pooled
Mean 2011-12 2012-13
Pooled
Mean
A) Genotypes
V1– CoSnk 5103 131.13 128.63 129.88 17.46 17.55 17.50
V2 – CoM 05082 137.01 134.40 135.70 18.38 18.33 18.35
V3– CoSnk 5104 132.10 130.32 131.21 17.82 18.16 17.99
V4 – Co 99004 128.27 123.60 125.93 17.39 17.29 17.34
V5 – CoC 671 124.53 122.60 123.56 17.07 17.01 17.04
SE± 0.43 0.39 0.78 0.23 0.18 0.25
C.D. at 5% 1.43 1.24 2.26 0.75 0.56 0.78
B) N levels
F1 - 75% N 123.92 122.24 123.08 16.64 16.98 16.81
F2 - 100% N 131.26 127.51 129.38 17.76 17.65 17.70
F3 – 125 % N 136.65 133.82 135.23 18.50 18.31 18.40
SE± 2.02 2.14 2.33 0.32 0.29 0.27
C.D. at 5% 5.97 6.00 6.48 0.95 0.88 0.82
C) Interactions
SE± 4.52 4.34 4.42 0.32 0.38 0.56
C.D. at 5% NS NS NS NS NS NS
CV % 6.00 6.98 6.84 7.06 6.74 7.18
G.M. 130.61 127.86 129.25 17.63 17.64 17.64

Table 2. Growth and yield attributes of sugarcane genotypes at varying N levels
Treatments Germinati
on
Tillering
ratio
Height
(cm)
Girth
(cm)
No of
internodes
cane-1
Millable
canes
(000 ha-1)
Avg.
cane
wt. (kg)
A) Genotypes
V1– CoSnk 5103 68.10 1.69 280 9.4 24 93.66 1.38
V2 – CoM 05082 71.76 1.84 298 9.8 25 94.05 1.40 V3– CoSnk 5104 71.43 1.75 267 9.4 25 95.87 1.35 V4 – Co 99004 67.46 1.67 294 9.3 23 95.96 1.39 V5 – CoC 671 65.76 1.56 271 9.3 21 95.36 1.31
SE± 0.77 0.02 1.10 0.09 0.14 1.36 0.05
C.D. at 5% 2.56 0.05 3.18 0.24 0.35 NS NS
B) N levels
F1 - 75% N 66.70 1.67 275 9.2 22 93.65 1.31
F2 - 100% N 68.98 1.70 283 9.3 25 94.46 1.37 F3 – 125 % N 71.04 1.74 288 9.7 26 96.81 1.40
SE± 2.14 0.06 2.34 0.28 0.28 1.90 0.02
C.D. at 5% NS NS 6.43 NS 0.87 NS 0.07
C) Interactions
SE± 4.58 0.08 4.94 0.48 0.62 3.18 0.04
C.D. at 5% NS NS NS NS NS NS NS
General Mean 68.90 1.70 282 9.4 24 94.97 1.36
Table 3.Quality parameters of sugarcane genotypes at varying N levels
Treatments Brix (c ) Sucrose (%) Purity ( %) CCS (%)
A) Genotypes
V1– CoSnk 5103 22.25 19.78 86.55 13.74 V2 – CoM 05082 22.05 19.73 89.62 13.76
V3– CoSnk 5104 21.73 19.66 91.43 13.81 V4 – Co 99004 21.71 19.69 91.12 13.74 V5 – CoC 671 21.49 19.68 91.55 13.89
SE± 0.52 0.23 1.27 0.18
C.D. at 5% NS NS NS NS
B) N levels
F1 - 75% N 21.83 19.71 90.75 13.78 F2 - 100% N 21.63 19.69 91.38 13.90 F3 – 125 % N 22.10 19.72 88.04 13.68
SE± 0.68 0.27 1.30 0.09
C.D. at 5% NS NS NS NS
C) Interactions
SE± 0.72 0.33 1.66 0.20
C.D. at 5% NS NS NS NS
General Mean 21.85 19.70 90.05 13.78

Project No. AS – 42
Title 1: Agronomic evaluation of promising new sugarcane genotypes
(Spring Pooled)
Objective: To work out Agronomy of sugarcane genotypes selected from advanced varietal
trial (AVT)
Experimental Details : Place : CSRS, Padegaon
Design : Split plot
Main Plot : 5
Sub Plot : 3
Replication : 3
Plot Size : Gross : 10 x 6 m2,
Net : 08 x 4 m2,
Fertilizer dose : 250:115:115 kg N, P2O5, K2O ha-1,
for Planting
Date of planting : 19.01.2011
Date of harvesting :13.02.2012
Date of planting : 05.01.2012
Date of harvesting :17.02.2013
Soil Status : Irrigated, Medium black soil.
Treatment details :
C) Main plot treatments –Genotypes -5
V1 CoSnk 5103
V2 CoM 05082
V3 CoSnk 5104
V4 Co 99004
V5 CoC 671
B) Sub plot treatments – N levels – 3
F1 75% RD of N
F2 100% RD of N
F3 125% RD of N
Results:
The pooled data pertaining to cane and CCS yield, growth observation and quality
parameters of two plant and one ratoon are presented in table 1 to 3.
Effect of genotypes:
Pooled data presented in Table 1 revealed that the genotype CoM 05082 produced
significantly highest cane and CCS yields (120.82 and 16.00 t ha-1,respectively) than rest of
the genotypes. However, it was at par with CoSnk 5104 in respect of CCS yield (15.41 t ha-1).
Effect of nitrogen levels:
The application of 125% of recommended fertilizer dose of nitrogen to spring
sugarcane produced significantly higher cane and CCS yield (122.66 and 16.50 t ha-

1,respectively) than rest of nitrogen levels. It was followed by 100% of recommanded dose
of nitrogen.
Effect of interactions:
The interactions between genotypes and nitrogen levels for the pooled cane and CCS
yields were found to be non significant.
Growth and yield attributes:
The pooled mean data regarding growth and yield attributes are presented in Table 2.
Effect of genotypes:
The pooled mean data revealed that the genotype CoM 05082 recorded significantly
highest germination (71.36%), tillaring ratio (1.63), millible height (282 cm), cane girth (9.7
cm) and number of internodes per cane (23) . However, it was at par with CoSnk 5104 in
respect of germination, tillering ratio , milliable height and cane girth . The effect between
genotypes were found to be non significant regarding millable canes and avarage cane
weight.
Effect of nitrogen levels:
Application of 125% of recommended dose of nitrogen to spring sugarcane
recorded significantly highest millable height (285 cm), no. of internodes per cane (23) and
the average cane weight (1.20 kg) than other levels. It was followed by 100 %
recommended dose of nitrogen in all these parameters.
Effect of interactions:
In pooled results, interaction effect between the genotypes and nitrogen levels were
non significant in all these parameters.
Quality parameters:
The genotypes ,nitrogen levels and their interactions did not have significant influence
on juice quality parameters (Table 3)
Conclusion:
During spring season the genotype CoM 05082 recorded significantly higher cane
and CCS yields than the other genotypes. However, it was at par with CoSnk 5104 in respect
of CCS yield. The application of 125 % recommended dose of nitrogen to spring sugarcane
produced significantly higher cane and CCS yields , followed by 100 % recommended dose
of nitrogen .

Table :-1; Mean cane and CCS Yields (t/ha) as affected by various treatments
(Spring pooled)
Treatment Cane Yield (t/ha) CCS Yeild (t/ha)
A) Genotypes 2011-12 2012-13
Pooled
Mean 2011-12 2012-13
Pooled
Mean
V1– CoSnk 5103 113.00 111.14 112.07 14.91 14.81 14.86
V2 – CoM 05082 121.67 119.97 120.82 16.15 15.85 16.00
V3– CoSnk 5104 115.67 113.30 114.48 15.47 15.35 15.41
V4 – Co 99004 110.24 108.61 109.42 14.85 14.74 14.79
V5 – CoC 671 107.54 105.94 106.74 14.50 14.23 14.36
SE± 0.37 0.52 0.84 0.13 0.27 0.25
C.D. at 5% 1.23 1.48 2.36 0.43 0.78 0.72
B) N levels
F1 - 75% N 103.25 101.27 102.26 13.77 13.48 13.62
F2 - 100% N 114.02 112.35 113.18 15.19 15.07 15.13
F3 – 125 % N 123.55 121.77 122.66 16.57 16.44 16.50
SE± 2.16 2.11 2.28 0.32 0.48 0.38
C.D. at 5% 6.39 5.84 6.94 0.94 1.02 1.12
C) Interactions
SE± 4.84 4.18 4.38 0.71 0.73 0.83
C.D. at 5% NS NS NS NS NS NS
CV% 7.18 6.62 6.42 6.78 7.14 7.15
G.M. 113.61 111.79 112.70 15.18 15.00 15.08

Table 2. Growth and yield attributes of sugarcane genotypes at varying N levels
Treatments Germination
%
Tillering
ratio
Height
(cm)
Girth
(cm)
No of
internodes
cane-1
Millable
canes
(000 ha-1)
Avg.
cane
wt. (kg)
A) Genotypes
V1– CoSnk 5103 67.66 1.57 259 9.2 22 98.09 1.15
V2 – CoM 05082 71.36 1.63 282 9.7 23 97.65 1.18 V3– CoSnk 5104 69.90 1.60 274 9.6 22 96.27 1.16 V4 – Co 99004 66.13 1.58 281 9.5 23 95.91 1.15 V5 – CoC 671 66.06 1.55 262 8.8 20 93.97 1.17
SE± 0.90 0.01 2.48 0.05 0.18 2.12 0.09
C.D. at 5% 2.48 0.03 7.18 0.14 0.47 NS NS
B) N levels
F1 - 75% N 65.68 1.53 258 8.9 20 89.13 1.13 F2 - 100% N 68.78 1.58 271 9.4 23 98.29 1.15
F3 – 125 % N 70.22 1.64 285 9.6 23 101.73 1.20
SE± 2.14 0.24 2.62 0.26 0.36 3.87 0.015
C.D. at 5% NS NS 7.54 NS 1.06 NS 0.036
C) Interactions
SE± 4.63 0.05 5.44 0.47 0.64 4.56 0.06
C.D. at 5% NS NS NS NS NS NS NS
General Mean 68.22 1.58 271 9.3 22 96.38 1.16
Table 3. Quality parameters of sugarcane genotypes at varying N levels
Treatments Brix (c ) Sucrose (%) Purity ( %) CCS (%)
A) Genotypes
V1– CoSnk 5103 22.68 19.69 86.98 13.49 V2 – CoM 05082 22.73 19.67 86.93 13.47 V3– CoSnk 5104 21.71 19.58 90.29 13.62
V4 – Co 99004 22.13 19.67 89.25 13.64 V5 – CoC 671 22.43 19.77 88.08 13.67
SE± 1.24 0.07 1.63 0.24
C.D. at 5% NS NS NS NS
B) N levels F1 - 75% N 22.47 19.68 87.94 13.52 F2 - 100% N 22.25 19.62 88.45 13.54
F3 – 125 % N 22.29 19.75 88.53 13.68
SE± 0.50 0.28 1.10 0.16
C.D. at 5% NS NS NS NS
C) Interactions
SE± 0.62 0.35 1.33 0.38
C.D. at 5% NS NS NS NS
General Mean 22.34 19.68 88.30 13.58

Technical
Programme
2013-14

Approved Technical Programme
for the year
( 2013 – 14 )
Sugarcane Agronomy
All India Coordinated Research Project on Sugarcane (AICRP) 2012-13 :
1) AS 42:Agronomic evaluation of promising sugarcane genotypes .
(Spring Early Planting)
2) AS 42:Agronomic evaluation of promising sugarcane genotypes .
(Spring Midlate Planting)
3) AS 63 Plant geometry in relation to Mechanization of sugarcane
4) AS 63 Plant geometry in relation to Mechanization of sugarcane
(Ratoon)
5) AS 66: Priming of cane node for accelerating germination
6) AS 66: Priming of cane node for accelerating germination (Ratoon)
7) AS 65: Enhancing sugarcane productivity and profitability under Wheat –
Sugarcane cropping system.

Central Sugarcane Research Station,
Padegaon – 415 521, Tal- Phaltan, Dist- Satara Phone No. (02169) 265337
(02169) 265334
E-mail ID : [email protected] (02169) 265335
Tele. Fax.(02169) 265333/37 (02169) 265336
No.CSRS/AGRO/Annual Report 2012-13/ /2013. Date:
To, Dr.V.P.Singh
Director of Research & Principal Investigator, (Crop Production) Rajendra Agricultural University
Pusa – 848 125 Dist – Samastipur Bihar
Subject: Annual Report on Sugarcane 2012-13……
Reference: 1) F.No. 17-33/2013/PCS. Dated. 08th May, 2013.
Sir,
Apropos the above captioned letter, kindly find enclosed
herewith the hard copy of the Annual Report of Crop Production
(Agronomy) of A.I.C.R.P on Sugarcane 2012-13 of Central Sugarcane
Research Station, Padegaon alongwith soft copy for your kind
information and further needful please.
Thanking you,
Encl : As above. Yours faithfully
Sugarcane Specialist CSRS, Padegaon.
Copy submitted with respects for favour of information to:
1) Dr.O.K. Sinha , Project Co-ordinator, All India Co-ordinated
Research Project on Sugarcane, Indian Institute of Sugarcane Research, Rae Bareli Road, Post: Dilkhusha,
Lucknow - 226 002 (U.P.)

No.CSRS/SB/Annual Report 2011-12/ /2012. Date:
To,
Director & Principal Investigator,
Crop Improvement AICRP (S) Sugarcane Breeding Institute,
Coimbatore – 641 007 (TAMIL NADU)
Subject: Annual Report on Sugarcane 2011-12……
Reference: 1) F.No. 17-33/2012/PCS. Dated. 07th May, 2012. 2) D.O.No.1-11/2012-CI(Br.) dated. 30.04.2012
Sir,
Apropos the above captioned letter, kindly find enclosed
herewith the hard copy of the Annual Report of A.I.C.R.P on
Sugarcane 2011-12 of Central Sugarcane Research Station, Padegaon
alongwith soft copy for your kind information and further needful
please.
Thanking you,
Encl : As above. Yours faithfully
Sugarcane Specialist CSRS, Padegaon.
Copy submitted with respects for favour of information to :
1) Dr.O.K. Sinha , Project Co-ordinator, All India Co-ordinated Research Project on Sugarcane, Indian Institute of Sugarcane
Research, Rae Bareli Road, Post: Dilkhusha, Lucknow - 226 002 (U.P.)
