magnetic resonance methods for functional and anatomical neuroimaging (and for obesity related...
TRANSCRIPT
Magnetic Resonance Methods for Functional and Anatomical Neuroimaging
(and for obesity related research)
Peter A. Bandettini, Ph.D.
Section on Functional Imaging MethodsLaboratory of Brain and Cognition, NIMH
&Functional MRI Facility, NIMH

•Functional MRI•Voxel Based Morphometry
Functional MRI•Overview•Resolution•Interpretation•Contrast•Patterns•Fluctuations•Obesity Research

Overview of fMRI
Functional Contrast:Blood volumeBlood flow/perfusionBlood oxygenation
Spatial resolution: Typical: 3 mm3
Upper: 0.5 mm3
Temporal resolution:Minimum duration: < 16 msMinimum onset diff: 100 ms to 2 sec
Sensitivity:tSNR = 40/1 to 120/1 fCNR = 1/1 to 6/1
Interpretability issues:Neurovascular coupling, vascular sampling, blood, physiologic noise, motion and other artifacts, etc..
task task
fMRI - overview

How fMRI Is Currently Being Used
Research Applications-map networks involved with specific behavior, stimulus, or performance-characterize changes over time (seconds to years)-determine correlates of behavior (response accuracy, etc…)-characterization of groups or individuals
Clinical Research-clinical population characterization (probe task or resting state)-assessment of recovery and plasticity-attempts to characterize (classify) individuals
Clinical Applications-presurgical mapping (CPT code in place as of Jan, 2007)
fMRI - overview

“fMRI” or “functional MRI”
Scopus: Articles or Reviews Published per YearfMRI - overview

Methodology
Interpretation Applications
Technology
Coil arraysHigh field strengthHigh resolutionNovel functional contrast
Functional Connectivity AssessmentMulti-modal integrationPattern classification Real time feedbackTask design (fMRIa…)
Fluctuations DynamicsSpatial patterns
Basic NeuroscienceBehavior correlation/predictionPathology assessment
fMRI - overview

fMRI - overview

Yacoub et al. PNAS 2008
Spatial Resolution
fMRI - resolution

Multi-sensory integration
Visual
Auditory
Multisensory
M.S. Beauchamp et al.,
Spatial Resolution
fMRI - resolution

P. A. Bandettini, (1999) "Functional MRI" 205-220.
Magnitude
Latency
+ 2 sec
- 2 sec
Venogram
Latency VariationTemporal ResolutionfMRI

Logothetis et al. (2001) “Neurophysiological investigation of the basis of the fMRI signal” Nature, 412, 150-157
S. M. Rao et al, (1996) “Relationship between finger movement rate and functional magnetic resonance signal change in human primary motor cortex.” J. Cereb. Blood Flow and Met. 16, 1250-1254.
Relationship to Neuronal Activity
fMRI - interpretation

Neuronal Activation
Hemodynamics? ??
Measured Signal
Noise
?
fMRI - intepretation

• Volume (gadolinium)
• BOLD• Perfusion (ASL)• CMRO2
• Volume (VASO)• Neuronal Currents• Diffusion coefficient• Temperature
fMRI Contrast
fMRI - contrast
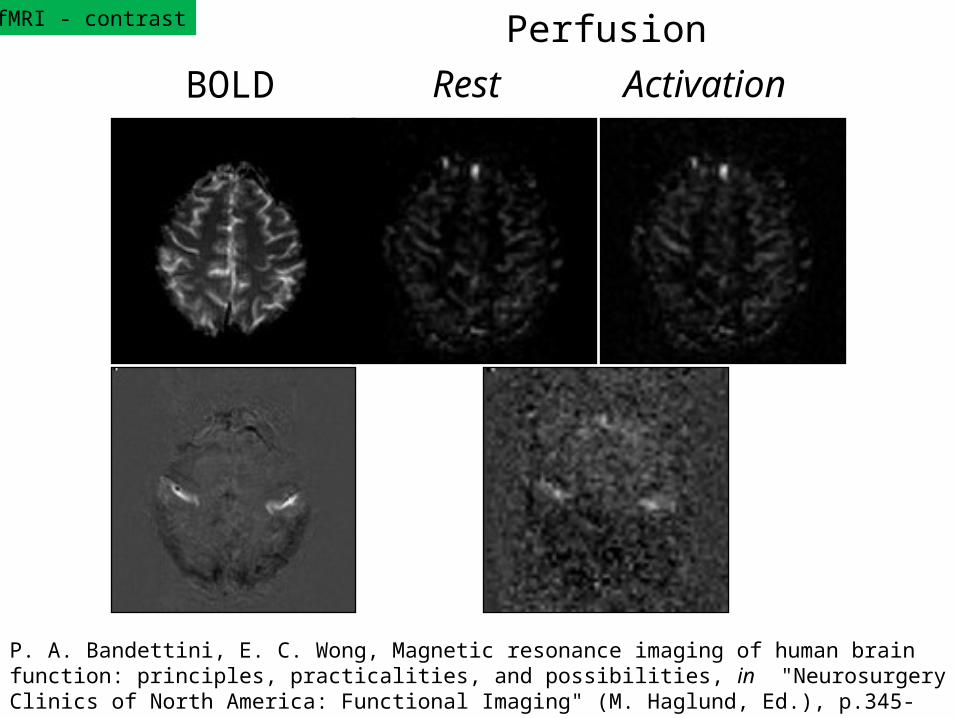
BOLD Rest Activation
P. A. Bandettini, E. C. Wong, Magnetic resonance imaging of human brain function: principles, practicalities, and possibilities, in "Neurosurgery Clinics of North America: Functional Imaging" (M. Haglund, Ed.), p.345-371, W. B. Saunders Co., 1997.
PerfusionfMRI - contrast

Anatomy
BOLD
Perfusion
P. A. Bandettini, E. C. Wong, Magnetic resonance imaging of human brain function: principles, practicalities, and possibilities, in "Neurosurgery Clinics of North America: Functional Imaging" (M. Haglund, Ed.), p.345-371, W. B. Saunders Co., 1997.
fMRI - contrast
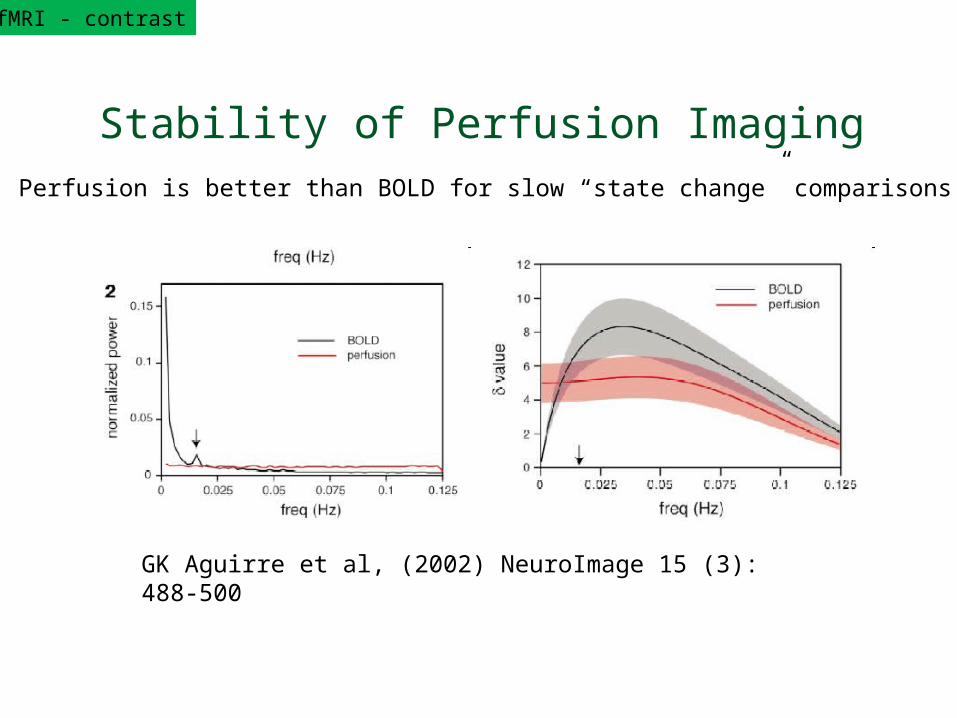
GK Aguirre et al, (2002) NeuroImage 15 (3): 488-500
Perfusion is better than BOLD for slow “state change” comparisons..
Stability of Perfusion Imaging
fMRI - contrast
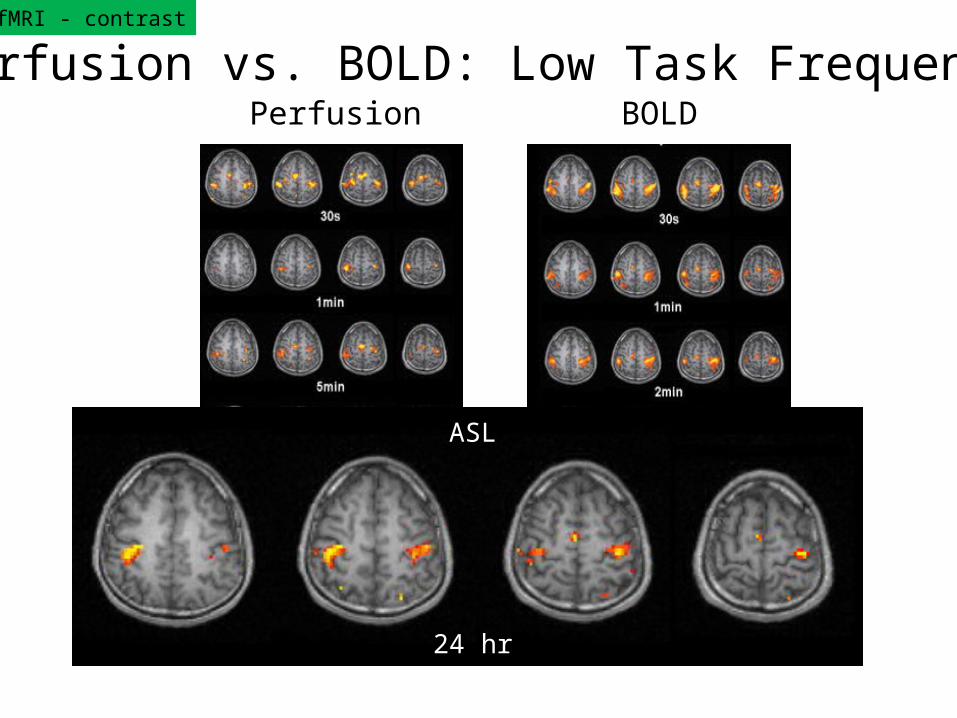
Perfusion vs. BOLD: Low Task Frequency
Wang et al., 2002
Perfusion BOLD
24 hr24 hr
ASLASL
fMRI - contrast

•Classical fMRI analysis: What’s activated during a task?
•Pattern-information analysis: Does a pattern carry a particular kind of information?
fMRI - patterns

fMRI - patterns

Ventral temporal category representations
Object categories are associated with distributed representations in ventral temporal cortex
Haxby et al. 2001
fMRI - patterns

Boynton (2005), News & Views on Kamitani & Tong (2005) and Haynes & Rees (2005)
fMRI - patterns

Kamitani & Tong (2005)
Lower spatial frequency clumping
Orientation viewing decoding
fMRI - patterns

Sources of time series fluctuations:
•Blood, brain and CSF pulsation
•Vasomotion
•Breathing cycle (B0 shifts with lung expansion)
•Bulk motion
•Scanner instabilities
•Changes in blood CO2 (changes in breathing)
•Spontaneous neuronal activity
fMRI - fluctuations
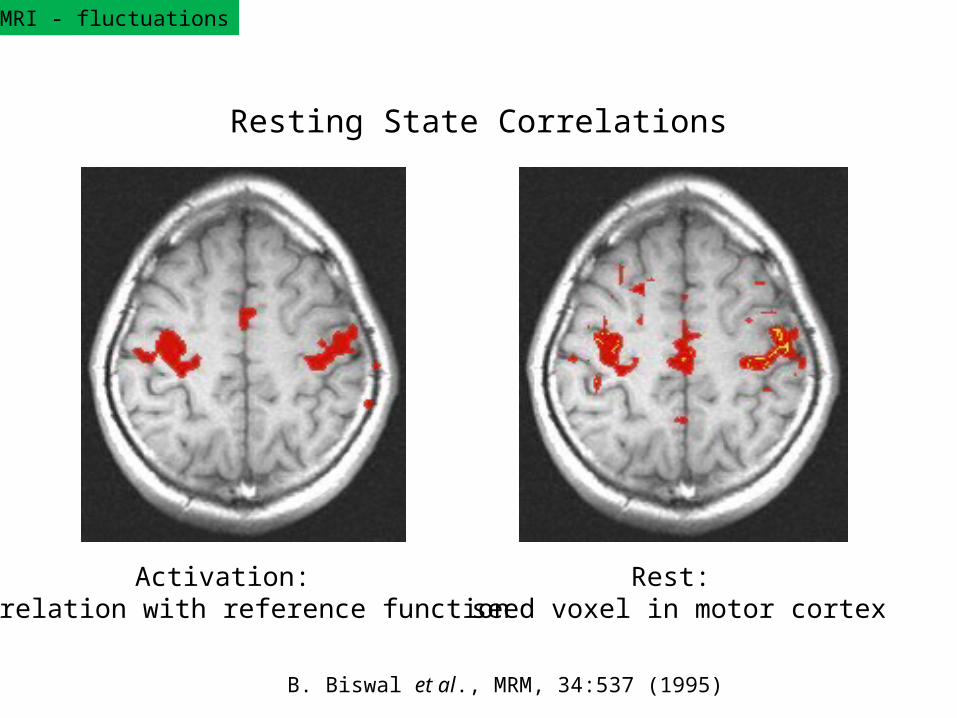
Rest: seed voxel in motor cortex
Activation: correlation with reference function
B. Biswal et al., MRM, 34:537 (1995)
Resting State Correlations
fMRIfMRI - fluctuations

BOLD correlated with SCR during “Rest”
J. C. Patterson II, L. G. Ungerleider, and P. A Bandettini, NeuroImage 17: 1787-1806, (2002).
fMRIfMRI - fluctuations
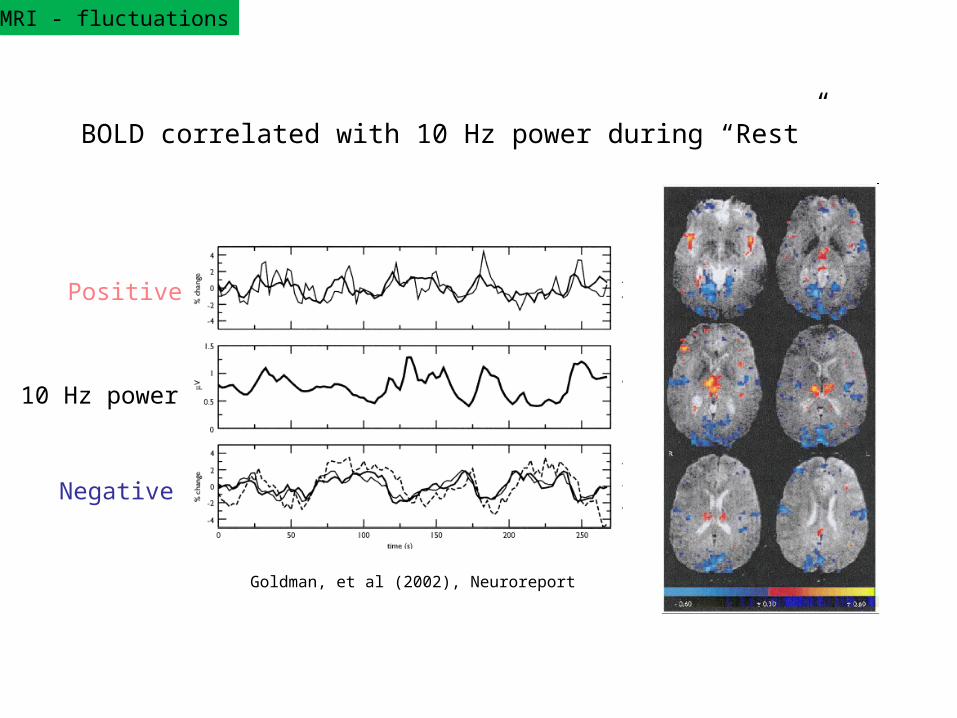
Goldman, et al (2002), Neuroreport
BOLD correlated with 10 Hz power during “Rest”
Positive
Negative
10 Hz power
fMRIfMRI - fluctuations
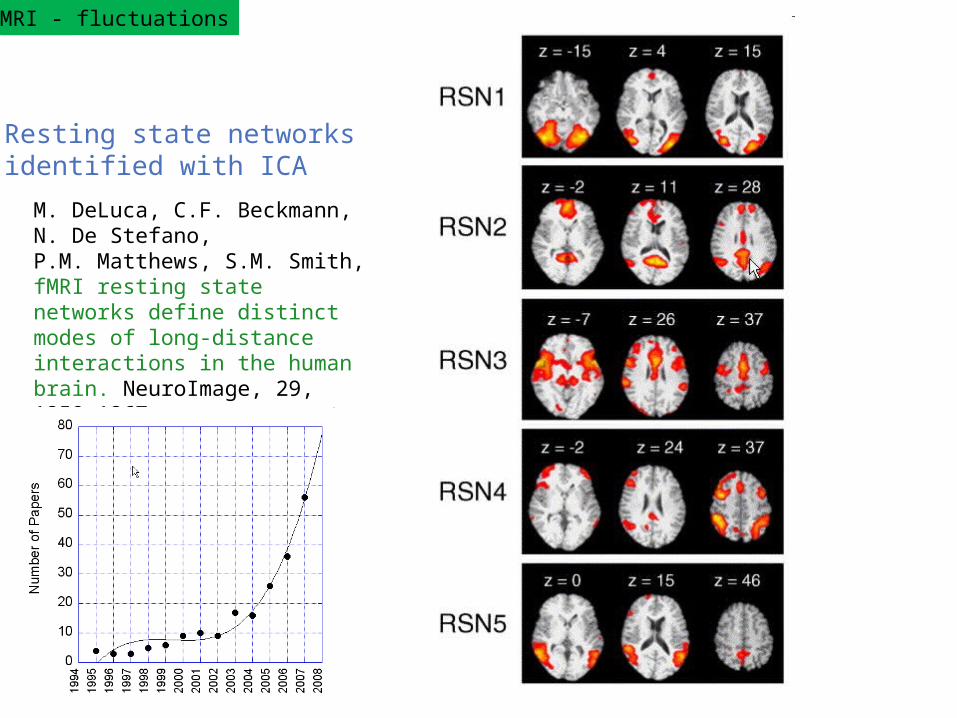
Resting state networks identified with ICA
M. DeLuca, C.F. Beckmann, N. De Stefano, P.M. Matthews, S.M. Smith, fMRI resting statenetworks define distinct modes of long-distanceinteractions in the human brain. NeuroImage, 29, 1359-1367
fMRIfMRI - fluctuations
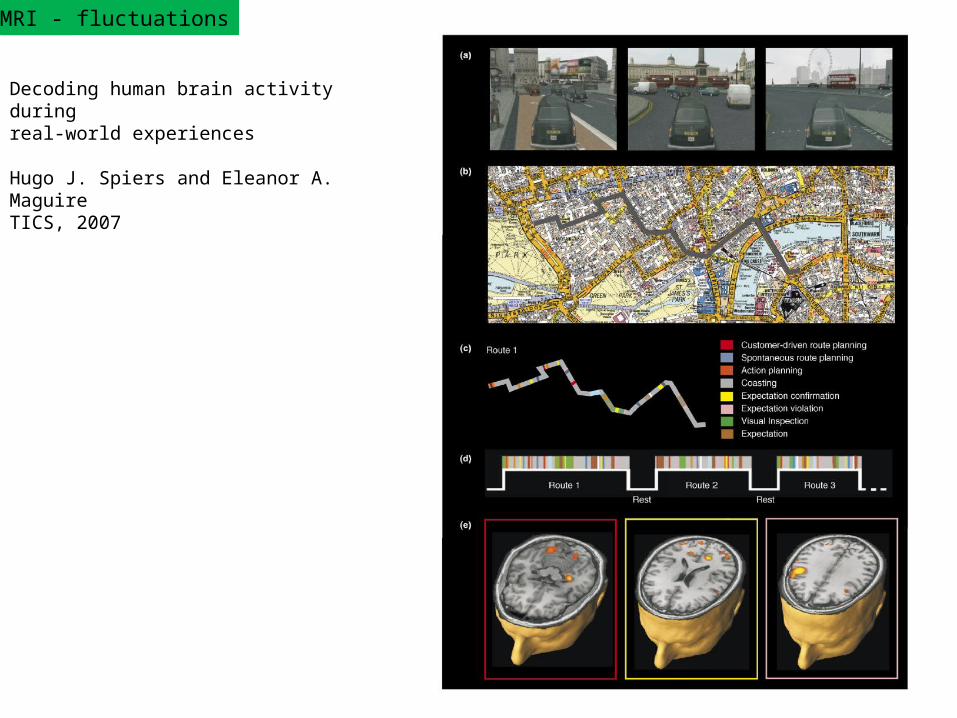
Decoding human brain activity duringreal-world experiences
Hugo J. Spiers and Eleanor A. MaguireTICS, 2007
fMRIfMRI - fluctuations

Some Applications to Obesity Research
•High vs. Low Calorie Food Viewing•Hunger vs. Satiety while viewing food•Food vs. Non-food viewing•Food craving induction•Leptin Modulation•Hypothalamus activity with glucose ingestion
fMRIfMRI – obesity research

Greater activation in Obese subjects to high calorie foods
Stoeckel, L. E., et al. 2008. Widespread reward-system activation in obese women in response to pictures of high-calorie foods. NeuroImage. 41: 636-647.
fMRIfMRI – obesity research

Effects of Hunger and Food Viewing
Fuhrer, D., S. Zysset & M. Stumvoll. 2008. Brain activity in hunger and satiety: An exploratory visually stimulated fMRI study. Obesity. 16: 945-950.
fMRIfMRI – obesity research
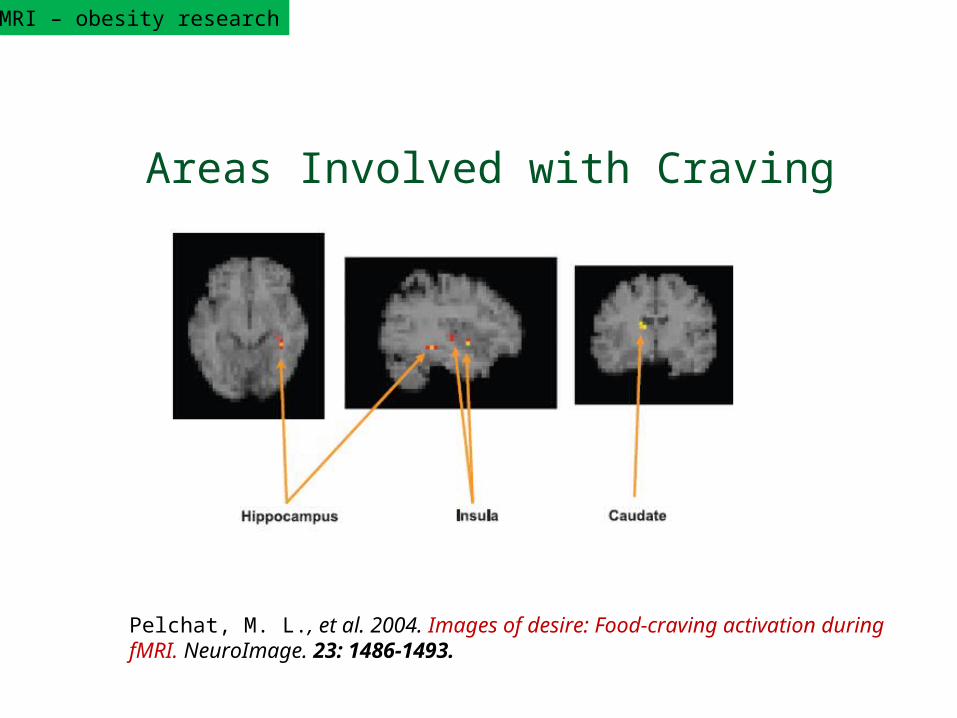
Areas Involved with Craving
Pelchat, M. L., et al. 2004. Images of desire: Food-craving activation during fMRI. NeuroImage. 23: 1486-1493.
fMRIfMRI – obesity research
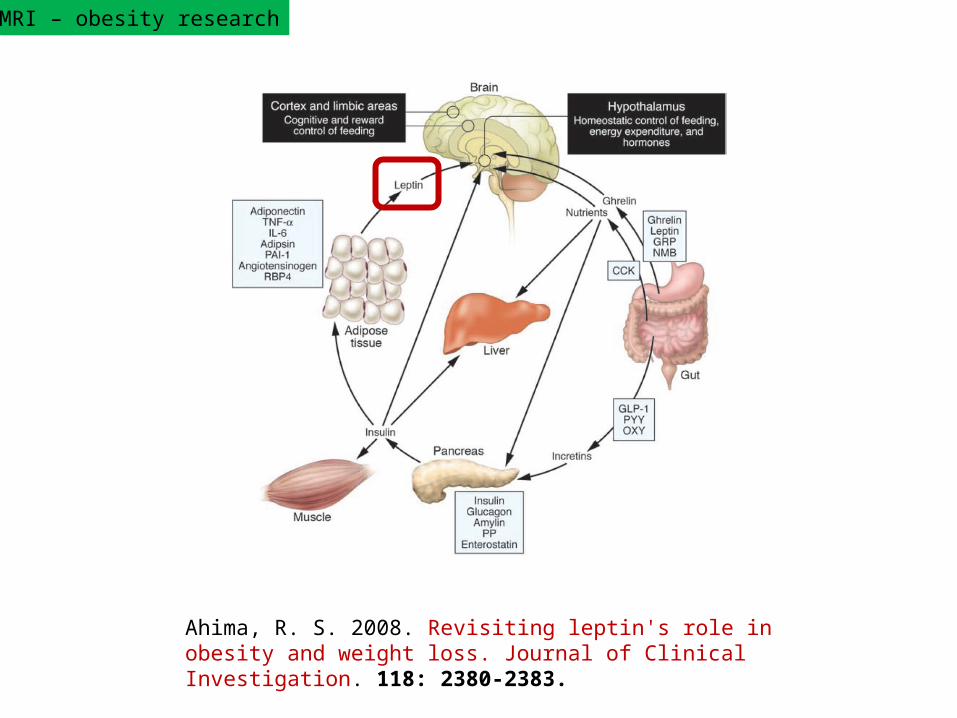
Ahima, R. S. 2008. Revisiting leptin's role in obesity and weight loss. Journal of Clinical Investigation. 118: 2380-2383.
fMRIfMRI - fluctuationsfMRI – obesity research

Viewing food with/without Leptin suppplement
Baicy, K., et al. 2007. Leptin replacement alters brain response to food cues in genetically leptin-deficient adults. Proceedings of the National Academy of Sciences of the United States of America. 104: 18276-18279.
Rosenbaum, M., et al. 2008. Leptin reverses weight loss-induced changes in regional neural activity responses to visual food stimuli. Journal of Clinical Investigation. 118: 2583-2591.
fMRIfMRI – obesity research

Baicy, K., et al. 2007. Leptin replacement alters brain response to food cues in genetically leptin-deficient adults. Proceedings of the National Academy of Sciences of the United States of America. 104: 18276-18279.
Reduced Leptin
Increased Leptin
fMRI
Leptin replacement effects in leptin-deficient adultsfMRI – obesity research
fMRI – obesity research
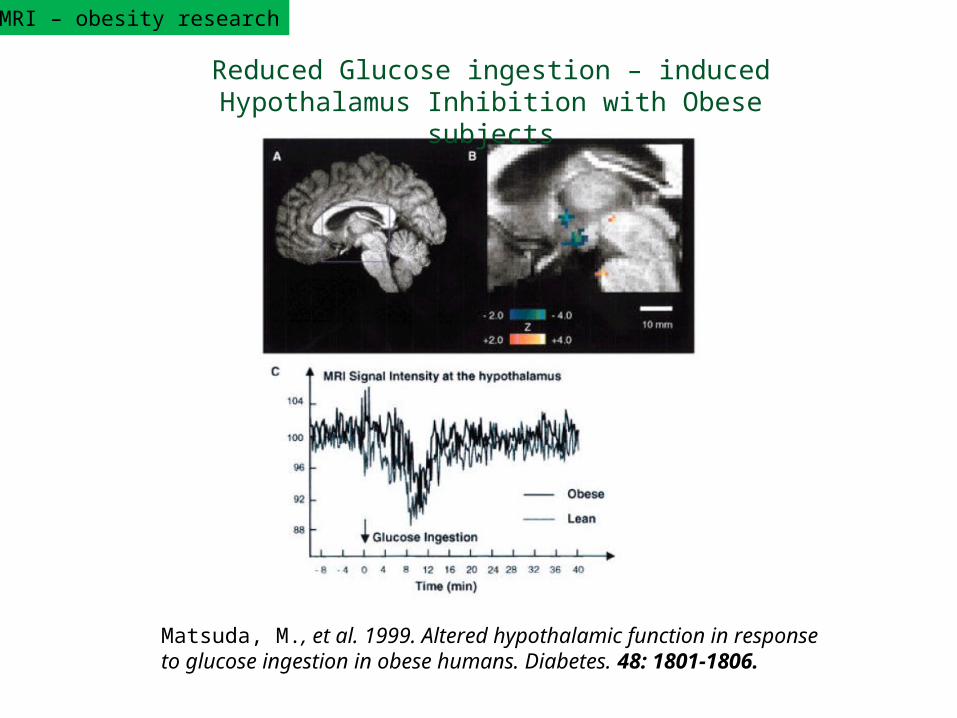
Reduced Glucose ingestion – induced Hypothalamus Inhibition with Obese
subjects
Matsuda, M., et al. 1999. Altered hypothalamic function in response to glucose ingestion in obese humans. Diabetes. 48: 1801-1806.

•Functional MRI•Voxel Based Morphometry

VBM

Taki, Y., et al. 2008. Relationship between body mass index and gray matter volume in 1,428 healthy individuals. Obesity. 16: 119-124.
Relationship to Body Mass Index
VBM
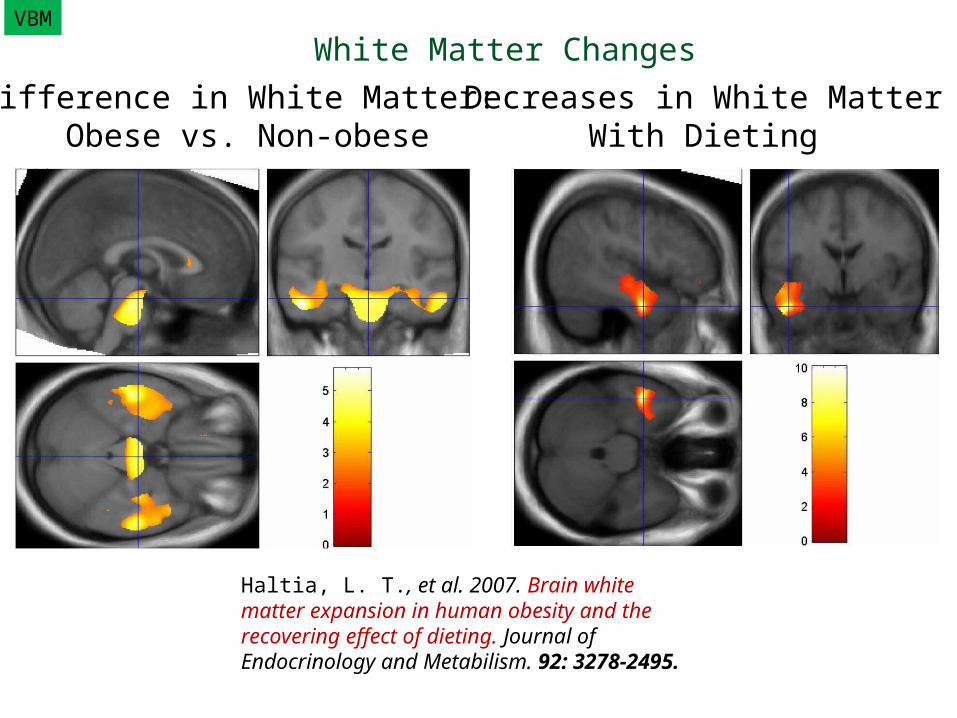
Difference in White Matter: Obese vs. Non-obese
Decreases in White MatterWith Dieting
Haltia, L. T., et al. 2007. Brain white matter expansion in human obesity and the recovering effect of dieting. Journal of Endocrinology and Metabilism. 92: 3278-2495.
White Matter ChangesVBM

Future DirectionsFocus more on individuals rather than group studies
•Assessment of causes
•Assessment of types of treatment and therapy
•Use of real time fMRI for therapy
•Resting state fluctuations
•More detailed moment to moment assessment of
changes
•High resolution and pattern classification coupled with
therapy