magnetic particle imaging for quantitative evaluation of
TRANSCRIPT
Original Paper Thermal Med, 33 (2): 39-51, 2017.
Magnetic Particle Imaging for Quantitative Evaluation of Tumor Response to Magnetic Hyperthermia Treatment
Combined with Chemotherapy Using Cisplatin
AKIKO OHKI, MINORI TANOUE, SAYUMI KOBAYASHI, KENYA MURASE*
Department of Medical Physics and Engineering, Division of Medical Technology and Science, Faculty of Health Science, Graduate School of Medicine, Osaka University, Suita, Osaka 565-0871, Japan
Abstract: This study was undertaken to evaluate the tumor response to magnetic hyperthermia treatment (MHT) combined with cisplatin (MHT+CDDP) using magnetic particle imaging (MPI). Colon-26 cells were implanted into the backs of mice. When the tumor volume exceeded approximately 100 mm3, the mice were divided into control, MHT, CDDP, and MHT+CDDP groups. In the CDDP and MHT+CDDP groups, CDDP (5 mg/kg) was injected intraperitoneally. In the MHT+CDDP group, magnetic nanoparticles[250 mM (14.0 mg Fe/mL) Resovist®]were directly injected into the tumor one hour after CDDP administration, and MHT was performed for 20 min using an alternating magnetic field. In the MHT group, only MHT was performed after the injection of Resovist®. In the MHT+CDDP and MHT groups, MPI images were obtained using our MPI scanner immediately before, immediately after, and 3, 7, and 14 days after MHT. After the MPI studies, we drew a region of interest (ROI) on the tumor in the MPI image and calculated the average and maximum MPI values and the number of pixels within the ROI. In all groups, the relative tumor volume growth (RTVG) was calculated from (V-V0)/V0, where V0 and V were the tumor volumes immediately before and after treatment, respectively. The RTVG value in the MHT+CDDP group was significantly lower than that in the MHT group 3 to 14 days after MHT. It was also significantly lower than that in the CDDP group at 4 to 11 days except at 6 and 9 days after treatment. The average and maximum MPI values normalized by those immediately before MHT in the MHT+CDDP group were significantly higher than those in the MHT group 3 days after MHT. Our results suggested that MPI is useful for quantitatively evaluating tumor response to MHT combined with chemotherapy.
Key Words: magnetic particle imaging, magnetic hyperthermia treatment, magnetic nanoparticles, cisplatin, tumor response
Introduction Magnetic particle imaging (MPI) was introduced as an imaging method in 20051). MPI employs the nonlinear response of magnetic nanoparticles (MNPs) to an external oscillating magnetic field and accomplishes imaging the spatial distribution of MNPs such as superparamagnetic iron oxide nanoparticles,
MPI for magnetic hyperthermia treatment ・ A. Ohki et al.
39― ―
Received: 23 February, 2017, Accepted: 21 June, 2017. *Corresponding author: Tel, +81-6-6879-2571; Fax, +81-6-6879-2571; e-mail, [email protected]: 10.3191/thermalmed.33.39©2017 Japanese Society for Thermal Medicine

with high sensitivity and high spatial resolution1). Cis-diammine-dichloroplatinum (II) (Cisplatin; CDDP) is a platinum-based chemotherapeutic agent that has been clinically used for cancer treatment2). The mechanism of CDDP cytotoxicity is to affect the formation of DNA adducts and to inhibit transcription and replication3). This process induces cell apoptosis, necrosis, and other cell-cycle based mechanisms3,4). It has been reported that a combination of chemotherapy with use of CDDP and hyperthermia produces beneficial results and synergistically enhances the effectiveness of CDDP and hyperthermia3,5). Magnetic hyperthermia treatment (MHT) is an attractive cancer treatment, utilizing the temperature rise of MNPs under an alternating magnetic field (AMF). MNPs generate heat through hysteresis loss and/or relaxational loss due to Nèel and Brownian relaxations when exposed to the AMF6). Traditional hyperthermia treatments such as radiofrequency (RF)-capacitive heating7) damage not only tumor tissues but also normal tissues. In contrast, MHT is able to heat tumor tissues without damaging normal tissues8). In order to improve the therapeutic efficacy of MHT, it is important to deliver and accumulate as many MNPs as possible into the tumor tissues9). Although it has been reported that the therapeutic effect of hyperthermia is enhanced when combined with chemotherapy using CDDP (synergistic effect), to the best of our knowledge, there are no reports on whether the tumor response to a combination of MHT and CDDP chemotherapy can be quantitatively evaluated using MPI. The purpose of this study was to quantitatively evaluate the tumor response to MHT combined with CDDP chemotherapy in comparison with that of MHT alone using MPI.
Materials and methodsMPI System Fig. 1 shows a photograph of our MPI scanner. The details of our MPI system are reported in our previous papers10-12). Briefly, a drive magnetic field was generated by using an excitation coil (solenoid coil 100 mm in length, 80 mm in inner diameter, and 110 mm in outer diameter). AC power was provided to the excitation coil by a programmable power supply (EC1000S, NF Co., Yokohama, Japan), and was controlled using a sinusoidal wave generated by a digital function generator (DF1906, NF Co.). The frequency and peak-to-peak strength of the drive magnetic field were taken as 400 Hz and 20 mT, respectively. A gradiometer coil (50 mm in length, 35 mm in inner diameter, and 40 mm in outer diameter) received the signal produced by MNPs. The third-harmonic signal was extracted using a preamplifier (T-AMP03HC, Turtle Industry Co., Ibaragi, Japan) and a lock-in amplifier (LI5640, NF Co.). The output of the lock-in amplifier was converted to digital data by a personal computer connected to a multifunction data acquisition device with a universal serial bus port (USB-6212, National Instruments Co., TX, USA). The sampling time was taken
40― ―
Thermal Med, 33[2]: 39-51, 2017.
Fig. 1. Photograph of our scanner for magnetic particle imaging (MPI).

as 10 msec. When measuring signals using the gradiometer coil, a sample was placed 12.5 mm (i.e., one quarter of the coil length) from the center of the gradiometer coil and the coil, including the sample, was moved such that the center of the sample coincided with the position of a field-free line. The selection magnetic field was generated by two opposing neodymium magnets (Neomax Engineering Co., Gunma, Japan). The center of the two neodymium magnets generates the field-free line. In order to acquire projection data for image reconstruction, the sample in the receiving coil was automatically rotated around the z-axis over 180°in steps of 5°and translated in the x-direction from -16 mm to 16 mm in steps of 1 mm, using an XYZ-axes rotary stage (HPS80-50X-M5, Sigma Koki Co., Tokyo, Japan), which was controlled using LabVIEW (National Instruments Co.). Data acquisition took about 12 min. Each projection data set was then transformed into 64 bins by linear interpolation. Both the inhomogeneous sensitivity of the receiving coil and feed through interference were corrected using the method described in our previous paper13). Transverse images were reconstructed from the projection data using the maximum likelihood-expectation maximization (ML-EM) algorithm over 15 iterations, in which the initial concentration of MNPs was assumed to be uniform10,11).
Apparatus for MHT The details of our apparatus for MHT are described in our previous paper14). Concisely, the coil for supplying the AMF consists of 19-turned loops (6.5 cm in diameter and 10 cm in length) of copper pipe (5 mm in diameter). The coil is cooled by water to ensure constant temperature and impedance. The coil is connected to a high-frequency power supply (T162-5723BHE, Thamway Co., Ltd., Shizuoka, Japan) and a manual matching unit (T020-5723AHE, Thamway Co., Ltd.). This system can induce an AMF with a maximum peak amplitude of 3.7 kA/m at an output power of 500 W. The peak amplitude of the AMF generated in the coil can be regulated by changing the output of the power supply.
Magnetic nanoparticles In this study, Resovist® (FUJIFILM RI Pharma Co., Ltd., Tokyo, Japan) was used as the source of MNPs, since it is commercially available and has been approved clinically in Japan. Resovist® is composed of MNPs (maghemite, γ-Fe2O3) coated with carboxydextran. It is an organ-specific contrast agent for magnetic resonance imaging (MRI), used especially for the detection of hepatocellular carcinoma and liver metastasis14).
Phantom experiments Samples with various iron concentrations of Resovist® (0, 50, 100, 125, 250, and 500 mM) were prepared by putting Resovist® into a cylindrical tube 6 mm in diameter and 5 mm in length (100 µL) and were imaged using our MPI scanner (Fig. 1). It should be noted that because the molar mass of iron (Fe) is 55.8 g/mol, iron concentrations of 50, 100, 125, 250, and 500 mM correspond to 2.8, 5.6, 7.0, 14.0, and 27.9 mg Fe/mL, respectively.
Animals and tumor inoculation All animal experiments were performed according to the study protocol and experimental procedures approved by the animal ethics committee at Osaka University School of Medicine. Seven-week-old male
MPI for magnetic hyperthermia treatment ・ A. Ohki et al.
41― ―

BALB/c mice weighing 27.5±1.2 g[mean±standard deviation (SD)]were purchased from Charles River Laboratories Japan, Inc. (Yokohama, Japan), and habituated to the rearing environment for one week before the experiment. The mice were fed with food and water and kept under conditions of 23℃ room temperature and around 50% humidity. Colon-26 (a mouse cell line derived from rectal cancer) cells (Riken BioResource Center, Ibaragi, Japan) were cultured in RPMI-1640 medium (Mediatech Inc., VA, USA) supplemented with 10% fetal bovine serum (FBS) (Biowest, Nuaillé, France) and 1% penicillin-streptomycin (Nacalai Tesque Inc., Kyoto, Japan). All cultures were incubated in a humidified atmosphere containing 5% CO2 at 37℃. The cells were trypsinized with 0.25% trypsin in ethylenediaminetetraacetic acid (EDTA) (Nacalai Tesque Inc.) and resuspended in phosphate-buffered saline (PBS) at 1×10⁶ cells/100 μL. The cell suspension (1×10⁶ cells) was injected into the backs of the mice on the same day and under the same conditions. During the implantation, the mice were anesthetized by intraperitoneal administration of pentobarbital sodium (Somnopentyl, Kyoritsu Seiyaku Co., Tokyo, Japan) (10-fold dilution, 0.25 mL).
Animal experiments Noticeable tumors were observed about 7 days after inoculation. The tumors were treated when their volumes reached approximately 100 mm3. In this study, the following four groups were studied: control (n=10), MHT (n=11), CDDP (n=8), and MHT+CDDP groups (n=8). In the CDDP group, CDDP (Nichi-Iko Pharmaceutical Co., Ltd., Toyama, Japan) was intraperitoneally injected at a single dose of 5 mg/kg body weight immediately after the tumor volume reached approximately 100 mm3. In the MHT+CDDP group, CDDP was intraperitoneally injected at the same dose one hour before MHT. In the MHT group, only MHT was performed without the injection of CDDP. The tumors in the MHT and MHT+CDDP groups were directly injected with Resovist® (0.2 mL of stock solution diluted in PBS) with an iron concentration of 250 mM (14.0 mg Fe/mL) under anesthesia by intraperitoneal administration of pentobarbital sodium (10-fold dilution, 0.012 mL/g body weight). Fifteen minutes after the injection of Resovist®, each mouse was placed in a holder and set in the coil for generating an AMF as illustrated in Fig. 2(a). MHT was performed by applying an AMF at a frequency of 600 kHz and peak amplitude of 3.1 kA/m14) for 20 min. In the control group, neither MHT nor chemotherapy was carried out. Each tumor injected with Resovist® in the MHT and MHT+CDDP groups
42― ―
Thermal Med, 33[2]: 39-51, 2017.
Fig. 2. (a) Schematic illustration of magnetic hyperthermia treatment (MHT). A tumor-bearing mouse was placed in a holder and set in the coil for generating an alternating magnetic field (AMF), under which MHT was performed. (b) Schematic illustration of an imaging slice in MPI. The imaging slice was determined by moving a tumor-bearing mouse in the receiving coil such that the position of the tumor with the maximum MPI signal intensity coincided with that of a field-free line. MNPs: magnetic nanoparticles.
(a) (b)

was scanned 5 times using our MPI scanner (Fig. 1); immediately before MHT, immediately after MHT, 3 days, 7 days, and 14 days after MHT. In this study, the imaging slice was determined by moving a tumor-bearing mouse in the receiving coil such that the position of the tumor with the maximum MPI signal intensity coincided with that of the field-free line, as illustrated in Fig. 2(b). After the MPI studies, X-ray CT images were also obtained by a 4-row multi-slice CT scanner (Asteion, Toshiba Medical Systems Co., Tochigi, Japan) with a tube voltage of 120 kV, a tube current of 210 mA, and a slice thickness of 0.5 mm. The MPI image was co-registered to the X-ray CT image to confirm the spatial distribution of Resovist® in a tumor-bearing mouse using the method described in our previous paper12). It should be noted that the X-ray CT image after the first MPI study was replaced by that obtained after the second MPI study.
Temperature measurement During MHT, the temperatures of the tumor and rectum were recorded in 3 mice using two fluorescence-type optical fiber thermometers (AMOTH FL-2000, Anritsu Meter Co., Tokyo, Japan) and two optical fiber temperature probes. One probe was placed in the tumor and the other probe was inserted 1 cm inside the rectum. Both temperatures were recorded every second until the end of MHT.
Histological study Separately from the above studies, mice were purchased for histological studies and were implanted with colon-26 cells in the same manner as described above. When the tumor volume reached approximately 100 mm3, the mice were divided into control (n=2), MHT (n=2), CDDP (n=2), and MHT+CDDP groups (n=2). In the control group, the mice were sacrificed and the tumors were removed 3 days after the tumor volume exceeded 100 mm3. In the MHT and MHT+CDDP groups, the mice were sacrificed and the tumors were removed 3 days after MHT. In the CDDP group, the mice were sacrificed and the tumors were removed 3 days after the injection of CDDP. The tumor tissues were fixed in 7.5% formaldehyde neutral buffered solution (Sigma-Aldrich Japan Co., Ltd., Tokyo, Japan) and stained with hematoxylin and eosin (H&E). The histological images were acquired with a microscope (ECLIPSE80i, NIKON Co., Ltd., Tokyo, Japan) at 10× magnification and an imaging software (NIS-Elements D, NIKON Co., Ltd.).
Data analysis In phantom studies, we drew a circular region of interest (ROI) with a diameter of 6 mm on the MPI image and calculated the average MPI value within the ROI. In animal studies, tumors were measured by a caliper every day until 14 days after treatment. The tumor volume (V) was calculated using the following formula: V = (π/6)×Lx×Ly×Lz, where Lx, Ly, and Lz represent the vertical diameter, the horizontal diameter, and the height in mm, respectively. The relative tumor volume growth (RTVG) was also calculated from (V-V0)/V0. In the control group, V0 was taken as the tumor volume immediately after it exceeded 100 mm3. In the MHT and MHT+CDDP groups, V0 was taken as the tumor volume immediately before MHT. In the CDDP group, V0 was taken as the tumor volume immediately before the injection of CDDP. In this study, the RTVG value was used as an index of the therapeutic effect. After the MPI studies, we drew a ROI on the tumor in the MPI image and calculated the average and
MPI for magnetic hyperthermia treatment ・ A. Ohki et al.
43― ―

maximum MPI values and the number of pixels within the ROI by taking the threshold value for extracting the contour of the tumor as 40% of the maximum MPI value within the ROI.
Statistical analysis In phantom studies, linear regression analysis was performed and the regression equation and correlation coefficient were calculated. In animal studies, the RTVG, average MPI, and maximum MPI values, and the number of pixels within the ROI were expressed as the mean±standard error (SE). Differences in these parameters between two groups were analyzed by Studentʼs t-test (two-tailed) when the variance in each group was equal. When the variance in each group was unequal, Welchʼs t-test (two-tailed) was used. A p value less than 0.05 was regarded as indicating statistical significance.
ResultsPhantom experiments Fig. 3 shows the correlation between the average MPI value and the iron concentration of Resovist®. As shown in Fig. 3, there was an excellent linear correlation between them (r=0.997).
Animal experimentsTemperature measurement Fig. 4 shows the time courses of the temperatures of the tumor (red circles) and rectum (black circles) during MHT in the MHT group. The temperature of the rectum was almost constant at about 35℃ five minutes or more after the start
44― ―
Thermal Med, 33[2]: 39-51, 2017.
Fig. 3. Correlation between the iron concentration of Resovist® (x) and the average MPI value (y). There was an excellent correlation between them with a correlation coefficient of 0.997 and a regression equation of y=0.399x-0.213. Iron concentrations of 50, 100, 125, 250, and 500 mM correspond to 2.8, 5.6, 7.0, 14.0, and 27.9 mg Fe/mL, respectively. Data are represented as the mean±standard error (SE) for n=4.
Fig. 4. Time courses of the temperatures of the tumor (red circles) and rectum (black circles) during MHT in the MHT group. Data are represented as the mean±SE for n=3.
of MHT. The temperature of the tumor was 31℃ to 34℃ before the start of MHT, and it gradually increased and plateaued at about 40.5℃ approximately 10 minutes or more after the start of MHT.
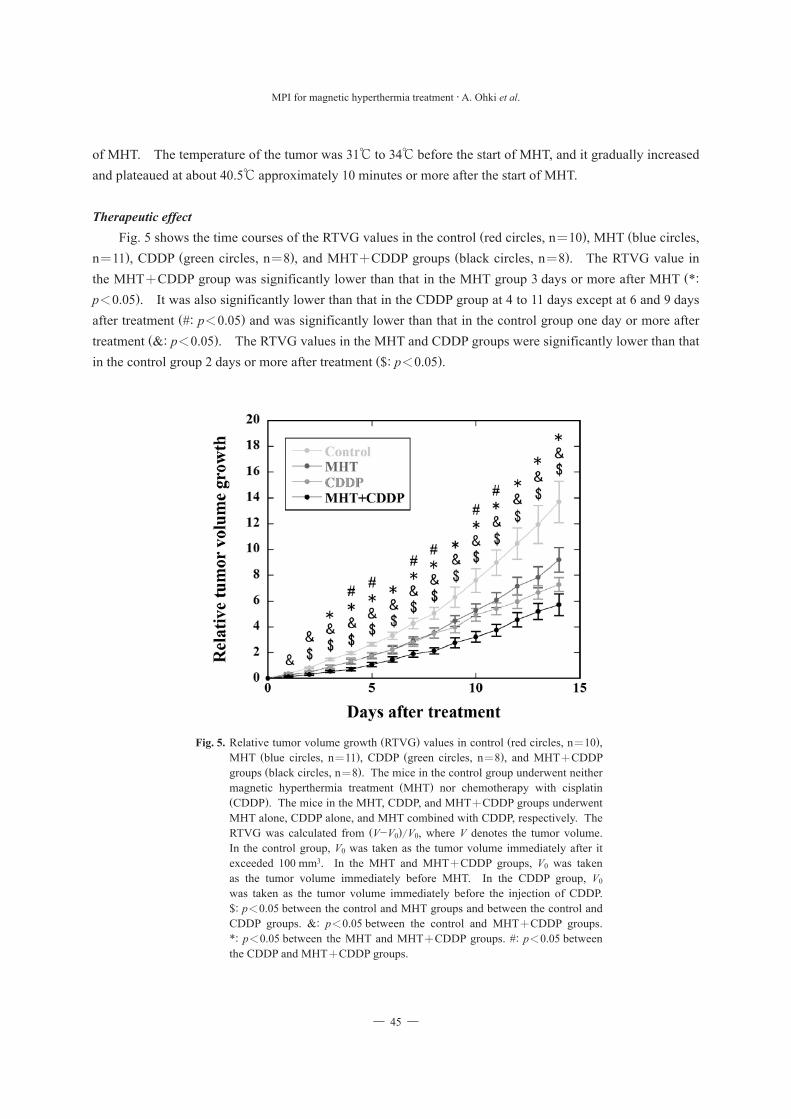
Therapeutic effect Fig. 5 shows the time courses of the RTVG values in the control (red circles, n=10), MHT (blue circles, n=11), CDDP (green circles, n=8), and MHT+CDDP groups (black circles, n=8). The RTVG value in the MHT+CDDP group was significantly lower than that in the MHT group 3 days or more after MHT (*: p<0.05). It was also significantly lower than that in the CDDP group at 4 to 11 days except at 6 and 9 days after treatment (#: p<0.05) and was significantly lower than that in the control group one day or more after treatment (&: p<0.05). The RTVG values in the MHT and CDDP groups were significantly lower than that in the control group 2 days or more after treatment ($: p<0.05).
MPI for magnetic hyperthermia treatment ・ A. Ohki et al.
45― ―
Fig. 5. Relative tumor volume growth (RTVG) values in control (red circles, n=10), MHT (blue circles, n=11), CDDP (green circles, n=8), and MHT+CDDP groups (black circles, n=8). The mice in the control group underwent neither magnetic hyperthermia treatment (MHT) nor chemotherapy with cisplatin (CDDP). The mice in the MHT, CDDP, and MHT+CDDP groups underwent MHT alone, CDDP alone, and MHT combined with CDDP, respectively. The RTVG was calculated from (V-V0)/V0, where V denotes the tumor volume. In the control group, V0 was taken as the tumor volume immediately after it exceeded 100 mm3. In the MHT and MHT+CDDP groups, V0 was taken as the tumor volume immediately before MHT. In the CDDP group, V0 was taken as the tumor volume immediately before the injection of CDDP. $: p<0.05 between the control and MHT groups and between the control and CDDP groups. &: p<0.05 between the control and MHT+CDDP groups. *: p<0.05 between the MHT and MHT+CDDP groups. #: p<0.05 between the CDDP and MHT+CDDP groups.

MPI study Fig. 6 shows typical examples of the MPI images superimposed on the X-ray CT images in the MHT (upper row) and MHT+CDDP groups (lower row) immediately before MHT, immediately after MHT, and 3, 7, and 14 days after MHT. It can be visually confirmed that the retention of MNPs in the tumor in the MHT+CDDP group was higher than that in the MHT group 3, 7, and 14 days after MHT. Figs. 7(a), 7(b), and
46― ―
Thermal Med, 33[2]: 39-51, 2017.
Fig. 6. Typical examples of MPI images in the MHT (upper row) and MHT+CDDP groups (lower row) immediately before, immediately after, 3, 7, and 14 days after MHT. The MPI images were superimposed on the X-ray CT images. Scale bar=10 mm.
Fig. 7. (a) Average MPI value, (b) maximum MPI value, and (c) the number of pixels within the region of interest drawn on the tumor in the MPI image, immediately before, immediately after, 3, 7, and 14 days after MHT in the MHT (red bars, n=11) and MHT+CDDP (blue bars, n=8) groups. The values immediately after, 3, 7, and 14 days after MHT were normalized by those immediately before MHT. Bar and error bar represent the mean and SE, respectively. **: p<0.01. ***: p<0.001.
(a)
(c)
(b)

7(c) show the temporal changes of the normalized average MPI value, normalized maximum MPI value, and the normalized number of pixels within the ROI, respectively, in the MHT (red bars, n=11) and MHT+CDDP groups (blue bars, n=8). Both the normalized average and maximum MPI values in the MHT+CDDP group were significantly higher than those in the MHT group 3 days after MHT (**: p<0.01 and ***: p<0.001). Although the normalized number of pixels within the ROI in the MHT+CDDP group tended to be lower than that in the MHT group, the difference did not reach statistical significance because of wide scattering of the data.
Histological study Fig. 8 shows typical H&E stain images in the control (upper left), MHT (upper right), CDDP (lower left), and MHT+CDDP groups (lower right). The necrotic area (shown by N) in the MHT+CDDP group was the largest among the four groups. The necrotic areas in the MHT and CDDP groups were larger than that in the control group, whereas the viable areas (shown by V) were smaller than that in the control group. In the control group, the viable area occupied almost the whole area of the image.
MPI for magnetic hyperthermia treatment ・ A. Ohki et al.
47― ―
Fig. 8. Hematoxylin and eosin (H&E) stain images in the control (upper left), MHT (upper right), CDDP (lower left) and MHT+CDDP groups (lower right). In the control group, the stain image was obtained from tumor tissue removed 3 days after the tumor volume exceeded 100 mm3, whereas the stain images in the MHT and MHT+CDDP groups were obtained from tumor tissues removed 3 days after MHT. In the CDDP group, the stain image was obtained from tumor tissue removed 3 days after the injection of CDDP. Magnification, ×10. N: necrotic area. V: viable area. Scale bar=500 μm.

Discussion This study was undertaken to quantitatively evaluate the tumor response to MHT+CDDP in comparison with that of MHT alone using MPI. As previously described, MHT was started approximately 20 min after the injection of 250 mM (14.0 mg Fe/mL) Resovist® and was performed by applying an AMF at a frequency of 600 kHz and a peak amplitude of 3.1 kA/m for 20 min. It is known that the efficiency of MNPs to generate heat under an AMF depends on the frequency and peak amplitude of the AMF6,14). Atsumi et al15). used 600 kHz as the frequency of AMF in consideration of both the safety and the capacity of their power supply. Thus, we also adopted the above values for the frequency and peak amplitude of AMF in consideration of the safety, the capacity of our power supply, and the heating efficiency of MNPs14). The duration of MHT (20 min) was determined mainly in order to prevent mice from awakening from anesthesia during the subsequent MPI study. As shown in Fig. 4, the temperature of the tumor gradually increased and plateaued at about 40.5℃ (mild hyperthermia) approximately 10 minutes or more after the start of MHT. In this study, we decided to adopt mild hyperthermia (40℃ to 41℃) by taking the injection dose of Resovist® as 250 mM (14.0 mg Fe/mL) in order to focus on the synergistic effect between MHT and CDDP, as done by Alvarez-Berrios et al16). As shown in Fig. 5, a significant therapeutic effect of MHT was obtained under these conditions, because the RTVG value in the MHT group was significantly lower than that in the control group 2 days or more after MHT. The therapeutic effect of MHT was also confirmed by the H&E stain image (Fig. 8). Thus, the above conditions for the AMF, duration of MHT, and injection dose of Resovist® appear to have been appropriate for the purpose of this study. Petryk et al. reported that intraperitoneal administration of CDDP at a dose of 5 mg/kg body weight improved the delivery of MNPs to tumors in C3H mice inoculated intradermally with MTG-B cells5) and it helped to enhance the therapeutic effect of MHT3). Thus, we also injected CDDP into mice intraperitoneally at a single dose of 5 mg/kg body weight according to their protocol. As shown in Fig. 5, the RTVG value in the CDDP group was significantly lower than that in the control group 2 days or more after treatment. The therapeutic effect of CDDP was also confirmed by the H&E stain image (Fig. 8). These results appear to indicate the therapeutic effect of CDDP alone and the validity of the dose adopted in this study. As shown in Fig. 5, the RTVG value in the MHT+CDDP group was significantly lower than that in the MHT group 3 days or more after MHT. Furthermore, it was significantly lower than that in the CDDP group at 4 to 11 days except at 6 and 9 days after treatment. These results appear to indicate the synergism of MHT and CDDP. Uptake of CDDP by cancer cells appears to be mainly mediated by two mechanisms, i.e., active transport via copper transporter receptors and passive transport via diffusion through the cellular membrane16). Recently, Alvarez-Berrios et al16). reported that MHT significantly increases cell membrane fluidity and this can be a factor contributing to the increase of CDDP uptake in MHT-treated Caco-2 cells. Furthermore, it has been reported that blood flow increases when MHT is applied and this helps to accumulate anti-cancer drugs within the heated tissue17). Although copper transporter receptors might have a crucial role in the uptake of CDDP by cancer cells, the above synergistic effect of MHT and CDDP would be largely related to the increase of cell membrane fluidity16) and/or the increase of blood flow17). As shown in Fig. 7, our results demonstrated that both the normalized average and maximum MPI values in the MHT+CDDP group were significantly higher than those in the MHT group 3 days after MHT. As previously described, there was an excellent linear correlation between the average MPI value and the iron
48― ―
Thermal Med, 33[2]: 39-51, 2017.

concentration of Resovist® in phantom studies (Fig. 3). From this finding, it appears that the change in the average MPI value corresponds to that in the average amount of MNPs per voxel, i.e., the average concentration of MNPs. Thus, the results shown in Fig. 7 appear to indicate that CDDP changed the environment surrounding the tumor tissues and enhanced the retention of MNPs after MHT. When Resovist® with an iron concentration of 250 mM (14.0 mg Fe/mL) was directly injected into the tumor (Fig. 6), the average MPI values immediately before MHT were 1.87±0.12 (mean±SE) and 2.08±0.22 in the MHT and MHT+CDDP groups, respectively (graph not shown). These values were much smaller than the average MPI value (4.91±0.40) in phantom studies (Fig. 3). This appears to be mainly due to the fact that the concentration of Resovist® was diluted when injected into the tumor. Tumor tissues often have more leaky vasculatures than those of normal tissues18). Nano-sized agents with long circulation times leak preferentially into tumor tissues through leaky tumor vasculatures and are then retained in the tumor bed due to reduced lymphatic drainage18). This feature of tumor tissues is called the “enhanced permeability and retention (EPR) effect”18). In order to develop the EPR effect, it is important to alter the tumor vascular barrier, to increase local blood flow, and to reduce tumor interstitial fluid pressure5). It has been reported that apoptosis induced by Taxane decompresses blood vessels and decreases tumor interstitial fluid pressure19), which could enhance the EPR effect5). It has also been reported that CDDP induces apoptosis of cancer cells in a dose-dependent manner, and hyperthermia enhances CDDP-induced apoptosis20). Therefore, CDDP-induced apoptosis is expected to reduce the interstitial fluid pressure and then enhance the retention of MNPs after MHT. According to a previous study using A549 lung cancer cells, there was no significant difference between the viability of cells exposed to MHT alone and MHT+CDDP 48 hours after treatment, whereas there was a significant difference between them 72 hours after treatment21). At this time point, the cells also responded to the CDDP alone21). Moreover, when the cells were treated with CDDP combined with MHT, the cell morphology changed, i.e., cells like blebs or localized decoupling of the cytoskeleton from the cell membrane were observed, which is an indicator of apoptosis or programmed cell death21,22). Therefore, it appears that administration of CDDP induces apoptosis or cell death and thus reduces interstitial fluid pressure approximately 72 hours (3 days) after treatment. This appears to be the main reason why the normalized average and maximum MPI values in the MHT+CDDP group were significantly higher than those in the MHT group 3 days after MHT (Fig. 7). Once MNPs are injected, MPI studies and MHT can be repeated as long as MNPs remain in the tumor tissues. When considering applications of MHT on a long-term basis, the retention of as many MNPs as possible in the tumor is preferable. Hence, a combination of MHT and CDDP chemotherapy will be valuable when planning the repeated application of MHT to enhance its therapeutic result. In such a case, MPI will be useful for treatment planning because MPI can quantitatively monitor the temporal change of the concentration and spatial distribution of MNPs in the tumor. As previously described, we took the dose of CDDP as 5 mg/kg body weight in this study. It is well known that CDDP exhibits nephrotoxicity23); it has been reported to cause direct tubular necrosis24). Due to this nephrotoxicity, the dose of CDDP is limited in the clinical setting, especially in patients with reduced renal function23). It has been reported that the cytotoxicity of CDDP increases linearly with increasing temperature when combined with hyperthermia25). We previously reported that the temperature in a tumor increased after the start of MHT and reached a higher temperature with increasing concentration of MNPs26). Thus, it is
MPI for magnetic hyperthermia treatment ・ A. Ohki et al.
49― ―

expected that the therapeutic effect of CDDP increases with increasing concentration of MNPs in the tumor or the dose of CDDP can be reduced when combined with MHT. A combination of CDDP chemotherapy and MHT will be useful for enhancing and/or maintaining the therapeutic effect of CDDP especially when the dose of CDDP is limited. A limitation of this study is that the average and maximum MPI values were obtained from a single slice with the maximum signal intensity [Fig. 2(b)]. In order to analyze these values in more detail, three-dimensional (multi-slice) data will be necessary. Furthermore, we injected Resovist® directly into the tumor in this study, because an intravenous-injection approach to achieving the passive targeting of MNPs adequate for MHT is still challenging. As a further investigation, we plan to study the case when MNPs are injected intravenously in the near future.
Conclusion The present study indicates that CDDP enhances the therapeutic effect of MHT and the retention of MNPs in the tumor and suggests that MPI can quantitatively evaluate the tumor response to MHT combined with chemotherapy using CDDP.
Acknowledgements This work was supported by JSPS KAKENHI Grant Numbers JP25282131 and JP15K12508.
Declaration of Interest The authors report no conflicts of interest.
References 1) Gleich B., Weizenecker J.: Tomographic imaging using the nonlinear response of magnetic particles. Nature, 435: 1214-
1217, 2005. 2) Dasari S., Tchounwou P.B.: Cisplatin in cancer therapy: molecular mechanisms of action. Eur J Pharmacol, 740: 364-378,
2014. 3) Petryk A.A., Giustini A.J., Gottesman R.E., Kaufman P.A., Hoopes, P.J.: Magnetic nanoparticle hyperthermia enhancement
of cisplatin chemotherapy cancer treatment. Int J Hyperthermia, 29: 845-851, 2013. 4) Gonzalez V.M., Fuertes M.A., Alonso C., Perez, J.M.: Is cisplatin-induced cell death always produced by apoptosis? Mol
Pharmacol, 59: 657-663, 2001. 5) Petryk A.A., Giustini A.J., Gottesman R.E., Hoopes P.J.: Improved delivery of magnetic nanoparticles with chemotherapy
cancer treatment. Proc SPIE Int Soc Opt Eng 26, 8584, 2013. 6) Kumar C.S., Mohammad, F.: Magnetic nanomaterials for hyperthermia-based therapy and controlled drug delivery. Adv
Drug Deliv Rev, 63: 789-808, 2011. 7) Abe M., Hiraoka M., Takahashi M., Egawa S., Matsuda C., Onoyama Y., Morita K., Kakehi M., Sugahara T.: Multi-
institutional studies on hyperthermia using an 8-MHz radiofrequency capacitive heating device (Thermotron RF-8) in combination with radiation for cancer therapy. Cancer, 58: 1589-1595, 1986.
8) Petryk A.A., Giustini A.J., Gottesman R.E., Trembly B.S., Hoopes P.J.: Comparison of magnetic nanoparticle and microwave hyperthermia cancer treatment methodology and treatment effect in a rodent breast cancer. Int J Hyperthermia, 29: 819-827, 2013.
50― ―
Thermal Med, 33[2]: 39-51, 2017.

9) Ohki A., Kuboyabu T., Aoki M., Yamawaki M., Murase, K.: Quantitative evaluation of tumor response to combination of magnetic hyperthermia treatment and radiation therapy using magnetic particle imaging. Int J Nanomed Nanosurg, 2: 1-6, 2016.
10) Murase K., Hiratsuka S., Song R., Takeuchi Y.: Development of a system for magnetic particle imaging using neodymium magnets and gradiometer. Jpn J Appl Phys, 53: 067001, 2014.
11) Murase K., Song R., Hiratsuka S.: Magnetic particle imaging of blood coagulation. Appl Phys Lett, 104: 252409, 2014. 12) Murase K., Aoki M., Banura N., Nishimoto K., Mimura A., Kuboyabu T., Yabata I.: Usefulness of magnetic particle imaging
for predicting the therapeutic effect of magnetic hyperthermia. Open J Med Imaging, 5: 85-99, 2015. 13) Murase K., Banura N., Mimura A., Nishimoto K.: Simple and practical method for correcting the inhomogeneous sensitivity
of a receiving coil in magnetic particle imaging. Jpn J Appl Phys, 54: 038001, 2015. 14) Murase K., Oonoki J., Takata H., Song R., Angraini A., Ausanai P., Matsushita T.: Simulation and experimental studies on
magnetic hyperthermia with use of superparamagnetic iron oxide nanoparticles. Radiol Phys Technol, 4: 194-202, 2011. 15) Atsumi T., Jeyadevan B., Sato Y., Tohji K.: Heating efficiency of magnetite particles exposed to AC magnetic field. J Magn
Magn Mater, 310: 2841-2843, 2007. 16) Alvarez-Berríos M.P., Castillo A., Mendéz J., Soto O., Rinaldi C., Torres-Lugo M.: Hyperthermic potentiation of cisplatin
by magnetic nanoparticle heaters is correlated with an increase in cell membrane fluidity. Int J Nanomed, 8: 1003-1013, 2013.
17) Giustini A.J., Petryk A.A., Cassim S.M., Tate J.A., Baker I., Hoopes P.J.: Magnetic nanoparticle hyperthermia in cancer treatment. Nano Life, 1: 1-23, 2010.
18) Kobayashi H., Watanabe R., Choyke P.L.: Improving conventional enhanced permeability and retention (EPR) effects; what is the appropriate target? Theranostics, 4: 81-89, 2014.
19) Griffon-Etienne G., Boucher Y., Brekken C., Suit H.D., Jain R.K.: Taxane-induced apoptosis decompresses blood vessels and lowers interstitial fluid pressure in solid tumors: clinical implications. Cancer Res, 59: 3776-3782, 1999.
20) Sato H., Umemura M., Mitsudo K., Kioi M., Nakashima H., Iwai T., Feng X., Oda K., Miyajima A., Makino A., Iwai M., Fujita T., Yokoyama U., Okumura S., Sato M., Eguchi H., Tohnai I., Ishikawa Y.: Hyperthermia generated with ferucarbotran (Resovist®) in an alternating magnetic field enhances cisplatin-induced apoptosis of cultured human oral cancer cells. J Physiol Sci, 64: 177-183, 2014.
21) Kruse A.M., Meenach S.A., Anderson K.W., Hilt J.Z.: Synthesis and characterization of CREKA-conjugated iron oxide nanoparticles for hyperthermia applications. Acta Biomater, 10: 2622-2629, 2014.
22) Charras G.T., Coughlin M., Mitchison T.J., Mahadevan L.: Life and times of a cellular bleb. Biophys J, 94: 1836-1853, 2008. 23) Murase K., Tachibana A., Kusakabe Y., Matsuura R., Miyazaki S.: A method for quantitative assessment of renal function
using dynamic contrast-enhanced computed tomography: evaluation of drug-induced nephrotoxicity in rats. Med Phys, 35: 5768-5776, 2008.
24) Winston J.A., Safirstein R.: Reduced renal blood flow in early cisplatin-induced acute renal failure in the rat. Am J Physiol, 249: F490-F496, 1985.
25) Bull J.M.: An update on the anticancer effects of a combination of chemotherapy and hyperthermia. Cancer Res, 44: 4853s-4856s, 1984.
26) Kuboyabu T., Yabata I., Aoki M., Banura N., Nishimoto K., Mimura A., Murase K.: Magnetic particle imaging for magnetic hyperthermia treatment: visualization and quantification of the intratumoral distribution and temporal change of magnetic nanoparticles in vivo. Open J Med Imaging, 6: 1-15, 2016.
──────────────────────
MPI for magnetic hyperthermia treatment ・ A. Ohki et al.
51― ―