magic quadrant for business intelligence platforms quadrant for business intelligence ... page on...
TRANSCRIPT
Magic Quadrant for Business Intelligence Platforms
6 February 2012 ID:G00225500
Analyst(s): John Hagerty, Rita L. Sallam, James Richardson
VIEW SUMMARY
In 2011, business users continued to exert significant influence over BI decisions, often choosing data discovery products in addition to/as alternatives to traditional BI tools. An avalanche of new use cases, content types and interaction models expands the scope for tomorrow's BI platforms.
Market Definition/Description
This document was revised on 10 February 2012. For more information, see the Corrections
page on gartner.com.
Business intelligence (BI) platforms enable all types of users — from IT staff to consultants to business
users — to build applications that help organizations learn about and understand their business. Gartner
defines a BI platform as a software platform that delivers the 14 capabilities listed below. These
capabilities are organized into three categories of functionality: integration, information delivery and
analysis. Information delivery is the core focus of most BI projects today, but we are seeing an
increased interest in deployments of analysis to discover new insights, and in integration to implement
those insights.
Return to Top
Integration
BI infrastructure — All tools in the platform use the same security, metadata, administration,
portal integration, object model and query engine, and should share the same look and feel.
Metadata management — Not only should all tools leverage the same metadata, but the
offering should provide a robust way to search, capture, store, reuse and publish metadata
objects such as dimensions, hierarchies, measures, performance metrics and report layout
objects.
Development tools — The BI platform should provide a set of programmatic development tools
and a visual development environment, coupled with a software developer's kit for creating BI
applications, integrating them into a business process, and/or embedding them in another
application. The BI platform should also enable developers to build BI applications without coding
by using wizard-like components for a graphical assembly process. The development environment
should also support Web services in performing common tasks such as scheduling, delivering,
administering and managing. In addition, the BI application can assign and track events or tasks
allotted to specific users, based on predefined business rules. Often, this capability can be
delivered by integrating with a separate portal or workflow tool.
Collaboration — This capability enables BI users to share and discuss information, BI content
and results, and/or manage hierarchies and metrics via discussion threads, chat and annotations,
either embedded in the BI platform or through integration with collaboration, social software and
analytical master data management (MDM).
Return to Top
Information Delivery
Reporting — Reporting provides the ability to create formatted and interactive reports, with or
without parameters, with highly scalable distribution and scheduling capabilities. In addition, BI
platform vendors should handle a wide array of reporting styles (for example, financial,
operational and performance dashboards), and should enable users to access and fully interact
with BI content delivered consistently across delivery platforms including the Web, mobile devices
and common portal environments.
Dashboards — This subset of reporting includes the ability to publish formal, Web-based or
mobile reports with intuitive interactive displays of information, including dials, gauges, sliders,
check boxes and traffic lights. These displays indicate the state of the performance metric
compared with a goal or target value. Increasingly, dashboards are used to disseminate real-time
data from operational applications or in conjunction with a complex event processing engine.
Ad hoc query — This capability enables users to ask their own questions of the data, without
relying on IT to create a report. In particular, the tools must have a robust semantic layer to allow
users to navigate available data sources. These tools should include a disconnected analysis
capability that enables users to access BI content and analyze data remotely without being
connected to a server-based BI application. In addition, these tools should offer query governance
and auditing capabilities to ensure that queries perform well.
EVALUATION CRITERIA DEFINITIONS
Ability to Execute
Product/Service: Core goods and services offered by
the vendor that compete in/serve the defined market.
This includes current product/service capabilities,
quality, feature sets and skills, whether offered
natively or through OEM agreements/partnerships as
defined in the market definition and detailed in the
subcriteria.
Overall Viability (Business Unit, Financial,
Strategy, Organization): Viability includes an
assessment of the overall organization's financial
health, the financial and practical success of the
business unit, and the likelihood that the individual
business unit will continue investing in the product, will
continue offering the product and will advance the
state of the art within the organization's portfolio of
products.
Sales Execution/Pricing: The vendor's capabilities in
all pre-sales activities and the structure that supports
them. This includes deal management, pricing and
negotiation, pre-sales support and the overall
effectiveness of the sales channel.
Market Responsiveness and Track Record: Ability
to respond, change direction, be flexible and achieve
competitive success as opportunities develop,
competitors act, customer needs evolve and market
dynamics change. This criterion also considers the
vendor's history of responsiveness.
Marketing Execution: The clarity, quality, creativity
and efficacy of programs designed to deliver the
organization's message to influence the market,
promote the brand and business, increase awareness
of the products, and establish a positive identification
with the product/brand and organization in the minds
of buyers. This "mind share" can be driven by a
combination of publicity, promotional initiatives,
thought leadership, word-of-mouth and sales activities.
Customer Experience: Relationships, products and
services/programs that enable clients to be successful
with the products evaluated. Specifically, this includes
the ways customers receive technical support or
account support. This can also include ancillary tools,
customer support programs (and the quality thereof),
availability of user groups, service-level agreements
and so on.
Operations: The ability of the organization to meet its
goals and commitments. Factors include the quality of
the organizational structure, including skills,
experiences, programs, systems and other vehicles
that enable the organization to operate effectively and
efficiently on an ongoing basis.
Completeness of Vision
Market Understanding: Ability of the vendor to
understand buyers' wants and needs and to translate
those into products and services. Vendors that show
the highest degree of vision listen to and understand
buyers' wants and needs, and can shape or enhance
those with their added vision.
Marketing Strategy: A clear, differentiated set of
messages consistently communicated throughout the
organization and externalized through the website,
advertising, customer programs and positioning
statements.
Sales Strategy: The strategy for selling products that
uses the appropriate network of direct and indirect
Microsoft Office integration — In some use cases, BI platforms are used as a middle tier to
manage, secure and execute BI tasks, but Microsoft Office (particularly Excel) acts as the BI
client. In these cases, it is vital that the BI vendor provides integration with Microsoft Office
applications, including support for document and presentation formats, formulas, data "refreshes"
and pivot tables. Advanced integration includes cell locking and write-back.
Search-based BI — This applies a search index to both structured and unstructured data sources
and maps them into a classification structure of dimensions and measures (often, but not
necessarily leveraging the BI semantic layer) that users can easily navigate and explore using a
search (Google-like) interface. This capability extends beyond keyword searching of BI platform
content and metadata.
Mobile BI — This capability enables organizations to deliver report and dashboard content to
mobile devices (such as smartphones and tablets) in a publishing and/or interactive (bidirectional)
mode, and takes advantage of the interaction mode of the device (tapping, swiping and so on)
and other capabilities not commonly available on desktops and laptops, such as location
awareness.
Return to Top
Analysis
Online analytical processing (OLAP) — This enables end users to analyze data with extremely
fast query and calculation performance, enabling a style of analysis known as "slicing and dicing."
Users are (often) able to easily navigate multidimensional drill paths. And they (sometimes) have
the ability to write-back values to a proprietary database for planning and "what if" modeling
purposes. This capability could span a variety of data architectures (such as relational or
multidimensional) and storage architectures (such as disk-based or in-memory).
Interactive visualization — This gives users the ability to display numerous aspects of the data
more efficiently by using interactive pictures and charts, instead of rows and columns. Over time,
advanced visualization will go beyond just slicing and dicing data to include more process-driven
BI projects, allowing all stakeholders to better understand the workflow through a visual
representation.
Predictive modeling and data mining — This capability enables organizations to classify
categorical variables and to estimate continuous variables using advanced mathematical
techniques. BI developers are able to integrate models easily into BI reports, dashboards and
analysis, and business processes.
Scorecards — These take the metrics displayed in a dashboard a step further by applying them
to a strategy map that aligns key performance indicators (KPIs) with a strategic objective.
Scorecard metrics should be linked to related reports and information in order to do further
analysis. A scorecard implies the use of a performance management methodology such as Six
Sigma or a balanced scorecard framework.
Return to Top
Magic Quadrant
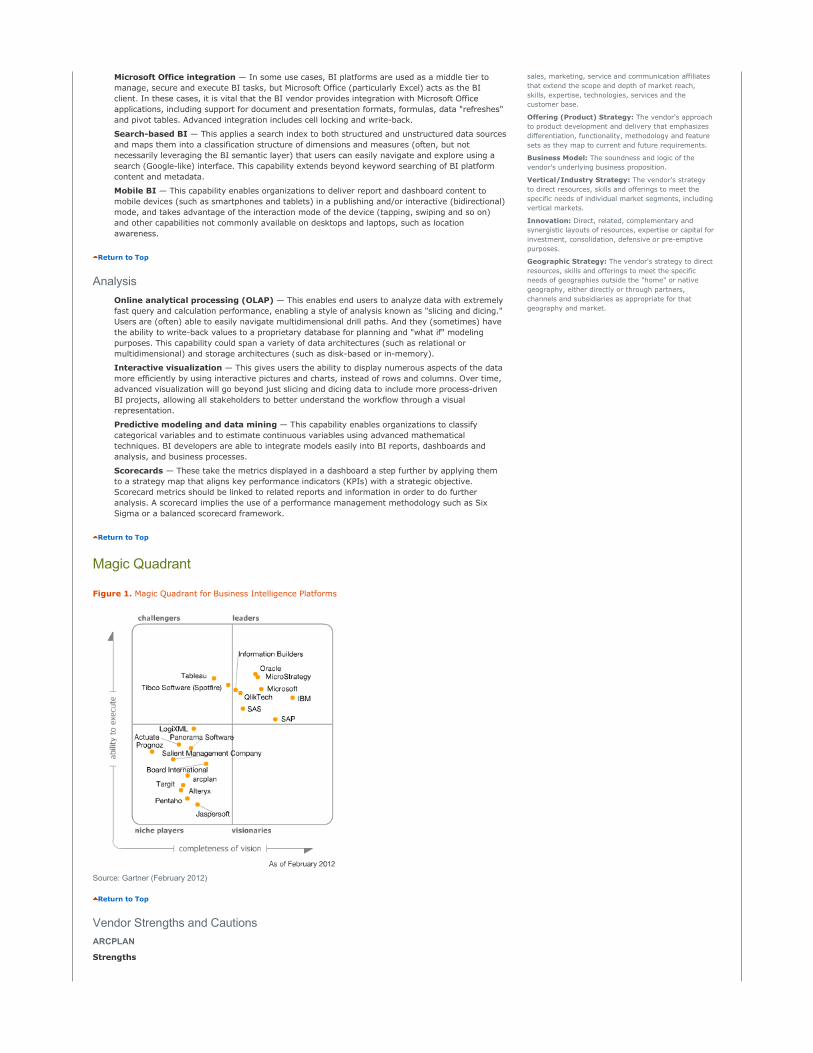
Figure 1. Magic Quadrant for Business Intelligence Platforms
Source: Gartner (February 2012)
Return to Top
Vendor Strengths and Cautions
ARCPLAN
Strengths
sales, marketing, service and communication affiliates
that extend the scope and depth of market reach,
skills, expertise, technologies, services and the
customer base.
Offering (Product) Strategy: The vendor's approach
to product development and delivery that emphasizes
differentiation, functionality, methodology and feature
sets as they map to current and future requirements.
Business Model: The soundness and logic of the
vendor's underlying business proposition.
Vertical/Industry Strategy: The vendor's strategy
to direct resources, skills and offerings to meet the
specific needs of individual market segments, including
vertical markets.
Innovation: Direct, related, complementary and
synergistic layouts of resources, expertise or capital for
investment, consolidation, defensive or pre-emptive
purposes.
Geographic Strategy: The vendor's strategy to direct
resources, skills and offerings to meet the specific
needs of geographies outside the "home" or native
geography, either directly or through partners,
channels and subsidiaries as appropriate for that
geography and market.

arcplan's customer base is firmly established in Western and Central Europe, with nearly 90% of
customer references based in those sectors. Sixty-five percent are based in Western Europe,
compared with an average of 27% for the rest of the survey respondents.
The top reasons why customers select arcplan are data access and integration (top quartile),
functionality, and ease of use for end users. Additionally, references indicate that report design
complexity is a major contributing factor in selecting this vendor, along with the availability of
skills provided by an extensive partner network. Customers rate arcplan's end-user ease of use in
the top quartile, compared with other vendors in this report, and indicate reporting, dashboard,
and scorecard functionality as being above average. They also use OLAP options more
aggressively than the average for other vendors in the survey.
The average tenure of arcplan's customers is 7.2 years, the longest of any vendor in this Magic
Quadrant. This indicates long-term customer satisfaction. However, 10% of customers report a
definite plan to replace the software in three years, which tempers this long-term satisfaction
rating. While the rating is lower than last year's survey response, it is above the average for all
vendors this year.
arcplan's unified platform incorporates guided and self-service analytics, along with budgeting,
planning and forecasting capabilities and integrated search and collaboration functionality. The
breadth of this vendor's platform differentiates it from other pure-play BI vendors in this Magic
Quadrant that lack an integrated planning capability.
Cautions
arcplan is considered the BI standard in less than 35% of its reference accounts, near the bottom
of all vendors in this survey (but nearly double last year's response). A substantial part of
arcplan's business is linked to SAP — 50% of references indicate that it is their ERP standard —
and sales and marketing efforts from SAP for BusinessObjects products and the High-Performance
Analytic Appliance (HANA) platform must be considered a competitive threat to arcplan's near-
and mid-term sales prospects. Interestingly, HANA may also act as an accelerator to arcplan's
growth as another source of data for arcplan to analyze.
Overall, reference customers scored arcplan's product capability below the average for all vendors
in this survey; Microsoft integration was noted as a particular weakness. Performance concerns,
specifically the inability to handle required data volumes, as well as overall system performance,
were noted as problem areas with the software. Given relatively small data volumes (less than
500 gigabytes [GB] of data on average, in the bottom quartile of survey respondents), this is
troubling. It is important to note that arcplan sits on top of existing data sources (for example,
SAP NetWeaver Business Warehouse [BW]) that may have performance constraints of their own,
making it less clear where performance concerns lie.
Scores for product quality, customer experience and platform integration were also below the
average for all respondents, contributing to less positive execution scores in this year's Magic
Quadrant results. arcplan should put a specific plan in place to address concerns over products
and customer experience. It would be unfortunate to lose long-term customer loyalty without
addressing the specific issues noted by customers in this survey.
Return to Top
ACTUATE
Strengths
In 2011, Actuate turned an important corner. It has seen multiple consecutive quarters of double-
digit license revenue growth, with a stronger emphasis on Business Intelligence and Reporting
Tools (BIRT)-based license revenue (marketed as the ActuateOne product line), as well as
improved customer satisfaction ratings in this year's Magic Quadrant survey, largely because a
majority of ActuateOne's customers took part. After many years, it appears that the company's
open-source strategy is finally paying some dividends. While there are differences in responses
from clients on older vs. newer product lines, they are less pronounced than last year. This has
resulted in a higher Ability to Execute rating in the Magic Quadrant.
The top reasons why companies choose Actuate products are functionality, ease of use for
developers, enterprise application integration, and ease of use for end users. The products are
often used to develop information-based applications for internal and external constituents. In
fact, support for large numbers of concurrent users was a leading buying motivation for Actuate
customers — rated No. 1 among all vendors in this survey. While references report a relatively
modest 510 user average, Gartner knows of several implementations where tens of thousands of
consumers access Actuate-generated content.
When complex reporting and development requirements are paramount, Actuate products stack
up well against competitors. Reference accounts rated it as the No. 2 vendor overall for this
requirement.
The company has shown more progress in the transition of its product portfolio and customer base
to BIRT-based products. Actuate reports that BIRT license revenue is growing significantly as a
percentage of total license revenue, and the BIRT onDemand cloud offering is gaining new
customers, with 7% of references saying they use it today.
X2BIRT (the rebranded Xenos acquisition) allows customers to access and query non-
traditional/unstructured data sources including archives, statements and print streams. When
needed, this is a critical component.
Cautions
Customer references note two problem areas that prevent further deployment of the products:
cost and quality of support. Cost has been a perennial concern for Actuate's customers, and it
remains one this year, albeit less so than in prior years. Cost is also the No. 1 reason that broader
deployments are blocked. Quality of support is noted specifically for BIRT products, resulting in a
lower than average support rating for the firm as a whole. This can be troubling for existing
customers that are considering a migration from e.Report-based products.
© 2012 Gartner, Inc. and/or its affiliates. All rights
reserved. Gartner is a registered trademark of Gartner,
Inc. or its affiliates. This publication may not be
reproduced or distributed in any form without Gartner’s
prior written permission. The information contained in
this publication has been obtained from sources believed
to be reliable. Gartner disclaims all warranties as to the
accuracy, completeness or adequacy of such information
and shall have no liability for errors, omissions or
inadequacies in such information. This publication
consists of the opinions of Gartner’s research
organization and should not be construed as statements
of fact. The opinions expressed herein are subject to
change without notice. Although Gartner research may
include a discussion of related legal issues, Gartner does
not provide legal advice or services and its research
should not be construed or used as such. Gartner is a
public company, and its shareholders may include firms
and funds that have financial interests in entities covered
in Gartner research. Gartner’s Board of Directors may
include senior managers of these firms or funds. Gartner
research is produced independently by its research
organization without input or influence from these firms,
funds or their managers. For further information on the
independence and integrity of Gartner research, see
“Guiding Principles on Independence and Objectivity” on
Overall product quality ratings are also lower than the average for all vendors this year, as are
customer experience and sales execution scores. Fortunately, they are better than last year.
Actuate's investment in these areas in 2011 is showing payback; the company must continue to
show improvement in these areas next year to maintain positive momentum in terms of its
execution.
Actuate's customers report using a narrower range of functionality than for other vendors — one
of the lowest in this year's vendor analysis. In addition, only 45% report that they use the
products as their BI standard, below the average for all vendors, but, again, higher than last year.
Based on inquiry and survey results, the company has made progress in changing its reputation
as a company that's difficult to work with. Organizations considering Actuate's products should
check references closely to verify the product fit for use case(s) under evaluation. The company's
transition continues; but it's a long haul that will require management attention and superb
execution.
Return to Top
ALTERYX
Strengths
A new entrant to the 2012 BI platforms Magic Quadrant, Alteryx (formerly SRC) is based in Irvine,
California, and was founded in 1997 with a strong foundation of data integration and advanced
analytic capabilities. Today, it specializes in delivering a business analytic platform to develop
geographic-based applications with significant external content input to enrich business decision
making. A strong network of partners often develop their own applications using the Alteryx
platform for sale to specific regional and/or industry segments. The product is licensed by
subscription.
Customer references indicate that Alteryx's products are used for highly complex analytics on
large data sources (approximately 5 terabytes [TB] on average). The company received the
highest complexity of use scores (meaning the variety of analytic use cases) of any vendor
evaluated in this year's Magic Quadrant. Ad hoc analysis — from simple to complex — is a
demonstrated strength and is rated highest by references across all vendors. Predictive analytics
is also highly rated, with many customers using Alteryx products for decision support in sales and
marketing scenarios, including prospect targeting or store placement based on population
demographics — again, largely based on geographic intelligence.
The company's integration heritage is evident, as references indicate that over 60% of data used
in analyses comes from external sources. In addition, the company scores in the highest quartile
for use of unstructured data and use of content analytics. Integration is also one of the primary
reasons that clients choose Alteryx.
Reference customers also gave the company above average support and product scores.
Additionally, they indicated that the product is selected for its support of large data sources and its
performance against those large datasets.
The company received significant funding in 2011 to expand its sales and marketing efforts and to
broaden its product/company vision to include more analytic scenarios beyond geographic
intelligence.
Cautions
Alteryx is deployed very narrowly within its reference clients, operating on average within single
departments/functional areas, and with fewer than 50 users per implementation. For survey
respondents, the most common factor blocking expansion was competition with a BI corporate
standard. Given its relatively narrow geographic use cases, Alteryx is a classic niche vendor. While
the company does plan to expand to more sophisticated predictive analytics workbench
capabilities in 2012 and beyond, today it is a highly specialized product.
Given those analytic strengths, customers do have concrete product concerns. They are not happy
with the products' data visualization capabilities — rated the lowest of any vendor included in this
year's Magic Quadrant. Clients note concerns about ease of use for developers and users that are
preventing expansion. With ease of use and data visualization driving many BI evaluations,
Alteryx needs to address these criticisms quickly or risk falling behind the market. Direct
conversations with partners reinforced these survey findings. Better visualization is on the product
road map for 2012.
The average tenure of reference customers was 3.5 years — slightly below the average tenure of
all respondents in the Magic Quadrant survey — yet over 10% plan to replace the vendor in the
next three years (or are considering doing so), which is above the average for all respondents.
The short tenure and high replacement factors indicate that the products could be used more
tactically than those of other vendors in this survey. As a counterpoint, Alteryx customers
continue to renew their subscriptions at exceptionally high rates.
All Alteryx references who responded to the BI Platforms Magic Quadrant reference survey were
North American. The company has limited presence outside this market.
Return to Top
BOARD INTERNATIONAL
Strengths
Board International offers a well integrated BI platform that combines planning, reporting and
analysis capabilities in a single integrated product.
Historically, Board has focused on developing and deploying custom analytic applications (on the
same foundation as its corporate performance management [CPM] applications). This unified
approach remains its key value proposition, and is evident in its usage — at 29%, a higher
proportion of Board users are monitoring their performance via a formal scorecard than those of
any other vendor surveyed for this Magic Quadrant.
its website,
Board's "toolkit" approach to BI application development handles database creation and updates,
data presentation and analysis, and process modeling in a single graphical environment without
programming. This is a differentiator for the company: more Board customers selected it due to a
perceived lower implementation cost and effort than for any other on-premises BI vendor (only
pure cloud vendors ranked higher).
Board has worked hard in recent releases to deliver an interactive, visually aesthetic experience
for users (via its extensive use of Windows Presentation Foundation and Silverlight), and
customers now rate ease of use for end users as the top reason for selecting Board. In fact, when
considering overall ease of use (for end users and developers), only data discovery vendors rated
higher — no mean feat given Board's more traditional OLAP-led approach. Board is innovating at
the back end too, adding new hybrid in-memory technology to its offering in 2011 (see "Need for
Speed Powers In-Memory Business Intelligence").
Board's ability to meet both BI and CPM (particularly planning) needs in a single product makes it
a strategic choice for the firms using it — it is considered a BI standard by 83% of its surveyed
customers, the highest of any vendor featured on this Magic Quadrant. Along with this is a
strongly positive perception in its customer base regarding Board's future as their BI supplier.
Cautions
Board offers a functionally complete and capable BI product. However, survey feedback from
Board's customers about its BI platform functionality fell below the average in most areas this
year. Its customers rated it above or close to average in four functional capabilities: reporting,
dashboards, development tools and BI infrastructure.
Board's customers also report below average product quality (with the lowest rating of any vendor
on the Magic Quadrant this year). This, taken in combination with customer support rated in the
lowest quartile, amounts to a diminished customer experience for Board users. It should be noted
that innovation, and the kind of growth experienced by Board in 2011, can be disruptive to an
existing customer base. According to the vendor it is likely that its customers are experiencing
issues with the quality of its latest versions, due to the functional innovation they contain. If this is
correct, the issues with customer experience should be short-term.
Board's core markets are in Europe, with emergent adoption elsewhere. Board is looking to grow
its global presence — it now has operations in 12 countries worldwide, adding three new ones in
2011 in China, Japan and Mexico. However, its direct presence tends to be limited outside Europe
— it has less than 10 full-time equivalents in the U.S., for example.
Firms considering Board should talk to references that can vouch for its use at scale. It's evident
that Board's customers are smaller firms on average, and its deployments are among the smallest
of the vendors covered in this Magic Quadrant. The Board customers surveyed had 139 users on
average, compared to the survey average of 1,176 users. Board is getting traction in some larger
firms (notable recent wins include Puma, Triumph, Giorgio Armani and Nike US), so this survey
finding may reflect historical buying patterns rather than technical limitation.
Board's technology remains Windows-only, which limits its potential to expand into some
segments of the enterprise market.
Return to Top
IBM
Strengths
IBM maintains its leading position on the Completeness of Vision axis for this year's Magic
Quadrant. The company takes a holistic approach to what it calls Business Analytics and
Optimization (BAO), combining comprehensive software, hardware and services in a coordinated
market offering. IBM's business analytics software portfolio includes a unified BI, analytics and
performance management platform, and is complemented by IBM information management
software and appliances (Netezza, for example). Services are made up of a consulting line of
nearly 9,000 people, which is a growing part of IBM Global Business Services (GBS). IBM can offer
both a tools-based and/or a solution-driven offering, along with significant vertical expertise, to
customers and prospects.
In 4Q10, IBM introduced its latest business analytics platform, IBM Cognos 10. Throughout 2011,
additional capabilities have been released and customer adoption has begun in earnest. Cognos 10
references who responded to this year's Magic Quadrant survey painted a very interesting
snapshot — on average nearly 4,000 users, over 12 TB of data, broad functional use, and very
high platform integration scores, all at or near the top of all ratings for all vendors in this report.
Overall, Cognos 10 references were significantly more satisfied than Cognos 8 customers, who
were the majority of IBM's survey respondents. While some indicated that upgrading from Cognos
8 to Cognos 10 had some complexity, the majority rated it as straightforward or very
straightforward. This bodes well for IBM's future ability to execute, providing the firm delivers
superior service and support and problem-free software.
The average tenure of IBM respondents was seven years, second highest of all vendors in this
survey. Gartner often hears this long-standing customer commitment in inquiry, and this
represents a strong customer loyalty factor. This year, less than 7% of references noted that they
are planning to discontinue use of the software in the next three years (or are considering doing
so), which is significantly lower than last year's result.
Advanced analytics is a particular IBM strength. The company's SPSS software continues to
advance nicely, readily allowing IBM to bid for predictive analytics and statistical use cases.
Customers rated IBM's predictive capabilities in the top quartile of all vendors. A secret weapon at
IBM's disposal — IBM Research — delivers another level of research and development prowess to
the overall IBM value proposition. For example, Watson, the Deep Question and Answer system
that interprets natural language and scores possible answers based on probability, is a visible
example of IBM Research at work. While not a part of the Cognos 10 platform, it demonstrates the
depth and breadth that IBM can bring to clients' advanced analytic scenarios.
The top reasons why customers select IBM are functionality, ease of use for end users, and data
access and integration. IBM's road map and future vision weighed heavily in reference decisions.
In 2011, IBM delivered a new Cognos 10 mobile application for the iPad that is included free in
existing user roles. In early 2012 the company will introduce Cognos Insight, a personal, desktop
BI product that enables independent discovery and "what if" modeling, while also providing full
interoperability with the larger workgroup and enterprise solutions.
Cautions
Twenty-three percent of Cognos 8 references indicate that performance continues to be
problematic (a persistent problem for the last several years), nearly three times the average
response for other vendors evaluated in this Magic Quadrant. In contrast, Cognos 10 references
reported below average performance concerns. This is a sure signal that IBM must encourage
upgrades to Cognos 10 without technical and/or financial disruption.
Again this year, references consider the Cognos products more difficult to implement and use than
those of competitors. While Cognos 10 was rated slightly below average, other IBM products
(Cognos 8, SPSS software and Cognos TM1) were deemed significantly more difficult. These are
cited as two major reasons that limit expanded BI deployments with Cognos 8. As such, improved
system administration and end-user usability were major development themes of the Cognos 10
release. References indicate that Cognos software is used largely by a consumer/casual user
population. Reporting is the most extensively deployed component, followed by ad hoc query and
OLAP analysis.
IBM's customers also continue to have less than optimal customer experiences, with support and
sales interactions, along with product quality, rated in the bottom quartile of all vendors reviewed
in this report. References also rate product functionality slightly below the average for all vendors.
The bright spot is that Cognos 10 references rated product functionality near the top of all
vendors, and support, sales and product quality were rated better than for Cognos 8. These issues
remain IBM's Achilles' heel, and will limit its ability to raise execution scores next year unless
action is taken quickly.
License cost continues to be another source of customer concern across all products in the IBM
business analytics portfolio. Gartner client inquiry also bears out this concern. Higher than
expected costs to upgrade from Cognos 8 to Cognos 10 have stalled some projects, but changes
in configuration, user roles, and/or support costs appear to drive the increase. As a counterpoint,
existing Cognos 10 users did not identify license cost as a concern.
Return to Top
INFORMATION BUILDERS
Strengths
Information Builders' customer references report strong BI functionality across the BI platform
spectrum. The WebFocus customers surveyed rated it at or above average in 10 out of 14
capabilities. That said, its strongest area remains reporting: Information Builders' customers
predominantly make great use of parameterized reporting (for example, interactivity via prompts,
drilling or filters) for consumers and casual users. By and large, this is the sweet spot for
WebFocus.
Although the most common reason for selecting WebFocus remains BI functionality, more
Information Builders users select it for its ability to integrate with information infrastructure
(database, middleware) than for any other vendor on the Magic Quadrant. The company's broad
information management capabilities bolster its BI platform and provide differentiation from other
pure-play BI competitors. WebFocus is fully integrated with the firm's iWay integration platform,
which provides adapters for multiple data sources, and data federation, profiling and quality
capabilities, geocoding and real-time search index management, business activity
monitoring/complex-event processing, file-based integration and MDM. This integration makes
Information Builders a good fit for organizations without a data warehouse and for operational
reporting.
The suite has proven user scalability; Information Builders' customers reported the highest
average number of end users of any vendor on the Magic Quadrant (at 3,184, almost three times
the average). This ability to scale for users makes the WebFocus product well suited as a platform
for building custom Web-based BI applications. Customers surveyed indicate that 46% utilize the
product to develop externally facing applications, and that the single strongest business benefit
they'd gained from using Information Builders is "increased customer satisfaction." Its strength in
this type of deployment forms the basis of the firm's approach to software as a service (SaaS) —
rather than offering its own generic BI-in-the-cloud offering, it is instead targeting third-party
independent software vendors (ISVs) that want to develop and deliver their own hosted
applications using WebFocus.
Overall customer experience ratings, including product quality and support measures, put
Information Builders among the top vendors included in this year's Magic Quadrant. Many
contributing metrics, including level of expertise, response time and time to resolution, were rated
highly by Information Builders' clients. Of the company's customers, 68% had encountered no
problems with its software — a top three rating.
Information Builders continues to innovate, with a new range of vertical applications for public
sector needs, an entry-level offering for emerging markets (WebFocus Express), the addition of its
own column-oriented staging engine for query optimization, and a joint appliance venture with
Teradata, drawing on the experience of its successful offering for IBM iSeries machines.
Cautions
Shrinking revenue and market share is a concern. According to data published by Gartner,
Information Builders has seen falling revenue from BI in the past three years, with a 6% fall in
calendar 2010 (in a market that grew 13%). The company is being squeezed between fast
growing data discovery tools and the megavendors' stack-buying agenda. While it's no surprise
that 40% of Information Builders' reference customers stated that Oracle or SAP are their primary
ERP systems, this does constitute a threat to the company's hold as a BI standard in those firms
in the future. It should be noted that 83% of the firms surveyed stated that they had no plans to
discontinue their usage of WebFocus.
While large in scale, WebFocus deployments tend to be analytically simpler than average and have
a narrower scope. Beyond static and parameterized reporting, WebFocus user activity is below
average in all other areas of interactive exploration and analysis of data, ad hoc analysis and
discovery and scorecarding, and in using predictive analytics and/or data mining models. The final
one of these points to Information Builders' inability to capitalize on its strong technical innovation
— WebFocus RStat has been in the market since 2009, yet Information Builders' users report
among the lowest levels of user activity in predictive analytics.
Marketing to non-IT buyers remains a challenge. Information Builders has very limited brand
equity in that segment, which hinders the firm's ability to acquire new customers, and undermines
its ability to sell the analytic applications which are a core part of its go-to-market strategy. The
company is aware of this and has been investing in new messaging and market communications
activity for these segments (in particular its "total view of customer/supplier" positioning, which
leverages both its BI and information management propositions).
Limited geographic coverage remains a constricting issue. Information Builders has a limited
international presence — the vast majority of its direct customers are in the U.S. While progress is
being made, this is still a clear weakness for the vendor in relation to its competitors. There are
exceptions: the company is doing well in Japan, where K. K. Ashisuto is a very strong partner.
While a new WebFocus Express entry-level product may see downloads in Asia, Russia, Eastern
Europe, the Middle East, Africa and South America (the company intends to seed new usage in
these growth markets), the chief concern that Gartner hears from customers outside the U.S. —
the lack of a strong ecosystem of staff skilled in WebFocus — will remain valid.
Return to Top
JASPERSOFT
Strengths
Jaspersoft offers a comprehensive, highly embeddable, open-source BI platform. The Jaspersoft
Enterprise Edition, based on version 4.5 of its platform, includes JasperReports Server (which
incorporates a reporting server, ad hoc query including an enhanced user interface for analysis, in
-memory analysis and dashboarding), JasperReports Library, Jaspersoft iReport Designer,
Jaspersoft Studio (an Eclipse-based report designer), Jaspersoft OLAP and Jaspersoft ETL (which is
the open-source extraction, transformation and loading [ETL] engine from Talend), including
advanced functions from Talend's commercial edition such as change data capture, monitoring,
job versioning and more. Over the past year, Jaspersoft released a broad range of native Apache
Hadoop and NoSQL connectors, as well as support for iPad HTML5-based report and dashboard
delivery and ad hoc authoring and analysis, as well as a software development kit for building
mobile BI applications on the iOS platform.
Due to its embeddable architecture, and the fact that customers can embed its software without
being bound by the GNU General Public License terms and conditions, Jaspersoft earns over half of
its business from more than 400 OEMs and SaaS providers that include Jaspersoft as the BI
components in their software offering, as well as other businesses that integrate Jaspersoft into
their internal applications. Jaspersoft also has an established partner network that includes
companies such as Red Hat, VMware, IBM and Tata. Note that OEMs are not included in our
survey results.
Cost is by far the most compelling part of the Jaspersoft value proposition, and the major
ingredient driving its success. Customers cite total cost of ownership (TCO), license cost, and
implementation cost and effort as among the top reasons for choosing Jaspersoft as their BI
vendor, more often than for most other vendors in the survey. Its low-cost value proposition
extends beyond low initial license cost; Jaspersoft customers also report below average overall BI
platform ownership costs. Its low-cost model also makes it well suited to extranet deployments in
which the number of users is often unknown. Jaspersoft customers use its platform for an above
average percentage of externally facing applications, compared with most other platforms in the
survey.
While Jaspersoft is primarily delivering an open-source version of mainstream BI functionality at a
very low license price point, its product portfolio and road map includes some forward-thinking
elements. These include building connectors for open-source language "R"-based Revolution
Analytics for predictive analytics, those for eXo for collaboration, and those for diverse "big data"
sources such as Hadoop, Hive and HBase, as well as NoSQL sources such as MongoDB and
Cassandra.
Early success in cloud deployments is another strength. In 2010 the company launched Jaspersoft
Live, a SaaS BI offering for proofs of concept and trial purposes. Partners can also leverage the
Jaspersoft multi-tenant platform to build complete solutions for its clients. Jaspersoft will be
offering BI for platform as a service (PaaS) with Red Hat and VMware, and will be embedded with
Red Hat's virtualization offering.
Cautions
Jaspersoft tends to be deployed in smaller companies with smaller data volumes than the survey
average, and implemented in departments rather than enterprisewide. Moreover, Jaspersoft
customers view it as their enterprise standard less frequently than for the majority of vendors
participating in the Magic Quadrant survey.
Even though Jaspersoft has a fully featured BI platform, it is used narrowly in organizations mostly
for reporting. In fact, a higher percentage of Jaspersoft customers use its platform for static
reporting than for all but one other BI vendor in the Magic Quadrant survey, although its
customers rated this functionality below the survey average. Because of Jaspersoft's usage profile,
the platform earned among the lowest complexity of workload scores of any vendor in the survey,
and is among the most limited in terms of the breadth of use of its BI platform functionality. This
usage is consistent with Jaspersoft's roots as an open-source reporting tool; its customers have

not yet begun widely implementing the broader set of BI functionality now available as part of the
Japsersoft BI platform. This is also consistent with anecdotal evidence from Gartner inquiries that
suggests that organizations are increasingly using low-cost alternatives, such as open-source
products, to offload basic reporting functionality to lower overall BI portfolio costs, while using
another BI platform as the enterprise standard.
Of particular concern is Jaspersoft's score for support, which was almost the lowest for the second
year in a row, despite this being a key part of the company's subscription-based business model.
Jaspersoft has not yet distanced itself from its IT-oriented, do-it-yourself, open-source project
roots. Jaspersoft earned below average scores for ease of use for both end users and developers,
as well as for integration of its BI platform components (it was near the bottom for a unified
semantic layer), its product quality and its performance. Despite these results, Jaspersoft
customers still report below average BI platform ownership costs. Moreover, its customers
maintain a positive view of the vendor's future, and report successes with Jaspersoft's product (as
defined by expanded usage) over the past year. One explanation for this paradox is that the value
that organizations derive from Jaspersoft's lower-cost deployments is in line with their level of
investment and expectations.
The threat from low-cost alternatives with a similar value proposition is a concern, particularly
given that many of these competitors have demonstrated stronger execution on key customer
satisfaction measures.
Return to Top
LOGIXML
Strengths
Much like last year, LogiXML continues to deliver on its value proposition of ease of use, rapid time
to deployment, "embeddability" and lower cost compared with the offerings of the traditional
enterprise and open-source market players with which it competes, but with the advantage of
generally higher customer satisfaction with the platform's ease of use, product functionality,
support, sales experience, and product quality than for both types of vendor.
LogiXML's BI platform is sold as a single platform that includes reporting, analysis and dashboards
for both IT and business users, plus data integration. It also introduced mobile capabilities in
2011. LogiXML targets small and midsize businesses (SMBs), departments in large enterprises,
and software/SaaS companies that embed LogiXML's solutions in their own products and
applications. Similar to open-source vendors, a large percentage of LogiXML's customers are ISVs
or SaaS vendors that incorporate the product because of its embeddability and low cost.
Although targeted more at BI developers and IT managers, LogiXML's products include an ad hoc
reporting solution for nontechnical business users. Business-user-oriented interactive visualization
is an area where LogiXML continues to improve. Some implementations, many as part of customer
-facing applications, are deployed to more than 500 users — LogiXML's unlimited user license
model makes it economical to do so. Compared with most other vendors in the survey, LogiXML
has among the highest percentage of external users using its product for more externally facing
applications (52%).
Cost is one of the primary reasons customers choose LogiXML. It is chosen more often than most
other vendors for overall TCO, license cost, and implementation cost and effort. Although LogiXML
tends to focus on reporting and dashboards with less complex deployments in terms of user and
data size, global deployment, and breadth and complexity of use than its competitors, it has one
of the lowest total costs per user in the survey.
Ease of use goes hand-in-hand with cost as a key strength for LogiXML, which is reflected by its
customers giving it among the highest scores for ease of use of any vendor in the survey. The
company includes interfaces for both business users and IT developers to create reports and
dashboards. But its IT-oriented, rapid development environment seems to be most compelling for
its customers. The environment features extensive prebuilt elements for creating content with
minimal coding, while its components and engine are highly embeddable, making LogiXML a
strong choice for OEMs. LogiXML customers report among the shortest time to develop simple to
complex BI content of any vendor in the Magic Quadrant survey. The platform productivity
features are enhanced by a robust user-community-driven website (Logi DevNet) that contains a
best practices discussion forum and hundreds of sample projects, tutorials and training videos. In
addition to ease of use, LogiXML earned high marks for "BI infrastructure" and "BI development
tools," with an above average percentage of its customers reporting "no product-related problems
for wider deployment." These results confirm LogiXML's strength as an easy to use, high-
productivity developer platform.
Cautions
LogiXML is in the cross hairs of competing low-cost alternatives from open-source vendors and
Microsoft. While LogiXML has received a fresh round of funding and has achieved strong market
momentum over the past three years, it is still small, with more limited resources than other
vendors — particularly Microsoft, open-source vendors and other large traditional BI vendors —
when they compete for roughly the same type of customer (SMBs and departments; embedded
use cases, and OEMs).
LogiXML's customers tend to have smaller numbers of users and data volumes (less than half and
less than one third of the survey average, respectively), while a majority do not consider it their
BI standard. A key test of LogiXML's market momentum beyond its current SMB and departmental
target market (and its ability to make upward progress on the Magic Quadrant in the future) will
be its ability to expand its footprint beyond single or multiple departments, and become or replace
the incumbent enterprise BI standard in a larger percentage of its accounts. LogiXML currently
focuses on the SMB and OEM space, where pervasive and large enterprise deployments are less
common.
While LogiXML has an above average overall product rating, its sweet spot is clearly
parameterized and static reporting and dashboards, which are used by the majority of its
customers. In fact, 84% of its customers use its Logi Info product (reporting and dashboards),

while 29% use its ad hoc product. LogiXML's reporting and dashboard capabilities also are rated
higher than its ad hoc analysis, OLAP and interactive visualization capabilities. Because of its focus
on reporting, it earned low workload complexity scores (for example, reporting, static reporting
and dashboards for smaller departmental deployments, the domain use case for LogiXML, are
considered lighter analytic workloads than complex ad hoc analysis and interactive visualization
for large and global deployments), it has some of the least complex deployments, and it is among
the most limited in terms of breadth of functionality (the number of BI capabilities used). LogiXML
added real-time OLAP capabilities for in-memory analysis in 2011 and plans to deliver an
expanded set of interactive visualization and advanced analysis capabilities in 2012. The company
is hopeful that this combination will result in expanded use of LogiXML for analysis and interactive
visualization use cases in the future.
LogiXML's highly embeddable architecture is both a positive and a negative. On the one hand, this
attribute makes it highly attractive to organizations embedding BI into existing operational
applications and to OEMs looking to embed its product, an area where LogiXML has been
successful to date. On the other hand, its high percentage of OEM business will limit its ability to
expand brand awareness, as most users (and potential customers of the product) will never know
they are using the company's products.
Although LogiXML has executed vertically focused marketing campaigns, targeted in particular at
healthcare, manufacturing and financial services over the past year, and its OEM partners create
vertical solutions using its platform, it has more limited, directly marketed packaged vertical
offerings than many leading vendors. Moreover, its geographical presence, while growing outside
North America (particularly in Western Europe and Asia, where the company has OEM, reseller
and system integration partners), is more limited than for its larger competitors.
Return to Top
MICROSOFT
Strengths
Microsoft offers a competitive set of BI capabilities, packaging and pricing that appeal to Microsoft
developers and its independent distributor channel. The company has consistently invested in
building and enhancing BI capabilities into three of its core offerings — Microsoft Office
(specifically Excel), Microsoft SQL Server and Microsoft SharePoint — in order to increase their
value and drive upgrades. By incorporating BI capabilities into its most ubiquitous products,
Microsoft virtually guarantees its BI offering's continued adoption, particularly in organizations
with a Microsoft-centric information infrastructure. As a result of this strategy, since the
company's serious entry into the market in 2000, Microsoft's BI market share has grown steadily
to take the No. 3 spot in 2010.
Microsoft's low-license-cost bundling strategy for BI platforms makes it a compelling license-cost
value proposition for organizations that want to deploy BI to a wider range of users, or that want
to lower overall BI portfolio license costs by using lower-cost BI tools for basic BI functions. Its
license cost profile is comparable to open-source BI vendors, and is considerably less than its
commercial competitors. Moreover, Microsoft has added a new BI package (server/client access
license [CAL] model) for SQL Server 2012, which makes it easier for customers to license the SQL
Server BI portion of the stack. As Microsoft continues to enhance its BI capabilities in products
that most companies already own (Office, SQL Server and SharePoint), the functionality premium
for alternatives may become increasingly difficult to justify for many organizations. In the Magic
Quadrant customer survey, more Microsoft customers cited TCO and license cost as the No. 1
reason for selecting Microsoft as a BI vendor than for most other vendors in the survey.
Microsoft's market success is also driven in part by its IT-oriented, BI authoring tools within SQL
Server, which are based on Visual Studio, the broadly adopted development environment. This
approach, along with targeted marketing efforts and programs for building strong developer
communities and support, has helped Microsoft lower the cost and expand the availability of its BI
skills. In the Magic Quadrant survey, Microsoft customers rate its BI platform infrastructure among
the highest compared to most other vendors, and a higher percentage of customers use it
extensively. Moreover, "wide availability of skills" is among the top reasons why customers select
Microsoft more often than all other competing vendors in the survey.
While Microsoft has traditionally focused on the developer, it continues to enhance reporting,
dashboarding and data discovery capabilities in Excel with the intention of making Excel not only
the most widely deployed BI tool, but also the most functional for business users. With its April
2010 release of SQL Server PowerPivot and the upcoming release of Power View in SQL Server
2012, Microsoft has earned the distinction of being the first megavendor to offer a credible
response to the groundswell of interest in, and acceptance of, interactive visualization tools as an
alternative and complement to traditional report-centric architectures. Compared to what is
available with competing stand-alone data discovery products, the user and usage monitoring
capabilities of PowerPivot workbooks in SharePoint give IT greater control over what content is
shared, and the process of validating data sources, models and calculations contained in
PowerPivot workbooks. With the SQL Server 2012 release Microsoft is expected to build on this set
of managed business user capabilities by enabling PowerPivot to move seamlessly from a personal
workbook to an enterprise data source and deployment. Specifically, IT will be able to import user
-created content from a personal PowerPivot model into the professional BI environment of Visual
Studio. This capability can help to bridge the departmental silo/enterprise divide, without
compromising on business-user flexibility.
Use of OLAP functionality by Microsoft customers is among the highest when compared to other
vendors. This can be attributed to the success and adoption of Microsoft SQL Server Analysis
Services functionality bundled with Microsoft SQL Server and its optimizations with Microsoft front-
end tools. Building on the in-memory capabilities of SQL Server PowerPivot, in SQL Server 2012,
Microsoft will introduce a fully in-memory version of Microsoft Analysis Services cubes that enables
the subsecond analysis of billions of rows (as opposed to hundreds of millions of rows supported
today by PowerPivot), to address the needs of organizations that are turning to newer in-memory
OLAP architectures over traditional multidimensional OLAP architectures to support dynamic and
interactive analysis of large datasets.
Microsoft's cloud-based DataMarket offering, which makes external data easier to consume,
analyze and integrate with internal data, is a unique enhancement to Microsoft's portfolio of BI
capabilities. DataMarket is an online data market that enables ISVs and business users to access,
purchase and analyze trusted, public-domain and commercial premium data. ISVs can use this
data to build new analytic applications. Business users can incorporate and analyze this external
data with internal data sources using Microsoft Excel and PowerPivot, or with partner tools, such
as those from Tableau Software.
Cautions
Since Gartner began surveying BI platform customers for this Magic Quadrant research five years
ago, this is the first year that Microsoft has scored below the survey average on key Ability to
Execute measures, including overall product functionality, support and customer experience.
These results are reflected in Microsoft's lower relative Ability to Execute position on the Magic
Quadrant compared to last year.
Multiproduct complexity is a challenge. Because Microsoft's BI platform capabilities exist across
three different tools (Office, SQL Server and SharePoint) that also perform non-BI functions,
integrating the necessary components and building the applications is left to the organization.
Microsoft's do-it-yourself approach puts more of the BI solutions development and integration
onus for the platform components on customers, compared with the all-in-one purpose-built BI
platforms offered by most other vendors in the BI market. Microsoft's road map for Office, which
features the consolidation of more and more front-end reporting, dashboard and analysis
capabilities in Excel, should begin to address some of this complexity over time. Moreover,
although BI in the cloud is not yet a high priority for most organizations in the Magic Quadrant
survey, Microsoft has placed cloud deployment at the top of its list of major development and go-
to-market initiatives for BI by ultimately making its core BI products — SQL Server, SharePoint
and Office — available in the cloud. This investment and emphasis is core to Microsoft's strategy
to make BI easy to deploy and low-cost — cloud-based BI will, in theory, remove some of the
complexity of the three-component requirement.
Microsoft lags behind most other BI vendors in delivering mobile BI capabilities. It has, instead,
relied on partners, such as Decision Support Panel, Roambi and Extended Results, to build mobile
solutions for Apple iOS that integrate with Microsoft BI components. Microsoft BI assets can run in
a browser today, but they are not optimized for iOS, Android or Windows devices. Microsoft has
stated that it plans to optimize browser experiences on mobile devices in the future, including the
version of Safari provided by the iPad. It is notable that despite limitations to Microsoft's current
mobile BI capability, an above average percentage of Microsoft BI customers report that they plan
to deploy a mobile BI solution in the next 12 months.
Microsoft discontinued the development of Microsoft Office PerformancePoint Server 2007 (PPS
2007) as a stand-alone solution for financial analytic applications (for example, planning,
budgeting and consolidation) in favor of moving its CPM capabilities, such as financial reporting,
into the Dynamics applications. Microsoft moved the functionality in PPS 2007 for dashboards,
scorecards and analysis natively into SharePoint as SharePoint 2010 PerformancePoint Services.
As a result, Microsoft's performance management product strategy lags behind that of the other
stack vendors (IBM, Oracle and SAP) that offer stand-alone CPM products. Microsoft instead relies
on its partners to deliver Microsoft-based CPM solutions.
There is currently no single business metadata layer or capability that spans Microsoft's BI
platform components, and there are limited capabilities for sophisticated metadata modeling,
impact analysis, data lineage and change management. In Gartner's BI platform customer
surveys, Microsoft scores below average year after year for its metadata capabilities. This year is
no different; Microsoft earned among the lowest semantic layer integration and metadata
functional rating scores of any vendor. The lack of a unified semantic model has been a key
customer pain point and limitation. In response, Microsoft will be shipping the BI semantic model
as the single business metadata layer, in the SQL Server 2012 release for relational and
multidimensional data, and is adding data lineage, impact analysis and master data services in
SQL Server 2012. As customers upgrade, we would expect these results to improve in next year's
Magic Quadrant survey.
Microsoft's recent announcement to support Hadoop on Windows is a signal that it has plans to
support diverse data types. However, unlike Oracle and IBM, beyond Hadoop, even though
Microsoft has Bing, its core search engine, and FAST, its enterprise search engine in SharePoint
2010, Microsoft has not articulated a comprehensive vision around delivering analytics for diverse
data. At the time of the FAST acquisition, however, FAST was gaining some traction with its BI
search capabilities.
Return to Top
MICROSTRATEGY
Strengths
MicroStrategy specializes in enterprise BI deployments running on top of large enterprise data
warehouses. Its customers cite functionality, performance and support for large data volumes as
top reasons for selecting it as a vendor, more frequently than customers of most other vendors.
Its deployments are among the most complex in terms of large numbers of users, the highest
data volume, broad product functionality use, wide deployment across an enterprise, and
complexity of analytic workload, and its customers have a high level of satisfaction with product
functionality. Moreover, MicroStrategy is typically deployed in larger enterprises that consider it
their enterprise BI standard more often than for most other vendors.
MicroStrategy has a focused vision that maps to key high-value market requirements, particularly
for mobility, and large and diverse data, including social media data sources. The company was
one of the first vendors to invest heavily in deploying BI applications on mobile devices, with
earlier successes than its competitors in accumulating a respectable number of large production
mobile deployments, initially on Research In Motion (RIM) BlackBerry devices and now on the
Apple iPhone and iPad and Android devices. Free trials and online training make it easy for
developers to try and succeed with mobile development. This early investment is beginning to pay
off. In 2011, the MicroStrategy mobile application was one of the top-rated business applications
on the Apple iStore. Magic Quadrant survey results show that MicroStrategy has among the
highest percentage of customers using its mobile capability, with customers rating its mobile
functionality among the highest of all vendors in the survey. Moreover, MicroStrategy has among
the highest percentage of customers that are either using or piloting mobile BI (more than twice
the survey average). Beyond mobility, MicroStrategy continues to reinforce its enterprise-scale
pedigree through initiatives for high performance across all layers of its platform and against
extremely large and diverse datasets (for example, support of Hadoop). MicroStrategy has
invested heavily in creating a cloud offering that includes its platform and complementary
technologies, including ETL and data warehousing. MicroStrategy is positioning its cloud offering
as a way to address variable scale requirements, and to lower TCO. Social data is another forward
-looking area of focus for MicroStrategy. This past year, the company delivered a Facebook
connector to enable organizations to integrate Facebook profile data, with user permissions, into a
MicroStrategy analytic application.
Developer productivity for building complex analytic applications is another of MicroStrategy's
strengths. Its efficient, parameterized report development paradigm and object-oriented report
development environment support centralized management, in which a small number of
administrators can support big BI projects with many users, complex reporting and analysis
requirements, and a large amount of data. With an extensive library of prebuilt objects, including
metrics, prompts, filters and statistical functions, developers can create reports and other analytic
content with high degrees of formatting and analytical sophistication, but with less effort and cost
than many other platforms. With each release the company continues to streamline developer and
modeling activities and enhance proactive tools for managing and supporting MicroStrategy
deployments.
In March 2011, MicroStrategy introduced a data discovery capability, Visual Insight, that
complements and fully integrates with its enterprise, report-centric architecture. Visual Insight is
available as a feature of Report Services, MicroStrategy's core product, reducing the need for most
MicroStrategy customers to purchase stand-alone interactive visualization/data discovery
products. Visual Insight is also available in a free personal cloud-based version. These efforts not
only make it easier for a broader set of business users and workgroups to use MicroStrategy, they
also provide capabilities for promoting business-user-authored models (that may include local data
sources, such as Microsoft Excel) to the corporate metadata repository to minimize departmental
silos, an advantage over stand-alone data discovery tools.
MicroStrategy has built its BI platform from the ground up through completely organic
development. The high level of integration of the individual platform components and the
reusability of MicroStrategy's well architected and object-oriented semantic layer are the result of
this strategy, which is reflected in integration scores for MicroStrategy that are among the highest
of any vendor in the Magic Quadrant survey. Without the integration challenges faced by the
megavendors, MicroStrategy has more development cycles available for innovation.
Cautions
While the MicroStrategy development environment is robust and flexible, there is a steep learning
curve, even for seasoned report developers building any level of analytic complexity into
parameterized reports that simulate ad hoc analysis and interactive dashboards for business
users. The need for interactivity beyond parameterized reports and dashboards will only increase
with broader mobile BI application user adoption. Even though usability enhancements were
delivered with MicroStrategy 9.x, such as more one-click user actions, reusable dashboards and
dashboard design wizards, and although MicroStrategy delivered Visual Insight this past year, its
customers continue to rate the platform below average for ease of use. We would expect
MicroStrategy's ease of use assessment to improve as more MicroStrategy users take advantage
of its mobile and Visual Insight interactive visualization capabilities.
Even though MicroStrategy has comparatively moderate administration costs per user compared
to its competitors, its customers report above average license and implementation costs per user.
Moreover, "cost of software" is cited by its customers as the No. 1 product limitation to broader
deployment, more frequently than for most other vendors in this year's Magic Quadrant survey. In
2009, MicroStrategy introduced a fully featured and capable free version, which is upwardly
compatible with new departmental and enterprise pricing packages. In addition, it made a
portfolio of free online training available to make it more attractive and easier to adopt
MicroStrategy outside the high-end enterprise market. Moreover, in 2011, MicroStrategy
introduced MicroStrategy Mobile Suite, which allows anyone to build mobile BI applications at no
cost. Despite these initiatives, plus its new free personal cloud data discovery offering, the cost,
complexity of analysis and large enterprise attributes of most MicroStrategy deployments continue
to reinforce its high-cost image.
While MicroStrategy Mobile, its new social data capabilities and its personal cloud offering will
increase its appeal to business users and line of business owners, the company currently sells
predominantly to IT, which has a stack-centric buying tendency. Megavendors offering end-to-end
BI, CPM, packaged analytic applications and integration middleware optimized for their specific
enterprise applications and technology stacks are at an advantage over MicroStrategy when stack
optimization is an important purchasing criterion. MicroStrategy's focus on BI platforms excludes it
from consideration, particularly in enterprise BI standardization projects where buyers are looking
for single-stack optimizations with the existing information and application infrastructure.
Moreover, MicroStrategy will have to strengthen its sales and marketing capabilities for business
users and line of business owners in order to fully realize the potential of its mobile, data
discovery and cloud offerings.
While MicroStrategy has added OEM relationships, with particular success among SaaS vendors,
and it is continuing to develop partnerships to deliver industry-specific solutions leveraging its
strong product vision, its geographic presence and packaged analytic applications (starter kits)
continue to be more limited, both in number and geography, particularly in emerging markets,
than those of other leading BI platforms. The continued expansion of MicroStrategy's services
group and a renewed focus on system integration partnerships will not only help to minimize skill
deficit barriers for MicroStrategy products, but will also enable it to deliver more industry-specific,
advanced analytic applications based on its platform.
Return to Top
ORACLE
Strengths
In 2011, Oracle Business Intelligence Foundation Suite, with its principal component Oracle
Business Intelligence Enterprise Edition (OBIEE), continued to execute on its stated top-to-bottom
BI vision. This year, the products have the highest aggregate Ability to Execute scores. References
depict a customer base that is Oracle through and through — 85% run Oracle Database as their
data warehouse, nearly 75% run Oracle Applications, and a majority utilizes Oracle Fusion
Middleware. Oracle is deployed most broadly (in respect of global deployment) of any vendor in
this Magic Quadrant, with average user populations nearing 3,000 and data volumes of more than
5 TB, and it is considered the BI standard for nearly 70% of firms surveyed. While complex
workloads are below average, the breadth of use scores in the highest quartile.
During the Magic Quadrant evaluation process, Oracle announced and completed its acquisition of
Endeca, a search-based provider of e-commerce and analytic capabilities. Customer surveys were
conducted before the Endeca acquisition was completed; therefore, Endeca is not factored into the
Magic Quadrant evaluation of Oracle's execution, but was considered as part of its long-term
product vision. Relatively low numbers of existing references access hybrid data types using
OBIEE. Gartner believes that this is a forward-looking acquisition that will have significant impact
on the company's business analytics future (see "Endeca Buy Extends Oracle's Ability to Support
and Discover Diverse Data" for a more detailed opinion of the acquisition).
In October 2011, the company announced an engineered system — Oracle Exalytics In-Memory
Machine — that leveraged assets across the Oracle stack. The integrated hardware/software
analytics solution features a package of OBIEE with new in-memory capabilities (based on Oracle's
acquisition of TimesTen), optimized Oracle Essbase to support the range of traditional BI
(reporting, dashboards and analysis), and dynamic planning, what-if and scenario analysis, as well
as interactive visualization and data discovery capabilities. The system is designed to support high
-performance BI and performance management use cases with the intention of improving the
performance, scale and speed of reporting, analysis and planning applications. It is now generally
available.
References select Oracle primarily for functionality, enterprise application integration, and data
access capabilities. Additionally, customers indicated that they valued the products' ability to
support large numbers of users. Like other megavendors, the product road map plays an
important role in the evaluation process. Ease of use and cost do not factor significantly into the
selection process.
Oracle Business Intelligence Applications (OBIA) are predefined analytic applications for horizontal
business processes such as finance, procurement and sales analysis. Customers and prospects
find this combination of analytic applications built using the OBIEE toolset appealing, with many
buyers selecting both at evaluation time. Additionally, the company also delivers vertical-specific
analytic data models for industries such as retail and financial services for IT buyers looking to
establish a common data model standard as the foundation for analytics.
Cautions
References rate OBIEE as difficult to implement, with only SAS Institute considered more difficult.
Also, the product was rated as having lower than average ease of use scores. As ease of use for
both developers and end users takes on an even more important role in business analytic
deployments and evaluations, Oracle must explicitly address these issues or risk being
marginalized in user-driven projects. The company has been slow to respond to the data discovery
trend. However, some functions are now available in the Exalytics In-Memory Machine, and the
Endeca acquisition will add more capabilities in this important area.
Product functionality evaluation scores remain below average again this year, a trend that
appeared in last year's report. Additionally, customer support and product quality issues are rated
below the average (in the fourth and third quartiles respectively) for all vendors in this report. In
fact, both support and product quality were also noted as issues that blocked further deployments
within customer organizations. This represents a slip from last year's scores. While not huge red
flag items now, they may become more problematic without dedicated company attention to
address client concerns.
Oracle customers use the product mostly for static report viewing, parameterized reporting and
scorecard capabilities, leading to below average user complexity ratings. Slightly more than 25%
of customers Gartner surveyed for this report run the most current version of the BI suite, which
is significantly below average for vendors in this analysis.
More than 10% of survey respondents indicate that they plan to discontinue, or are evaluating a
discontinuation of, software use in the next three years — a relatively high response rate given
responses from the prior year. This is above the average for all vendors in this research.
Return to Top
PANORAMA SOFTWARE
Strengths
Panorama's NovaView BI suite — the product evaluated by Panorama's customers in this survey —
continues to be used primarily as a front end for OLAP databases — chiefly Microsoft SQL Server
Analysis Services — via Multidimensional Expressions (MDX). Similar to last year, references
ranked Panorama in the top quartile of vendors for OLAP and scorecard capabilities. Panorama's
customers indicate that the vendor is used as the BI standard in more than 75% of firms surveyed
— the highest of any vendor in this Magic Quadrant analysis.
In 2011, Panorama introduced a new product, Panorama Necto. This is an example of a
collaborative BI solution that facilitates interaction around BI content in the Panorama Software BI
platform. It also helps users streamline their analyses and learn from best practices through
recommendations for additional relevant BI content and analysis, based on other users' past
behavior and contextual analysis. While generally available, no clients provided survey feedback
for this report. Direct conversations with initial users indicate strong satisfaction with Necto with a
straightforward migration path; however, rollouts have been gradual as departments adapt to this
new analysis paradigm. NovaView BI customers did note that collaboration was a weak link in the
existing product; this should address that concern.
This year, the top reasons why customers choose Panorama software are functionality, ease of
use for end users, performance and cost. References also rate the vendor in the top quartile for
TCO and give Panorama above average ratings for platform integration capabilities. Overall
customer and sales experience ratings are above average, a marked improvement from last year,
and contribute to better execution scores in this year's Magic Quadrant. Another area of
improvement from last year to be noted is that Panorama's support ratings have improved year-
over-year, and customers are now generally positive about the vendor's outlook and the continued
success of Panorama's products within their organizations.
Cautions
Reference customers have flagged one major concern about the NovaView product. They have
indicated that the suite is unreliable and/or unstable, flagging it more often than any other vendor
in the Magic Quadrant. This contributes to below average product quality scores, and is also noted
as the primary barrier preventing further deployment. In 2010, the company recognized that
product and support issues were a concern and took action. While there has been noted
improvement in some areas, there is still work to do on software quality.
In addition to the limitations of NovaView's collaboration capabilities noted above, references gave
low scores to the product's interactive data visualization options. With data discovery and ease of
use so important in purchase and expansion decisions, Panorama must take this criticism seriously
or risk being marginalized, and possibly losing its BI standard designation within reference
accounts.
The average tenure of customers responding to this survey was 5.1 years. More than 20% of
them report that they plan to, or are considering, discontinuing their use of NovaView software
within the next three years. This is troubling, as it is the highest ratio of any vendor in the survey,
albeit similar to last year's response. While there have been improvements in customer
satisfaction this year, we see softness in longer-term vendor support. The company's decision to
maintain two product lines — NovaView and Necto — may contribute to this response, as
customers must consciously license a new product to adopt the Necto capabilities. Microsoft's
anticipated BI release in 2012 may also give customers other options in the future.
Return to Top
PENTAHO
Strengths
Pentaho makes its debut on the Magic Quadrant this year, although it participated in the customer
survey last year. It provides a comprehensive open-source BI platform composed of ETL, OLAP,
reporting, dashboards, ad hoc analysis and data mining components, all managed from a central
BI server deployed either on-premises or in the cloud, with end-user access via the Web or mobile
devices such as the iPad.
Low license cost is central to Pentaho's value proposition. The No. 1 reason that customers choose
Pentaho is for its perceived low license cost and TCO, more often than for any other vendor in the
Magic Quadrant survey. Pentaho's customers are also generally satisfied with their sales
experience, which is an improvement on last year.
Pentaho's lightweight footprint, in which the complete platform can be deployed in a small
environment on a laptop, or can be integrated into an existing scalable architecture such as a grid
for much larger deployments, makes it very flexible in meeting a broad range of deployment
requirements. Moreover, Pentaho is an embeddable platform, making it very attractive to ISVs
and internal IT shops for embedded use cases, which now make up 35% of its business, to deploy
both on-premises and in the cloud.
While open-source vendors, including Pentaho, tend to invest more heavily to achieve feature
parity with the core BI functionality of commercial competitors rather than in innovation, Pentaho
does have focused areas of forward-looking investment, on which it has been able to deliver
quickly. In particular, Pentaho has integrated a data mining project into its BI platform (which its
customers rate above average); it delivered ad hoc reporting for the iPad (in May 2010); and it
was one of the first BI vendors to deliver capabilities for integrating its ETL and BI tools with
Hadoop to support large and diverse data sources (in October 2010). In 2011, Pentaho expanded
its native support for a wide range of Hadoop distributions, NoSQL databases and analytics
databases (in August 2011), and added support for lightweight virtualized data federation (in June
2011).
Cautions
Pentaho's below average aggregate product scores (with below average ratings in all 14 BI
capabilities with the exception of predictive modeling), although higher than last year, are still an
indication that functional gaps in the platform remain. Moreover, Pentaho earned lower ease of
use scores (both for developers and end users) than the survey average, which suggests that
Pentaho needs to continue to improve on both its business user tools, to meet growing
requirements for intuitive and interactive analysis, and the usability and efficiency of its developer
-oriented tools. Moreover, ease of use goes hand in hand with the effort to develop content.
Despite the perception of low TCO as a primary reason for purchasing Pentaho, users report
among the longest BI content development times of all vendors in the Magic Quadrant survey.
However, Pentaho continues to make investments in this area, with the June 2011 introduction of
new and enhanced user-driven BI content development capabilities for all thin-client designers for
reporting, analysis and dashboards. Since only 23% of Pentaho's customer references (this is
lower than only one other vendor) report being on the latest product release, as more customers
upgrade we would expect its functional and ease of use scores to continue to improve in next
year's survey.
Given that Pentaho's subscription-based model hinges on providing superior support, and while we
do see positive improvement on last year's survey, Pentaho's below average product support
scores (particularly related to level of expertise) are a concern, especially since the company's
product is also rated below average in terms of product quality, which tends to result in more
customer interaction with support. Lower support scores could in part be explained by growing
pains from Pentaho's rapid customer growth. During 2011, Pentaho put in place a number of
changes to mature its support and services organization to support its growth, including hiring
customer success managers, expanding the size of its support group, up-skilling its support team,
and separating its escalation teams into two tiers in an effort to improve the customer support
experience. Pentaho also created an OEM Development Services Group to address the customized
needs of services and support for OEMs. Given that Pentaho has had some positive movement in
its customer experience, product and support survey scores over last year's survey, we would
expect to see continued improvements as Pentaho's investments in improving support mature and
its customer base upgrades to its newest releases. However, this remains to be seen. Counter-
intuitively, despite Pentaho's below average scores on most of the major customer experience
measures, its customers have a positive view of the vendor's future. One explanation is that the
value organizations derive from Pentaho's lower-cost deployments is in line with their level of
investment and expectations.
Although Pentaho claims a single unified platform managed from a single server, the repositories
and authoring environments remain separate, with migration to a single repository in process.
Customers in the Magic Quadrant survey rate Pentaho among the lowest for platform integration
of any vendor in the survey. To address this issue, in March 2010 Pentaho released a single
environment for dimensional modeling, data mart building, ETL, OLAP model generation, and
reporting and data analysis/visualization. We would expect customer perception of the level of
integration (like functionality and ease of use noted above) of the Pentaho BI platform to improve
as more customers upgrade to the latest release.
While Pentaho has some very large reference customers, Pentaho deployments still tend to be
primarily departmental. Its customers have among the least complex deployments, which are
roughly one eighth the size of the survey average in terms of number of end users and data
volumes, while a majority of its customers (below the survey average) do not consider it their BI
standard. One reason why Pentaho's references could be smaller may be due to its "try and buy"
sales strategy, whereby deployments start small and grow. Pentaho has a large percentage of
newer customers. Since this is Pentaho's first year on the Magic Quadrant, if customers are
successful with Pentaho we would expect our survey data to show growth in the size and
pervasiveness of Pentaho deployments in future years.
Pentaho recently received an infusion of venture funding, and expanded its already experienced
management team with executives with a strong track record of success. Moreover, Pentaho's
large active community, with 30,000+ members, provides outsized development resources that
make many meaningful contributions to features, quality assurance, documentation, and road
map requirements. This community gives Pentaho access to resources beyond what might be
expected for a company of its size. However, even with its extended resources, Pentaho is small
relative to the leaders in this space, with fewer resources to both enhance its core BI platform so
that it is on a par with commercial equivalents, and to differentiate itself though innovation.
Moreover, its vertical strategy and global reach for its commercial product are more limited than
most of its larger commercial competitors.
Return to Top
PROGNOZ
Strengths
A new entrant to the 2012 BI platforms Magic Quadrant, Prognoz was founded in 1991 in Perm,
Russia, with regional operations in Moscow, Brussels, Beijing and Washington, DC. Its product,
Prognoz 5 Platform, is a unified BI platform with analysis, reporting, OLAP, dashboarding,
modeling and predictive analytic capabilities. The company largely develops specific analytic
applications on a consulting basis with its clients. Eventually, those applications are extended and
new applications built by client organizations.
Prognoz's references rate the company the highest of all vendors in this Magic Quadrant for
customer experience, and near the top for overall sales experience. The company's consultative
approach is obviously well received. With hundreds of development resources available in Russia,
the company is exceptionally responsive to customer requirements.
Customers choose Prognoz most often for its functionally, skills availability (again, company
consultants), and information infrastructure integration. The advanced statistical and analytic
breadth of the product is a foundational element and at the core of the company's DNA. It is
certainly evident when reviewing the platform and resulting applications built for customers. The
product received first quartile scores in both complexity and breadth of use. References have a
very positive outlook for the vendor.
With expertise in many sectors — government ministries, non-government organizations (NGOs)
such as the International Monetary Fund and the World Bank, agriculture and manufacturing —
Prognoz has good credentials to support many industry-driven use cases. References report that
many Prognoz applications are built as externally facing applications — in fact, the highest
percentage reported in this Magic Quadrant analysis — with lots of external content. Given the
company's experience in government ministries and NGOs, it wasn't a surprise that these
applications were used by external customers/constituents.
Cautions
Prognoz's consulting-led approach, while a benefit to some, does significantly limit it as a free-
standing, customer-implemented BI platform. The company has made strides recently in building
out functionality to make the tool more approachable to client BI developers, but existing
customers consistently report that ease of use for developers is a nagging concern. In Gartner's
opinion, this is the company's main challenge to competing in the BI platforms market.
Today, Prognoz is deployed to an average of several hundred users at each account, below the
average for all vendors in this survey, but still a respectable number. References report that
expansion is often blocked when there is limited buy-in to an enterprise approach to business
analytics. Conversations with references indicate that the product may be purchased and deployed
for a specific use case — for example, econometric analysis — but not for general business use.
While Prognoz has established a global footprint in major geographic regions of the world, it is in
its early stages. Local capability is expanding as opportunities are closed, but there remains a high
dependence on resources from headquarters to support local projects. It will take time for the
company to replicate the success in its home market in other geographies.
Return to Top
QLIKTECH
Strengths
QlikTech is a marketing juggernaut; it has brand recognition many times more prominent than a
firm with its current market share would expect. The company continues to be featured in a high
number of Gartner inquiries and evaluations, which reinforces just how strong its momentum is.
QlikTech's QlikView product is a self-contained BI platform, based on a wholly in-memory data
store, with a set of well integrated BI tools. Anecdotal feedback from QlikView's end users
invariably centers on how intuitive and likable the product is to use: 68% of customers surveyed
selected it due to its ease of use for end users — higher than for any other vendor on the Magic
Quadrant.
Based on the survey, QlikView deployments have grown over the past two years, both in terms of
their reach across their customers (most QlikView implementations are regional or national, with
the third widest scope of any vendor on the Magic Quadrant — only trailing Oracle and SAP), and
in terms of the average number of users per customer respondent (a mean of 928 end users, still
below the survey's overall average). Furthermore, QlikTech is building out from its initial
midmarket stronghold; survey data shows that larger organizations are adopting QlikView.
Gartner frequently sees companies deploy QlikView for prototyping and requirements gathering,
leveraging its flexibility to engage end users, usually alongside a more traditionally modeled BI
platform — QlikTech's customers indicate that it is often used alongside SAP and IBM. This
adoption model may explain why only 45% of its customers consider QlikView their BI standard —
the lowest of any vendor rated as a Leader in this Magic Quadrant.
QlikTech's customers report strong delivery of business benefits, particularly in making better
information available to more users and expanding the type of analysis undertaken.
Customers' rating of QlikView's functionality is very positive, in the highest quartile and above
average in nine out of 14 functional capabilities: dashboards, interactive visualization, mobile BI,
search-based BI, scorecards, ad hoc query, Microsoft Office integration, OLAP, and development
tools.
QlikTech has the momentum to be a truly global player, with strong geographic expansion. This is
evident from the customers that completed the Magic Quadrant survey in late 2011. It's already
firmly established in Europe (it originated in Sweden), and is aggressively pursuing growth in
North America. Uniquely among the vendors surveyed, however, QlikTech had almost a third
(32%) of respondents coming from the Middle East and Africa.
Cautions
QlikTech's growing pains are more evident. The note of realism that first appeared in 2010 grew in
2011 and became a genuine concern for 2012. For the first time, QlikTech's customers reported
having a poor overall customer experience (of the vendors on the Magic Quadrant only SAP, IBM,
Targit and Microsoft fared worse), and below average ratings for product quality and support.
Furthermore, more QlikTech customers than for any other vendor (with the exception of Oracle)
said that QlikView became less successful in the previous year (that is, the product is being used
by fewer users, or is being replaced by other tools).
Gartner continues to hear rumblings of discontent from QlikTech customers about the structure of
its pricing model and its high license cost. Despite its strong market position and compelling value
proposition, it is likely to be increasingly difficult for QlikTech to defend its premium price position
as competition grows.
QlikTech faces increasing competition from larger BI vendors offering in-memory offerings and
interactive visualization (particularly Microsoft SQL Server PowerPivot/Power View and
MicroStrategy Visual Insight), all of which are intent on narrowing QlikView's opportunities for
expansion by offering cheaper alternatives.
QlikTech offers limited metadata management. As QlikView grows into larger BI deployments
spanning the enterprise, the lack of an enterprise semantic layer becomes a more pressing issue.
Filling this gap requires additional cost and effort in the management of metadata to lockdown
common definitions and calculations, and to conform dimensions for cross-functional analysis
across QlikView applications. Customers rate its semantic layer capabilities in the lowest quartile.
Although quick to develop simple or moderately complex dashboards, when it comes to building
large, complex reports from various data sources, involving detailed logic or calculations, QlikView
users reported the second slowest turnaround time of any vendor on the Magic Quadrant (only
Pentaho was worse). One of the key issues QlikTech needs to address is QlikView's weakness in
data integration (currently requiring IT scripting), which contributes to this issue.
Although strong on most of the measures driving the Completeness of Vision placing, QlikTech's
product vision is at best focused, at worst limited, when compared with other leading vendors.
This is in part dictated by frame of reference: QlikTech sees itself as playing in a different market
category to traditional BI, which it calls "Business Discovery" (adapting the "data discovery" term
coined by Gartner in 2007). As such it is likely to view a number of the criteria Gartner measures
product vision by as irrelevant to it, given that they address broader BI needs.
Return to Top
SALIENT MANAGEMENT COMPANY
Strengths
As found in its first year on the Magic Quadrant in 2011, Salient's customers are very positive
about the vendor. In the survey, Salient achieved a top-three ranking for customer support
(support expertise, response time and time to resolution); it was among the top three vendors
whose customers had encountered no problems with the software; and it garnered the single best
rating for product quality.
Salient's in-memory-powered BI platform achieved the highest average rating for BI functionality
of any vendor on the Magic Quadrant, with clearly above average scores in all functional areas
except dashboarding.
Write-back and constraint-based modeling functionality is one of Salient's key strengths. The
ability to perform scenario modeling and support planning type use cases is rare in in-memory BI
products, which tend to focus on ad hoc "slice and dice" type interactions.
Processing speed is also a strong suit. Salient's underpinning in-memory technology (which it calls
UXT) switches processing across an array of servers to deliver rapid performance while handling
complex calculations (for example, key performance metrics, productivity metrics, price elasticity,
allocations). No Salient customers reported performance problems, and more of its customers
than for any other vendor cited performance as a reason for selecting it (50% vs. an average of
20.2%).
Salient's customers report more complex user activity than for many other vendors, with a higher
proportion of users doing predictive analytics than for any other vendor. As a result, Salient has a
more analytic user profile; 31% of Salient's users are power users/business analysts (the highest
surveyed, compared with a 21% survey average).
Cautions
Salient is little known in the BI platforms market, pointing to a lack of effective marketing
communications activity in the past. In response to this observation, Salient increased its
investment in marketing in 2011, leading to much expanded above- and below-the-line
communications activity, new staff, and new segment-oriented positioning and campaigns
targeting retail, consumer products, healthcare and the public sector.
Lack of customer acquisition and growth is a concern. Although Salient's customers are among the
most satisfied we surveyed, they are also among the oldest — the average tenure for the Salient
customers surveyed is 6.4 years, and almost 40% have used the product for more than 10 years.
Long tenure comes with customer satisfaction, but it may also indicate an aging installed base and
a firm facing difficulty acquiring new customers.
Despite its customers' across-the-board plaudits, Salient's functionality is narrower than that of
traditional players, in that it does not offer a full set of BI capabilities — lacking production
reporting and ad hoc query capabilities against SQL or MDX sources, for example.
A weak partner ecosystem is another concern. Salient needs to grow its indirect partner channel if
it intends to step away from its high-touch approach, as this limits its growth. High-touch models
do not scale rapidly, as staffing constraints are often encountered.
The company has no direct international presence. Although Salient's software is deployed
internationally, it is not well represented outside the U.S. It has no direct operations other than its
headquarters in New York state. Representation and support internationally is delivered via a
small network of boutique partners in Malaysia, Japan, Brazil and Cyprus.
Return to Top
SAP
Strengths
The combination of SAP BusinessObjects and SAP NetWeaver BW revenue accounts for the largest
share of the BI platform market, with both SAP platforms continuing to support large enterprise
deployments (more than twice the average for both data size and number of users). Similarly, a
higher percentage of SAP customers than for most other vendors in the Magic Quadrant survey
cite "corporate standards" and "integration with enterprise applications" as among the top reasons
why they chose SAP for BI.
SAP has one of the largest global direct sales, support, and channel and services ecosystems.
Moreover, the combination of SAP and BusinessObjects constitutes the largest installed base in the
BI platforms market, which represents a significant and captive cross-sell and upsell market
opportunity for SAP. SAP's product investments and road map are targeted at both the
independent market and the SAP-centered market. Those product efforts that targeted the SAP
base (particularly for SAP BusinessObjects BI 4.0 and HANA), when coupled with aggressive
bundling and pricing, have resulted in strong product sales. Last year, 36% of SAP
BusinessObjects customers in the survey reported having SAP as their primary ERP platform. In
this year's survey, that percentage has increased to 42%.
SAP has a compelling and comprehensive product vision that addresses many key future trends
including mobile, collaborative analytics, and analytics on big data. SAP complements its BI
platform with forward-looking capabilities in the areas of collaboration and decision support (with
its StreamWork product), text analysis integrated with its enterprise information management
products, and search-based data exploration with its SAP BusinessObjects Explorer product. SAP's
product vision for its in-memory computing platform, HANA, promises to solve many of the
perennial performance issues of large complex BI deployments in general (given its SQL and MDX
access for third-party tools) and SAP BW in particular (HANA for SAP BW is in ramp-up status as
of November 2011). SAP was one of the first of the leading BI vendors to introduce a SaaS
offering, BusinessObjects BI OnDemand. The company has also made investments in mobile BI,
leveraging assets from its Sybase acquisition into capabilities in SAP BusinessObjects BI 4.0 that
deliver SAP BusinessObjects Explorer and SAP BusinessObjects Web Intelligence as a mobile
application on multiple device platforms. However, there are many pieces to this vision. Clarity
around the road map, demonstration of the value proposition, and execution will be critical to
customer uptake and overall satisfaction with SAP.
SAP is investing in industry- and domain-specific packaged applications built with SAP
BusinessObjects that include a data model, ETL and business content. Although uptake of these
applications is in the early stages, SAP has moved to optimize a number of these packaged
applications for SAP HANA, and plans to port more of these applications to HANA throughout
2012. This could enhance the value proposition of the HANA platform beyond its capabilities for
performance acceleration.
Cautions
Customer inquiries with Gartner analysts about SAP BusinessObjects continue to express
confusion about the BusinessObjects, SAP BW and HANA road maps, given the product changes to
support optimizations with the SAP business applications and NetWeaver BW products, and the
perceived unknown costs of migrating to the new road map. These customers have also told us
that the migration, implementation and integration choices can be confusing. These sentiments
are supported by survey responses to the "view of vendor's future" question, which indicates that
twice as many of the SAP respondents (compared with the survey average) indicated that they
are "more concerned" about the vendor's future. Many SAP NetWeaver BW customers and SAP
BusinessObjects customers are still determining what role these products will play in their future
architecture and BI strategy. This uncertainty may also be contributing to the sentiment that SAP
is among the top three vendors whose software customers are thinking about discontinuing, a
percentage that is almost three times the survey average.
This is the fifth year in a row that our market survey data shows ratings for SAP's customer
experience (which includes ratings for support and software quality and for sales experience) as
the lowest of any vendor in the survey. That said, SAP is building on last year's customer success
initiatives, by stepping up its efforts to work with Americas' SAP Users' Group for customer input,
and it has increased investments in programs to redesign the SAP support process to address
customer issues, and to address the customer experience more broadly.
While SAP's customers tend to have very large and global deployments, poor performance is
mentioned twice as frequently as the survey average as a problem limiting broader deployment,
while direct performance scores are among the lowest in the survey. This problem is more acute
for SAP BW customers than for SAP BusinessObjects, but both products score near the bottom of
the survey on this measure. Both SAP and SAP customers alike are hoping that SAP HANA can
address this problem. Early adopters of HANA SP1 and SP2 (HANA on SAP BW) have reported
positive experiences in this regard.
Both SAP BusinessObjects and SAP BW scored below average, when compared to other vendors in
the survey, across all 14 BI platform capabilities evaluated during the Magic Quadrant research
process. Of those capabilities, SAP BusinessObjects' customers identified reporting and ad hoc
query functionality as the platform's top strength. SAP BI 4.0, made generally available at the
time of this year's Magic Quadrant survey data collection and therefore not included in the survey
responses, is expected to provide a significant number of feature and usability enhancements, in
addition to improved integration with SAP BW. As more SAP BusinessObjects customers upgrade
to this latest version, we would expect to see better product scores reported in next year's Magic
Quadrant.
At the end of August 2011, SAP implemented its third license model change (Concurrent Session-
Based Licenses [CSBLs] and Named User licenses) for SAP BusinessObjects since the Business
Objects acquisition in January 2008. While there are many advantages for users in using CSBL,
changing license models have contributed to confusion, and concern. Also, some customers are
charged for upgrades when they expected to be provided with product at no/low cost — for
example, SAP BEx Analyzer customers expecting to move to SAP BusinessObjects Analysis for
Microsoft Office.
Return to Top
SAS
Strengths
SAS gets high marks for its global footprint and broad industry initiatives. Unlike some other BI
platform vendors, SAS focuses on advanced analytical techniques, such as data mining and
predictive modeling, where references acknowledge it as a leader of the pack. SAS's clients also
have above average complexity scores (for the depth of use of different BI use cases) on larger
than average data sources. SAS customers also access and interpret unstructured internal and
external data more often than any other vendor's clients surveyed for this Magic Quadrant.
SAS's solution-oriented analytic application approach to the market is a differentiator, giving the
company the advantage of having a wide variety of cross-functional and vertically specific analytic
applications out of the box for a variety of industries, including financial services, life sciences and
manufacturing. While others are also adopting this approach, SAS remains in the lead. Customers
also report an above average sales experience.
The primary drivers for customers choosing SAS remain functionality and data integration. In
addition, references reported that they select SAS because of availability of skills. In the past, we
have heard concerns over a lack of available SAS expertise; we suspect that this improvement is
linked to the aggressive stance the company has taken to forge substantial partnerships with
services firms, specifically Accenture. This broadened ecosystem also expands SAS' sales channels
with multiple partners positioning SAS-based solutions to their customers.
On the software partnership front, SAS has partnered with a number of database vendors (such as
Teradata) to push the execution of its models directly into the database management system
without moving the data. Not only does this reduce data duplication and movement, it also allows
SAS users to leverage the power and scalability features of the database to run predictive models
against very large datasets with high performance.
Overall, SAS has a wide and loyal user base, many of whom have built careers around these
products. References have a solid, positive outlook for SAS's success within their organizations, as
well as in the market as a whole. The company recently reported double-digit revenue growth for
2011.
Cautions
References report that SAS is very difficult to implement — it was the No. 1 firm in this category.
Companies also indicate that the product is considered difficult to use for business users (it was
ranked No. 2 in this category). Its dashboard capabilities were rated lowest of all the vendors in
this research. SAS is very much aware of these criticisms, and in 2011 embarked on a major
development initiative involving hundreds of resources to improve usability and implementation
activities. While it is too early to see the results of these efforts in surveys, we expect to see
improvement in these areas in next year's reference assessment. If no improvement is noted, this
will directly impact SAS's Ability to Execute scores for 2013.
SAS's dominance in predictive analytics and statistics continues to be challenged on many fronts.
In addition to the SPSS suite, IBM also acquired Algorithmics in 2011 to bolster its portfolio; we
are seeing greater adoption of open-source "R" in some products and embedded predictive and
statistical capabilities in others. New entrants to the BI platform Magic Quadrant Prognoz and
Alteryx accentuate these capabilities as core components of their product suites. While SAS still
remains the acknowledged front runner, buyers have more options now, and SAS must continue
to defend its franchise. The company recognizes this and, for example, has reinvigorated its
emphasis on placing its software products in higher education settings for student and teacher
use.
Customer references report that cost is the most common factor blocking further adoption. In fact,
verbatim responses to the survey mention cost in many ways — leasing terms, expensive to
maintain, ongoing costs and so on — and, again, the company is very much aware of this
criticism. With more options now available, SAS should also remain responsive to customers and
prospects in these areas. The average tenure of SAS's reference customers that participated in
this survey was five years. Over 10% reported that they are planning to replace or are considering
replacing the software in the next three years.
Despite SAS's success and awareness as a leader in the predictive analytics space, the company is
still challenged to make it onto BI platform shortlist evaluations when predictive analytics is not a
primary business requirement. While a little less than 60% of references indicated that SAS was
their company's BI standard, functionality used in traditional BI areas (reporting, dashboards,
OLAP and so on) was lower than for other BI leaders in this report. Like last year, ad hoc query
remains the one exception, with clients aggressively using SAS BI for that component.
Return to Top
TABLEAU
Strengths
For the third year in a row, Tableau is the "sweetheart" of the Magic Quadrant, with customers
even more enamored with it this year than in the last two. It gained overwhelmingly positive
customer survey feedback across the board in all measures in the survey, including ease of use,
functionality, product quality, product performance, support, customer relationship, success,
achievement of business benefits and view of the vendor's future. Indeed, it earned a top or near
top score in most of these key categories — even with its high revenue growth (94% in 2011),
when growing pains might be expected. These stellar results in part contributed to Tableau's
strong Ability to Execute position, despite its relatively small size.
Tableau is one of a number of stand-alone BI vendors delivering strong interactive visualization for
analysis, dashboards, information delivery and managed analytic applications. Tableau's strong
performance, even with an increasingly crowded competitive landscape, is evidence of its ability to
meet the increased market demand for easy-to-use and intuitive interactive BI tools that are easy
to deploy without IT assistance. Not only is Tableau benefiting from its "halo" image as a result of
its strong performance in the Magic Quadrant customer surveys, it is also receiving collateral
benefit from QlikTech's successful market awareness activities. In particular, most vendor
selections that may start out with a primary interest in QlikTech also end up including Tableau as
a competing alternative, with the win sometimes going to Tableau. Survey customers cited ease of
use for end users and developers, and functionality, as the key reasons for choosing Tableau more
often than those for most other vendors in the survey. Importantly, a higher percentage of
Tableau's customers, compared with most other vendors, report that there are "no product issues
to broader deployment," a key measure of satisfaction with customer experience.
Tableau's self-contained BI platform provides purpose-built, business-oriented data mashup ETL
capabilities with data connectors that leverage Tableau's own VizQL technology (drag-and-drop
operations in Tableau create a query in VizQL, which interprets and packages an SQL or MDX
query to the database and then expresses the response graphically). Its columnar, in-memory
data engine, which can be used as an alternative to its direct query access, enables fast
performance on large and multisource datasets and on complex queries, such as very large
multidimensional filters or complex co-occurrence or multipass queries. Zero programming data
mashup capability, combined with an in-memory database, allows users to blend and visually
analyze large amounts of diverse datasets with auto-detect relationships between multiple sources
(of any format). This allows users to connect to any data source and produce a series of
interactive dashboards, and highlight and visually filter and pass parameters directly from a
graphic; or use filters (for example, check boxes, sliders, relative date filters and drop-down
menus); or build in geographic intelligence to analyze their data. Interactive analysis can be
shared with a report consumer equipped with a Web browser. The combination of exceptional ease
of use ("fun" is often used to describe Tableau by its users), with the ability to conduct
sophisticated analysis, is a key reason users are exuberant with the platform.
Customer survey data shows that Tableau is chosen most frequently by its customers for
functionality, with among the highest overall product functionality scores, and just edging out
Tibco Spotfire for the No. 1 spot (of vendors on the Magic Quadrant) for interactive visualization —
Tableau's main strength. Moreover, its mobile capability is gaining traction, with an above average
percentage of its users either using, piloting or planning to deploy its mobile capability. Those who
use its mobile capability have a very favorable, above average view of the functionality.
The size of the data that its customers analyze with Tableau continues to grow. In fact, Tableau's
implementations continue to feature larger data sizes, including content (Hadoop, for example),
which this year are among the highest data sizes and highest percentage of analytics on
unstructured data in the Magic Quadrant survey. Moreover, Tableau has a growing percentage of
external users accessing externally facing Tableau applications. This is, in large part, due to
Tableau's SaaS offerings, Tableau Public and Tableau Digital, which have enabled websites (such
as CBS Sports' Fantasy Football and Baseball, Microsoft's DataMarket and other news, media,
entertainment and government websites that embed Tableau Public visualizations) to share data
in engaging ways with their audiences. This high-leverage go-to-market approach also contributes
to Tableau's strong market awareness, and has the potential to expose substantially more users to
Tableau products (to further drive Tableau's momentum) than would its traditional direct
channels.
Cautions
Tableau's product functionality is more narrowly defined around analysis and interactive
visualization. It lacks broader BI platform capabilities, such as production reporting and predictive
analytics. Tableau has introduced a shareable semantic layer — a key enterprise feature — in its
7.0 release (made available just prior to the publication of this year's Magic Quadrant), giving it a
competitive advantage over QlikTech.
Although Tableau's user counts remain below the survey average (albeit growing from last year),
it is still largely departmentally deployed with smaller user counts. Tableau's products often fill an
unmet need in organizations that already have a BI standard, and are frequently deployed as a
complementary capability to an existing BI platform. Tableau is still less likely to be considered an
enterprise BI standard than the products of most other vendors.
Tableau's partner program, while expanding over last year, is still in its infancy, lagging behind
that of similar vendors (such as QlikTech). But it continues to make progress, including outside
North America, in increasing its resellers and OEM partners in the past year. As is not uncommon
with a small vendor, Tableau is initially pursuing a horizontal platform strategy, and has not
embarked on developing vertical or industry-specific applications, although it has a number of
OEM partners that create domain and vertical solutions using its platform (for example, for
healthcare, manufacturing and kindergarten through to twelfth-grade schooling). Moreover, it has
a very limited international presence, and while the software is now available in English, German
and French, support services are available in English only.
Given the success of Tableau and other interactive visualization vendors, other leading BI platform
vendors including Microsoft, MicroStrategy and others, are trying to mimic its functionality, which
could threaten Tableau's long-term prospects as an independent vendor.
Return to Top
TARGIT
Strengths
Targit's intention is to make BI easier to use, with as few clicks as possible, and by far the
strongest reason expressed by customers for selecting it is its ease of use for end users. Following
the principle of "observe, orient, decide, act," the design of the Targit user interface delivers a
consistent user experience, integrating components of the BI platform and so reducing the need to
move between different tools.
The Targit BI platform includes tools that help set up the environment with very little intervention.
The platform does a significant amount of the setup automatically, ranging from scheduled report
generation, drill-down and dashboarding to intelligent search, alerting and some level of data
mining. Targit's customer organizations report that they are able to develop reports much more
quickly than on average.
Targit's prediction-based rules capability, called Sentinels, offers a means to support more
complex analytic needs in organizations that may not have the skills to build out data mining
models with other tools. This functionality is being rapidly taken up in Targit's user base, with a
third of customers adopting it since its launch two years ago.
Based on the survey, Targit is obviously attractive to those using Microsoft — 67% of its
customers are using Microsoft as their primary ERP software provider and 88% for their primary
data warehouse, much more than for any other vendor. It's notable that an above average
proportion of Targit customers say that its ability to integrate with their ERP applications was a
reason for selecting it.
Targit has developed a strong OEM channel, with CDC Software, HP and Microsoft among its
resellers.
The company's cloud and collaboration vision is also a strength. In 2011, Targit added facilitates
for end-user-deployed analytics, by allowing users to upload data to the Targit Cloud, which then
automatically generates the best-fit visualization for further analysis of the data. Targit Cloud also
facilitates social networking and collaboration around the data uploaded.
Cautions
Targit still has limited brand recognition or presence outside Europe. However, it is showing strong
growth in the U.S.: 40% of those completing the survey regarding their use of Targit originated in
North America this year.

While Targit is considered an enterprise standard by most of its customers, it is very much a
midsize enterprise BI solution. On average, the smallest organizations surveyed use Targit, on
some of the smallest data volumes and with the smallest numbers of end users in the survey.
Targit customers cited problems with poor performance at more than twice the survey average. In
some cases this is due to slow responses from the repositories feeding it. However, Targit is
adding new functionality in 2012 in areas such as on-demand loading and real-time OLAP, and via
the use of in-memory database technology to improve performance.
Ideally, for Targit to function well, it requires a data warehouse with defined dimensions and
measures — according to the survey, just 4% of Targit customers do not have a data warehouse.
This has the effect of reinforcing Targit's niche target market segment — there are relatively few
small firms with high data warehouse maturity. As mentioned above, Targit's cloud strategy may
ameliorate this inhibitor by offering an alternative means of deployment.
References rated Targit in the lowest quartile for BI functional capabilities. Targit achieved above
or close to average ratings in scorecards, ad hoc query, dashboards, OLAP and Microsoft Office
integration in the survey, but was below average in all other functional capability areas.
Targit's customers rated the support they receive as below average, with levels of expertise,
response time and time to resolution in the bottom three of all vendors. Targit's lack of a direct
sales channel, and therefore its relationship with its customers, may exacerbate this type of issue
in its client base, particularly in markets where it is growing quickly via its indirect channel. The
company is aware of this issue and has put in place a new customer service department in the
U.S. to deal directly with end customers and improve their customer experience, an approach it
has found effective in Europe.
Return to Top
TIBCO SOFTWARE (SPOTFIRE)
Strengths
Tibco Spotfire is a flexible and easy to use data discovery platform based on an in-memory
architecture for self-service discovery, authoring analytic apps, and publishing interactive and
highly visual dashboards. Like QlikView and Tableau, Tibco Spotfire's interactive visualization
approach has become more widely accepted, and even a preferred, end-user paradigm, and
represents a compelling complement or alternative to traditional BI platforms. This architecture
has been particularly attractive for delivering on requirements where Tibco Spotfire fills a need not
addressed by enterprise BI vendors. Customers choose Tibco Spotfire for its ease of use for end
users and functionality more often than they do most other vendors, even though it is less likely
to be their enterprise standard.
Much like the other data discovery vendors that are addressing increasing market requirements
for intuitive, highly interactive and lightweight BI platforms, Tibco Spotfire's customers are very
satisfied with all aspects of the relationship. In fact, they rate it among the highest in the
customer survey for support, customer experience, performance, positive view of vendor's future,
vendor success, overall product functionality, sales experience and achievement of business
benefits.
Survey customers rate Tibco Spotfire's overall functionality among the top for vendors in the
survey. In particular, Tibco Spotfire customers give among the highest marks and report more
extensive use for predictive analytics and interactive visualization than for most vendors in the
survey, with above average scores for ad hoc query and analysis. Because of Tibco Spotfire's ease
of use, more users can leverage the benefits of analytics.
Tibco Spotfire has among the highest complexity of user analysis score than any vendor on the
Magic Quadrant, while at the same time customers rate it above average on ease of use,
particularly for end users. This paradox typifies why data discovery tools in general, and Tibco
Spotfire in particular, are so compelling and are proliferating.
Tibco Spotfire's strong product vision is a key strength. Its focus on advanced and real-time
analytic applications and dashboards delivered to mobile devices contributes to its strong vision.
Its investments in mobile are beginning to pay off, as Tibco received among the highest marks for
its mobile functionality; among the highest percentage of users of any vendor in the Magic
Quadrant survey are currently deploying its mobile capability. Unlike the other data discovery
platforms (for example, QlikView and Tableau), Tibco Spotfire is leveraging its acquisition of
Insightful for data mining, as well as its integration with Tibco middleware and Tibco's social
capability, tibbr, to broaden the possible spectrum of end-user-driven interactive analysis, to
incorporate business events, predictive analytics and "what if" modeling. Moreover, Tibco
Spotfire's low-cost cloud version of its software allows business users to author and share Tibco
Spotfire visualizations and dashboards without having to install the software on-premises.
Tibco Spotfire is well positioned to take advantage of the increase in market demand for packaged
analytic applications and dashboards, which increasingly feature predictive analytics capabilities. A
third of Tibco Spotfire's customers use one or more of its specific packaged applications for life
sciences, manufacturing, financial services, process analytics, spend analytics, and sales and
marketing analysis.
Cautions
Even though the average employee size of a company that uses Tibco Spotfire software is the
among the highest in the survey, and although Tibco Spotfire has some customer references with
extremely large datasets and thousands of users, on average its deployments tend to be focused
on a department or multiple departments, with below average data volumes and numbers of end
users when compared with those of other vendors. Tibco Spotfire also scored among the lowest of
all vendors in the reference survey on the percentage of customers that consider it their BI
platform standard. The combination of this result with Tibco Spotfire's strong functionality ratings
suggests that, while it is not usually the enterprise standard, it has been successful in augmenting
the BI standard when more flexible discovery-based and sophisticated analysis is required.

Tibco Spotfire is well suited to building analytic content ranging from basic interactive
visualizations and dashboards to advanced, interactive analytic applications, and its customers are
very satisfied. But the perception of Tibco Spotfire's license cost and packaging continues to be a
factor limiting its consideration beyond a restricted set of users with high-end requirements. While
a premium for Tibco Spotfire software may be justified given its differentiating features around
collaborative, mobile, advanced and real-time analytics, Tibco Spotfire must overcome its high
license cost reputation to capitalize on the significant buying momentum driving the growth of
more mainstream and competitively priced and packaged data discovery alternatives. As further
evidence of its high license cost reputation, like last year, license cost continues to be cited as a
limitation to broader deployment more often than for most vendors in the survey, and its "total
license cost per user" continues to be above the survey average. Tibco's above average pricing
may, in part, be explained by the fact that 35% of its sales are from its analytic applications,
which tend to be more expensive. Tibco's introduction of new pricing and packaging options in
2010, as well as the launch of a low-cost SaaS offering in mid-2010, are evidence of the
company's efforts to combat this market perception, but the perception still remains in 2011. We
would expect to see this change in the future, as Tibco delivers on its marketing and sales
strategy.
Awareness of the Tibco Spotfire platform has been primarily limited to its traditional customer
base — analysts and data scientist in industries such as pharmaceuticals, life sciences, financial
services, energy and manufacturing. The survey data and Gartner inquiries continue to suggest
that awareness of Tibco Spotfire for mainstream data discovery requirements is less than its
primary competitors — QlikTech and Tableau — and it is not considered on shortlists as frequently
to meet mainstream data discovery requirements. However, there is a significant opportunity for
this to change, since this is a marketing investment priority rather than a product challenge. To
capitalize on this opportunity, Tibco (the corporation) has stated that it views Tibco Spotfire as a
key high growth area for the next several years, and that it has begun to invest in expanding
Tibco Spotfire's awareness, sales, marketing and partner capabilities, all to capitalize on a much
larger percentage of mainstream BI platform and data discovery market opportunities in 2012
than Tibco Spotfire has had in the past. For Tibco Spotfire to be considered a Leader in the future,
it will need to execute successfully on these efforts by demonstrating larger and more pervasive
deployments and stronger market awareness and shortlisting outside its traditional installed base
of niche users.
While Tibco Spotfire is rated highly in the survey for ad hoc analysis, interactive visualization and
predictive analytics, it is rated in the bottom third of vendors for static and parameterized
reporting, confirming that its true sweet spot is in providing a flexible, easy to use environment for
advanced analysis.
Return to Top
Vendors Added or Dropped
We review and adjust our inclusion criteria for Magic Quadrants and MarketScopes as markets change.
As a result of these adjustments, the mix of vendors in any Magic Quadrant or MarketScope may
change over time. A vendor appearing in a Magic Quadrant or MarketScope one year and not the next
does not necessarily indicate that we have changed our opinion of that vendor. This may be a reflection
of a change in the market and, therefore, changed evaluation criteria, or a change of focus by a vendor.
Return to Top
VENDORS ADDED
Alteryx, Pentaho and Prognoz were added to this year's Magic Quadrant, as they were able to meet all
inclusion criteria.
Other Vendors to Consider
Even though they did not meet the criteria for inclusion in the Magic Quadrant, the following vendors
are benefiting from the growth of the BI platforms market and may be worthy of consideration in BI
evaluations.
Data Discovery
While three data discovery vendors (QlikTech, Tibco Software [Spotfire] and Tableau) had enough
market adoption to earn a spot on the Magic Quadrant itself, there are a number of smaller vendors
that could be considered when data discovery is a unique requirement. Three of these vendors, Endeca
(acquired by Oracle in late 2011), Advizor Solutions and Quiterian, provided customer references with
enough survey responses to be included in the Magic Quadrant customer survey research notes that will
publish as complements to this research, but did not meet the revenue requirement to earn a place on
the Magic Quadrant in its own right.
Gartner bifurcates the data discovery tool market into interactive visualization tools and search-based
data discovery tools. All the vendors either on the Magic Quadrant itself or listed thus far in this section
fall into the former category of vendors. Endeca, acquired by Oracle in December 2011, is one of the
unique vendors that falls into the latter category. Founded in 1999 as an enterprise search vendor,
Endeca is leveraging its search technology to renew its focus on the BI platform market. Its Latitude
product combines the simplicity of a search interface and faceted browsing with the insight of BI by
delivering interactive tools that support fast data exploration and discovery on top of its patented hybrid
search-analytical database. With its unique platform, there is no need for an overarching data schema
— every record and document has its own schema stored in a columnar store with text and data indices
built in dedicated columns. As a result, the columnar architecture can support in-memory-grade
performance without in-memory constraints. The data discovery mode is search-based, which enables
navigation and analytics on both structured data and unstructured content, making documents and
Web-content part of searchable decision data. Every summary is also a way to query the data, letting
users iteratively explore data and ultimately reach conclusions that drive decisions. The acquisition of
Endeca helps Oracle appeal to enterprises that want to search, combine, analyze and integrate
structured and unstructured data types to optimize decision making, business processes and their
online presence. In particular, the acquisition adds complementary search-based data discovery to
Oracle's business analytics strategy, a capability Oracle lacked. The most notable positive potential from
the acquisition is that Endeca will boost Oracle's "ease of use for end user" and "complexity of analysis
performed" scores, areas which are among the highest for Endeca and below average for Oracle. When
the Magic Quadrant process began in 3Q11, Endeca was an independent firm and provided references
for this year's customer survey, but did not meet all inclusion criteria to get its own dot on the Magic
Quadrant. Now, as part of Oracle, Endeca Latitude contributed positively to Oracle's Completeness of
Vision scores. In next year's report, Endeca's capabilities and customer responses will be fully reflected
in Oracle's position on the Magic Quadrant.
Advizor Solutions offers an end-user data discovery and analysis product suite with an in-memory
performance layer, descriptive and predictive analytics and a user interface built around a library of
sophisticated interactive images. Advizor competes directly against the likes of Tibco Software
(Spotfire), Tableau and QlikTech, and maintains a long-standing OEM relationship with BI platform
provider Information Builders, as well as other vendors supplying horizontal and/or vertical applications.
Over 20 references responded for Advizor, and they paint a picture of the average customer: based in
North America, largely in the higher education sector, using the products on relatively small amounts of
data (approximately 100 GB), when compared to the average for all vendors, in small groups that
average less than 40 in number. These customers select Advizor for four main reasons — functionality,
ease of use for end users, data access and integration, and implementation cost and effort. The
products get high marks for interactive visualization, and customers give the firm exceptional scores for
support, sales experience and overall customer experience. The data discovery segment is expanding,
with other existing BI platform providers delivering competitive products in 2011 and 2012. Advizor
needs to expand its awareness to grab part of that buyer budget.
Quiterian, based in Spain, provides data discovery tools with predictive analytics, and allows business
analysts to conduct "visual data mining" without relying on the specialized skills of a data scientist.
Quiterian and its Dynamic Data Web (DDWeb) product were introduced to Gartner in 2010, but have
been available in the company's home market since 2003, where the company has a good presence
and reference base. Effectively a large-scale data discovery offering, its core value proposition is easing
the use of data mining and statistical analysis, and thus making these capabilities more broadly
available. However, this means it'll be up against some stiff competition, notably from IBM (SPSS) and
SAS (in particular JMP), as well as from Tibco Software (Spotfire), which offers a similar value
proposition for complex data discovery and advanced analytics. Technically, DDWeb uses an
intermediate processing layer on top of its own columnar database — Quiterian FastDB, released in
2011 — to enable BI functionality (for example, predictive analysis). Quiterian has been expanding its
geographical reach, having opened offices in Portugal, Mexico and the U.S. in 2010, as well as through
a growing international value-added reseller channel with 12 new partners in the U.S. and Canada, and
other partners in the Asia/Pacific market.
Cloud/SaaS Business Intelligence and Analytics
SaaS remains a viable option for some buyers. Just 30% of respondents to the Magic Quadrant survey
were currently using or had plans to use cloud-based BI and analytics within the next 12 months — a
slight uptick from last year. The subcategory shows slow but steady momentum as a departmental, mid
-market and/or analytic application approach to augment existing analytic capabilities and analyze data
already in the cloud. Pure-play vendors such as 1010data, Birst, Domo, GoodData, myDials and
PivotLink continue to compete aggressively for mind share and budget dollars. Cloud capabilities have
emerged from traditional BI platform providers, with new capabilities regularly introduced over the past
year.
1010data, headquartered in the U.S., has a different spin on cloud business analytics. By focusing on
the challenges with "big data," the company cut its teeth in the financial services sector, working with
one of the world's largest stock exchanges, analyzing detailed trade data. While focusing on complex,
voluminous sources of data, it has also fostered a service to build out customer-driven analytic
applications of that data, trademarking the phrase "the trillion row spreadsheet" to capture the breadth
and scope of information analyzed on demand within the platform. Accordingly, references indicate that
BI performance and ability to analyze large volumes of data are their primary reasons for selecting
1010data. Deployments average fewer than 200 users, but companies they sell to are some of the
largest that responded to this Magic Quadrant survey. Customers also reported a high complexity of
use cases (in the highest quartile of all vendors surveyed) with specific success in predictive capabilities
within the platform; references indicated that difficulty of use was a concern blocking further
deployments among a wider user community. The company has expanded its vertical focus to include
telecommunications, and retail/consumer products goods where data volumes, performance and
complex analysis are hallmark requirements.
U.S.-based Birst provides a SaaS-based end-to-end BI and data integration platform. In 2011, the
company introduced an appliance option that allows companies to choose an on-premises or hybrid
(mixed on-premises and cloud) deployment. With this addition, clients can choose to continue to license
as a subscription or via a perpetual license/maintenance model. The company also recently made
available an in-memory data store option complementing its traditional supported commercial SQL
databases. Birst supplies predefined analytic application templates for sales performance and pipeline
analysis, as well as financial services/insurance industry applications. Its reference clients indicate that
it is used as the enterprise standard BI platform above the average for all vendors in this Magic
Quadrant analysis; use cases are heavily skewed toward consumption only and casual scenarios, to
hundreds of users, on average. Companies choose Birst based on functionality, implementation cost
and effort, and data access and integration capabilities.
Launched in 2011, U.S.-based Domo is based on the assets acquired in October 2010 from Corda
Technologies, a vendor of solutions for building dashboards, rated as a Niche Player in the 2011 BI
Magic Quadrant report. Corda's 900 OEM customers will continue to be supported; however, no new
functionality will be added to the legacy products. Enterprise customers, along with OEMs, will be
encouraged to move to the new Domo offerings. Corda developer tools, PopChart and OptiMap, will
continue to be sold. With the Corda brand retired, and $43 million in funding, Domo is moving forward
with an "executive management platform," and an attempt to solve the ease of use issues that some
competitive BI solutions have. It is targeting executive-level users with dashboard and drill-down

features that integrate information from across the variety of systems, such as ERP, CRM, HR and
financials. This will be an interesting company to watch. The founders have a successful history of
building specialized analytic applications and delivering them via SaaS, but competing in the BI market,
as primarily a SaaS vendor, will be more difficult, especially when trying to address unique
requirements found across enterprises.
GoodData, founded in 2007 and headquartered in the U.S., has developed an end-to-end ETL, data
warehouse and analytics PaaS capabilities used by more than 2,500 OEM customers and over 150
direct clients to develop and deploy metrics-driven dashboards. The vast majority of customers were
new in 2011. The company also packages predefined SaaS applications for common content areas such
as salesforce.com sales, marketing and support analytics, Google Analytics, and Zendesk help desk
analytics. The suite delivers integration capabilities to source data from within and outside the
enterprise. A few references responded on behalf of the company, and those that did indicated that the
top three reasons they selected GoodData were implementation cost and effort, ease of use for end
users, and integration. The company received $15 million in new funding in August 2011 to further its
expansion.
Another interesting BI SaaS vendor is myDials, headquartered in the U.S. The company was founded in
2006 and delivers myDials Performance Management Platform, a Web-based, easy-to use, highly
interactive dashboarding system. The platform features built-in business-user-oriented statistical
capabilities for identifying trends, forecasts with error ranges, and patterns with support for drilling into
the data while context is maintained, to identify the root cause of a problem. In 2011, the company
introduced dynamic integration capabilities to support mashups, as well as a personalization mode that
leverages the underlying security model to tailor the end-user experience. While relatively few
references responded on behalf of myDials, those that did indicated that they selected the product for
functionality and ease of use for end users. Feedback was stellar, with very high ratings for dashboard,
scorecard and visualization capabilities, and overall top-quartile product functionality ratings. Customer
and sales experience marks were in the top quartile too, indicating a satisfied customer base. While the
average tenure of references was less than two years, none indicated any plans to replace the software
in the foreseeable future.
In 2011, U.S.-based PivotLink, a cloud-based PaaS provider for business analytics, recommitted itself to
the retail sector — the place where it got its start over a decade ago. The company plans to maintain
customers in other sectors indefinitely. PivotLink's management team was refreshed with key
appointments such as CEO and chief marketing officer (CMO) during the year. Existing references
indicate that the product is used, on average, in workgroups of about 200 users analyzing a relatively
modest amount of business data — less than 300 GB. Companies choose PivotLink for ease of use for
end users, functionality, and implementation cost and effort. As a PaaS for business analytics, the
company employs a subscription license scheme. The average tenure of references is four years, with
none considering replacement of the product in the foreseeable future. Some firms note that the
product is missing key functionality, which impedes broader deployment. But customers rave about
support, where ratings scored in the top quartile. References reported that they think highly of
PivotLink's recently introduced mobile BI platform, with exceptionally high product and use scores.
Overall product functionality is rated above the average of all vendors in this report, with specific kudos
for the product line's Microsoft integration options. In the increasingly crowded cloud/SaaS analytics
space, PivotLink must continue to differentiate its products in order to remain competitive.
Departmental, Workgroup, Midmarket and Other BI Providers
A number of other vendors have gained market traction, but do not have the same market awareness
as the BI market contenders. A few such companies, including Altosoft, Bitam, InetSoft Technology,
JackBe, MeLLmo, Phocas and SpagoBI, should also be considered for specific types of workload and/or
business use cases.
U.S.-based Altosoft offers a BI platform which is engineered to provide rapid, no-coding development of
reporting and dashboard applications with high performance through the use of a data integration and
analytics engine (MetricsMart) that utilizes server-side in-memory and incremental preprocessing
techniques. It also competes by promoting its data mapping, real-time metrics, outlier identification,
user-defined alerts, and incident management features. Shipping product since 2006, it has its roots in
the business process management space, and 80% of its 500 customers come from vendors that
license Altosoft products to provide both conventional BI capabilities and business process intelligence
functions. The other 20% of its customers are gained by competing against traditional BI platform
vendors, especially in the financial services and healthcare markets. Altosoft's solution offers both
traditional on-premises and a SaaS-based option which can be deployed in a hybrid configuration to
allow data to be collected and pre-filtered behind a customer's firewall, then use a MetricsMart with
dashboards/reports in the cloud. References indicate that they select Altosoft for end-user ease of use,
implementation cost and effort, along with its data integration capabilities.
Founded in 2000 in Mexico, Bitam is a BI and CPM vendor. Regional headquarters are located in the
U.S. and Spain. The majority of its business is sold in Latin America. The Artus product's current
version is G6, and includes new functionality for offline interactive dashboards and user-driven mashup
capabilities. Customers choose Bitam primarily for functionality, ease of use for end users, and license
costs. Bitam's SaaS option — KPI Online — is targeted at SMBs, and consists of predefined financial and
customer applications, as well as CPM functionality, and a development platform to create custom BI
applications. Customers pay for the service on a monthly basis based on number of applications, users
and amount of data stored in the system. References continue to flag support as a concern (a noted
issue last year), and the product received lower than average product functionality ratings compared to
other vendors in the Magic Quadrant analysis. The company's brand recognition is very low outside its
home markets in Latin America, which further limits its ability to expand its customer base outside
those markets. Unfortunately, Bitam did not receive the required number of references to be included in
the main section of this report. We hope to see it return in 2013.
InetSoft Technology is headquartered in the U.S. and is a dashboard and reporting vendor with more
than 3,000 clients in many geographies. The company sells directly as well as through more than 200
OEMs. In addition to a paid version of its software, the company also makes a free download available
for evaluation and individual use. References report that the product is used by relatively small groups

of users (approximately 160 on average, compared with other vendors profiled in this report) on
datasets of less than 200 GB. In 2011, support for mobile devices was broadened, allowing users to
access dashboards on iOS devices. Prior to this, dashboards could be accessed on any Flash-enabled
device. Companies select InetSoft for functionality, as well as ease of use for developers and end users.
In 2011, dashboards — an acknowledged specialty for InetSoft — were rated in the top quartile for
functionality by references.
U.S.-based JackBe delivers real-time BI product capabilities through its Presto product line. The firm is
very clear about its real-time BI mission, and provides integration and mashup functions that are
deployed in operational intelligence scenarios. Clients create applications such as real-time data center
monitoring, sales and service performance, and program management — often integrated within a
portal or mobile application. No client references claim that Presto is their BI standard, but references
report exceptionally broad deployments, in the thousands of users — something many "standard" BI
platforms can't always claim. Customers indicate that they select JackBe Presto for its data access and
integration capabilities, its development ease of use, and its strengths in information infrastructure
integration, indicating that the products are used to develop easy to use applications for business users.
Not surprisingly, clients give high scores to Presto's development tools, and top-quadrant ratings to
overall product functionality. Concerns were noted over the product's capability to support large
numbers of users; this was a surprise, given that the average reference deployment exceeded 3,500
users. The products appear well suited for intended use cases, and we expect to see more from JackBe
in the upcoming year as it fleshes out its real-time BI messaging.
MeLLmo was founded in 2008, is headquartered in the U.S., and was included in Gartner's "Cool
Vendors in Analytics and Business Intelligence, 2011" for its flagship product Roambi Analytics — a
native application that brings a set of intuitive and engaging BI visualizations to the iPad and the
iPhone, as well as some BlackBerry devices. Customers can select from three options — the cost-free
Roambi Lite, for individual use, and Roambi Pro, for workgroups, are both delivered in a hosted
architecture as entry-level tools with limited connectivity options. The enterprise option — Roambi ES —
is delivered on-premises and integrates with the megavendors' (IBM, Microsoft, SAP and Oracle) BI
platforms, among others. The product is able to provide offline navigation of previously downloaded
information from those sources. MeLLmo has recently introduced Roambi Flow, a tool for embedding
Roambi Analytics outputs with other text and multimedia content into a digital magazine or
presentation format for iPad consumption.
Phocas, headquartered in the U.K., is a subscription-based BI platform, positioning its products directly
to business users. Defined integration to many major ERP and CRM systems, including Epicor, Microsoft
Dynamics and Infor, is noted as a specific strength; a whopping 87% of references indicated that they
selected Phocas for its ease of use. Average deployments of Phocas incorporate less than 100 GB of
data and fewer than 50 users, which is not surprising given the applications it integrates with most
frequently. The named-user subscription license is term-based (a minimum of six months), and the
average tenure of reference customers was 4.4 years, indicating long-term use of the platform. The
company will entertain a server-based license model, but only suggests it when more than 100 users
will use the software. Use-case complexity scores are above average for all vendors in this Magic
Quadrant analysis, and clients rate ad hoc query and metadata management in the top quartile. With
over 750 customers throughout Europe, Australia and North America, the product is available in major
European languages, with Chinese slated for inclusion in 2012. Customers are bullish about Phocas'
future, and we expect to hear more about the firm throughout 2012 and beyond.
SpagoBI is a 100% open-source BI platform sponsored by Engineering Group, one of Italy's leading IT
consultancies. Engineering Group delivers services on top of SpagoBI, using the product to build out
vertical applications and specific projects on behalf of customers. Gartner sees demand for open-source
solutions increasing, especially from the public sector. SpagoBI is freely available, with no license fee.
Consulting or support charges are separated from free software availability, with no user lock-in and no
customer obligation to buy. Support is offered in English, French and Italian. A small number of
SpagoBI references responded to the Magic Quadrant survey, but we can derive some information
about the product and its uses. References — all from Western and Central Europe — indicate that they
use the product in small workgroups of approximately 50 users on small amounts of data (slightly less
than 50 GB on average). Larger user communities (in the hundreds) are also using the product.
References report heavy use of report viewing and interactive exploration functions. Clients indicate
that they select SpagoBI for performance considerations, followed by license cost and implementation
costs/efforts.
Return to Top
VENDORS DROPPED
Bitam and Domo (formerly Corda Technologies) were dropped from this year's Magic Quadrant as both
vendors did not meet the minimum number of reference survey responses required.
Return to Top
Inclusion and Exclusion Criteria
To be included in the Magic Quadrant, vendors must generate at least $15 million in BI-related software
license revenue annually. Gartner defines "total software revenue" as revenue that is generated from
appliances, new licenses, updates, subscriptions and hosting, technical support, and maintenance.
Professional services revenue and hardware revenue are not included in total software revenue (see
"Market Share Analysis: Business Intelligence, Analytics and Performance Management, Worldwide,
2010").
Those that also supply transactional applications must show that their BI platform is used
routinely by organizations that do not use their transactional applications.
Vendors must deliver at least nine of 14 capabilities detailed in the Market Definition/Description
section above.
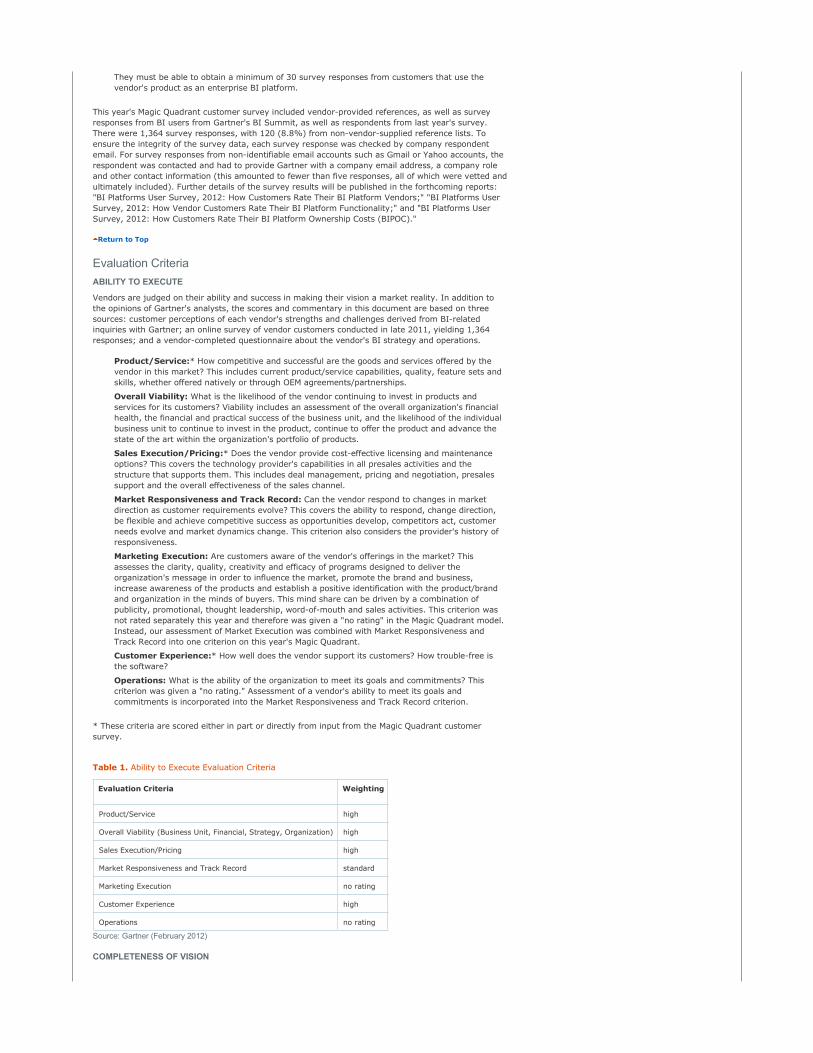
They must be able to obtain a minimum of 30 survey responses from customers that use the
vendor's product as an enterprise BI platform.
This year's Magic Quadrant customer survey included vendor-provided references, as well as survey
responses from BI users from Gartner's BI Summit, as well as respondents from last year's survey.
There were 1,364 survey responses, with 120 (8.8%) from non-vendor-supplied reference lists. To
ensure the integrity of the survey data, each survey response was checked by company respondent
email. For survey responses from non-identifiable email accounts such as Gmail or Yahoo accounts, the
respondent was contacted and had to provide Gartner with a company email address, a company role
and other contact information (this amounted to fewer than five responses, all of which were vetted and
ultimately included). Further details of the survey results will be published in the forthcoming reports:
"BI Platforms User Survey, 2012: How Customers Rate Their BI Platform Vendors;" "BI Platforms User
Survey, 2012: How Vendor Customers Rate Their BI Platform Functionality;" and "BI Platforms User
Survey, 2012: How Customers Rate Their BI Platform Ownership Costs (BIPOC)."
Return to Top
Evaluation Criteria
ABILITY TO EXECUTE
Vendors are judged on their ability and success in making their vision a market reality. In addition to
the opinions of Gartner's analysts, the scores and commentary in this document are based on three
sources: customer perceptions of each vendor's strengths and challenges derived from BI-related
inquiries with Gartner; an online survey of vendor customers conducted in late 2011, yielding 1,364
responses; and a vendor-completed questionnaire about the vendor's BI strategy and operations.
Product/Service:* How competitive and successful are the goods and services offered by the
vendor in this market? This includes current product/service capabilities, quality, feature sets and
skills, whether offered natively or through OEM agreements/partnerships.
Overall Viability: What is the likelihood of the vendor continuing to invest in products and
services for its customers? Viability includes an assessment of the overall organization's financial
health, the financial and practical success of the business unit, and the likelihood of the individual
business unit to continue to invest in the product, continue to offer the product and advance the
state of the art within the organization's portfolio of products.
Sales Execution/Pricing:* Does the vendor provide cost-effective licensing and maintenance
options? This covers the technology provider's capabilities in all presales activities and the
structure that supports them. This includes deal management, pricing and negotiation, presales
support and the overall effectiveness of the sales channel.
Market Responsiveness and Track Record: Can the vendor respond to changes in market
direction as customer requirements evolve? This covers the ability to respond, change direction,
be flexible and achieve competitive success as opportunities develop, competitors act, customer
needs evolve and market dynamics change. This criterion also considers the provider's history of
responsiveness.
Marketing Execution: Are customers aware of the vendor's offerings in the market? This
assesses the clarity, quality, creativity and efficacy of programs designed to deliver the
organization's message in order to influence the market, promote the brand and business,
increase awareness of the products and establish a positive identification with the product/brand
and organization in the minds of buyers. This mind share can be driven by a combination of
publicity, promotional, thought leadership, word-of-mouth and sales activities. This criterion was
not rated separately this year and therefore was given a "no rating" in the Magic Quadrant model.
Instead, our assessment of Market Execution was combined with Market Responsiveness and
Track Record into one criterion on this year's Magic Quadrant.
Customer Experience:* How well does the vendor support its customers? How trouble-free is
the software?
Operations: What is the ability of the organization to meet its goals and commitments? This
criterion was given a "no rating." Assessment of a vendor's ability to meet its goals and
commitments is incorporated into the Market Responsiveness and Track Record criterion.
* These criteria are scored either in part or directly from input from the Magic Quadrant customer
survey.
Table 1. Ability to Execute Evaluation Criteria
Evaluation Criteria Weighting
Product/Service high
Overall Viability (Business Unit, Financial, Strategy, Organization) high
Sales Execution/Pricing high
Market Responsiveness and Track Record standard
Marketing Execution no rating
Customer Experience high
Operations no rating
Source: Gartner (February 2012)
COMPLETENESS OF VISION
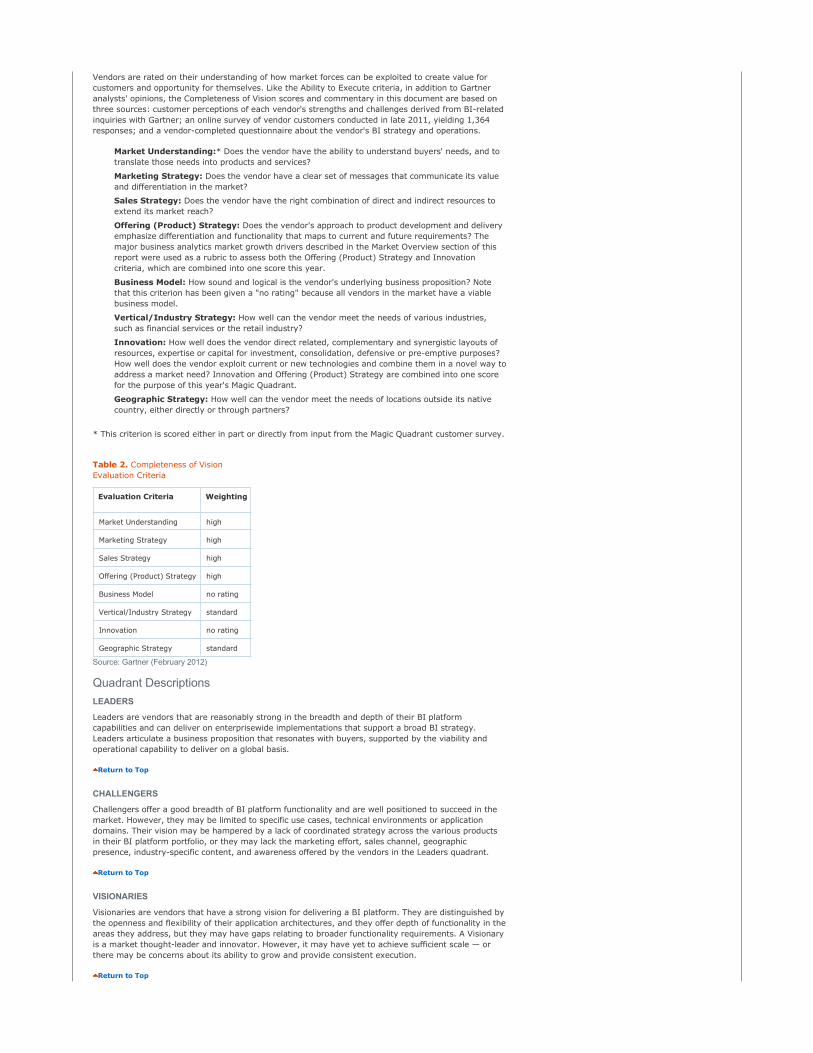
Vendors are rated on their understanding of how market forces can be exploited to create value for
customers and opportunity for themselves. Like the Ability to Execute criteria, in addition to Gartner
analysts' opinions, the Completeness of Vision scores and commentary in this document are based on
three sources: customer perceptions of each vendor's strengths and challenges derived from BI-related
inquiries with Gartner; an online survey of vendor customers conducted in late 2011, yielding 1,364
responses; and a vendor-completed questionnaire about the vendor's BI strategy and operations.
Market Understanding:* Does the vendor have the ability to understand buyers' needs, and to
translate those needs into products and services?
Marketing Strategy: Does the vendor have a clear set of messages that communicate its value
and differentiation in the market?
Sales Strategy: Does the vendor have the right combination of direct and indirect resources to
extend its market reach?
Offering (Product) Strategy: Does the vendor's approach to product development and delivery
emphasize differentiation and functionality that maps to current and future requirements? The
major business analytics market growth drivers described in the Market Overview section of this
report were used as a rubric to assess both the Offering (Product) Strategy and Innovation
criteria, which are combined into one score this year.
Business Model: How sound and logical is the vendor's underlying business proposition? Note
that this criterion has been given a "no rating" because all vendors in the market have a viable
business model.
Vertical/Industry Strategy: How well can the vendor meet the needs of various industries,
such as financial services or the retail industry?
Innovation: How well does the vendor direct related, complementary and synergistic layouts of
resources, expertise or capital for investment, consolidation, defensive or pre-emptive purposes?
How well does the vendor exploit current or new technologies and combine them in a novel way to
address a market need? Innovation and Offering (Product) Strategy are combined into one score
for the purpose of this year's Magic Quadrant.
Geographic Strategy: How well can the vendor meet the needs of locations outside its native
country, either directly or through partners?
* This criterion is scored either in part or directly from input from the Magic Quadrant customer survey.
Table 2. Completeness of Vision
Evaluation Criteria
Evaluation Criteria Weighting
Market Understanding high
Marketing Strategy high
Sales Strategy high
Offering (Product) Strategy high
Business Model no rating
Vertical/Industry Strategy standard
Innovation no rating
Geographic Strategy standard
Source: Gartner (February 2012)
Quadrant Descriptions
LEADERS
Leaders are vendors that are reasonably strong in the breadth and depth of their BI platform
capabilities and can deliver on enterprisewide implementations that support a broad BI strategy.
Leaders articulate a business proposition that resonates with buyers, supported by the viability and
operational capability to deliver on a global basis.
Return to Top
CHALLENGERS
Challengers offer a good breadth of BI platform functionality and are well positioned to succeed in the
market. However, they may be limited to specific use cases, technical environments or application
domains. Their vision may be hampered by a lack of coordinated strategy across the various products
in their BI platform portfolio, or they may lack the marketing effort, sales channel, geographic
presence, industry-specific content, and awareness offered by the vendors in the Leaders quadrant.
Return to Top
VISIONARIES
Visionaries are vendors that have a strong vision for delivering a BI platform. They are distinguished by
the openness and flexibility of their application architectures, and they offer depth of functionality in the
areas they address, but they may have gaps relating to broader functionality requirements. A Visionary
is a market thought-leader and innovator. However, it may have yet to achieve sufficient scale — or
there may be concerns about its ability to grow and provide consistent execution.
Return to Top
NICHE PLAYERS
Niche Players are those that do well in a specific segment of the BI platform market — such as
reporting or dashboarding — or that have limited capability to innovate or outperform other vendors in
the market. They may focus on a specific domain or aspect of BI, but are likely to lack depth of
functionality elsewhere. Or they may have gaps relating to broader BI platform functionality.
Alternatively, Niche Players may have a reasonably broad BI platform, but have limited implementation
and support capabilities or relatively limited customer bases, such as in a specific geography or
industry. Or they may not yet have achieved the necessary scale to solidify their market positions.
Return to Top
Context
This document presents a global view of Gartner's opinion of the main software vendors that should be
considered by organizations seeking to use BI platforms to develop business analytics applications.
Buyers should evaluate vendors in all four quadrants and not assume that only those in the Leaders
quadrant can deliver successful implementations. Year-to-year comparisons of vendor positions are not
always useful given market dynamics (such as emerging competitors, new product road maps, new
buying centers, and/or additional market influences) and changing client concerns/inquiries since our
last Magic Quadrant. Therefore, we have evaluated vendors based on these new market dynamics and
have reflected the changes in our Magic Quadrant criteria evaluation weights for 2012. Any comparison
to prior-year survey results reflect differences in specific customer feedback. For further guidance on
the Magic Quadrant evaluation process and on how to use a Magic Quadrant, see "Magic Quadrants and
MarketScopes: How Gartner Evaluates Vendors Within a Market."
Moreover, while it is tempting for the reader to apply his or her own definitions for the Ability to
Execute and Completeness of Vision evaluation criteria in order to judge vendor positions, such
assumptions will likely lead to incorrect conclusions. For the purpose of this analysis:
Ability to Execute is a function of a vendor's score of five measures that Gartner believes customers
care about most in vendor selection. It does not equate to revenue or market share; it is highly
influenced by customer responses to the BI platforms Magic Quadrant survey.
Completeness of Vision is based on the scoring of six key measures, including, but not exclusive to,
"Offering (Product) Strategy." Customer survey input does influence the overall vision rating; the Magic
Quadrant methodology also includes marketing and geographic strategy in this rubric.
It is important to understand these criteria while judging vendors' positions on the Magic Quadrant.
These evaluation criteria are detailed in the Evaluation Criteria section of this document.
Return to Top
Market Overview
Gartner's view is that the market for BI platforms will remain one of the fastest growing software
markets, despite sluggish economic growth in some regions. Organizations continue to turn to BI as a
vital tool for smarter, more agile and efficient business. According to Gartner's annual survey of CIO
technology priorities, BI and analytics has once again been named the top priority for 2012, a position it
has held in three of the last five years. That said, however, slow economic growth, increasingly viable
low-cost alternatives and consolidation are expected to keep BI platform growth in the single-digit
range in 2012 and beyond. The BI platform market's compound annual growth rate (CAGR) through
2015 is expected to be 8.1% (see "Forecast: Enterprise Software Markets, Worldwide, 2010-2015,
4Q11 Update").
In 2011, the BI platform market expansion was influenced by significant increases in demand from a
wide array of "users": line workers, business analysts, advanced analytic professionals, business
executives, customers/constituents, partners, regulators, and IT professionals. Each user type, along
with their associated use cases, brought lots of variety to BI, well beyond the core query, reporting, and
analysis capabilities BI platforms have long been known for. Not surprisingly, those demands often
conflicted; IT leaders collaborated with business leaders to prioritize efforts based on availability of
budget, people, skills, technology and (hopefully) strategic alignment. With purchases rapidly
expanding in lines of business, vendors are challenged to serve multiple masters. This expansion is not
a temporary aberration, but a sea change for the business analytics marketplace, and by extension for
the BI platform market.
Gartner has identified the following six trends that directly impact the direction of the BI platforms
market.
Return to Top
1. Differences Between Business Users and IT Drive Product Preferences
The crux of the conflict remains the same as last year: business users demand easy to use, flexible
products that put analytic power into their own hands, against IT's desire to maintain standards and
create a supportable BI environment with predictable performance and quality data. These different
points of view are evident in the results of the Magic Quadrant survey, with business users identifying
"ease of use" as their primary buying motivation 52% of the time, and where IT ranks "functionality" as
its No. 1 priority. But the differences don't stop there.
Respondents to this year's survey identified themselves by role. The 1,364 organizations were split as
follows:
IT — 38.9%.
Business user — 20.8%.
Blended business and IT responsibilities — 40.3%.
As stated above, IT (as well as the blended group) indicated functionality as the primary driver,
followed by end-user ease of use and data access/integration capabilities. A majority of business users
flagged ease of use, followed by functionality and integration. The responses are different — but not
that different. What follows are some observations that point out unique points of view that contribute
to the business vs. IT conundrum. In all cases, the blended business and IT group was somewhere
between business and IT attitudes.
Standards matter to IT, but not so much to business users. Business users are more willing to find
products that suit the use case(s) at hand. IT wants to leverage a standard platform as broadly as
it can, often viewing potential solutions primarily through the "standards" lens.
License cost is a big concern for IT, less so for business users. While every purchase is cost-
sensitive, business users are more willing to pay for what they want. IT wants to get functionality
at the most modest cost.
Integration within the BI platform is important for IT, but much less so for business users. IT sees
immense value in taking the platform approach to business analytics, where common metadata
and metrics can be codified and reused. Business users are more flexible in their approach to
using different products for different functions.
Functionality limitations are a sensitive area for IT, less so for business users. IT is often held to
task when designing and developing BI applications. When functionality is weak or missing, it puts
a wrinkle in deployment plans and makes its job more difficult. Business users recognize these
limitations, but can (and often do) resort to work-arounds to get the job done.
Business users are far more open to SaaS/cloud products, especially when augmenting existing
functionality and analyzing data already in the cloud. They are anywhere from 60% to 100% more
likely to follow that path. IT is far less likely to entertain SaaS/cloud analytics as a potential
option.
Return to Top
2. Data Discovery Momentum Continues to Accelerate
Data discovery alternatives to enterprise BI platforms offer highly interactive and graphical user
interfaces built on in-memory architectures to address business users' unmet ease-of-use and rapid
deployment needs. What began as a market buying trend in 2010 has only continued to expand. Sales
results for vendors in this sector have been stellar and well above the market average. The two
branches of BI can be defined as follows:
Enterprise BI platforms:
Key buyers: IT.
Main sellers: megavendors, large independents.
Approach: top-down, IT-modeled (semantic layers), query existing repositories.
User interface: report/KPI dashboard/grid.
Use case: monitoring, reporting.
Deployment: consultants.
Data discovery platforms:
Key buyers: business.
Main sellers: small, fast-growing independents.
Approach: bottom-up, business-user-mapped (mashup), move data into dedicated
repository.
User interface: visualization.
Use case: analysis.
Deployment: users.
The chasm between these segments continues to deepen because business users find the benefits of
using data discovery tools so compelling that they make this choice despite the risk of creating
fragmented silos of data, definitions and tools. This has further accentuated the need for IT
organizations to back away from a single-minded pursuit of standardization on one vendor to a more
pragmatic portfolio approach. Specifically, IT has been challenged to put in place new enterprise
information management architectures, development methodologies, and governance processes that
accommodate and bridge the gap between the different buying centers, architectures, deployment
approaches and use cases of both segments into an enterprise BI portfolio that can meet both business
user and enterprise requirements. Enterprise BI providers have been slow to adapt; in 2011, some of
these firms either released or announced new products in this category — most prominently
MicroStrategy's Visual Insight, Microsoft's PowerView, and IBM Cognos Insight. Oracle's acquisition of
Endeca also signals an intention in this space. While some of these products may not have all the bells
and whistles out of the box, they have staked a claim in the data discovery realm. Some buyers with a
strong platform purchase orientation will have alternatives in their chosen environment. If you look into
the crystal ball, you can possibly see a future where data discovery is not a separate branch, but part of
a broader BI platform solution set.
We are often asked if data discovery is a separate and unique market from enterprise BI platforms.
While there are many facets to this debate, we hear buyers looking for a combination of analytic
capabilities (descriptive, diagnostic, predictive and prescriptive) to meet a broad set of business use
cases and requirements. We see buyers having many options across a broad array of product capability
— it's not A or B, but A plus B. This leads us to conclude that the different BI styles do not constitute

distinct markets today, but are variations on a broader theme...for now. See "Gartner's Business
Analytics Framework" for a longer discussion of this topic.
Return to Top
3. The Rise of Mobile Computing Changes the Face of BI
The expansion of mobile computing devices — tablets and smartphones — has revived mobile BI by
solving most of the problems that prevented success in the past. Gartner predicts that, by 2013, 33%
of BI functionality will be consumed via handheld devices (see "Predicts 2011: New Relationships Will
Change BI and Analytics"). That's one reason why we included it as a fourteenth platform capability in
this year's BI platform definition.
The survey data bears out this rapid acceleration. More than 20% of survey respondents report that
they are already using mobile BI or are piloting it. A whopping 33% plan to deploy mobile BI in 2012.
By the end of 2012, a majority of organizations should have some mobility solutions in place,
catapulting it to the same usage level as Microsoft integration and above predictive analytics. Use cases
on deck are heavily skewed toward executive and management support using mobile devices. But there
are signs that mobile BI is making inroads into other user communities — specifically field and
knowledge workers — as it becomes a common mode of consumption for many. But it's quickly moving
beyond consumption to a primary interaction model as well. Advanced mobile capabilities such as
location awareness, write-back and native gesture support will strongly influence the types of
applications developed, and buyers will demand mobile interfaces to core BI functionality sooner rather
than later.
There are many mobile BI solutions in the market today. Most are extensions of existing BI platforms,
others independent vendors making a name for themselves as mobile BI experts. See "Who's Who in
Mobile BI" for a detailed discussion of mobile BI providers.
Return to Top
4. Putting the Focus on Decision Support
BI platforms have long been defined by "how" they operated. With such intense focus on the mechanics
of BI, many organizations lost sight of what they set out to accomplish — to make better decisions.
Decisions are the life blood of all organizations. Effective decision making at all levels of an organization
separates high-performing companies from poor ones. Decision making is such a fundamental activity
to the success of any organization, whether it is a for-profit, not-for-profit, or government organization,
that improving it is by far the No. 1 driver of BI and analytics investment. Yet, despite significant
investments in BI and analytics made in the name of improving decisions, the vast majority of
organizations make thousands of decisions each day that, without consistency across decision makers
and without insight into how decisions are made or their effectiveness, often have poor outcomes.
Most BI platforms are deployed as systems of performance measurement, not for decision support. This
is changing as organizations are recognizing that analytic capabilities are just one (albeit critical) piece
of the decision process. We see more use cases where user-designed scenarios/models simulate
possible performance outcomes and contributors iterate on the model until there is consensus on the
best decision to take. Some are beginning to automate repeatable, operation decisions in analytic
applications — intelligent decision automation — and implement collaborative decision-making
platforms around analytic capabilities to improve the quality and transparency of tactical and strategic
decisions where collaboration between decision makers is critical to the outcome.
Putting the focus on the outcome is making decision support all the more critical. See "Decision Support
Capabilities in Gartner's Business Analytics Framework" for more information on this topic.
Return to Top
5. An Avalanche of New Use Cases and Content Types
In the Magic Quadrant survey, respondents indicated business process areas where BI was in use. The
"big three" came as no surprise — more than half of all respondents indicated that finance, sales and
operations analysis were implemented within their organizations. Other common application areas
include marketing, supply chain and customer service. But the interesting responses were categorized
as "other": risk management, social media, quality management, and industry initiatives (specifically
healthcare and retail).
This points to a facet of BI platforms that Gartner hears about often in inquiry — customers are
expanding the use of BI products in new areas, and looking to vendors to support those moves. These
areas often promulgate new requirements above and beyond the more traditional management
information analysis most often associated with BI, such as:
Real-time data access: The more operational the use case, the more likely it is that real-time
data becomes a necessary facet of the information infrastructure. The need to store and transform
such data in a data warehouse becomes less critical, as it may require direct connection to
operational applications, or analyzing information in flight and taking action on it. That data may
be internally generated or come from external sources.
Hybrid content: The rise of social media analytics has given voice to the need for accessing vast,
voluminous, semi-structured data — largely text-based — and analyzing the meaning/sentiment
of the data. "Big data," be it technically associated with Hadoop/NoSQL data sources, or just a
recognition that there are large untapped information sources out there just waiting to be
understood, looms large for both business and IT leaders.
Analytic applications: Predefined analytic applications have been part of the landscape for
decades. But we now see an increasing interest from buyers in evaluating whether they can buy
as well as build BI-based applications on a common analytic framework in addition to custom
applications from specialty vendors. These take the form of horizontal business applications tied to
specific sources of data (such as Oracle's BI applications); vertically oriented applications (such as
retail merchandizing systems from QuantiSense or Manthan Systems); industry data models that
prescribe sources and uses of data for industry, such as healthcare or financial services; or
optimization applications to forecast supply based on demand signals (such as supply chain
optimization applications from SAS Institute and a variety of supply chain vendors).
Geographic-intelligent functions: When you need to know where to place a new retail outlet,
or how to market to a population based on location (anyone in a specific postal code, for example)
and demographics, you need to combine lots of market data from external data providers (such as
Experian) and use forecasting and predictive analytic models to effectively target the right buyers.
It's more than just plotting results on a map; it's getting a fuller view of prospects/customers and
using that knowledge to drive business process.
While these are just a few examples, they depict use cases and the variety of data that BI platforms are
being asked to accommodate, and represent a far broader perspective than most of today's
implemented BI environments. They also portend a new set of skills that need to be fostered within
business and IT organizations, as advanced analytics increasingly become the norm rather than the
exception.
Return to Top
6. Removing Complexity From the BI Equation
There's one theme that runs through many of the BI platform Magic Quadrant survey responses:
complexity. BI and analytic environments are often described as difficult to implement, maintain,
develop, and use. Inquiries reinforce this, as clients describe many hoops they must jump through to
manage a high-performing BI environment. This complexity factor is one of the main reasons why BI
isn't more broadly deployed in more firms. Many innovations in the data discovery segment have had a
direct impact on how easy these products are to use. But there are additional layers of analytic
sophistication — causal analysis, predictive modeling and so on — that also need to be simplified so
they can be consumed by business users, not just analytic experts. We see the beginnings of this trend
emerging and expect it to have a significant impact on this market in the years to come — both for
consumers and authors of business analytic content.
Cloud services may also play an important role in removing complexity from the equation. While only
30% of this year's respondents indicated that they were using or planning to use cloud-based offerings
for business analytics, the number is growing, albeit slowly. Many who do use cloud analytics augment
existing BI capabilities — some with specific business applications purchased from cloud analytic
providers, others with PaaS options to move analytic processing to an elastic computing environment
where they can scale up or scale down capacity at will. Some choose to store data in the cloud, others
keep it on-premises where they feel it is more secure. Moving workloads to other providers can simplify
the environment, as buyers contract for a service at an agreed-to level — all for a monthly subscription
fee.
Return to Top
Where Is Innovation Coming From in Today's BI Platform Market?
When reviewing the 2012 BI platforms Magic Quadrant, you will notice that there are no "Visionaries"
and few "Challengers." Why is that? The enterprise BI platforms market is a mature market, but it is
also a constantly expanding one, with innovation coming from many quarters.
Looking back to the last big wave of market consolidation in the latter half of the past decade, large
brands acquired best-of-breed products (Oracle acquired Siebel and Hyperion, SAP bought Business
Objects, IBM purchased Cognos) and incorporated assets into their existing portfolios. This trend
certainly continues. Large vendors continually acquired and subsumed innovative product into their
portfolios. In 2011, for example, Oracle acquired Endeca, and IBM purchased Algorithmics to expand
capabilities and address more use cases/industry requirements. These aren't small tuck-in acquisitions,
but strategic purchases that expand market opportunity.
Smaller specialty vendors also innovate in specific functional areas or industries. They target a set of
functions, such as predictive analytics, advanced visualization, geospatial analysis or cloud analytic
platforms; they go deep into the healthcare of consumer packaged goods to deliver a spot-on solution
to a targeted set of users. Large vendors also have the financial heft and technical breadth to fund
research and development activities that innovate and broaden the appeal of their portfolios. They
combine hands-on experience with thousands of customers to develop mobile applications, expand in-
memory platforms, and develop function-specific engineered systems. This innovation dynamic impacts
the "shape" of the Magic Quadrant participants in 2012. We expect it to continue to influence the
market for BI platforms for years to come.
Return to Top
http://www.gartner.com/technology/about/ombudsman/omb_guide2.jsp.
About Gartner | Careers | Newsroom | Policies | Site Index | IT Glossary | Contact Gartner