mae 322 machine design lecture 5 fatigue - mercer...
TRANSCRIPT

MAE 322
Machine Design
Lecture 5
Fatigue Dr. Hodge Jenkins
Mercer University

Introduction to Fatigue in Metals
Cyclic loading produces stresses that are variable, repeated,
alternating, or fluctuating
Fracture at Maximum stresses well below yield strength (SY)
Failure occurs after many stress cycles
Failure is by sudden ultimate fracture
No visible warning in advance of failure
Shigley’s Mechanical Engineering Design

Stages of Fatigue Failure
Stage I – Initiation of micro-
crack due to cyclic plastic
deformation
Stage II – Progresses to
macro-crack that repeatedly
opens and closes, creating
bands called beach marks
Stage III – Crack has
propagated far enough that
remaining material is
insufficient to carry the load,
and fails by simple ultimate
failure
Shigley’s Mechanical Engineering Design
Fig. 6–1

Schematics of Fatigue Fracture Surfaces
Shigley’s Mechanical Engineering Design
Fig. 6–2

Schematics of Fatigue Fracture Surfaces
Shigley’s Mechanical Engineering Design

Fatigue Fracture Examples
Shigley’s Mechanical Engineering Design
AISI 4320 drive
shaft
B– crack initiation at
stress concentration
in keyway
C– Final brittle
failure
Fig. 6–3

Fatigue Fracture Examples
Shigley’s Mechanical Engineering Design
Fatigue failure
initiating at
mismatched grease
holes
Sharp corners (at
arrows) provided
stress concentrations
Fig. 6–4

Fatigue Fracture Examples
Shigley’s Mechanical Engineering Design
Fatigue failure of
forged connecting rod
Crack initiated at flash
line of the forging at the
left edge of picture
Beach marks show
crack propagation
halfway around the hole
before ultimate fracture
Fig. 6–5

Fatigue Fracture Examples
Shigley’s Mechanical Engineering Design
Fatigue failure of a
200-mm diameter
piston rod of an alloy
steel steam hammer
Loaded axially
Crack initiated at a
forging flake internal to
the part
Internal crack grew
outward symmetrically
Fig. 6–6

Fatigue-Life Methods
Three major fatigue life models
Methods predict life in number of cycles to failure, N, for a
specific level of loading
Stress-life method (used in most designs)
◦ Least accurate, particularly for low cycle applications
◦ Most traditional, easiest to implement
Strain-life method
◦ Detailed analysis of plastic deformation at localized regions
◦ Several idealizations are compounded, leading to uncertainties
in results
Linear-elastic fracture mechanics method
◦ Assumes crack exists
◦ Predicts crack growth with respect to stress intensity
Shigley’s Mechanical Engineering Design

Stress-Life Method
Test specimens are subjected to repeated stress while counting cycles
to failure
Most common test machine is R. R. Moore high-speed rotating-beam
machine
Subjects specimen to pure bending with no transverse shear
As specimen rotates, stress fluctuates between equal magnitudes of
tension and compression, known as completely reversed stress cycling
Specimen is carefully machined and polished
Shigley’s Mechanical Engineering Design
Fig. 6–9

S-N Diagram
Number of cycles to failure at varying stress levels is plotted on log-log scale
For steels, a knee occurs near 106 cycles
Strength corresponding to the knee is called endurance limit Se
Shigley’s Mechanical Engineering Design
Fig. 6–10

S-N Diagram for Steel
Stress levels below Se (Endurance Strength) predict infinite life
Between 103 and 106 cycles, finite life is predicted
Below 103 cycles is known as low cycle, and is often considered
quasi-static. Yielding usually occurs before fatigue in this zone.
Shigley’s Mechanical Engineering Design
Fig. 6–10
Se
SUT

S-N Diagram for Nonferrous Metals
Nonferrous metals often do not have an endurance limit.
Fatigue strength Sf is reported at a specific number of cycles
Figure 6–11 shows typical S-N diagram for aluminums
Shigley’s Mechanical Engineering Design Fig. 6–11

Strain-Life Method
Method uses detailed analysis of plastic deformation at localized
regions
Compounding of several idealizations leads to significant
uncertainties in numerical results
Useful for explaining nature of fatigue
Not so useful in Machine Design
Shigley’s Mechanical Engineering Design

Linear-Elastic Fracture Mechanics Method
◦ Assumes Stage I fatigue (crack initiation) has occurred
◦ Predicts crack growth in Stage II with respect to stress
intensity
◦ Stage III ultimate fracture occurs when the stress intensity
factor KI reaches some critical level KIc
Shigley’s Mechanical Engineering Design

Crack Growth
Substituting Eq. (6–4) into Eq. (6–5) and integrating,
ai is the initial crack length
af is the final crack length corresponding to failure
Nf is the estimated number of cycles to produce a failure after the
initial crack is formed
Shigley’s Mechanical Engineering Design

Returning to Stress-Life Fatigue Modeling
Fatigue Stress-Life: Sf-N Diagram for steels
Stress levels below Se (Endurance Strength) predict infinite life
Between 103 and 106 cycles, finite life is predicted
Below 103 cycles is known as low cycle,
Shigley’s Mechanical Engineering Design
Fig. 6–10
Se
SUT 𝑆𝑓′

Fatigue Strength
For design, an approximation of the idealized S-N diagram is
desirable.
To estimate the fatigue strength at 103 cycles, start with Eq. (6–2)
Define the specimen fatigue strength at a specific number of
cycles as
Combine with Eq. (6–2),
Shigley’s Mechanical Engineering Design

Fatigue Strength
At 103 cycles,
f is the fraction of Sut represented by
Solving for f,
The SAE approximation for steels with HB ≤ 500 may be used.
To find b, substitute the endurance strength and corresponding
cycles into Eq. (6–9) and solve for b
Shigley’s Mechanical Engineering Design
310( )fS

Fatigue Strength Fraction f
Plot Eq. (6–10) for the fatigue strength fraction f of Sut at 103
cycles
Use f from plot for S'f = f Sut at 103 cycles on S-N diagram
Assumes Se = S'e= 0.5Sut at 106 cycles
Shigley’s Mechanical Engineering Design
Fig. 6–18

Equations for S-N Diagram
Shigley’s Mechanical Engineering Design
Write equation for S-N line
from 103 to 106 cycles
Two known points
At N =103 cycles,
Sf = f Sut
At N =106 cycles,
Sf = Se
Equations for line:
Fig. 6–10

Equations for S-N Diagram
Shigley’s Mechanical Engineering Design
If a completely reversed stress srev is given, setting Sf = srev in
Eq. (6–13) and solving for N (cycles to failure) gives,
Note that the typical S-N diagram is only applicable for
completely reversed stresses
For other stress situations, a completely reversed stress with the
same life expectancy must be used on the S-N diagram

Low-cycle Fatigue
Low-cycle fatigue is defined for fatigue failures in the range 1 ≤ N ≤ 103
On the idealized S-N diagram on a log-log scale, failure is predicted by a straight line between two points (103, f Sut) and (1, Sut)
Shigley’s Mechanical Engineering Design
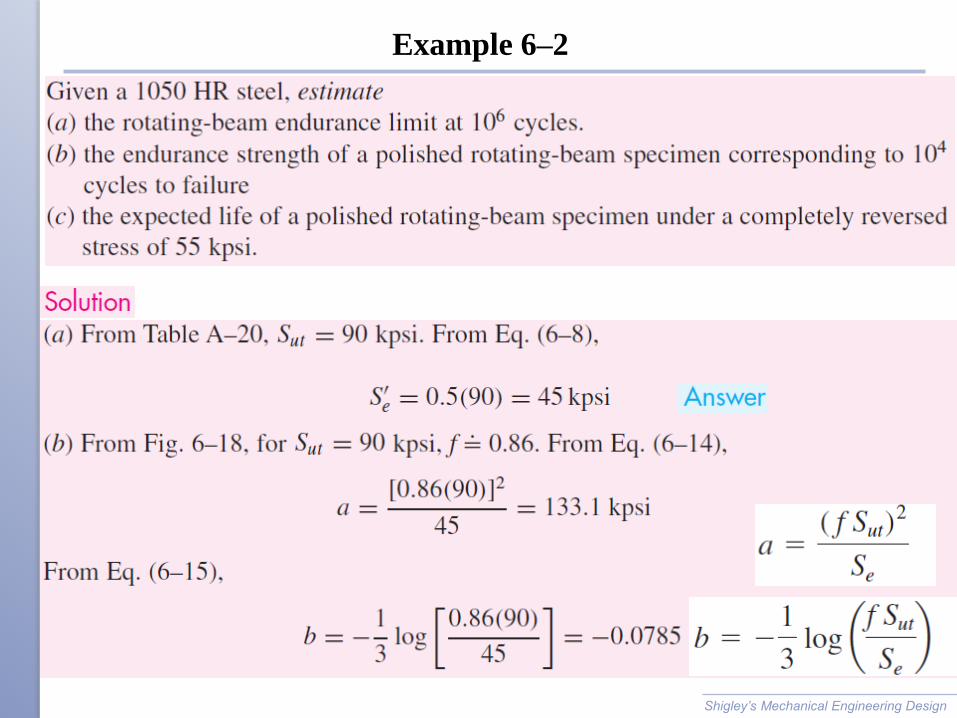
Example 6–2
Shigley’s Mechanical Engineering Design

Example 6–2 (continued)
Shigley’s Mechanical Engineering Design