madulsima plantations plc
TRANSCRIPT

Annual Report 2020
MADULSIMA PLANTATIONS PLC
833, Sirimavo Bandaranayaike Mawatha, Colombo - 14 TEL : +94552226115 / FAX : +94552226292
E MAIL : [email protected]/our-core-sectors/plantation-services

- Annual Report 2020
Content
Vision, Mission ............................................................................................................................................................................................... 1
Historical Background ................................................................................................................................................................................ 2
Notice of Meeting ........................................................................................................................................................................................ 3 - 4
Corporate Information ............................................................................................................................................................................... 5
Management Team ..................................................................................................................................................................................... 6
Chairman’s Review ....................................................................................................................................................................................... 7 - 8
Board of Directors ........................................................................................................................................................................................ 9 - 10
Sustainability Report ................................................................................................................................................................................... 11 - 18
Management Discussion & Analysis ...................................................................................................................................................... 19 - 20
Report of the Board of Directors of the affairs of the Company.................................................................................................. 21 - 23
Audit Committee Report ........................................................................................................................................................................... 24
Remuneration Committee Report ......................................................................................................................................................... 25
Related Party Transactions Review Committee Report .................................................................................................................. 25
Corporate Governance Statement ......................................................................................................................................................... 26 - 28
Statement of Directors’ Responsibilities .............................................................................................................................................. 29
Risk Management......................................................................................................................................................................................... 30 - 33
Financial Highlights ..................................................................................................................................................................................... 34
Auditors’ Report ............................................................................................................................................................................................ 35 - 40
Statement of Profit or Loss ....................................................................................................................................................................... 41
Statement of Comprehensive Income ................................................................................................................................................. 42
Statement of Financial Position .............................................................................................................................................................. 43
Statement of Changes in Equity ............................................................................................................................................................. 44
Statement of Cash Flows ........................................................................................................................................................................... 45
Notes to the Financial Statements ......................................................................................................................................................... 46 - 88
Shareholder and Investor Information ................................................................................................................................................. 89 - 90
Performance of Estates 2020 & 2019 ..................................................................................................................................................... 91
Statement of Value Addition.................................................................................................................................................................... 91
Financial Information .................................................................................................................................................................................. 92
Notes ................................................................................................................................................................................................................. 93
Form of Proxy................................................................................................................................................................................................. 94
Instructions for Completion of Form of Proxy ................................................................................................................................... 95

- Annual Report 2020
Our VisionTo be a trend setter to the Plantation Industry by being a
result oriented innovative Tea Company.
Our MissionTo manage the Plantations as economically viable
units and ensure the enhancement of their agro economically value.
To improve the Socio Economic Conditions of the Workers.
To enhance returns to the Shareholders.
To become the best managed World Class Tea Company reputed for quality.
1

- Annual Report 2020 - Annual Report 2020
The Company was originally incorporated as Madulsima Plantations Ltd on 22nd June 1992 by Certificate of Incorporation issued in
terms of Section 15 (1) of the Company’s Act No. 17 of 1982 read with Section 2 (2) of the Conversion of Public Corporation or Government owned business undertakings into Public Company’s Act No. 23 of 1987 and the order published in the Gazette Extra Ordinary of the Democratic
Socialist Republic of Sri Lanka dated 22nd June 1992. The Company was thereafter re-registered under the Company’s Act No. 07 of 2007 as Company No PQ 184 and a fresh Certificate of Incorporation issued under the provision of Section 485 (6) of the Company’s Act No. 7 of
2007 with the corporate name changed by operation of law to Madulsima Plantations PLC .
The first tranche of 51% (10.2 Mn. shares) of the issued share capital of the Company was sold by the Secretary to the Treasury through the Colombo
Stock Exchange on an “all or nothing” basis and was purchased by Stassen Exports Limited in February 1996.
The convertible Debentures of Rs.90 Mn. issued in February 1996 to Distilleries Company of Sri Lanka were converted to 9 Mn. ordinary shares
on 30th November 1998 and were issued to the holder.
As per decision of the Government 10% (2 Mn. shares) of the shares of the Company belonging to the Secretary to the Treasury on behalf of the
Government were distributed among the employees of the Company.
20% (4 Mn. shares) of the shares of the Company belonging to the Secretary to the Treasury on behalf of the Government were sold to the
public through the Colombo Stock Exchange.
16,949,673 shares belonging to the main shareholder, Stassen Exports (Pvt) Ltd were purchased by related party Melstacorp PLC on 22nd
September 2017.
Historical Background
2

- Annual Report 2020
Notice of Meeting
NOTICE IS HEREBY GIVEN that the Twenty Eighth Annual General Meeting of MADULSIMA PLANTATIONS PLC will be held as a virtual meeting at the “Mini Auditorium” Distilleries Company of Sri Lanka PLC # 110, Norris Canal Road, Colombo 10, Sri Lanka on Thursday, 29th July 2021 at 10.00 a.m. for the following purposes :
1) To receive and consider the Report of the Directors and the Financial Statements of the Company for the year ended 31st December 2020 together with the Auditors’ Report thereon.
2) To re-elect Mr D H S Jayawardena who is over 70 years as a Director of the Company in terms of Sections 210 and 211 of the Companies Act No. 7 of 2007.
3) To re-elect Dr N M Abdul Gaffar who is over of 70 years as a Director of the Company in terms of Sections 210 and 211 of the Companies Act No. 7 of 2007.
4) To re-elect Dr A Shakthevale who is over of 70 years as a Director of the Company in terms of Sections 210 and 211 of the Companies Act No. 7 of 2007.
5) Mr D S K Amarasekera who retires by rotation at the Annual General Meeting in terms of Article 92 of the Articles of Association as a Director of the Company.
6) To authorize the Directors to determine the remuneration of the Auditors, Messrs KPMG who are deemed to have been reappointed as Auditors in terms of Section 158 of the Companies Act No. 07 of 2007.
7) To pass the following special resolution to amend the Articles of Association by including No. 52 (a) immediately after the existing Article 52 of the Articles of Association as follows :
52. (a) “Notwithstanding any provision in this Articles suggesting the contrary, a meeting of Shareholders may be held by means of Audio or Audio visual communication by which all shareholders participating and constituting quorum can simultaneously hear each other throughout the meeting or by any means of virtual meeting whereby shareholders regardless of their location could connect or linkup online through Video/Audio/Text”.
By Order of the Board of Directors
Sgd.Pradeep A JayatungaCompany Secretary
11th June 2021Colombo
Note:1. In the interest of protecting public health and facilitating compliance with the Health and Safety guidelines issued by the
Government of Sri Lanka, the Twenty Eighth (28th ) Annual General Meeting of Madulsima Plantations PLC will be a virtual meeting held by participants joining in person or proxy and through audio or audio visual means int eh manner specified below:
i) Attendance of the Chairman and the Board of Directors The Chairman/Managing Director, Board of Directors certain Key Management Personnel, the Company Secretary, and the
External Auditors will be present at the “Mini Auditorium” Distilleries Company of Sri Lanka PLC, # 110, Norris Canal Road, Colombo 10, Sri Lanka at 10.00 a.m. on Thursday, 29th July 2021
ii) Shareholder participation
a. The Shareholders are encouraged to appoint a Director of the Company as their proxy to represent them at the meeting.
b. The Shareholders may also appoint any other persons other that a Director of the Company as their proxy and the proxy so appointed shall participate at the meeting through audio or audio visual means only.
3

- Annual Report 2020
c. The shareholders who wish to participate at the meeting will be able to join the meeting through audio or audio visual means. To facilitate this process, the shareholders are required to furnish the details of the shareholder and proxy holder, if any, by perfecting Annexure II to the circular to shareholders and forward same to Company Secretary via [email protected] or by facsimile on +94 11 254033, to reach the Secretary not less than five (05) days before the date of the meeting so that the meeting login information could be forwarded to the e.mail address as provided. The circular to the shareholders will be posted to all the shareholders along with the Notice of Meeting and the Form of Proxy.
d. To facilitate the appointment of proxies, the Form of Proxy is attached hereto and the duly filled Form of Proxy should be sent to reach the Company Secretary via e.mail [email protected] or facsimile on +94 11 254033 or by post to the Registered Office of the Company, Madulsima Plantations PLC, #833, Sirimavo Bandaranayake Mawatha, Colombo 14, Sri Lanka not less than forty – eight (48) hours before the time fixed for the meeting.
iii. Shareholders’ queries The shareholders are hereby advised that if they wish to raise any queries, such queries should be sent to reach the Company
Secretary, via e.mail to [email protected] or facsimile on + 94 11 254033 or by post to the Registered Office of the Company, Madulsima Plantations PLC, # 833, Sirimavo Bandaranayake Mawatha, Colombo 14, Sri Lanka not less than Five (05) days before the date of the meeting. This is in order to enable the Company Secretary to compile the queries and forward same to the attention of the Board of Directors so that same could be addressed at the meeting.
2. The Annual Report of the Company for the year 2020 will be available for perusal of the Company website http://melsta.com/our-core-sectors/plantations-services and the Colombo Stock Exchange website on www.cse.lk
If you wish to receive a printed copy of the Annual Report for the year ended 2020, please complete and forward us the Form of Request attached hereto (Annexure 1) by post to the registered address of the Company, Madulsima Plantations PLC, # 833, Sirimavo Banda-ranayke Mawatha, Colombo 14, Sri Lanka or e.mail [email protected] or facsimile + 94 11 2540333.
Notice of Meeting
4
- Annual Report 2020
Company Name Madulsima Plantations PLC
Legal Form of the Company Public Quoted
Registration No. P Q 184
Parent Company Melsta Corp PLC#110, Norris Canal Road, Colombo 10Sri Lanka
Registered Office 833, Sirimavo Bandaranayke Mawatha, Colombo 14.
Board of Directors Mr. D. H. S. Jayawardena - Chairman/MDDr. N. M. Abdul Gaffar - Non Ex DirectorMr. D. Hasitha S Jayawardena - Non Ex DirectorDr. A. Shakthevale - Ind. DirectorMr. D. S. K. Amarasekera - Ind. Director
Company Secretary Mr. P. A. Jayatunga
Auditors Messrs KPMG (Chartered Accountants)32A, Sir Mohamed Macan Marker MawathaColombo 03, Sri Lanka.
5
Corporate Information
Registrars Messrs P W Corporate Secretarial (Pvt) Ltd#3/17, Kensey Road, Colombo 08,Sri Lanka.
Bankers Hatton National Bank PLC#16, City Office,Janadhipathi Mawatha,Colombo 01, Sri Lanka. Standard Chartered Bank – Fort BranchP O Box 112, Colombo 01, Sri Lanka. Bank of CeylonBank Road,Badulla, Sri Lanka. Commercial Bank of Ceylon PLC-Foreign Branch# 21, Sir Razik Fareed MawathaP O Box 856,Colombo 01, Sri Lanka.

- Annual Report 2020 6
Management Team
Director Operations Maj. Gen. (Retd). Dampath Fernando
Name of Superintendent Name of Estate
Mr. W. M. T. C. Wedisinghe Battawatte Estate
Mr. C. Senevirathne Cocogalla Estate
Mr. G. I. Senarath El-Teb Estate
Mr. W. M. A. P. Jayathilaka Galloola Estate
Mr. N. Randeniya (w.e.f.01.04.2021) Mahadowa Estate
Mr. K. D. Senerath Roebery Estate
Mr. W. M. H. E. Wijerathne Uvakellie Estate
Mr. M. A. Ratnadason Verellapatna Estate
Name of Superintendent Name of Estate
Mr. A. S. A. Madena Kew Estate
Mr. N. P. Liyanage Kirkoswald Estate
Mr. N. P. Sudarshan Theresia Estate
Mr. I. A. Bogahawatte Venture Estate
HEAD OFFICE - COLOMBO
HEAD OFFICE - BADULLA
COMPANY SECRETARIAL & LEGAL DIVISION
MADULSIMA REGION
BOGAWANTALA REGION
ESTATE MANAGERS
Chief Executive Officer Mr. M. A. Fernando
Manager Operations (w.e.f. 02.03.2021) Mr. L. G. Sudantha Wijerathna
Financial Controller Mr. D. M. Samantha K. Dissanayake
Accountant Mr. C. Bathmanathan
Company Secretary/Legal Officer Mr. Pradeep Jayatunga

- Annual Report 2020
Elevation Average ( Rs. Per Kg)
2020 2019 2018 2017 2016
High 593.89 515.87 574.70 606.95 457.58
Medium 562.77 476.47 520.36 563.43 420.67
Low 682.61 588.07 601.56 638.23 487.16
National 645.01 556.53 582.98 620.17 470.85
Sri Lanka Elevation Average ( Rs. Per Kg)
During the year, the Company achieved an all-time high production volume of 5.084 Mn. kg after Five years, even though the tea industry plunged into an all-time low production after 23 years. The bounce back of higher production volumes is a result of the company rightly investing in the upliftment of its agricultural standards, factory production expansion and equipment upgrading programs. This will place the Company in a stronger and more sustainable future.
7
Company Performance 2020 2019 2018 2017 2016
Production ('000kg) 5,084 4,119 4,144 4,412 4,475
Yield (kg/ha) 1,077 900 847 860 914
Revenue (Rs.Mn) 2,832 2,007 2,144 2,605 1,842
Gross Sale Average (Rs./ Kg.) 549.46 474.11 526.77 568.62 425.38
Net Sale Average (Rs./ Kg.) 539.11 464.90 531.59 572.39 426.67
COP ( Rs. / Kg.) 649.46 720.37 679.75 623.44 524.13
Profit / (Loss) (Rs. / Kg.) (110.35) (255.47) (148.16) (51.05) (97.46)
Chairman’s Review
On behalf of the Board of Directors of Madulsima Plantations PLC, I am pleased to present the Annual Report and Audited Financial Statements of the Company for the year 2020.
The company recorded a strong turnaround performance for the 2020 financial year amidst many socio- economic challengers with the Covid -19 pandemic that prevailed during the year under review.
Company PerformanceThe company earned a total revenue of Rs. 2.83 Bn. for the year compared to 2.00 Bn. in 2019. For the year 2020 the company recorded an operational profit before finance cost and taxation of Rs. 186 Mn., and after tax loss of Rs. 201 Mn., when compared with the previous year’s operational loss before finance cost and taxation of Rs. 435 Mn., and after tax loss of Rs. 764 Mn..
Profit/ (Loss) Rs. (Mn)
2020 2019
Profit/(Loss) from Operation 186 (435)
Net Finance Cost (318) (346)
Income Tax Benefit/(Expense) (69) 17
Loss after Taxation (201) (764)
Improved tea prices with lower cost of production per kilogram, along with reduced finance cost have primarily contributed to remarkably outperform the last year’s financial results.
Corporate Information

- Annual Report 2020
Chairman’s Review
8
The National auction prices have increased by Rs. 88.48 compared to 2019. The sale average (GSA) of the company for tea in year 2020 increased to Rs. 549.46 per kilo from 474.11 per kilo recorded in year 2019, which is an increase of Rs. 75.35 per kilo.
The Board of Directors took very drastic steps to mitigate the losses by introducing several reforms and making many changes to the grassroot level and have taken steps to stop leakage of tea with the results are coming. This year’s production is the highest for the last 05 years. Yield is also the highest for the last 05 years and Revenue also the highest for the last 05 years. With the co-operation of all staff, these figures are reached, and the management hope next year with these prices and more productivity and taking many agricultural corrections, we can pay dividend to the shareholders. Management has also taken steps to diversify the crops with more cinnamon and more cardamom and rehabilitated all these abandoned estates and brought back to production.
We look forward to a new financial year with utmost confidence and firm dedication.
DividendsI regret to inform you that the Directors are not recommending a dividend for the year ended 31st December 2020.
AcknowledgementOn behalf of the Board of Directors I wish to thank the Buyers, Brokers and Suppliers for their patronage. I would also like to acknowledge the dedication, commitment and loyalty of the Management team, Executives, Staff and Workers of the Company in carrying out their tasks.
I thank each and every one our stakeholders for their excellent service.
Sgd. D. H. S. JayawardenaChairman/ Managing DirectorMadulsima Plantations PLC.11th June 2021
Corporate Information

- Annual Report 2020
MR. D. HASITHA S. JAYAWARDENA Non Executive Director
Mr. Hasitha Jayawardena holds a Bachelor’s Degree in Business Administration BBA (Hons) from the University of Kent in the United Kingdom.
Mr. Jayawardena has also worked as an Intern at the Clinton Global Initiative Programme (CGI) in New York in 2007.
DirectorStassen International (Pvt) Ltd., Stassen Natural Foods (Pvt) Ltd., Stassen Foods (Pvt) Ltd., Stassen Exports (Pvt) Ltd., Milford Exports (Ceylon) (Pvt) Ltd., Milford Developers (Pvt) Ltd., Ceylon Garden Coir (Pvt) Ltd., C B D Exports (Pvt) Ltd., Distilleries Company of Sri Lanka PLC, Periceyl (Pvt) Ltd., Lanka Milk Foods (CWE) PLC, Lanka Dairies (Pvt) Ltd., Ambewela Livestock Company Ltd., Pattipola Livestock Company Ltd., Ambewela Products (Pvt) Ltd., United Dairies Lanka (Pvt) Ltd., Zahra Exports (Pvt) Ltd., Mcsen Range (Pvt) Ltd., Balangoda Plantations PLC., Melstacorp Ltd., Melsta Gama (Pvt) Ltd., Melsta Health (Pvt) Ltd., Melsta Hospitals Ragma (Pvt) Ltd., Melsta Hospitals Colombo North (Pvt) Ltd., DCSL Brewery (Pvt) Ltd.
9
Board of Directors
DR. N. M. A. GAFFAR Director
PHD. (London), MSc. (London), Dip. In Bio.Chem ENG (U.C. London), BSc. Chemistry Hons (SL)
Dr. N. M. Abdul Gaffar was the Head of the Technology Division of the Tea Research Institute of Sri Lanka before he joined Stassen Exports Limited as a Director in January 1982 and has been in charge of the Stassen Green Tea Project, the pioneer commercial Green Tea Project of Sri Lanka, since its inception. He has been involved in the Organic Tea Project of Stassen Natural Foods (Pvt) Ltd., which is the pioneer organic tea project of Sri Lanka and the first certified organic tea project of the world. He is a Director of Stassen Plantation Management Services (Pvt) Ltd. He is also a Director of Bogo Power (Pvt) Ltd., and is in charge of the development of its 4 MW Kirkoswald Mini Hydro Project.
MR. D. H. S. JAYAWARDENA Chairman/Managing Director
Mr. D. H. S. Jayawardena is one of the most successful and prominent business magnates in Sri Lanka. He heads many successful ventures in diversified fields of business.
ChairmanAitken Spence PLC, Browns Beach Hotels PLC, Aitken Spence Hotel Holdings PLC, Aitken Spence Hotel Managements Asia (Pvt) Ltd., Negombo Beach Resorts (Pvt) Ltd., Lanka Power Projects (Pvt) Ltd., Stassen Exports (Pvt) Ltd., Milford Exports (Ceylon) (Pvt) Ltd., Stassen International (Pvt) Ltd., Stassen Natural Foods (Pvt) Ltd., Stassen Foods (Pvt) Ltd., Milford Developers (Pvt) Ltd., C B D Exports (Pvt) Ltd, Ceylon Garden Coir (Pvt) Ltd., Lanka Milk Foods (CWE) PLC, Lanka Dairies (Pvt) Ltd., Ambewela Livestock Company Ltd., Ambewela Products (Pvt) Ltd., Pattipola Livestock Company Ltd., United Dairies Lanka (Pvt) Ltd.,Timpex (Pvt) Ltd., Texpro Industries Ltd., Distilleries Company of Sri Lanka PLC, Periceyl (Pvt) Ltd., Melstacorp PLC, Melsta Health (Pvt) Ltd., Milford Holdings (Pvt) Ltd., Balangoda Plantations PLC, Bogo Power (Pvt) Ltd., Bellactive (Pvt) Ltd., Lanka Bell Ltd., Bell Solutions (Pvt) Ltd.
Managing DirectorStassen Real Estate Developers (Pvt) Ltd
DirectorStassen Plantation Management Services (Pvt) Ltd., Melsta Gama (Pvt) Ltd., Hospital Management Melsta (Pvt) Ltd., DCSL Brewery (Pvt) Ltd
OthersConsul General for Denmark in Sri Lanka

- Annual Report 2020
Board of Directors
DR. A. SHAKTHEVALE Independent Non - Executive Director
Dr. A. Shakthevale is a retired Additional Secretary (Livestock), Ministry of Agriculture and Livestock in 2002, and served as the Secretary, Ministry of Rehabilitation and Social Services in the Northeast Provincial Council and as a member of the Independent Finance Commission for two terms from July 2004 – July 2009. He works as a freelance Consultant in the field of livestock. He has also worked for FAQ, as the National Consultant – Veterinary Production Specialist, UNDP, GTZ UNHABITAT, Land O’Lake Oxfom GB and several local livestock organizations.
DirectorLanka Milk Foods (CWE) PLC, Balangoda Plantations PLC, and United Dairies Lanka (Pvt) Ltd
MR. D. S. K. AMRASEKERA Independent Non - Executive Director
Mr. D. S. K. Amarasekera is an eminent Tax Consultant and the Senior Tax and Legal Partner of Amarasekera & Company, a leading tax consultancy firm in the country. He is a Member of the Institute of Chartered Accountants of Sri Lanka and is an Attorney-at-Law of the Supreme Court of Sri Lanka.
DirectorBrowns Investments PLC, Eden Hotel Lanka PLC, Browns Capital PLC, Kelani Tyres PLC, Lanka Milk Foods (CWE) PLC, Balangoda Plantations PLC, Palm Garden Hotels PLC, Central Services (Pvt) Ltd., Ceylon Cinema Holdings (Pvt) Ltd., Excel Global Holding (Pvt) Ltd., Excel Restaurants (Pvt) Ltd., Foton Lanka (Pvt) Ltd., Browns Capital Properties (Pvt) Ltd., Free Lanka Plantations Co. (Pvt) Ltd., Millennium Development (Pvt) Ltd., Samudra Beach Resorts (Pvt) Ltd, Sierra Holdings Ltd., Southern Cleaners (Pvt) Ltd., The Tea Leaf Resort Holdings (Pvt) Ltd., Tropical Villas (Pvt) Ltd., Business Process Outsourcing (Pvt) Ltd., The Colombo Land Exchange Ltd., Morningside Estate (Pvt) Ltd., Ceylon Hotel Holdings (Pvt) Ltd., Suisse Hotel Kandy (Pvt) Ltd., Ceylon Roots (Pvt) Ltd., Green Paradise (Pvt) Ltd., BG Air Services (Pvt) Ltd., Browns Tours (Pvt) Ltd., Sun & Fun Resorts Ltd., NPH Holdings (Pvt) Ltd., Bodufaru Beach Resorts (Pvt) Ltd., Don & Don Holdings (Pvt) Ltd.
10

- Annual Report 2020
Sustainability Report
Sustainability ReportIn achieving corporate sustainability, we have placed high value in identifying the various dimensions of our business and how they operate in the social, cultural and economic environment. We attempt to look internally and externally to understand our environment and its social impact. We are looking closer than ever at how and with whom we work around the world.
More than ever, we know that our role in sustainable agriculture plays a critical role in our survival, our success as a going concern and in our future progress. Amidst threatening global challenges for our produce, to remain competitive we realize that we need to reassess our resources and make measurable progress in our strategies.
Economic EnvironmentIdentifying the needs of our buyers especially in the EU and Middle Eastern destinations, is a key aspect in planning our activities in each of our markets to create a better demand for our produce. They expect the products they buy from us are produced responsibly.
Learning sustainable growing practices is a key aspect in being adoptive and in being resilient to climate change. Educating our senior managers to share knowledge, raise awareness and support the implementation of sustainable agriculture principles and practices is an important aspect of our corporate sustainability strategy. Regular discussions and workshops have been undertaken in this regard to spread the message among our workforce with a view to improve their productivity. The training programs focus on topics such as practices for improved harvesting and thereby yields, crop diversification and achieving community support for adaptation of other crop varieties which traditionally they have been resisting.
Tea Smallholders play a critical role in our supply chain. Going forward we intend building closer relationships with them that would improve their agronomic practices and entrepreneurial skills to be partners in our progress. We recognize that farmer organizations can play a key role in supporting smallholder relations and create a stable and long-term business commitments.
The production process of tea is such that the industry’s maximum power need coincides with the power system peak demand, thus consuming expensive energy. This industry is largely located in the Central and Uva provinces, where the topography coupled with heavy persistent rainfall offers a good opportunity to harness hydro-power, the most widely used power source in the plantation sector, to meet the entire power requirement of the industry. This potential remains largely underutilized, as grid electricity supply is at present available in almost all tea estates, particularly at the factories where tea is processed. These plantations also practice cultivation and harvesting of fast-growing tree species in abandoned tea-growing land to meet the industry’s thermal energy requirements. This biomass usage could also be extended to electricity generation, though realizing the scope for this application in the Sri Lankan context is in an experimental stage.
In April 2020, the Colombo auction prices rose sharply as global tea supply continued to tumble due to labor deployment issues as a result of COVID-19 pandemic and adverse weather. Weaker local currency, demand induced by the perceived health benefits of black tea and higher tea consumption amidst lock downs have also helped the Ceylon tea prices to stay buoyant for the said period. Current, higher prices have to a larger extent compensated for the impact on financial performance of tea producers from the lower production levels.
11

- Annual Report 2020
Sustainability Report
However, with the oil prices plummeting to historical lows, ICRA stated that it will continue to monitor the sustainability of the current price levels as there is a relatively strong correlation between oil prices and Sri Lankan tea prices.
FORESTRY MANAGEMENT & SUSTAINABILITY
Overview: “Our Sustainable Environmental Management Strategies Follows an Integrated Levels Approach Models”
Being an ownership/custodian of 7369 hectares of nation’s economically high value and environmentally sensitive land resource, we are deeply committed towards protecting the environmental in which we operate for the benefit of the present and future generations.
Our approach to environment management is well in line with the national policies and legislative requirements relating to the with the national policies and legislative requirements relating to the environment and biodiversity. We have obtained certification from the globally acknowledged Rainforest Alliance (RA), Sustainable Agriculture Network (SAN) and ISO 22000, whilst being a member of the Biodiversity Sri Lanka - the only national initiative in which the corporate sector works together with conservation agencies on environmental and biodiversity related issues.
Our well - integrated environmental strategy is formulated based on the comprehensive risk assessment set out below, covering all environmental aspects.
STRATEGIC IMPERATIVES OF
SUSTAINABLE ENVIRONMENTAL MANAGEMENT OF
MPL Water Conservation & Protection
of Water Resources
Agro-forestry Planting &
Management
Carbon Foot Print
Reduction
Sustainable Forestry
Management ,Research &
Developments
Biodiversity conservation
& Protection
Soil Conservation
Ecosystem Conservation & Restoration
Climate Change
Management
12

- Annual Report 2020
Sustainability Report
Environmental Risk AssessmentRisks Interconnected with Natural, Operational and Human Activities
Climate Change² Extreme Weather Conditions ² Change in rainfall pattern and ambient temperature
HIGH
Risk Assessment² Land Degradation² Adverse impact on yields and quality of Tea.² Difficulty in forecasting crop and quality of tea.² Drop in crop intakes and profitability.² Forest Fires² Reduce employment opportunities.² Adverse impact on Biodiversity.
Risk Management Strategies
Water² Water scarcity due to climate change and high consumption
by the expanding estate community.MODERATE
Soil Fertility² Depletion of soil organic matter and nutrients.
MODERATE
Risk Assessment Risk Management Strategies
Green House Gas (GHG) Emissions² Green House Gas emissions from agricultural operational
activities and domestic consumption.MODERATE
Risk Assessment Risk Management Strategies
² Planting tea, green manure/shade, native, cash crops and fruit plant species to increase tree canopy cover and carbon sequestrations.
² Implementing sustainable agriculture practices.² Planting drought resistant cultivars.² Rainwater harvesting in ponds to sustain the ground water
table, improve microclimate conditions and regulate ambient temperatures.
² Partner of establishment of Peak Ridge Forest Corridor to conserve the mountainous Leopards in Bogawanthalawa region.
² Extreme rainy weather may cause loss of top soil, soil fertility and soil nutrients.
² Steep terrain in the tea fields may accelerate the soil erosion intensity.
² Harvesting of timber in timber plantations will be a loss of canopy coverage of the land and accelerate the soil erosion intensity and increase the adverse effect of climate change due to change the micro climatic conditions of the area.
² Green House Gas emissions fuel used in transport and supervisory vehicles.
² Green House Gas emissions from electricity usage in factories, staff quarters, officers and other buildings.
² Measuring and monitoring GHG emissions at each operational site.
² Measuring and monitoring electricity and fuel consumption at each operational site.
² Planting trees and increasing tree canopy cover for increase carbon sequestration.
² Planting green manure and shade trees under five-year shade management plan of MPL.
² Comprehensive forestry planting programs parallel to the five-year forestry management plan of MPL.
² Inter planting Coffee as a shade tree and soil improvement technique.
² Composting of weeds.² Establishing stone and live terraces.² Maintaining the standard mana grass density of tea new
clearings.² Soil testing and rational application of dolomite and
chemical fertilizer.
13
- Annual Report 2020
Sustainability Report
Carbon Foot Print
Madulsima Plantations PLC is the first tea growing, manufacturing and selling under the Uva tea growing region category, offering uncompensated carbon certified teas from its state of art facilities. The company is being placing great emphasis on the environmental aspect considering the effects of global warming.
Our protocol of Green House Gas (GHG) Inventorying is IPPC 2018, Volume 7 and ISO 14064-1. scope was the cradle of plantation to warehouse gate. All emission sources were considered to cover scope 1,2 and 3 emission categories.
² Scope 1 (direct emissions) - Fossil fuel consumption in building and vehicles, agriculture land management activities² Scope 2 - Electricity and heat consumption in buildings ² Scope 3 - Other indirect emissions (third party transport)
Result of this exercise indicate total emission for fiscal year 2020 is 2015 tCO2e (metric tons of CO2 equivalent) taking all sources and sinks in to consideration. Total classic emission for the complete process is 0.014 tCO2e/Kg of Black Tea. Our next milestone to sink 100 g of CO2 equivalent, per production of 1 kg of made tea by 2025 through our Forestry planting programs and other land use management practices establishing solar power projects for factory roof tops and improving and increasing capacity of existing Hydro Power projects.
Water Footprint
Water Footprint of MPL tea estates is an indicator of both direct and indirect water use of the producer. Calculation process of water footprint of MPL estates done in to three main categories as per the CROPWAT 8.0 model developed by the Food and Agriculture Organization of the United Nation (FAO, 2003) and Water Foot Print Assessment manual 2011. Value of the water foot print of MPL estates around 1050.56 m3/ton/yr as per the assessment.
Water audits, awareness programmers and water conservation practices are being implemented to manage the water resources available in MPL tea estates.
Sustainable Soil Development
The company invest more than 5 Mn. per annum for sustainable soil development practices in our tea new clearings and other crops planting areas. Since the soil development has been declared under the MPL agricultural policy and organized as a thumb rule of productivity improvement in tea plantations.
Forestry and GIS and Research and Development Unit of MPL
Forestry and GIS unit of MPL established in year 2018 to streamline the forestry management and sustainability activities including timber harvesting, forestry replanting, land use mapping using GIS and remote sensing technology and implementing crop diversification projects.
Throughout past three years, this unit achieved remarkable improvements by addressing long and short-term sustainability goals to MPL. unit introduce some new technical initiatives such as GIS Mapping of forestry plantations, timber Inventory preparations, Tree tagging in census taking, preparation of technical reports pertaining to timber harvesting projects and establishment of timber nurseries with high quality seeds materials
Research and Developments
This unit mainly focus on to the knowledge gaps of estate sector under Forestry, Diversification, Agronomical and sustainability fields with the collaboration of Uva Wellassa University, Badulla Sri Lanka. Since 2018 R & D unit of MPL conducted and being conducting several research projects.
Forestry Plantations Management of MPL
Establishment of forestry plantations are another key activity of our sustainability green venture and we are conducting our forestry replanting projects in two main objectives known as production and protection.
Establishment of Production (Commercial) Forest Plantations is a continuous program parallel to the company annual Timber Harvesting Program. Currently company maintaining 376 Ha of Protected and 1470 Ha of Production Forest areas (Timber + Fuel-wood) on a sustainable basis. Majority of the low yielding tea lands, duly timber harvested blocks and other vacant areas plant with high quality Eucalyptus species under company forestry replanting project which is parallel to the Five-year Forestry Master Plan of MPL 2020 - 2025.
14

- Annual Report 2020
Sustainability Report
Forestry Plantation Management Activities
Commercial Forestry Plantations in
MPL Estates
Nursery Management of Imported Eucalyptus
Seed Varieties, Central Timber Nursery Venture and
Roeberry Estates.
Crop Diversification and Sustainable Land Utilization
Madulsima Plantations PLC already completed an assessment of identification of existing low yielding tea areas for diversification purposes. Company already planted Cinnamon, Pepper, Coffee, Cardamom and Mandarin as cash crops to improve the land productivity through diversification. In 2020 company diversified and improved the existing low yielding tea cultivated area of 5 Ha of land extent in to Coffee in Uvakellie and Roeberry Estates.
Also land improvement practices for establishment of cash crops such as pepper 2 Ha of low yielding tea area planted with low shade Glirecedia Plants to undertake pepper planting in the consecutive year. Currently Madulsima Plantations PLC is managing the following cash crops in the given extents.
Diversified Crop Extent (Ha.)
Coffee (Inter planted with Tea) 42.15
Cinnamon 7.70
Pepper 4.00
Mandarin 1.00
Cardamom 2.00
Total 56.60
For year 2021 Madulsima Plantations PLC planned to improve maintenance initiatives of their crop diversification areas to uplift the land utilization and generate additional income to the company cash flow.
15

- Annual Report 2020
Sustainability Report
Information Technology
Madulsima Plantation PLC has implemented efficient information technology system, with the extensive security controls to maintain the integrity and efficiency of our IT infrastructure and IT systems.
The Company has invested towards the full implementation of a plantation ERP system to supports value addition and decision making through improved data collection, data processing, financial reporting and operational information reporting.
Madulsima Plantations PLC investment in IT covers resources operated and managed centrally and those resources deployed on the various estates where accounts are prepared using a computerized accounting package. The company’s IT resources therefore comprises of these computerized accounting packages, utility software and networking facilities used at Head Office, including Internet and relevant devices are used to interconnect Head Office with estates.
In additions, introduced digital weighing system for MPL Tea Estates replacing manual weighing improving the accuracy and timely information through a secured IT system
Madulsima Plantation PLC has further invested in automating field weighing process through automated digital weighing scale and integrate them in to ERP system. This will drastically minimize the mistakes, frauds, data entry delays, and help to obtain accurate information real-time basis for a batter management decision making.
Having developed our own software over the years to meet our needs in management information we have realized the challenges faced in this rapidly growing field require specialized professional assistance and have sought the services of a reputed service provider in introducing their Software programs for our plantations.
Digital Scale implementation under MPL Estates
16
- Annual Report 2020
Social Environment
Retaining the educated plantation youth on our plantations is a major challenge and require new strategies such as outsourcing agricultural operations. Outsourcing which promotes a smallholder concept among plantation workers appears to be the way forward in combating the high wage costs and worker shortages. We have introduced outsourcing to Battawatte, Cocogalla, El Teb, Mahadowa and Roeberry Estates in the Madulsima region, where we are experiencing a severe shortage of workers.
We believe that long term value creation is directly linked to the sustainable development of our estates & community, as” passionate growers with sustainability at heart” we have made it the way of life at Madulsima to preserve the environment while combatting climate & uplifting the lives of our tea Harvesting community.
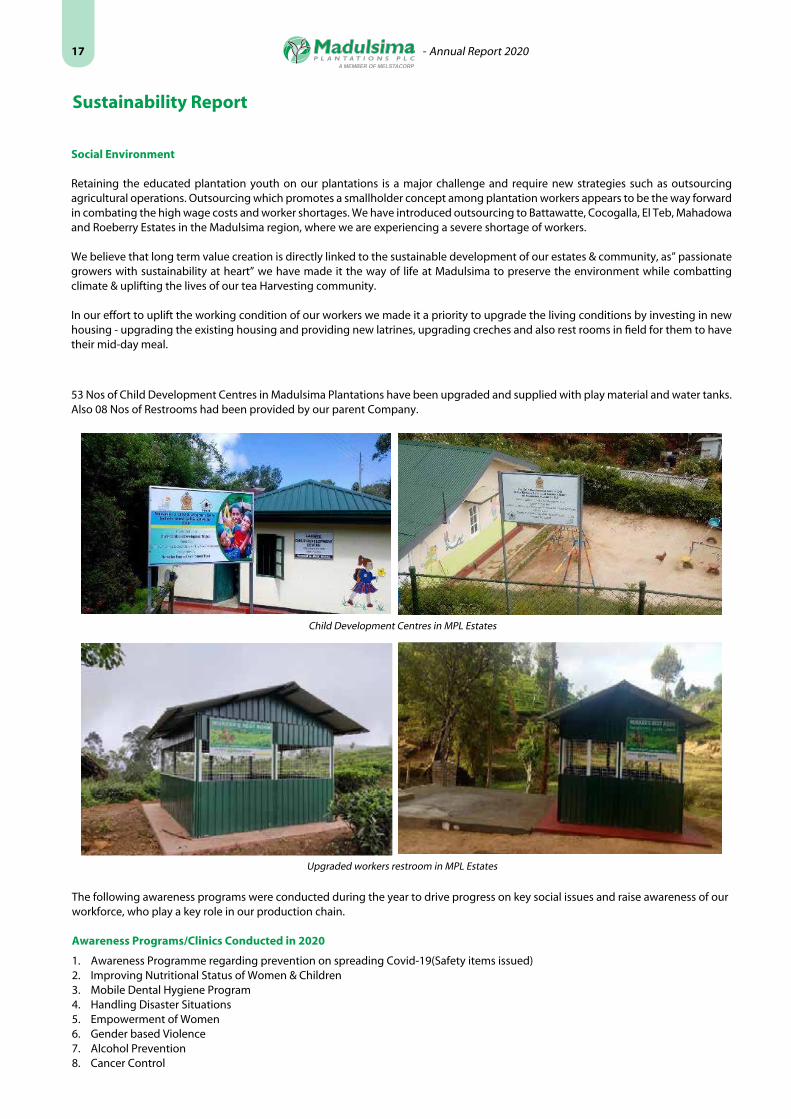
In our effort to uplift the working condition of our workers we made it a priority to upgrade the living conditions by investing in new housing - upgrading the existing housing and providing new latrines, upgrading creches and also rest rooms in field for them to have their mid-day meal.
Sustainability Report
53 Nos of Child Development Centres in Madulsima Plantations have been upgraded and supplied with play material and water tanks. Also 08 Nos of Restrooms had been provided by our parent Company.
The following awareness programs were conducted during the year to drive progress on key social issues and raise awareness of our workforce, who play a key role in our production chain.
Awareness Programs/Clinics Conducted in 2020
1. Awareness Programme regarding prevention on spreading Covid-19(Safety items issued)2. Improving Nutritional Status of Women & Children3. Mobile Dental Hygiene Program4. Handling Disaster Situations 5. Empowerment of Women6. Gender based Violence7. Alcohol Prevention8. Cancer Control
Child Development Centres in MPL Estates
Upgraded workers restroom in MPL Estates
17

- Annual Report 2020
Sustainability Report
Ongoing new housing Programme: -
Project Estate No. of Housings
Indian Housing Project - Stage II Battawatte 50 Houses
Kew 70 Houses
Green Gold Housing Project Kirkoswald 60 Houses
Venture 35 Houses
Owner Driven Housing Project (Completed) Venture 10 Houses
Indian Housing Project - Stage III Verellapatna 50 Houses
Mahadowa 50 Houses
Venture 50 Houses
Theresia 50 Houses
Kirkoswald 100 Houses
Kew 50 Houses
El- Teb 40 Houses
Galloola 50 Houses
Total 440
Social Welfare Activities
Social Welfare Activities in MPL Estates
18

- Annual Report 2020
Management Discussion & Analysis
Our Estate ProductionOur Estates recorded a combined production of 5.08 Mn Kg of Made Tea for the year 2020. This is in actual the highest recorded quantity of made tea since 2015 where 5.01 Mn kg was produced, keeping with that trend company estates yield per hectare also reflects a similar growth pattern where 1,077 kg made per hectare has been achieved . This is in fact an increase of 177 kg per hectare and year on year increase 19.67%.
The progress made in this connection is the direct results of the improvements in agriculture standards of our estates. We have continued to invest in developing our estates and our tea fields without cutting back on required agricultural inputs .
Market ImprovementsThe GSA improved significantly during the year propelled by the demand as production declined in the world market due to mostly Covid - 19 pandemic and adverse weather conditions. The company recorded a satisfactory Gross Sale Average(GSA) of 549.46 for the year compared to 474.11 in 2019.
Improved performance in 2020 a total 4.976 Mn were sold vis-à-vis a 4.168 Mn Kg during the corresponding period in 2019 ( an increase of 19.39%). The overall company’s Gross Sale Average increased by Rs. 75 and totaled a Rs 549.46 vis-à-vis Rs. 474.11( an increase of 15.82%) importantly the total revenue increased to Rs. 2.83 Bn. from a 2.00 Bn. in 2019, an increase 825 Mn. ( an increase of 41.11%)
Improved performance in 2020. A total 4.976 Mn. kilos were sold vis-à-vis a 4.168 Mn. kilos during the corresponding period in 2019 (an increase of 19.39%). The overall company’s gross sales average increased by Rs. 75 and totaled a Rs. 549.46 vis-à-vis Rs. 474.11 (an increase of 15.89%). Importantly, the total revenue increased to Rs. 2.83 Bn. from a Rs. 2.00 Bn. in 2019, an increase of Rs. 825 Mn. (41.11%).
The various grades of tea manufactured by Battawatte, El Teb, Mahadowa, Rathkella/Uva, Uvakellie, Kew, Kirkoswald, and Venture estates obtained all island top prices on 172 occasions at the Colombo auctions during the year 2020.
Production Made Tea (Kg.) (Mn.)
Gross Sale Average (GSA)
Sale Information
Description 2020 2019 Varience
Sold Quantity 4,976 4,168 808
GSA (Rs.Per Kilo) 549.46 474.11 75.35
Revenue ( Rs.000) 2,832,067 2,006,977 825,090
19

- Annual Report 2020
Management Discussion & Analysis
Key productivity indicator is the made-tea produced per every revenue labour utilized and in that context I am happy to report that whilst company shows a significant improvement over last year most estate too records positive growth.
Capital investmentThe capital expenditure incurred during the year was Rs. 136 Mn. of which Rs. 16 Mn. for upgrading the factory and machineries and Rs. 120 Mn. was invested on tea re-planting and crop diversification.
Strategic ProgressWe have made steady progress in its diversification strategy, which has been instrumental in mitigating financial losses during the current year. Older, less profitable “C” Category Tea lands have been repurposed for valuable Timber, Rubber, Cinnamon and Pepper cultivation. The business diversification strategy has enhanced value added revenue.
Sgd. M.A. FernandoChief Executive Officer11th June 2021
Productivity ImprovementsRevenue Labor Ratio (RLO)
Capital Investment Year 2020
20

- Annual Report 2020
Report of the Board Directors on the Affairs of the Company
The Director of Madulsima plantations PLC have pleasure in presenting their Annual Report together with the Audited Financial Statement of the Company for the year ended 31st December 2020
PRINCIPAL ACTIVITIESThe Company’s principal activities, which remained unchanged during the year were: cultivation, manufacture and marketing of tea, rubber, forestry products and other crops.The Company has 8 estates in Madulsima and 4 in the Bogawantalawa regions. The cultivated land consists of 3,408.10 ha under tea.
PARENT COMPANYThe company’s parent undertaking and controlling party is Melstacorp PLC, which is incorporated in Sri Lanka as a quoted public company.
GOING CONCERNPlease refer policy note 2.6.
REVIEW OF PERFORMANCEThe review of the Company’s performance during the year given in the Chairman’s Review and Management Discussion and Analysis in this Annual Report.
DEVELOPMENT AND DIVERSIFICATIONDevelopment and Diversification are covered in the Chairman’s Review in this Annual Report.
FINANCIAL STATEMENTSThe Financial Statements of the Company are given on pages 41 to 88 of this Annual Report.
AUDITORS’ REPORTThe Auditors’ Report on the financial Statements is given on page 35 to 40 of this Annual Report.
ACCOUNTING POLICIESThe Accounting Policies adopted in the preparation of the Financial Statements are given on pages 46 to 61 of this Annual Report.
REMUNERATION AND OTHER BENEFITS OF DIRECTORSThe directors did not receive any remuneration or other benefits during the accounting period.
DONATIONSThe company did not make any donations during the year
FINANCIAL RESULTS
2020Rs.’000
2019Rs.’000
Revenue 2,832,067 2,006,978
Loss Before Tax (132,077) (781,066)
Income Tax Benefit/(Expense) (68,818) 17,357
Loss After Tax (200,895) (763,709)
Retained Loss B.F. (4,693,769) (3,740,607)
Timber Reserve 3,594,121 3,376,701
Proposed Dividend - -
Retained Loss C.F. (5,077,361) (4,693,769)
FINANCIAL RATIOS
2020 2019
Debt Equity Ratio 3.94 5.31
Interest Cover 0.58 (1.26)
Quick Ratio 0.17 0.28
21

- Annual Report 2020
Report of the Board Directors on the Affairs of the Company
APPROPRIATION AND DIVIDENDThe directors have not recommended the payment of a dividend for the year ended 31st December 2020.
CAPITAL EXPENDITUREThe company incurred a capital expenditure of Rs.136 Mn. of which Rs.120 Mn. has been spent on field development and Rs. 16 Mn. was invested on upgrading the factory and machineries.
LAND HOLDING & INVESTMENT PROPERTIESThe extents, locations, valuations and the number of buildings of the Company’s land holdings and investment properties are as follows;
CAPITAL COMMITMENTS & CONTINGENTS LIABILITIESCapital commitments and contingents liabilities are disclosed in Notes 34 & 35 to the Financial Statements.
DIRECTORATEThe following Directors held office during the year under review.
Mr. D. H. S. Jayawardena - Chairman / Managing DirectorDr. N. M. Abdul Gaffar - Non Executive Director Mr. D. Hasitha S. Jayawardena - Non Executive Director Dr. A. Shakthevale - Independent Director Mr. D. S. K. Amarasekara - Independent Director
In terms of Articles 92 of the Articles of Association Mr. D. S. K. Amarasekara retires by rotation and being eligible offer himself for re-election.
DIRECTORS’ INTERESTS IN SHARESNo shares of the Company were held by the Directors of the Company, their spouses or dependents at the beginning and the end of the financial year.
INTEREST REGISTERDirectors’ interests in the Company are disclosed in Note 37 to the Financial statements and have been declared at a meeting of the Directors. The Directors have no direct or indirect interest in any other contracts or proposed contracts of the company.
SHAREHOLDERS AND INVESTOR INFORMATIONDistribution of Shareholdings as at 31st December 2020, Analysis Report of Shareholders, Market Statistics of Company’s share and the list of 25 major shareholders are given on pages 89 and 90 of this Annual Report. EVENT OCCURING AFTER THE DATE OF THE STATEMENT OF FINANCIAL POSITIONPlease refer Note 42 for events occurring after the date of the Statement of Financial Position, which would require disclosure in the Financial Statement.
ESTATES Location Extent (Ha.)Total Number
of BuildingsRe-Value
Rs’000
Battawatta Madulsima 12.14 552 50,669
Cocogalla Metigahatenne 3.89 303 49,419
El-Teb Passara 32.44 1,030 72,475
Galloola Madulsima 9.80 260 40,692
Mahadowa Madulsima 34.90 737 84,413
Roeberry Pitamaruawa 54.83 918 76,127
Uvakellie Madulsima 8.49 303 12,144
Verellapathana Madulsima 14.99 438 71,839
Kew Bogawantalawa 57.35 613 52,044
Kirkoswald Bogawantalawa 7.24 1,182 132,483
Theresia Bogawantalawa 32.45 639 51,740
Venture Norwood 28.94 572 77,131
Head office Badulla 0.04 2 6,361
TOTAL 297.50 7,549 777,543
22

- Annual Report 2020
MATTERS PERTAINING TO THE GOLDEN SHARE
1. The Golden Share shall only be held by the Secretary to the Treasury in his official capacity and not in his own name, for and on behalf of the Democratic Socialist Republic of Sri Lanka, or by a company in which the State of the Democratic Socialist Republic of Sri Lanka owns 99% or more of the issued share capital.
2. The Company shall obtain the written consent of the Golden Shareholders prior to sub-leasing, ceding or assigning its rights in parts or all of the lands set out in Section 3A (1) of the Memorandum of Association.
3. The Articles of the Company as originally framed may from time be altered by special resolution, provided that the concurrence of Golden Shareholder in writing shall be first obtained to amended the definition of the words Golden Share and Golden Shareholder and Articles 2A, 2B, 3(C), 3(C)(1), 3(C)(2), 25A, 127A, 127B, 127C and 128
4. The Golden Share may be converted into an ordinary share with the concurrence of the Golden Shareholder and the concurrence of a majority of the shareholders.
5. The Golden Shareholder shall be entitled to call upon the Board of Directors of the Company once in every three-month period if desired to meet with the Golden Shareholder and or his nominees, and the Directors if so called upon shall meet with the Golden Shareholder and or his nominees to discuss matters of the Company of interest to the State of the Democratic Socialist Republic of Sri Lanka.
6. The Golden Shareholder and or his nominee shall be entitled to inspect the books of accounts of the company after giving two weeks written notice to the company.
7. The Company shall submit to the Golden Shareholder, within 60 days of the end of each quarter, a quarterly report relating to the performance of the Company during the said quarter in a per-specified format agreed to by the Golden Shareholder and the Company.
8. The Company shall submit to the Golden Shareholder, within 90 days of the end of each Financial year, information relating to the Company in per-specified format agreed to by the Golden Shareholder and the Company.
AUDITORSThe Accounts of the year have been audited by M/s KPMG, Chartered Accountants. Fees paid to Auditors are disclosed on the page 64 in the Financial Statements.
As far as the Directors are aware, the auditors do not have any relationship (Other than that of an Auditors) with the company other than those disclosed above. The auditors do not have any interest in the company.
Sgd. Sgd. D.H.S. Jayawardena N.M. Abdul Gaffar Chairman/ Managing Director Non - Executive Director
Sgd. P. A. JayathungaSecretary11th June 2021
Report of the Board Directors on the Affairs of the Company
23

- Annual Report 2020
Audit Committee Report
Composition
With effect from 20th March 2020, the Audit Committee of the parent company comprising of the following commenced to function as the Audit Committee of the Company.
Chairman of the Committee – Mr. R. Seevaratnam, a fellow member of Chartered Accountants of England & Wales Dr. A. N. Balasuriya Mr. N. de S. Deva Aditya Mr. D. Hasitha S. Jayawardena
Meetings
The Board Audit Committee met five (5) times during the year. Mr. N. de S. Deva Aditya could not attend any meetings during the year, due to his engagements abroad. Nevertheless, Mr. Deva Aditya was kept informed of all the proceedings of the Audit Committee and his opinion was sought on important matters. The attendant of the other members at this meeting is as follows.
The Managing Director of Melstacorp PLC, Group Financial Controller and Head of Systems Control & Internal Audit also attend these meetings by invitation when needed.
Terms of Reference
The Board Audit Committee Charter approved and adopted by the Board clearly sets out the terms of reference governing the Audit Committee ensuring highest compliance with the Corporate Governance Rules applicable to Listed Companies in accordance with the Rules of the CSE and the Code of Best Practice on Corporate Governance.
Activities and Responsibilities
Financial Reporting
The Committee reviewed and discussed the financial reporting system adopted by the Company in the preparation of its quarterly and annual financial statements with the Management and the External Auditors to ensure reliability of the process and the consistency of the Accounting Policies adopted and its compliance with the Sri Lanka Accounting Standards and the provisions of the Companies Act No. 07 of 2007.
Internal Audit
The internal audit function of the company was carried out by the Company Internal Audit team with Group Audit Divisions. The Committee reviewed the effectiveness of the internal audit plan to ensure that it has been designed to provide reasonable assurance that the financial reporting system adopted by the Company can be relied upon in the preparation and presentation of the Financial statements. The Committee also reviewed the findings of the Internal Auditors and their recommendations together with the management responses and regularly followed up the progress of the implementation of such recommendations in order to enhance the overall control environment.
External Audit
The Audit Committee met with the External Auditors to discuss the cope an the audit strategy. The Committee also reviewed and discussed the Report of the Auditors and Management Letters issued by them to ensure that no limitations have been placed on their scope of work and conduct of the audit.
The Committee carried out an annual evaluation of the External Auditors to establish their independence and objectivity and also obtained a written declaration from the Auditors in this regard.
The Audit Committee has recommended to the Board of Directors that Messrs. KPMG reappointed as the External Auditors for the financial year ending 31st December 2021.
Compliance with Laws and Regulations
The Committee reviewed the quarterly compliance reports submitted by the relevant officers to ensure that the Company has complied with all statutory requirements.
Conclusion
The Audit Committee is satisfied that the Company’s accounting policies, operational controls and risk management processes provide reasonable assurance that the affairs of the Company are managed in accordance with Company polices and that the Company assets are properly accounted for and adequately safeguard.
Sgd. R. SeevaratnamChairman - Audit Committee11th June 2021
Mr. R. Seevaratnam 5/5
Dr. A. N. Balasuriya 5/5
Mr.D. Hasitha S. Jayawardena 5/5
24

- Annual Report 2020
Remuneration Committee Report
Related Party Transactions Review Committee Report
Composition
With effect from 20th March 2020, the Remuneration Committee of the parent company comprising of the following commenced to function as the Remuneration Committee of the Company.
Chairman of the Committee – Dr. A. N. Balasuriya Mr. N. de S. Deva Aditya Mr. D. Hasitha S. Jayawardena
Committee Meetings
The Committee meeting was not held during the year
Policy
The remuneration policy of the company is formulated to attract and retain high caliber personnel and motivate them to develop and implement the business strategy in order to optimize long term shareholder value creation.
The Committee is responsible for determining the compensation of the senior management and to lay down guidelines and parameters for the compensation structure of all management staff of the Company. In its decision making process necessary information and recommendations are obtained from the Board of Directors. An annual assessment is carried out and increments and incentives are awarded based on the rating/ranking of each individual.
Sgd.Dr. A.N.BalasuriyaChairman - Remuneration Committee11th June 2021
CompositionWith effect from 20th March 2020, the Related party Transactions Review Committee of the parent company comprising of the following commenced to function as the Related party Transactions Review Committee of the Company.
Chairman of the Committee - Mr. R. Seevaratnam Dr. A. N. Balasuriya Mr. D. Hasitha S. Jayawardena
The Related Party Transactions Review Committee is governed by the charter of Related Party Transactions Review Committee of Madulsima Plantations PLC and in terms of the code of Best Practice on related party transactions issued by the securities and exchange commission of Sri Lanka and the section 9 of the listing rules of the Colombo Stock Exchange.
Purpose of the CommitteeThe Committee’s key focus is to review all proposed Related Party Transactions prior to entering into or completion of the transaction according to the procedures laid down by Section 9 of the Listing Rules of the Colombo Stock Exchange.
MeetingsThe Board Related Party Committee met four (4) times during the year. The attendance of the other members at these meetings is as follows:
The Managing Director of Melstacorp PLC, Group Financial Controller and Head of Systems Control & Internal Audit also attend these meetings by invitation when needed.
The Committee has reviewed all related party transactions in respect of the financial year and communicated the activities of the committee to the board on a quarterly basis through circulating the minutes of the meeting of the committee to the Board of Directors.
Disclosures
During the year 2020, there were no non- recurrent related party transactions that exceeded the respective thresholds mentioned in the Listing Rules of the Colombo Stock Exchange. (Note 37.3)
Recurrent relating party transactions are disclosed in Note 37.1
Details of other related party transactions entered into by the Company during the above period is disclosed in Note 37 to 38 in the Financial Statements.
Sgd.R.SeevaratnamChairman - Related Party Transactions Review committee11th June 2021
Mr. R. Seevaratnam 4/4
Dr. A. N. Balasuriya 4/4
Mr.D. Hasitha S. Jayawardena 4/4
25

- Annual Report 2020
Corporate Governance Statement
The Board of Directors and its FunctionsThe Company is governed by its Board of Directors who direct, lead, and supervise the business and affairs of the Company on behalf of its shareholders. The Board consists of the Chairman/Managing Director, 02 Non-Executive Directors and 02 Independent Directors. The composition of the Company’s Board has been structured in keeping with principles of good governance and long term strategy and the names of the members of Board of Directors and their brief resumes are given on pages 9 & 10.
Although the two Independent Non-Executive Directors do not qualify under Rule 7.10.4 (g) of the Colombo Securities Exchange Listing Rules, the Board of Directors, taking account of all the circumstances, has determined that the two Directors are nevertheless independent as per the Rule 7.10.3 (b)
The Board meets as and when required to take all major decisions. Prior to each meeting the Directors are provided with all relevant management information and Board Papers are submitted in advance on new investments, capital projects, company performance and other issues which require specific Board approval.
The main functions of the Board:
Conducting the business and facilitating executive responsibility for management of the Company’s affairs,
Formulate short and long term strategies and monitor implementation,
Identify the principle risks of the business and ensure adequate risk management policies in place.
Institute effective internal control systems to safeguard the assets of the Company.
Ensure compliance with rules and regulations.
Approve the financial statements of the Company.
Approve the annual capital and operating budgets and review performance against budgets.
Determine and recommend interim and final dividends for the approval of shareholders.
Sanction all material contracts, acquisitions or disposal of assets and approve capital projects.
Madulsima Plantations PLC has designed its Corporate Governance policies and practices to ensure that the Company is focused on its responsibilities to its stakeholders and on creating long term shareholder value. The Company recognizes the interests of all its stakeholders including shareholders, employees, customers, suppliers, consumers and among the other communities in which it operates. The Company complies with the rules on Corporate Governance included in the Listing Rules of the Colombo Stock Exchange, and guided by the principles included in the Code of Best Practice on Corporate Governance issued jointly by the Securities and Exchange Commission of Sri Lanka and the Institute of Chartered Accountants of Sri Lanka.
Chief Executive Officer (CEO)
Stakeholders
Board of Directors
Corporate Management
Remuneration Committee
Audit Committee
Internal AuditExternal Audit
Related Party Transactions Review
Committee
26

- Annual Report 2020
Executive CommitteeThe Executive Committee, which consists of the Chairman/Managing Director and other Directors is delegated with the responsibility of monitoring the progress and implementing the policies of the Company. The Chief Executive Officer reports monthly on the progress of every estate and that of the Company to the Executive Committee.
The Board of Directors of Madulsima Plantations PLC has resolved to appoint the Audit Committee, Remuneration Committee and the Related Party Transactions Review Committees of the Parent Company, Melstacorp PLC to function as the Audit Committee, Remuneration Committee and the Related Party Transactions Review Committees of Madulsima Plantations PLC with effect from March 2020, in place of the existing Committees, as provided for under Sections 7.10.5 a.7.10.6a and 9.2.3 respectively of the Listing Rules of the Colombo Stock Exchange.
Audit CommitteeThe Audit Committee as described above assists the Board by the entity’s compliance with financial reporting requirements, Company’s internal controls, risk management and assessment of the independence and performance of the external auditors. The Company has an Internal Audit Division, which submits its reports on a regular basis to the Audit Committee. The guidelines for the Internal Audit Policy ensure that the assets of the Company are protected against any unauthorized sue or misappropriation, proper records are maintained, and reliable information is received. Audit Committee Report on page 24 describes the activities carried out during the financial year.
Remuneration CommitteeThe Remuneration Committee as described above makes recommendations to the Board on the Company’s framework of remunerating the Chairman/Managing Director. The Remuneration Committee Report appears on Page 25.
Related Party Transactions Review CommitteeThe composition of the “Related Party Transactions Review Committee” as described above. All Related Party Transactions except for transactions set out in Rule 9.5 of the CSE Listing Rules are reviewed by the Related Party Transactions Review Committee. The Related Party Transactions Review Committee Report appears on page 25.
Corporate Governance Statement
27

- Annual Report 2020
Corporate Governance Statement
Rule No Applicable Requirement Compliance
Status
Details
7.10.1.(a) Non Executive Directors
* At least one-third of the total number of Directors should be
Non-Executive Directors
Complied
Four out of Five Directors are Non-Executive Directors
7.10.2(a)
7.10.2(b)
Independent Directors
* Two or one third of Non-Executive Directors whichever is higher
should be independent
* Each Non-executive Director should submit a declaration of
independence/non-independence in the prescribed format
Complied
Complied
Two out of four Non-Executive Directors are Independent.Non-Executive Directors have submitted these declarations
7.10.3(a)
7.10.3(b)
7.10.3(c)
7.10.3(d)
Disclosure Relating to Directors
* Names of Independent Directors should be disclosed in the Annual
Report.
* The basis for the Board to determine a Director is independent, if
criteria specified for independence is not met
* A brief resume of each Director should be included in the Annual
Report and should include the Director’s areas of expertise
* Forthwith provide a brief resume of new Directors
appointed to the Board with details specified in
7.10.3(a) and (c) to the CSE
Complied
Complied
Complied
Complied
Refer Pages 9 -10
Refer Page 27
Refer Pages 9 -10
Not applicable
7.10.5
7.10.5(a)
7.10.5(b)
7.10.5(c)
Remuneration Committee
* A listed Company shall have a Remuneration Committee
Composition of Remuneration Committee
* Shall comprise Non-Executive Directors a majority of whom will be
independent?
Functions of Remuneration Committee
The Remuneration Committee shall recommend the remuneration
of the Chief Executive Officer.
* Disclosure in the Annual Report relating to Remuneration
Committee
The Annual Report should set out :
(a) Names of Directors comprising the Remuneration Committee
(b) Statement of Remuneration Policy
Complied
Complied
Complied
Complied
Refer page 25
7.10 &
7.10.6(a)
7.10.6(b)
7.106(c)
Complied
Complied
Complied
Complied
Complied
Complied
Complied
Refer page 24
7.13.1(a) * Minimum Public Holdings Not Complied Refer page 90
9.2 * Related Party Transaction Committee Complied Refer page 25
Levels of Compliance with the CSE Listing Rules on Corporate Governance are as follows :
Audit Committee
* The Company shall have an Audit Committee
Composition of Audit Committee
* Shall comprise of Non-Executive Directors, a majority of who will be independent?
* Non-Executive Director shall be appointed as the Chairman of the Committee
* Chief Executive Officer and Chief Financial Officer should attend Audit Committee Meetings
* The Chairman of the Audit Committee of one member should be a member of a professional Accounting Body
* Audit Committee Functions* Disclosure in the Annual Report relating to Audit Committee
28

- Annual Report 2020
Statement of Directors’ Responsibilities
The Directors select the appropriate accounting policies and apply them consistently, subject to any material departures being disclosed and explained. Further, the Directors are responsible for ensuring that the Company keeps enough accounting records to present, with reasonable accuracy, the financial position of the Company, in a manner that is easily understood by the shareholders. They also ensure that the Financial Statements comply with the Companies’ Act and the Sri Lanka Accounting Standards (SLFRS/LKAS). In addition, they are also responsible for taking reasonable steps to safeguard the assets of the Company by the establishment of appropriate systems of internal controls with a view to the prevention and detection of fraud and other irregularities.
The Directors prepare the Financial Statements and provide the External Auditors with every assistance to undertake whatever inspections, they consider to be appropriate for the purpose of enabling them to give their Audit Report in accordance with the Sri Lanka Auditing Standards. The Report of the External Auditors sets out their responsibility in respect of the Financial Statements.
The Directors confirm that, to the best of their knowledge and belief, they have discharged their responsibilities as set out in this statement.
By Order of the Board Of Directors
Sgd.P. A. JayathungaSecretary11th June 2021
29

- Annual Report 2020
Risk Management
Madulsima Plantations PLC has given due consideration to its risk management process in order to progress towards achievement of its goals and objectives. Risk management under the two forms of risks, namely Strategic and Operational, is regularly reviewed to ensure the related risks are minimized where the complete elimination is not possible. No business that does not face any risk can be found in the world. Irrespective of the nature and the size of the business, risk is inevitable in doing business. In broad, such risk factors can be two-fold, systematic risk and unsystematic risk.
Systematic risk is the risk which cannot be diversified or avoided. On the other hand, the unsystematic risk represents the risk unique to the respective business operation which in turn could be mitigated or avoided with risk management activities.
Directors have taken the initiative to identify the organizations major risks and introduced several controls and measures to mitigate the risks faced by the Company Internal and External Environment.
We perform Environmental analysis as well as SWOT analysis in regular intervals to identify probable risk factors and to understand opportunities and threats created by the external environment.
The Company has identified the importance of having a proactive approach in managing risk while maintaining a comprehensive system of internal controls to track and monitor the subsequent effects of each risks on Company’s performance. Following model is used to decide the risk management strategy for each and every risk identified by the management of MPPLC
Mitigating Strategies Implemented
The following are some of the major risk factors that the company is exposed to which carrying out its business and actions implemented to reduce or eliminate risk
Avoidance
HIGH
Transference
Reduction
Acceptance
LOW
LOW
HIG
H
Occ
ure
nce
Impact
Monitoring
IdentifyingRisk
Analysis ofRisk
Control
Execution Covering
Monitoring
RiskManagement
30

- Annual Report 2020
Risk Management
Risk Risk Assessment Mitigating Strategies Threat Probability
Business Risk Tea growing and manufacturing is our Principal line of business. The Company is susceptible to all risks associated with agriculture.
High
Operational Risk Weaknesses in internal control systems, human error and limitations, frauds, natural disasters, obsolete systems and practices, equipment s that are obstacles to business objectives.
Moderate
Environmental Risk Adverse and uncertain weather has a negative impact on agricultural produce.
High
² Regular monitoring of performance for appropriate remedial action
² Enforcing sustainable agricultural practices, Adopting practices recommended by the Tea Research Institute in infilling and replanting
² Crop diversification² Value addition² Focus on producing quality
tea.² Out sourcing agricultural
practices and adopting motivational alternatives to encourage plantation youth to remain on plantations
² Adopting effective internal control systems and periodic review.
² Variance analysis of budgetary provisions against actual performance.
² A monthly re-evaluation process where performance of each plantation is reviewed by Senior Executives of the Head Office.
² Appropriate advice’s conveyed to enforce a
high degree of situational awareness among the Planting Executives.
² Compliance audits and standardization procedures
² Obtain comprehensive insurance policies to cover operational risks.
² Monitoring weather patterns and their impact on crop harvests.
² Adoption of sustainable agricultural practices.
² Constant examination and review of soil nutrient contents
² Undertaking effective soil conservation measures.
² Reservation of forests and watersheds
31

- Annual Report 2020
Risk Management
Risk Risk Assessment Mitigating Strategies Threat Probability
Human Resource Low productivity, reduction in resident manpower, disruptions in achieving the targeted objectives.
²
Moderate
Product Quality Risk Inconsistency in quality of end products and its negative impact on prices and market share.
Moderate
Political Risk The impact of political intervention, major industrial relations issues, regulatory changes, ad hoc acquisitions of land etc are constraints faced by the Industry.
High
Interest Rate Risk Fiscal and monitory policy changes have a direct impact on liquidity and production costs .
Moderate
Technical & IT Risk Lack of accurate and timely information due to ineffective IT systems.
Moderate
Providing Welfare facilities and introducing participative housing projects to retain workers on plantations and improve their productivity .
² Train and encourage Plantation Executives to acquire communication skills in resolving labour disputes.
² Improve employee motivation, commitment, welfare, recognition and appreciation.
² Abide by the Collective Agreement entered into with the Trade Unions in the Company’s capacity
² Ensure safety and ethical standards in providing a quality consumable product.
² Upgrade manufacturing process and factories to cater to the fluctuating market demand.
² Monitor quality assurance measures
² Negotiating Collective Agreements with major Plantation Trade Unions. Maintaining a closer dialogue with the Trade Union Leaders
² Implementing human development policies
² Maintain cash flow and budgetary control systems
² Diversification² Capital development² Upgrading plant and
machinery² Maintenance of biological
assets in optimum condition to enhance productivity and turnover
² Strengthen software development with internal controls including IT security and confidentiality
² Implement a sound backup system in case of system failure
² Use Licensed Software
32

- Annual Report 2020
Risk Management
Risk Risk Assessment Mitigating Strategies Threat Probability
Investment Risk Adequate return on investment heavily depends on global economic trends.
Moderate
Inventory Liquidity is a major concern as the industry is cyclical with long gestation periods for returns.
Moderate
Risk ofCompetition
Competition from other major low cost producers .
Moderate
Company ReputationRisk
Maintaining loyalty and trustworthiness among stakeholders and compliance with statutory requirements.
²
Low
² Undertake proper evaluation and feasibility process
² Continue replanting and infilling with a prudent policy and environmentally viable clones
² Work closely with the TRI in developing an economic model to make replanting a viable investment.
² Produce stocks are monitored closely for speedy disposal.
² Input stock levels are controlled to avoid obsolescence and theft.
² High value input stocks such as fertilizer, firewood and packing materials are purchased on a need basis.
² Monitoring market trends and fluctuations in supply and demand closely.
² Regular check of tea samples to maximize market gains,
² Adopting appropriate remedial measures to ensure market leadership of quality marks.
² Rationalize manufacture during lean cropping months.
² Close executive supervision on quality of leaf harvested.
² Educating employees on the importance of their services.
Compliance with statutory requirements
² Compliance with the code of corporate governance by all employees.
² Protection of the environment and adoption of sustainability initiatives, health & food safety procedures.
33

- Annual Report 2020
Financial Highlights
Rs. 71 Mn.
Rs. 2,832 Mn.
Rs. (132)Mn.
Rs. 7,123 Mn.
Gross TurnoverRs. (Mn)
Gross Profit / (Loss)Rs. (Mn)
Total AssetsRs. (Mn)
Loss Before TaxationRs. (Mn)
(781)
(425)
(132)
(290)
(562)
71
34
- Annual Report 2020
Independent Auditor’s Report
To the Shareholders of Madulsima Plantations PLC
Report on the Audit of the Financial Statements
OpinionWe have audited the financial statements of Madulsima Plantations PLC (“the Company”), which comprise the statement of financial position as at 31st December 2020, and the statement of profit or loss and other comprehensive income, statement of changes in equity and statement of cash flows for the year then ended, and notes to the financial statements, including a summary of significant accounting policies and other explanatory information set out on pages 41 to 88.
In our opinion, the accompanying financial statements of the Company give a true and fair view of the financial position of the Company as at 31st December 2020, and of their financial performance and cash flows for the year then ended in accordance with Sri Lanka Accounting Standards.
Basis for OpinionWe conducted our audit in accordance with Sri Lanka Auditing Standards (SLAuSs). Our responsibilities under those standards are further described in the Auditor’s Responsibilities for the Audit of the Financial Statements section of our report. We are independent of the Company in accordance with the Code of Ethics issued by CA Sri Lanka (Code of Ethics), and we have fulfilled our other ethical responsibilities in accordance with the Code of Ethics. We believe that the audit evidence we have obtained is sufficient and appropriate to provide a basis for our opinion.
Key Audit MattersKey audit matters are those matters that, in our professional judgment, were of most significance in our audit of the company financial statements of the current period. These matters were addressed in the context of our audit of the company financial statements as a whole, and in forming our opinion thereon, and we do not provide a separate opinion on these matters.
01. Management assessment of the Company’s ability to continue as Going concern
Refer to the significant accounting policy in Note 2.6 to the financial statements
Risk Description Our Response
The Company has recorded a loss of LKR 201 Mn during the year ended 31st December 2020 and as of that date, accumulated losses amounted to LKR 5,077 Mn. Further, current liabilities exceeded its current assets by LKR 544 Mn as at the reporting date. The Company has loans and borrowings of LKR 547 Mn due within 12 months from 31st December 2020.
However, the directors of the Company are of the opinion that the going concern assumption is valid in preparation of financial statements, due to future growth potential of the Company and continuous financial support from ultimate parent company.
In assessing the Company’s ability to continue to operate as a going concern the Directors prepared a cash flow forecast which required the exercise of significant management judgments.
We identified the assessment of the Company’s ability to continue as a going concern as a key audit matter because the assessment of going concern is dependent upon certain management assumptions and judgements, in particular in relation to future cash flow forecast and the ability of the Company to obtain external financing, which may be subject to management bias.
Our audit procedures included,
² Walking through the business planning process and assessing the design, implementation and operating effectiveness of management’s key internal controls over the assessment of going concern, including the preparation of cash flow forecasts;
² Evaluating the performance of the Company and assessing the significant going concern indications.
² Assessing the appropriateness of key assumptions used in the cash flow projections and assessing the timing and mathematical accuracy of the projections.
² Assessing the Company’s ability to renew or refinance existing banking and other financing facilities upon maturity by performing a retrospective review of past renewal or roll-over history of banking and other financing facilities in prior years and inspecting loan agreements and underlying document for bank loans and other financing facilities borrowed and repaid after year end;
² Inspecting the letter of support received from the parent Company after evaluating their ability to provide the financial support in order to meet the liabilities of the Company as and when they fall due and payable.
² Assessing the adequacy of disclosures in the financial statements (Note 2.6) in relation to going concern.
35

- Annual Report 2020
Independent Auditor’s Report
02. Revaluation of Property, Plant and Equipment
Refer to the significant accounting policy in Note 3.2.2 and explanatory Note 14.10 to these financial statements.
The Company has revalued its Buildings, Plant & Machinery and Motor Vehicles and reported a net carrying value of Rs. 1,767 Mn and a revaluation gain of Rs. 767 Mn as at 31st December 2020
Risk Description Our Response
The Company has engaged an independent professional Valuer with appropriate expertise to determine the fair value of the Buildings, Plant & Machinery and Motor Vehicles in accordance with recognized industry standards. Above assets are valued at fair value using a cost approach and market approach. The valuations require the exercise of the significant judgement and key among these judgements are;
² The appropriate valuation methodology to apply based on the valuer’s assessment of specialized nature of the assets;
² Where replacement cost-based valuation methods are applied, what a modern equivalent asset cost would be;
² Assessment of condition of the existing assets and the age;² Assessment of remaining useful lives and depreciation
method;
We identified this as a key audit matter because of the magnitude of the amounts recognized in the financial statements and significant judgments and estimates involved in assessing the fair value of the Property, Plant and Equipment.
Our audit procedures included,
² Assessing the objectivity, independence, competence, qualifications and experience in the properties being valued by the external Valuer.
² Obtaining and inspecting the valuation reports prepared by independent valuer engaged by the Company.
² With the assistance of our own internal valuation specialists assessing the key assumptions applied and conclusions made in deriving the fair value of the Property, Plant and Equipment. In addition to that, we have assessed the valuation methodologies with reference to recognized industry standards.
² Discussions with the management and the external valuer in relation to the possible impact on the key assumptions and the resulting valuation due to COVID 19 pandemic.
² Assessing the adequacy of disclosures in relation to fair value of Property, Plant and Equipment in the financial statements in accordance with the relevant accounting standards.
36

- Annual Report 2020
Independent Auditor’s Report
03. Measurement of Consumable Biological Assets
Refer to the significant accounting policy in Note 3.2.3.6 and explanatory Note 16 to the financial statements
The Company has reported consumable biological assets carried at fair value less estimated cost to sell at harvest, amounting to LKR 3,784 Mn as at 31st December 2020.
Risk Description Our Response
The commercially cultivated timber trees on estates managed by the Company classify as consumable biological assets and are measured at each reporting date at fair value less estimated cost to sell at harvest. The valuation of consumable biological assets requires significant levels of judgments and technical expertise in selecting appropriate valuation models and assumptions. Changes in the key assumptions used such as discount rate, estimation of height/girth of trees used to arrive volume of timber and value per cubic meter used for the valuation of consumable biological assets, could have a material impact on the fair value gain or loss for the year and the carrying value of consumable biological assets as of the reporting date. Management engaged a subject matter expert who is an incorporated valuer and a member of The Institute of Valuers of Sri Lanka to perform an independent valuation of the consumer biological assets of the Company as at reporting date.
We considered measurement of consumer biological assets as a key audit matter due to the magnitude of the value and significant assumptions and judgments in determining the fair value which could be subject to error or potential management bias.
Our audit procedures included:
• Understanding the process of valuation and testing the design and operating effectiveness of the key controls relation to the valuation of consumable biological assets.
• Assessing the objectivity, independence, competence, qualifications and experience in the biological assets being valued by the subject matter expert.
• Obtaining estate wise census books of timber trees and comparing the number of timber trees recorded in the census book with the valuation report to ensure the completeness and accuracy of the data.
• Physically verification of the actual girth and height pertaining to a selected sample of trees during our estate visits, in order to ascertain the accuracy of the average girth and height used in the valuation report.
• Assessing the key assumptions and methodology used in the valuation, in particular the discount rate, estimated height and average market price by comparing with industry norms that are generally accepted in determining volume of timber.
• Assessing the mathematical accuracy of the consumable biological assets valuation.
• Assessing the adequacy of the disclosures in the Financial Statements, including the description and appropriateness of the inherent degree of subjectivity and the key assumptions.
37

- Annual Report 2020
04. Retirement Benefit Obligation
Refer to the significant accounting policy in Note 3.3.1.2 and explanatory Note 28 to the financial statements
The Company has recognized retirement benefit obligation of Rs. 993 Mn as at 31st December 2020.
Risk Description Our Response
The valuation of the Company’s retirement benefit obligation requires significant judgment and estimation to be applied across numerous assumptions, including salary increases and discount rate. Small changes in those assumptions could have a significant effect on the financial performance and financial position of the Company. Management engaged an independent actuary to assist them in the computation of retirement benefit obligation.
We considered the computation of the retirement benefit obligation to be a key audit matter due to the magnitude of the amounts recognized in the financial statements as well as estimation uncertainty involved in determining the amounts.
Our audit procedures included:
• Assessing the competency, objectivity and capabilities of the independent actuary engaged by the Company.
• Testing the samples of the employees’ details used in the computation to the human resource records.
• Assessing the other key assumptions used in the valuation, in particular the discount rate, inflation rate, mortality rates and future salary increases.
• Comparing the discount rate, inflation rate, mortality rate and future salary increases to market available data.
• Involving internal valuation specialist to verify the accuracy of the retirement benefit obligation.
• Assessing the adequacy of the disclosures in financial statements.
Independent Auditor’s Report
38

- Annual Report 2020
Independent Auditor’s Report
Other InformationManagement is responsible for the other information. The other information comprises the information included in the Annual Report, but does not include the Financial Statements and our Auditor’s Report thereon.
Our opinion on the financial statements does not cover the other information and we do not express any form of assurance conclusion thereon.
In connection with our audit of the Financial Statements, our responsibility is to read the other information and, in doing so, consider whether the other information is materially inconsistent with the Financial Statements or our knowledge obtained in the audit or otherwise appears to be materially misstated. If, based on the work we have performed, we conclude that there is a material misstatement of this other information, we are required to report that fact. We have nothing to report in this regard.
Responsibilities of Management and Those Charged with Governance for the Financial StatementsManagement is responsible for the preparation of financial statements that give a true and fair view in accordance with Sri Lanka Accounting Standards, and for such internal control as management determines is necessary to enable the preparation of financial statements that are free from material misstatement, whether due to fraud or error.
In preparing the financial statements, management is responsible for assessing the Company’s ability to continue as a going concern, disclosing, as applicable, matters related to going concern and using the going concern basis of accounting unless management either intends to liquidate the Company or to cease operations, or has no realistic alternative but to do so.
Those charged with governance are responsible for overseeing the Company’s financial reporting process.
Auditor’s Responsibilities for the Audit of the Financial StatementsOur objectives are to obtain reasonable assurance about whether the financial statements as a whole are free from material misstatement, whether due to fraud or error, and to issue an auditor’s report that includes our opinion. Reasonable assurance is a high level of assurance, but is not a guarantee that an audit conducted in accordance with SLAuSs will always detect a material misstatement when it exists. Misstatements can arise from fraud or error and are considered material if, individually or in the aggregate, they could reasonably be expected to influence the economic decisions of users taken on the basis of these financial statements.
As part of an audit in accordance with SLAuSs, we exercise professional judgment and maintain professional skepticism throughout the audit. We also:
² Identify and assess the risks of material misstatement of the financial statements, whether due to fraud or error, design and perform audit procedures responsive to those risks, and obtain audit evidence that is sufficient and appropriate to provide a basis for our opinion. The risk of not detecting a material misstatement resulting from fraud is higher than for one resulting from error, as fraud may involve collusion, forgery, intentional omissions, misrepresentations, or the override of internal control.
² Obtain an understanding of internal control relevant to the audit in order to design audit procedures that are appropriate in the circumstances, but not for the purpose of expressing an opinion on the effectiveness of the Company and the Company’s internal control.
² Evaluate the appropriateness of accounting policies used and the reasonableness of accounting estimates and related disclosures made by management.
² Conclude on the appropriateness of management’s use of the going concern basis of accounting and, based on the audit evidence obtained, whether a material uncertainty exists related to events or conditions that may cast significant doubt on the Company’s ability to continue as a going concern. If we conclude that a material uncertainty exists, we are required to draw attention in our auditor’s report to the related disclosures in the financial statements or, if such disclosures are inadequate, to modify our opinion. Our conclusions are based on the audit evidence obtained up to the date of our auditor’s report. However, future events or conditions may cause the Company to cease to continue as a going concern.
² Evaluate the overall presentation, structure and content of the financial statements, including the disclosures, and whether the financial statements represent the underlying transactions and events in a manner that achieves fair presentation.
² Obtain sufficient appropriate audit evidence regarding the financial information of the entities or business activities within the Company to express an opinion on the financial statements. We are responsible for the direction, supervision and performance of the audit. We remain solely responsible for our audit opinion.
39
- Annual Report 2020
We communicate with those charged with governance regarding, among other matters, the planned scope and timing of the audit and significant audit findings, including any significant deficiencies in internal control that we identify during our audit.
We also provide those charged with governance with a statement that we have complied with ethical requirements in accordance with the Code of Ethics regarding independence, and to communicate with them all relationships and other matters that may reasonably be thought to bear on our independence, and where applicable, related safeguards.
From the matters communicated with those charged with governance, we determine those matters that were of most significance in the audit of the financial statements of the current period and are therefore the key audit matters. We describe these matters in our auditor’s report unless law or regulation precludes public disclosure about the matter or when, in extremely rare circumstances, we determine that a matter should not be communicated in our report because the adverse consequences of doing so would reasonably be expected to outweigh the public interest benefits of such communication.
Report on Other Legal and Regulatory RequirementsAs required by section 163 (2) of the Companies Act No. 07 of 2007, we have obtained all the information and explanations that were required for the audit and, as far as appears from our examination, proper accounting records have been kept by the Company.
CA Sri Lanka membership number of the engagement partner responsible for signing this independent auditor’s report is 2618.
Sgd.CHARTERED ACCOUNTANTSColombo, Sri Lanka11th June 2021
Independent Auditor’s Report
40

- Annual Report 2020
Statement of Profit or Loss
For the year ended 31st December 2020 2019 Note Rs. Rs.
Revenue 6 2,832,067,026 2,006,977,497
Cost of Sales (2,761,276,128) (2,568,610,650)
Gross Profit/ (Loss) 70,790,898 (561,633,153)
Gain on Change in Fair Value of Biological Assets 18.1 220,038,560 180,434,197
Other Income 7 46,085,302 67,696,604
Administrative Expenses (150,805,564) (121,742,741)
Profit / (Loss) From Operation 186,109,196 (435,245,093)
Finance Income 66,889 48,175
Finance Expense (318,253,452) (345,869,302)
Net Finance Costs 8 (318,186,563) (345,821,127)
Loss Before Taxation 9 (132,077,367) (781,066,220)
Income Tax Benefit/ (Expense) 10 (68,817,665) 17,357,685
Loss for the year (200,895,032) (763,708,535)
Basic Loss Per Share 11 (1.19) (4.51)
Figures in brackets indicate deductions.
The accounting policies and notes on pages 46 through 88 form an integral part of the Financial Statements.
41

- Annual Report 2020
Statement of Other Comprehensive Income
For the Year ended 31st December Note 2020 2019 Rs. Rs.
Loss for the year (200,895,032) (763,708,535)
Items that will not be reclassified to profit or loss
Net Change in Fair Value Through OCI Financial Assets 17 (342,967) (240,829)Actuarial Gain / ( Loss) on Retirement Benefit Obligations 28 40,375,212 (38,617,751)Tax effect on Actuarial Gain / ( Loss) 29.1 (5,652,530) 5,406,485Revaluation Gain 14 767,309,540 -Tax effect on Revaluation Gain 29 (107,423,336) -
Total other comprehensive income /(expense) for the year (net of tax) 694,265,919 (33,452,095)
Total comprehensive income /(expense) for the year 493,370,887 (797,160,630)Figures in brackets indicate deductions.
The accounting policies and notes on pages 46 through 88 form an integral part of the Financial Statements.
42

- Annual Report 2020
Statement of Financial Position
As at 31st December 2020 2019 Note Rs. Rs.ASSETSNon-current AssetsRight to use of Land 12 106,589,973 108,925,714Immovable estate assets on financial lease (Other than bare land) 13 392,393,676 323,589,839Tangible assets other than biological assets 14 1,506,959,560 878,030,805Bearer Biological Assets 15 777,911,667 725,566,431Consumable Biological Assets 16 3,784,249,791 3,556,150,833Investment in Equity Securities-FVOCI 17 3,831,734 4,174,701Total Non -Current Assets 6,571,936,401 5,596,438,323
Current AssetsProduce of Bearer Biological Assets 18 4,671,767 2,053,351Inventories 19 363,449,825 253,557,197Trade and Other Receivables 20 155,520,829 145,547,714Amounts due from Related Companies 21 296,732 2,178,628Cash and Cash Equivalents 22 27,432,637 47,533,164Total Current Assets 551,371,790 450,870,054TOTAL ASSETS 7,123,308,191 6,047,308,377
EQUITY AND LIABILITIESCapital and ReservesStated Capital 23 1,624,760,670 1,624,760,670Revaluation Reserve 24 1,297,144,187 637,257,983Fair Value Through OCI Reserve 25 2,615,651 2,958,618Timber Reserve 26 3,594,121,047 3,376,700,903Retained Earnings (5,077,361,203) (4,693,768,709)Total Equity 1,441,280,352 947,909,465
Non-Current LiabilitiesInterest Bearing Loans & Borrowings 27 2,909,107,268 2,912,559,020Retirement Benefit Obligations 28 992,866,524 985,134,132Deferred Tax Liabilities 29 460,146,165 278,252,634Deferred Income 30 132,710,114 138,072,745Lease Liability to - SLSPC and JEDB 31 91,774,555 90,355,899Total Non-Current Liabilities 4,586,604,626 4,404,374,430
Current LiabilitiesTrade and Other Payables 32 384,326,892 271,392,134Lease Liability to - SLSPC and JEDB 31 569,187 455,933Amounts due to Related Companies 33 61,794,085 57,585,891Interest Bearing Loans & Borrowings 27 547,055,078 337,658,709Bank Overdraft 22 101,677,971 27,931,815Total Current Liabilities 1,095,423,213 695,024,482TOTAL LIABILITES 5,682,027,839 5,099,398,912Total Equity and Liabilities 7,123,308,191 6,047,308,377
NET ASSETS PER SHARE 8.50 5.59
Figures in brackets indicate deductions.The accounting policies and notes on pages 46 through 88 form an integral part of the Financial Statements. These Financial Statements have been prepared in compliance with the requirements of the Companies Act No 07 of 2007.
SgdD. M. Samantha K DissanayakeFinancial Controller
The Board of Directors is responsible for the preparation and fair presentation of these Financial Statements.Approved and signed for and on behalf of the Board of Directors of Madulsima Plantations PLC.
Sgd. Sgd.D. H. S. Jayawardena (Dr.) N. M. Abdul GaffarChairman / Managing Director Non-Executive- Director
Colombo.11th June 2021
43

- Annual Report 2020
Statement of Changes in Equity
For
the
year
en
ded
31
st D
ecem
ber
20
20
Fair
val
ue
Stat
ed
Rev
alu
atio
n
th
rou
gh
Ti
mb
er
Ret
ain
ed
Tota
l
No
te
Cap
ital
R
eser
ve
OC
I Res
erve
R
eser
ve
Earn
ing
s Eq
uit
y
R
s.
Rs.
R
s R
s.
Rs.
R
s.
Bal
ance
as
at 1
st J
anua
ry 2
019
(bef
ore
init
ial a
pp
licat
ion
of S
LFR
S 16
)
1,62
4,76
0,67
0 63
7,25
7,98
3 3,
199,
447
3,22
0,45
9,20
8 (3
,681
,605
,797
) 1,
804,
071,
511
Ad
just
men
t d
ue
to in
itia
l ap
plic
atio
n o
f SLF
RS 1
6 n
et o
f tax
- -
- -
(59,
001,
416)
(5
9,00
1,41
6)
Ad
just
ed b
alan
ce a
s at
1st
Jan
uar
y 2
01
9
1,
624,
760,
670
637,
257,
983
3,19
9,44
7 3,
220,
459,
208
(3,7
40,6
07,2
13)
1,74
5,07
0,09
5To
tal c
ompr
ehen
sive
inco
me
for t
he Y
ear
Loss
for t
he
year
- -
- -
(763
,708
,535
) (7
63,7
08,5
35)
Oth
er c
ompr
ehen
sive
inco
me/
(exp
ense
)N
et C
han
ge
in F
air V
alu
e Th
rou
gh
OC
I Fin
anci
al A
sset
s
-
- (2
40,8
29)
- -
(240
,829
)A
ctu
aria
l Lo
ss o
n R
etir
emen
t B
enefi
t O
blig
atio
n (n
et o
f tax
)
- -
- -
(33,
211,
266)
(3
3,21
1,26
6)
Tran
sfer
red
to
Tim
ber
Res
erve
26
-
- -
182,
438,
926
(182
,438
,926
) -
Tran
sfer
red
to
Ret
ain
ed e
arn
ing
26
-
- -
(26,
197,
231)
26
,197
,231
-
Bal
ance
as
at 3
1st
Dec
emb
er 2
01
9
1,
624,
760,
670
637,
257,
983
2,95
8,61
8 3,
376,
700,
903
(4,6
93,7
68,7
09)
947,
909,
465
Bal
ance
as
at 1
st J
anu
ary
20
20
1,62
4,76
0,67
0 63
7,25
7,98
3 2,
958,
618
3,37
6,70
0,90
3 (4
,693
,768
,709
) 94
7,90
9,46
5
Tota
l com
preh
ensi
ve in
com
e fo
r the
Yea
rLo
ss fo
r th
e ye
ar
-
- -
- (2
00,8
95,0
32)
(200
,895
,032
)
Oth
er c
ompr
ehen
sive
inco
me/
(exp
ense
)
- -
- -
- -
Act
uar
ial L
oss
on
Ret
irem
ent
Ben
efit
Ob
ligat
ion
(net
of t
ax)
-
- -
- 34
,722
,682
34
,722
,682
Net
Ch
ang
e in
Fai
r Val
ue
Thro
ug
h O
CI F
inan
cial
Ass
ets
- -
(342
,967
) -
- (3
42,9
67)
Reva
luat
ion
Gai
n (n
et o
f tax
)
- 65
9,88
6,20
4 -
- -
659,
886,
204
Tran
sfer
red
to
Tim
ber
Res
erve
26
-
- -
217,
420,
144
(217
,420
,144
) -
Bal
ance
as
at 3
1st
Dec
emb
er 2
02
0
1,
624,
760,
670
1,29
7,14
4,18
7 2,
615,
651
3,59
4,12
1,04
7 (5
,077
,361
,203
) 1,
441,
280,
352
Fig
ure
s in
bra
cket
s in
dic
ate
ded
uct
ion
s.
The
acco
un
tin
g p
olic
ies
and
no
tes
on
pag
es 4
6 th
rou
gh
88
form
an
inte
gra
l par
t o
f th
e Fi
nan
cial
Sta
tem
ents
.
44

- Annual Report 2020
Statement of Cash Flows
For the year ended 31st December 2020 2019 Note Rs. Rs.CASH FLOWS FROM OPERATING ACTIVITIESLoss Before Taxation (132,077,367) (781,066,220)
Adjustments for :Depreciation 12,13,14,15 102,463,686 92,612,381Interest Income 8 (66,889) (48,175)Interest Expenses 8 318,253,452 345,869,302Provision for Defined Benefit Plan Cost 28 147,654,685 147,681,391Gain on change in Fair Value of Biological Assets 18.1 (220,038,560) (180,434,197)Provision for bad debts 20.1 - 19,592,527ESC write off 9 8,763,401 -Dividend Income 7 (350,000) (752,500)Amortization of Grants 30 (5,362,631) (5,362,634)Provision for impairment of Immature Plantations 15.2 43,937,411 3,206,167Write off of slow moving inventories 9 3,811 -Profit on Sale of Timber 7 - (22,533,041)Operating Profit /(Loss) before Working Capital Changes 263,180,999 (381,234,999)
(Increase)/Decrease in Inventories (109,896,440) 52,440,804(Increase)/Decrease in Trade and Other Receivables (18,736,515) (14,118,751)(Increase)/Decrease in Due from Related Companies 1,881,896 (2,178,628)Increase/(Decrease) in Trade and Other Payable 112,934,758 (38,580,475)Increase/(Decrease) in Due to Related Companies 4,208,194 4,184,298Cash Generated from / (Used in) Operations 253,572,892 (379,487,751)
Interest Paid (56,139,532) (333,999,653)Income Tax / ESC Paid - (11,188,383)Gratuity Paid 28 (99,547,082) (126,113,534)
Net Cash Generated from / (Used in) Operating Activities 97,886,278 (850,789,321)CASH FLOWS FROM INVESTING ACTIVITIESAcquisition of Property, Plant and Equipment 14 (15,403,937) (149,445,312)Investments in Immature Plantations 15 (109,434,591) (81,891,351)Investment in Timber Plantations -Biological Assets 16 (10,678,814) (4,025,364)Interest Received 8 66,889 48,175Dividend Received 7 350,000 752,500Proceeds from Timber sales - 48,730,272
Net Cash Used in Investing Activities (135,100,453) (185,831,080)
CASH FLOWS FROM FINANCING ACTIVITIESPayments to Lease Creditor- JEDB/SLSPC 31 (12,629,285) (12,296,229)Loan Obtained 27 38,045,005 2,528,388,423Loans Repayment 27 (82,048,228) (1,393,486,710)Grants Received 30 - 44,457Net Cash (Used in) / Generated from Financing Activities (56,632,508) 1,122,649,941
Net Increase / (Decrease) in Cash and Cash Equivalents (93,846,683) 86,029,540
Cash and Cash Equivalents at the beginning of the Year 22 19,601,349 (66,428,191)Cash and Cash Equivalents at the end of the Year (74,245,334) 19,601,349
Figures in brackets indicate deductions.
The accounting policies and notes on pages 46 through 88 form an integral part of the Financial Statements.
45

- Annual Report 2020
Notes to the Financial StatementsFor the year ended 31st December 2020
1. REPORTING ENTITY Madulsima Plantations PLC is a Public Limited Liability Company incorporated and domiciled in Sri Lanka, under the
Companies Act No. 17 of 1982 in terms of the provisions of the Conversion of Public Corporations or Government-Owned Business Undertaking into Public Companies Act No. 23 of 1987 and re-registered under the Companies Act No. 7 of 2007. The registered office of the Company is located at No 833, Sirimavo Bandaranayaka Mawatha, Colombo 14 and Plantations are situated in the Madulsima and Bogawantalawa regions.
The Financial Statements of Company comprise with the Statement of Profit or Loss and Other Comprehensive Income,
Statement of Financial Position, Statement of Changes in Equity, Statement of Cash Flows together with Accounting Policies and Notes to Financial Statements.
1.1 Principal activities and nature of operations The Company primarily is involved in the cultivation, manufacturing and sale of Black Tea.
1.2 Immediate and Ultimate Parent Enterprises The Company’s immediate parent Company is Melstacorp PLC and the ultimate parent is Milford Exports (Ceylon) (Pvt)
Limited which are incorporated in Sri Lanka.
2. BASIS OF PREPARATION
2.1 Statement of Compliance The Financial Statements of the Company comprise the Statement of Profit or Loss and Other Comprehensive Income,
Statement of Financial Position, Statement of Changes in Equity and Statement of Cash Flows, together with the notes to the Financial Statements and Significant Accounting Policies which have been prepared in accordance with the Sri Lanka Accounting Standards (SLFRSs/LKASs) promulgated by the Institute of Chartered Accountants of Sri Lanka (CA Sri Lanka) and with the requirements of the Companies Act No. 07 of 2007 and Sri Lanka Accounting and Auditing Standards Act No 15 of 1995. These Financial Statements, except information on Cash Flows, have been prepared following the accrual basis of accounting.
2.2 Approval of Financial Statements by Directors The Financial Statements of the Company were authorised for issue by the Board of Directors on 11th June 2021.
2.3 Basis of Measurement The Financial Statements have been prepared on historical cost basis except for the following material items in the Statement
of Financial Position: - Building, Plant & Machinery and Motor Vehicles have been revalued (LKAS 16) - Property, Plant and Equipment) - Note 13 & 14 - Consumable Mature Biological Assets are measured at fair value less costs to sell per - (LKAS 41 - Agriculture) - Note 16 - Liability for Retirement Benefit Obligations is recognised as the present value of the defined benefit obligation based on
actuarial valuation per (LKAS 19 - Employee Benefits) - Note 28 - Agriculture produce harvested from biological assets are measured at fair value per (LKAS 41 - Agriculture) - Note 18 - Investment in Equity Securities are measured at fair value per (SLFRS 09 - Financial Instruments) - Note 17
2.4 Functional and Presentation Currency The Financial Statements are presented in Sri Lankan Rupees which is the Company’s functional currency. All financial
information presented in Sri Lankan Rupees has been rounded to the nearest rupee, unless stated otherwise.
2.5 Materiality and Aggregation Each material class of similar items is presented separately in the Financial Statements. Items of dissimilar nature or function
are presented separately unless they are immaterial as permitted by LKAS 1: Presentation of Financial Statements.
Financial assets and financial liabilities are offset and the net amount report in the statement of financial position, only when there is a legally enforceable right to offset the recognized amounts and there is an intention to settle on net basis, or to realise the assets and settle the liability simultaneously.
2.6 Going Concern The Board of Directors have made an assessment of the Company’s ability to continue as a going concern and they do not
intend either to liquidate or to cease trading.
The Company has incurred a loss of LKR 201 Mn. during the year ended 31st December 2020 (2019 - Rs. 764 Mn.) and as of that date, accumulated losses amounted to LKR 5,077 Mn. (2019 - Rs. 4,694 Mn.). Further, the Company’s current liabilities exceeded its current assets by LKR 544 Mn. (2019 - Rs. 244 Mn.) as at the reporting date. The current liabilities of the Company includes loans and borrowings amounting to LKR 547 Mn. which are due within 12 months from 31st December 2020. (2019 - Rs. 338 Mn.)
46

- Annual Report 2020
Notes to the Financial StatementsFor the year ended 31st December 2020
Notwithstanding this, the Financial Statements has been prepared on the going concern basis because the board of directors have assessed the sources of funding available to the Company, and firmly believe that the Company can continue as a going concern for the foreseeable future.
The Parent Company has funded the Company for its financial needs. Details are as follows.
2017 Rs. 318,563,955 2018 Rs. 969,205,401 2019 Rs. 1,103,067,402 2020 Rs. 38,045,004
In preparing these financial statements, the management has assessed the existing and anticipated effect of COVID-19 on the Company and appropriateness of the use of the going concern basis. Refer Note 43 to the Financial Statements for impact of COVID-19 on the Financial Statements of the Company.
2.7 Use of Estimates and Judgements The preparation of Financial Statements in conformity with Sri Lanka Accounting Standards (SLFRSs/LKASs) requires
management to make judgements, estimates and assumptions that affect the application of accounting policies and the reported amounts of assets, liabilities income and expenses.
Judgements and estimates are based on historical experience and other factors, including expectations that are believed to be reasonable under the circumstances. Hence actual experience and results may differ from these judgements and estimates.
Estimates and underlying assumptions are reviewed on an ongoing basis. Revisions to accounting estimates are recognised in the period in which the estimates are revised and in any future periods affected.
Information about critical judgements in applying accounting policies that have the most significant effect on the amounts recognised in the Financial Statements is included in the following notes.
Note 14 -Tangible Assets other than Biological Assets
Information about assumptions and estimation uncertainties that have a significant risk of resulting in a material adjustment within the next financial year is included in the following notes:
Note 16 - Consumable Biological AssetsNote 28 - Retirement Benefit ObligationNote 29 - Deferred Tax LiabilityNote 17 - Investment in Equity SecuritiesNote 18 - Agriculture Produce harvested from Biological AssetsNote 13 & 14 - Revalued Buildings, Plant & Machinery and Motor VehiclesNote 43 - Impact of COVID 19 on Financial Statement
2.8 Determination of fair value ‘Fair value’ is the price that would be received to sell an asset or paid to transfer a liability in an orderly transaction between
market participants at the measurement date in the principal or, in its absence, the most advantageous market to which the Company has access at that date. The fair value of a liability reflects its non-performance risk. Several of the Company’s accounting policies and disclosures require the determination of fair value, for both financial and non-financial assets and liabilities.
When measuring fair value of an asset or liability, the Company uses observable market data as far as possible. Fair values are categorised into different levels in a fair value hierarchy based on the inputs used in the valuation techniques.
Level 1 inputs are unadjusted quoted prices in active markets for identical assets or liabilities. A market is regarded as ‘active’ if transactions for the asset or liability take place with sufficient frequency and volume to provide pricing information on an ongoing basis.
Level 2 inputs are inputs other than quoted prices included within Level 1 that are observable for the asset or liability either directly (i.e. as prices) or indirectly (i.e. derived from prices).
Level 3 inputs are inputs that are not based on observable market data (unobservable inputs).
If inputs used to measure the fair value of an asset or liability fall into different levels of the fair value hierarchy, then the fair value measurement is categorised in its entirety in the same level of the fair value hierarchy as the lowest level input that is significant to the entire measurement.
47

- Annual Report 2020
Fair values have been determined for measurement and disclosure purposes based on the following methods. Where applicable further information about the assumptions made in determining fair value is disclosed in the notes specific to that asset or liability.
Fair value of non-financial assets The fair value used by the Company in the measurement of non-financial assets is based on the presumption that the
transaction to sell the asset or transfer the liability takes place either in the principal market for the asset or liability, or in the absence of a principal market, in the most advantageous market that is accessible by the Company for the asset or liability.
The fair value of an asset or a liability is measured using the assumptions that market participants would act in their economic best interest when pricing the asset or liability.
A fair value measurement of a non-financial asset takes into account a market participant’s ability to generate economic benefits by using the asset in its highest and best use or by selling it to another market participant that would use the asset in its highest and best use.
The Company uses valuation techniques that are appropriate in the circumstances and for which sufficient data are available to measure fair value, maximising the use of relevant observable inputs and minimising the use of unobservable inputs.
3. SIGNIFICANT ACCOUNTING POLICIES Except for the changes mentioned, all the accounting policies set out below have been applied by the Company consistently
to all periods presented in these Financial Statements
3.1 Foreign Currency
3.1.1 Foreign Currency Transactions Transactions in currencies other than the entity’s functional currency (foreign currencies) are recorded in the functional
currencies using the exchange rates prevailing at the dates of the transactions.
At each reporting date, monetary items denominated in foreign currencies are translated at the closing rate. Non-monetary items measured at fair value are translated at the rates prevailing on the date when the fair value was determined.
Non-monetary items measured at historical cost are translated at the rates prevailing on the date of transaction.
Exchange differences arising on the settlement of monetary items and on the translation of monetary items are included in profit or loss for the period.
Exchange differences arising on the translation of non-monetary items carried at fair value are included in profit or loss for the period except for the differences which are recognised in other comprehensive income.
3.2 Assets and the bases of their valuation Assets classified as current assets in the Statement of Financial Position are cash, bank balances and those which are expected
to be realised in cash, during the normal operating cycle of the Company’s business, or within one year from the reporting date, whichever is shorter. Assets other than current assets are those which the Company intends to hold beyond a period of one year from the reporting date.
3.2.1 Right to use of Asset At inception of a contract, the Company assesses whether a contract is, or contains, a lease. A contract is, or contains, a lease
if the contract conveys the right to control the use of an identified asset for a period of time in exchange for consideration. To assess whether a contract conveys the right to control the use of an identified asset, the Company uses the definition of a lease in SLFRS 16 this definition is applicable for agreements entered after 1st January 2019.
3.2.1.1 As a lessee At commencement or on modification of a contract that contains a lease component, the Company allocates the consideration
in the contract to each lease component on the basis of its relative stand-alone prices. However, for the leases of property the Company has elected not to separate non-lease components and account for the lease and non-lease components as a single lease component.
The Company recognises a right-of-use asset and a lease liability at the lease commencement date. The right-of-use asset is initially measured at cost, which comprises the initial amount of the lease liability adjusted for any lease payments made at or before the commencement date, plus any initial direct costs incurred and an estimate of costs to dismantle and remove the underlying asset or to restore the underlying asset or the site on which it is located, less any lease incentives received.
Notes to the Financial StatementsFor the year ended 31st December 2020
48

- Annual Report 2020
The right-of-use asset is subsequently depreciated using the straight-line method from the commencement date to the end of the lease term, unless the lease transfers ownership of the underlying asset to the Company by the end of the lease term or the cost of the right-of-use asset reflects that the Company will exercise a purchase option. In that case the right-of-use asset will be depreciated over the useful life of the underlying asset, which is determined on the same basis as those of property and equipment. In addition, the right-of-use asset is periodically reduced by impairment losses, if any, and adjusted for certain remeasurements of the lease liability.
The lease liability is initially measured at the present value of the lease payments that are not paid at the commencement date, discounted using the interest rate implicit in the lease or, if that rate cannot be readily determined, and the Company’s incremental borrowing rate. Generally, the Company uses its incremental borrowing rate as the discount rate.
The Company determines its incremental borrowing rate by obtaining interest rates from various external financing sources and makes certain adjustments to reflect the terms of the lease and type of the asset leased.
Lease payments included in the measurement of the lease liability comprise the following:
● fixed payments, including in-substance fixed payments; ● variable lease payments that depend on an index or a rate, initially measured using the index or rate as at the
commencement date; ● amounts expected to be payable under a residual value guarantee; and ● the exercise price under a purchase option that the Company is reasonably certain to exercise, lease payments in an
optional renewal period if the Company is reasonably certain to exercise an extension option, and penalties for early termination of a lease unless the Company is reasonably certain not to terminate early.
The lease liability is measured at amortised cost using the effective interest method. It is remeasured when there is a change in future lease payments arising from a change in an index or rate, if there is a change in the Company’s estimate of the amount expected to be payable under a residual value guarantee, if the Company changes its assessment of whether it will exercise a purchase, extension or termination option or if there is a revised in-substance fixed lease payment.
When the lease liability is remeasured in this way, a corresponding adjustment is made to the carrying amount of the right-of-use asset, or is recorded in profit or loss if the carrying amount of the right-of-use asset has been reduced to zero.
The Company presents right-of-use assets that do not meet the definition of investment property in ‘right to use of land’ and lease liabilities in ‘lease liability’ in the statement of financial position.
Short-term leases and leases of low-value assets The Company has elected not to recognise right-of-use assets and lease liabilities for leases of low-value assets and short-
term leases, including IT equipment. The Company recognises the lease payments associated with these leases as an expense on a straight-line basis over the lease term.
3.2.2 Property, Plant and Equipment
3.2.2.1 Recognition and Measurement Property, plant and equipment are stated at cost less accumulated depreciation and accumulated impairment losses, except
for Bare Land on Lease which is stated at revalued amount on 22nd June 1992 less subsequent accumulated depreciation and accumulated Impairment losses.
When parts of an item of property, plant and equipment have different useful lives, they are accounted for as separate items (major components) of property, plant and equipment.
3.2.2.2 Owned Assets The cost of property, plant and equipment includes expenditures that are directly attributable to the acquisition of the
asset. Such costs include the cost of replacing part of the property, plant and equipment and borrowing costs for long-term construction projects if the recognition criteria are met. The cost of self-constructed assets includes the cost of materials and direct labor, any other cost directly attributable to bringing the asset to a working condition for its intended use, and the costs of dismantling and removing the items and restoring the site on which they are located. Purchased software that is integral to the functionality of the related equipment is capitalized as a part of that equipment.
Notes to the Financial StatementsFor the year ended 31st December 2020
49

- Annual Report 2020
When significant parts of property, plant and equipment are required to be replaced at intervals, the entity recognizes such parts as individual assets with specific useful lives and depreciation, respectively. Likewise, when a major inspection is preformed, its cost is recognized in the carrying amount of the plant and equipment as a replacement if the recognition criteria are satisfied. All other repair and maintenance costs are recognized in the statement of profit or loss as incurred. The present value of the expected cost for the decommissioning of the asset after its use is included in the cost of the respective asset if the recognition criteria for a provision are met.
Buildings, Plant & Machinery and Motor Vehicles are measured at fair value less accumulated depreciation on such assets and impairment charged subsequent to the date of the revaluation. Valuations are performed with sufficient frequency to ensure that the fair value of a revalued asset does not differ materially from its carrying amount and is undertaken by professionally qualified valuer for every five year. Other property, plant and equipment are carried at cost less accumulated depreciation and accumulated impairment losses.
Capital work in progress is transferred to the respective asset accounts at the time, the asset is ready for utilization or at the time the asset is commissioned.
3.2.2.3 Land Improvement Cost Permanent land development costs are the costs incurred in making major infrastructure development and building new
access roads on leasehold lands.
These costs have been capitalised and amortised over the remaining lease period.
Permanent impairment to land development costs are charged to the profit or loss statement in full or reduced to the net carrying amounts of such assets in the year of occurrence after ascertaining the loss.
3.2.2.4 Capital Work-in-Progress The cost of capital work-in-progress is the cost of purchase or construction together with any related expenses thereon.
Capital work-in-progress is transferred to the respective asset accounts at the time of first utilization or at the time the asset is commissioned.
3.2.2.5 Subsequent Cost The cost of replacing part of an item of property, plant and equipment is recognised in the carrying amount of the item if it is
probable that the future economic benefits embodied within the part will flow to the Company and its cost can be measured reliably. The carrying amount of the replaced part is derecognised.
The costs of the day-to-day servicing of property, plant and equipment are recognised in the Statement of Profit or Loss and Other Comprehensive Income as incurred.
3.2.2.6 Borrowing Costs Borrowing costs that are directly attributable to acquisition, construction or production of a qualifying asset which takes a
substantial period of time to get ready for its intended use or sale, are capitalised as a part of the asset. The amounts of the borrowing costs which are eligible for capitalisation are determined in accordance with LKAS 23 - Borrowing Costs.
Borrowing costs that are not capitalised are recognised as expenses in the period in which they are incurred and charged to the Statement of Profit or Loss and Other Comprehensive Income.
3.2.2.7 Depreciation and Amortisation Depreciation is calculated over the depreciable amount, which is the cost of an asset, or other amount substituted for cost,
less its residual value. Depreciation is recognised in profit or loss on a straight-line basis over the estimated useful life of each part of an item of property, plant and equipment, since this most closely reflects the expected pattern of consumption of the future economic benefits embodied in the asset. Leased assets are depreciated over the shorter of the lease term and their useful lives unless it is reasonably certain that the Company will obtain ownership by the end of the lease term. Land is not depreciated.
Notes to the Financial StatementsFor the year ended 31st December 2020
50

- Annual Report 2020
Asset Category No of Years Rate %
Improvements to Building 40 2.5
Land Improvement 40 2.5
Plant & Machinery 15 to 20 6.66/ 5
Motor Vehicles 5 20
Equipment 8 12.5
Computer 4 25
Computer Software 3 33
Furniture & Fittings 10 10
Water Projects & Sanitation 20 5
Immovable Assets on Finance Lease from JEDB/ SLSPC are being amortized in equal amounts over the following periods:
Asset Category No of Years Rate %
Bare Land 53 1.89
Mature Plantations - Tea 30 3.33
Buildings 25 4
Plant & Machinery 15 6.67
Land Development Cost 53 1.89
Water Supply Scheme 30 3.33
Mini Hydro Scheme 10 10
Notes to the Financial StatementsFor the year ended 31st December 2020
Depreciation of an asset begins when it is available for use, whereas depreciation of an asset ceases at the earlier of the date that the asset is classified as held for sale and the date that the asset is derecognised.
Depreciation method, useful lives and residual values are reviewed at each financial year end and adjusted if appropriate.
3.2.2.8 Derecognition The carrying amount of an item of property, plant and equipment is derecognised on disposal or when no future economic
benefits are expected from its use or disposal.
Gains and losses on disposal of an item of property, plant and equipment are determined by comparing the proceeds from disposal with the carrying amount of property, plant and equipment, and are recognised net within other income in profit or loss and the revalued assets are disposed, the amount included in revaluation surplus reserve is transferred to retained earnings.
3.2.3 Biological Assets Biological assets are classified as Bearer Biological assets and Consumable Biological assets. Bearer Biological assets include
tea and rubber trees, those that are not intended to be sold or harvested, but are however used to grow for harvesting agricultural produce from such Biological assets. Consumable Biological assets include managed timber trees (those that are to be sold as Biological assets).
Biological assets are further classified into Mature Biological assets and Immature Biological assets. Mature Biological assets are those that have attained harvestable specifications or are able to sustain regular harvests. Immature Biological assets are those that have not yet attained harvestable specifications.
3.2.3.1 Recognition and Measurement The entity recognises the Biological assets when, and only when, the entity controls the assets as a result of past events, it is
probable that future economic benefits associated with the assets will flow to the entity and the fair value or cost of the assets can be measured reliably.
The Bearer Biological assets are measured at cost less accumulated depreciation and accumulated impairment losses, if any, in terms of LKAS 16 - Property, Plant and Equipment.
The estimated useful lives for the current and comparative periods are as follows:
51
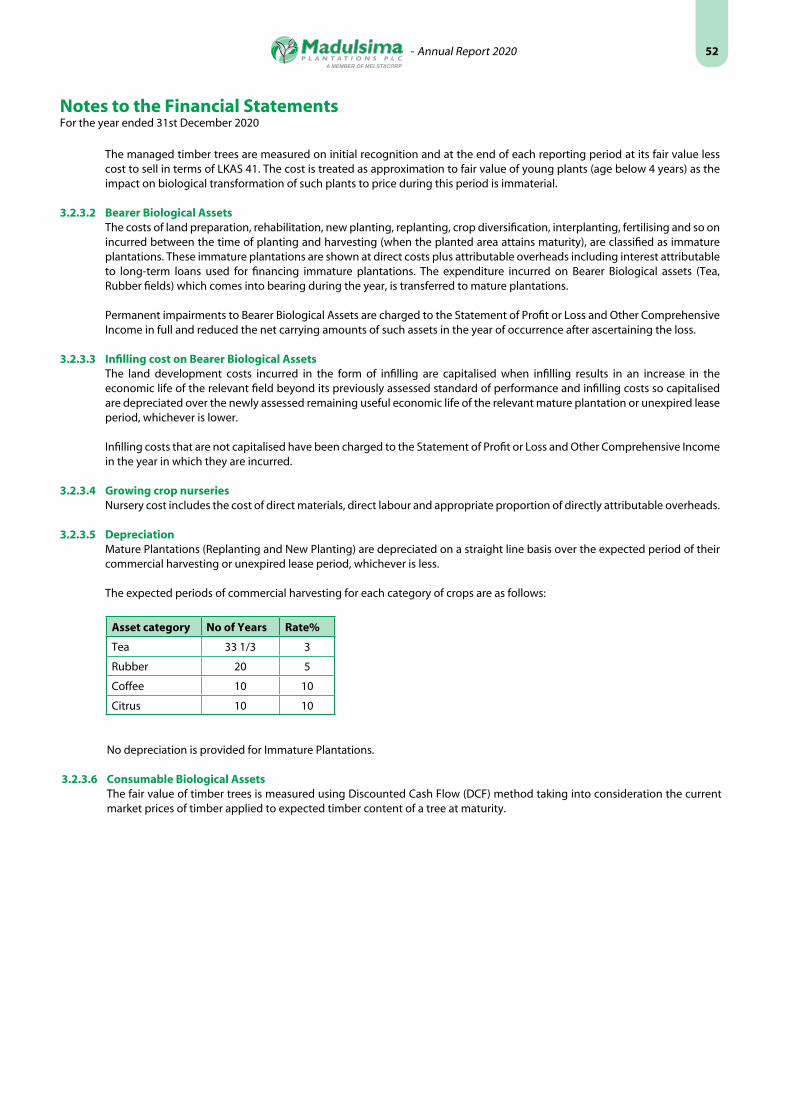
- Annual Report 2020
Notes to the Financial StatementsFor the year ended 31st December 2020
The managed timber trees are measured on initial recognition and at the end of each reporting period at its fair value less cost to sell in terms of LKAS 41. The cost is treated as approximation to fair value of young plants (age below 4 years) as the impact on biological transformation of such plants to price during this period is immaterial.
3.2.3.2 Bearer Biological Assets The costs of land preparation, rehabilitation, new planting, replanting, crop diversification, interplanting, fertilising and so on
incurred between the time of planting and harvesting (when the planted area attains maturity), are classified as immature plantations. These immature plantations are shown at direct costs plus attributable overheads including interest attributable to long-term loans used for financing immature plantations. The expenditure incurred on Bearer Biological assets (Tea, Rubber fields) which comes into bearing during the year, is transferred to mature plantations.
Permanent impairments to Bearer Biological Assets are charged to the Statement of Profit or Loss and Other Comprehensive Income in full and reduced the net carrying amounts of such assets in the year of occurrence after ascertaining the loss.
3.2.3.3 Infilling cost on Bearer Biological Assets The land development costs incurred in the form of infilling are capitalised when infilling results in an increase in the
economic life of the relevant field beyond its previously assessed standard of performance and infilling costs so capitalised are depreciated over the newly assessed remaining useful economic life of the relevant mature plantation or unexpired lease period, whichever is lower.
Infilling costs that are not capitalised have been charged to the Statement of Profit or Loss and Other Comprehensive Income in the year in which they are incurred.
3.2.3.4 Growing crop nurseries Nursery cost includes the cost of direct materials, direct labour and appropriate proportion of directly attributable overheads.
3.2.3.5 Depreciation Mature Plantations (Replanting and New Planting) are depreciated on a straight line basis over the expected period of their
commercial harvesting or unexpired lease period, whichever is less.
The expected periods of commercial harvesting for each category of crops are as follows:
Asset category No of Years Rate%
Tea 33 1/3 3
Rubber 20 5
Coffee 10 10
Citrus 10 10
No depreciation is provided for Immature Plantations.
3.2.3.6 Consumable Biological Assets The fair value of timber trees is measured using Discounted Cash Flow (DCF) method taking into consideration the current
market prices of timber applied to expected timber content of a tree at maturity.
52

- Annual Report 2020
Notes to the Financial StatementsFor the year ended 31st December 2020
Variable Comment
Timber content Estimated based on physical verification of girth, height and considering the growth of each species, and factoring in all the prevailing statutory regulations enforced against harvesting of timber coupled with the forestry plan of the Company.
Economic useful life Estimated based on the normal life span of each species by factoring in the forestry plan of the Company.
Selling price Selling price reflects the currently available market value.
Discount Rate Discount rate reflects the possible variations in the Cash flows and the risk related to the biological assets.
Currency LKRS
The gain or loss arising on initial recognition of Consumable Biological assets at fair value less cost to sell and from a change in fair value less cost to sell of Consumable Biological assets are included in profit or loss for the period in which it arises.
3.2.4 Produce on Bearer Biological Assets The Company recognises its agricultural produce prior to harvest separately from its bearer plant. Such agricultural produce
prior to harvest continues to be in the scope of LKAS 41 and is measured at fair value less costs to sell. Changes in the fair value of such agricultural produce is recognised in profit or loss at the end of each reporting period.
When deriving the estimated quantity, the Company limits it to one harvesting cycle and the quantity is ascertained based on the last day of the harvest in the immediately preceding cycle. In order to ascertain the fair value of produce growing on trees, 50% of the estimated crop in that harvesting cycle is considered.
For the valuation of the produce, the Company uses the bought-leaf rate (current month) less cost of harvesting and transport.
3.2.5. Financial instruments
3.2.5.1. Recognition and initial measurement Trade receivables are initially recognised when they are originated. All other financial assets and financial liabilities are initially
recognised when the Company becomes a party to the contractual provisions of the instrument.
A financial asset (unless it is a trade receivable without a significant financing component) or financial liability is initially measured at fair value plus, for an item not at FVTPL, transaction costs that are directly attributable to its acquisition or issue. A trade receivable without a significant financing component is initially measured at the transaction price.
3.2.5.2. Classification and subsequent measurement
Financial assets On initial recognition, a financial asset is classified as measured at: amortised cost; FVOCI - debt investment; FVOCI - equity
investment; or FVTPL.
Financial assets are not reclassified subsequent to their initial recognition unless the Company changes its business model for managing financial assets, in which case all affected financial assets are reclassified on the first day of the first reporting period following the change in the business model.
A financial asset is measured at amortised cost if it meets both of the following conditions and is not designated as at FVTPL:
it is held within a business model whose objective is to hold assets to collect contractual cash flows; and its contractual terms give rise on specified dates to cash flows that are solely payments of principal and interest on the
principal amount of outstanding.
A debt investment is measured at FVOCI if it meets both of the following conditions and is not designated as at FVTPL:
it is held within a business model whose objective is achieved by both collecting contractual cash flows and selling financial assets; and
its contractual terms give rise on specified dates to cash flows that are solely payments of principal and interest on the principal amount outstanding.
On initial recognition of an equity investment that is not held for trading, the Company may irrevocably elect to present subsequent changes in the investment’s fair value in OCI. This election is made on an investment-by-investment basis.
The main variables in DCF model are as follows:
53
- Annual Report 2020
Notes to the Financial StatementsFor the year ended 31st December 2020
All financial assets not classified as measured at amortised cost or FVOCI as described above are measured at FVTPL. This includes all derivative financial assets. On initial recognition, the Company may irrevocably designate a financial asset that otherwise meets the requirements to be measured at amortised cost or at FVOCI as at FVTPL if doing so eliminates or significantly reduces an accounting mismatch that would otherwise arise.
Financial assets - Business model assessment: The Company makes an assessment of the objective of the business model in which a financial asset is held at a portfolio level
because this best reflects the way the business is managed and information is provided to management. The information considered includes:
the stated policies and objectives for the portfolio and the operation of those policies in practice. These include whether management’s strategy focuses on earning contractual interest income, maintaining a particular interest rate profile, matching the duration of the financial assets to the duration of any related liabilities or expected cash outflows or realising cash flows through the sale of the assets;
how the performance of the portfolio is evaluated and reported to the Company’s management; the risks that affect the performance of the business model (and the financial assets held within that business model) and
how those risks are managed; how managers of the business are compensated - e.g. whether compensation is based on the fair value of the assets
managed or the contractual cash flows collected; and the frequency, volume and timing of sales of financial assets in prior periods, the reasons for such sales and expectations
about future sales activity.
Transfers of financial assets to third parties in transactions that do not qualify for de recognition are not considered sales for this purpose, consistent with the Company’s continuing recognition of the assets. Financial assets that are held for trading or are managed and whose performance is evaluated on a fair value basis are measured at FVTPL.
Financial assets -Assessment whether contractual cash flows are solely payments of principal and interest
For the purposes of this assessment, ‘principal’ is defined as the fair value of the financial asset on initial recognition. ‘Interest’ is defined as consideration for the time value of money and for the credit risk associated with the principal amount outstanding during a particular period of time and for other basic lending risks and costs (e.g. liquidity risk and administrative costs), as well as a profit margin.
In assessing whether the contractual cash flows are solely payments of principal and interest, the Company considers the contractual terms of the instrument. This includes assessing whether the financial asset contains a contractual term that could change the timing or amount of contractual cash flows such that it would not meet this condition. In making this assessment, the Company considers:
contingent events that would change the amount or timing of cash flows; terms that may adjust the contractual coupon rate, including variable-rate features; prepayment and extension features; and terms that limit the Company’s claim to cash flows from specified assets (e.g. non-recourse features).
A prepayment feature is consistent with the solely payments of principal and interest criterion if the prepayment amount substantially represents unpaid amounts of principal and interest on the principal amount outstanding, which may include reasonable additional compensation for early termination of the contract. Additionally, for a financial asset acquired at a discount or premium to its contractual paramount, a feature that permits or requires prepayment at an amount that substantially represents the contractual par amount plus accrued (but unpaid) contractual interest (which may also include reasonable additional compensation for early termination) is treated as consistent with this criterion if the fair value of the prepayment feature is insignificant at initial recognition.
3.2.5.3. Financial assets - Subsequent measurement and gains and losses
Financial assets at FVTPL These assets are subsequently measured at fair value. Net gains and losses, including any interest or dividend income, are
recognised in profit or loss.
Financial assets at amortised These assets are subsequently measured at amortised cost using the effective interest method. The amortised cost is reduced
by impairment losses. Interest income, foreign exchange gains and losses and impairment are recognised in profit or loss. Any gain or loss on derecognition is recognised in profit or loss.
54
- Annual Report 2020
Notes to the Financial StatementsFor the year ended 31st December 2020
Debt investments at FVOCI These assets are subsequently measured at fair value. Interest income calculated using the effective interest method, foreign
exchange gains and losses and impairment are recognised in profit or loss. Other net gains and losses are recognised in OCI. On derecognition, gains and losses accumulated in OCI are reclassified to profit or loss.
Equity investments at FVOCI These assets are subsequently measured at fair value. Dividends are recognised as income in profit or loss unless the dividend
clearly represents a recovery of part of the cost of the investment. Other net gains and losses are recognised in OCI and are never reclassified to profit or loss.
Financial liabilities - Classification, subsequent measurement and gains and losses Financial liabilities are classified as measured at amortised cost or FVTPL. A financial liability is classified as at FVTPL if it is
classified as held-for-trading, it is a derivative or it is designated as such on initial recognition. Financial liabilities at FVTPL are measured at fair value and net gains and losses, including any interest expense, are recognised in profit or loss. Other financial liabilities are subsequently measured at amortised cost using the effective interest method. Interest expense and foreign exchange gains and losses are recognised in profit or loss. Any gain or loss on derecognition is also recognised in profit or loss.
3.2.5.4. Derecognition
Financial assets The Company derecognises a financial asset when the contractual rights to the cash flows from the financial asset expire, or it
transfers the rights to receive the contractual cash flows in a transaction in which substantially all of the risks and rewards of ownership of the financial asset are transferred or in which the Company neither transfers nor retains substantially all of the risks and rewards of ownership and it does not retain control of the financial asset.
The Company enters into transactions whereby it transfers assets recognised in its statement of financial position, but retains either all or substantially all of the risks and rewards of the transferred assets. In these cases, the transferred assets are not derecognised.
Financial liabilities The Company derecognises a financial liability when its contractual obligations are discharged or cancelled, or expire. The
Company also derecognises a financial liability when its terms are modified and the cash flows of the modified liability are substantially different, in which case a new financial liability based on the modified terms is recognised at fair value.
On derecognition of a financial liability, the difference between the carrying amount extinguished and the consideration paid (including any non-cash assets transferred or liabilities assumed) is recognised in profit or loss.
3.2.5.5. Offsetting Financial assets and financial liabilities are offset and the net amount presented in the statement of financial position when,
and only when, the Company currently has a legally enforceable right to set off the amounts and it intends either to settle them on a net basis or to realise the asset and settle the liability simultaneously.
3.2.5.6. Impairment policy
Non-derivative financial assets
Financial instruments and contract assets Loss allowances for trade receivables is always measured at an amount equal to lifetime ECLs. When determining whether the credit risk of a financial asset has increased significantly since initial recognition and when
estimating ECLs, the Company considers reasonable and supportable information that is relevant and available without undue cost or effort. This includes both quantitative and qualitative information and analysis, based on the Company’s historical experience and informed credit assessment and including forward-looking information.
The Company assumes that the credit risk on a financial asset has increased significantly if it is more than 30 days past due.
The Company considers a financial asset to be in default when:
the borrower is unlikely to pay its credit obligations to the Company in full, without recourse by the Company to actions such as realising security (if any is held); or
the financial asset is more than 180 days past due.
55

- Annual Report 2020
Notes to the Financial StatementsFor the year ended 31st December 2020
Lifetime ECLs are the ECLs that result from all possible default events over the expected life of a financial instrument.
12-month ECLs are the portion of ECLs that result from default events that are possible within the 12 months after the reporting date (or a shorter period if the expected life of the instrument is less than 12 months).
The maximum period considered when estimating ECLs is the maximum contractual period over which the Company is exposed to credit risk.
Measurement of ECLs ECLs are a probability-weighted estimate of credit losses. Credit losses are measured as the present value of all cash shortfalls
(i.e. the difference between the cash flows due to the entity in accordance with the contract and the cash flows that the Company expects to receive).
ECLs are discounted at the effective interest rate of the financial asset.
Credit-impaired financial assets At each reporting date, the Company assesses whether financial assets carried at amortised cost and debt securities at FVOCI
are credit-impaired. A financial asset is ‘credit-impaired’ when one or more events that have a detrimental impact on the estimated future cash flows of the financial asset have occurred.
Evidence that a financial asset is credit-impaired includes the following observable data:
significant financial difficulty of the borrower or issuer; a breach of contract such as a default or being more than 180 days past due; the restructuring of a loan or advance by the Company on terms that the Company would not consider otherwise; it is probable that the borrower will enter bankruptcy or other financial reorganization; or the disappearance of an active market tor a security because of financial difficulties.
Presentation of allowance for ECL in the statement of financial position
Loss allowances for financial assets measured at amortised cost are deducted from the gross carrying amount of the assets.
Impairment Policy: Non-financial assets At each reporting date, the Company reviews the carrying amounts of its non-financial assets (other than biological assets,
investment property, inventories, contract assets and deferred tax assets) to determine whether there is any indication of impairment. If any such indication exists, then the asset’s recoverable amount is estimated.
For impairment testing, assets are grouped together into the smallest group of assets that generates cash inflows from continuing use that are largely independent of the cash inflows of other assets or CGUs. Goodwill arising from a business combination is allocated to CGUs or groups of CGUs that are expected to benefit from the synergies of the combination.
The recoverable amount of an asset or CGU is the greater of its value in use and its fair value less costs to sell. Value in use is based on the estimated future cash flows, discounted to their present value using a pre-tax discount rate that reflects current market assessments of the time value of money and the risks specific to the asset or CGU.
An impairment loss is recognised if the carrying amount of an asset or CGU exceeds its recoverable amount.
Impairment losses are recognised in profit or loss. They are allocated first to reduce the carrying amount of any goodwill allocated to the CGU, and then to reduce the carrying amounts of the other assets in the CGU on a pro rata basis.
An impairment loss in respect of goodwill is not reversed. For other assets, an impairment loss is reversed only to the extent that the asset’s carrying amount does not exceed the carrying amount that would have been determined, net of depreciation or amortisation, if no impairment loss had been recognised.
3.2.6. Inventories
3.2.6.1 Agricultural Produce harvested from Biological Assets Agricultural produce harvested from Biological Assets is measured at its fair value less cost to sell at the point of harvest. The
finished and semifinished inventories from agricultural produce are valued by adding the cost of conversion to the fair value of agricultural produce.
56

- Annual Report 2020
Notes to the Financial StatementsFor the year ended 31st December 2020
3.2.6.2 Agricultural Produce after further processing Further processed output of Agricultural Produce is valued at the lower of cost and estimated net realisable value, after
making due allowances for obsolete and slow-moving items. Net realizable value is the estimated selling price at which stocks can be sold in the ordinary course of business less the estimated cost of completion and estimated cost necessary to make the sale.
3.2.6.3 Input Material, Consumables and Spares Valued at actual cost on weighted average basis.
3.2.6.4 Growing Crop Nurseries Nursery cost includes the cost of direct materials, direct labour and an appropriate proportion of directly attributable
overheads, less provision for overgrown plants.
3.2.7 Cash and Cash Equivalents Cash and cash equivalents comprise cash balances, call deposits, demand deposits and short-term highly liquid investments
readily convertible to known amounts of cash and subject to insignificant risk of changes in value net of bank overdrafts that are repayable on demand for the purpose of the Statement of Cash Flows.
3.3 Liabilities and Provisions Liabilities classified as current liabilities on the Statement of Financial Position are those which fall due for payment on
demand or within one year from Statement of Financial Position date. Non-current liabilities are those balances that fall due for payment after one year from Statement of Financial Position date. All known liabilities have been accounted for in preparing these Financial Statements.
A provision is recognised if, as a result of a past event, the Company has a present legal or constructive obligation that can be estimated reliably, and it is probable that an outflow of economic benefit will be required to settle the obligation.
3.3.1 Employee Benefits
3.3.1.1 Defined Contribution Plans - Employees’
Provident Fund and Employees’ Trust Fund A Defined Contribution Plan is a post-employment benefit plan under which an entity pays fixed contributions into a separate
entity and will have no legal or constructive obligation to pay further amounts. Obligations for contributions to Defined Contribution Pension Plans are recognised as an employee benefit expense in profit or loss in the periods during which services are rendered by employees.
The Company contributes 12% of gross emoluments of the employees to Employees’ Provident Fund (EPF)/Estate Staff Provident Society (ESPS). All of the employees are eligible for Employees’ Trust Fund to which the Company contributes 3% of gross emoluments of such employees.
3.3.1.2 Defined Benefit Plan - Retirement Gratuity A Defined Benefit Plan is a post-employment benefit plan other than a Defined Contribution Plan. The Company’s net
obligation in respect of Defined Benefit Pension Plans is calculated annually using the Projected Unit Credit (PUC) Method. The liability recognised in the Statement of Financial Position is the present value of the Defined Benefit Obligation at the reporting date in accordance with the advice of an actuary. Actuarial gains or losses arising are recognised in Other Comprehensive Income in the period in which they arise. Past service costs are recognized immediately in the Statement of Profit or Loss and Other Comprehensive Income.
The provision has been made for retirement gratuities from the first year of service for all employees, in conformity with LKAS 19 - Employee Benefits. However, under the Payment of Gratuity Act No. 12 of 1983, the liability to an employee arises only on completion of 5 years of continued service.
The key assumptions used in determining the Retirement Benefit Obligations are given in Note 28.
3.3.2 Contingent Liabilities Contingent Liabilities are possible assets or obligations that arise from a past event and would be confirmed only on the
occurrence or non-occurrence of uncertain future events, which are beyond the Company’s control.
57

- Annual Report 2020
Notes to the Financial StatementsFor the year ended 31st December 2020
3.3.3 Deferred Income
3.3.3.1 Government Grants and Subsidies Government grants are recognised where there is a reasonable assurance that the grant will be received and all attached
conditions will be complied with. Where the grant relates to an asset, it is recognised as deferred income and released to income in equal amounts over the expected useful life of the related assets. When the grants are related to an expense item, it is recognised as income over the period necessary to match the grant on a systematic basis to the costs that are intended to compensate.
Grants related to Property, Plant and Equipment other than grants received for forestry are initially deferred and allocated to income on a systematic basis over the useful life of the related Property, Plant and Equipment. Grants received for forestry are initially deferred and credited to Statement of Profit or Loss and Other Comprehensive Income immediately the related blocks of trees are harvested.
3.3.4 Ordinary Shares Incremental costs directly attributable to the issue of ordinary shares are recognised as a deduction from equity. Income tax
relating to transaction costs of an equity transaction is accounted for in accordance with LKAS 12.
3.4 Statement of Profit or Loss and Other Comprehensive Income For the purpose of presentation of the Statement of Profit or Loss and Other Comprehensive Income, the Directors are of
the opinion that function of expenses method presents fairly the elements of the Company’s performance, and hence such presentation method is adopted in line with the provisions of LKAS 1 - Presentation of Financial Statements
3.4.1. Revenue Revenue is recognised to the extent that it is probable that the economic benefits will flow to the Company and the revenue
can be reliably measured, regardless of when the payment is being made. Revenue is measured at the fair value of the consideration received or receivable, taking into account contractually defined terms of payment and excluding taxes or duty.
The Company is in the business of cultivation, manufacture and sale of black tea and other crops (Plantation Produce). Revenue from contracts with customers is recognized when control of the goods are transferred to the customer at an amount that reflects the consideration to which the Company expects to be entitled in exchange for those goods. The Company has generally concluded that it is the principal in its revenue arrangements, because it typically controls the goods before transferring them to customer.
a) Sale of Plantation produce Revenue from sale of plantation produce is recognized at the point in time when the control of the goods is transferred
to the customer. Black tea produce is sold at the Colombo tea Auction and the highest bidder whose offer is accepted shall be the buyer, and a sale shall be completed at the fall of the hammer, at which point control is transferred to the customer. Revenue from sale of other crops are recognized at the point in time when the control of the goods has been transferred to the customer generally upon delivery of the goods to the location specified by the customer and the acceptance of the goods by the customer.
There is no element of financing present as the Company’s sale of plantation produce are either on cash terms (Immediate payment or advance payment not exceeding 30 days) or on credit terms ranging from 7 to 15 days.
Revenue recognition criteria for the other revenue and income earned by the Company are as follows;
b) Rental Income Rental income is recognized on an accrual basis in accordance with the substance of the relevant agreement.
c) Dividend Income Dividend income is recognized when the right to receive payment is established.
3.4.2 Expenditure Recognition
3.4.2.1 Operating Expenses All expenses incurred in the day-to-day operations of the business and in maintaining the property, plant and equipment
in a state of efficiency have been charged to the Statement of Profit or Loss and Other Comprehensive Income in arriving at the profit/(loss) for the year. Provision has also been made for impairment of non-financial assets, slow-moving stocks, overgrown nurseries, all known liabilities and depreciation on property, plant and equipment.
58

- Annual Report 2020
Notes to the Financial StatementsFor the year ended 31st December 2020
3.4.2.2 Finance Cost Finance costs comprise interest expense on external borrowings and related party loans and payments made under operating
leases. Borrowing costs that are not directly attributable to the acquisition, construction or production of a qualifying asset are recognised in profit or loss using the effective interest method. Payments made under operating leases are recognised in profit or loss on a straight line basis over the term of the lease. Lease incentives received may be recognised as an integral part of the total lease expense, over the term of the lease.
3.4.2.3 Finance Income Interest income is recognized on an accrual basis, using the effective interest method.
3.4.2.4 Income Tax Expense Income Tax expense comprising current and deferred tax. Income tax expense is recognised in Statement of Profit or Loss
and Other Comprehensive Income except to the extent that it relates to items recognised directly in equity, in which case it is recognised in equity.
3.4.2.4.1 Current Taxes Current tax expenses for the current and comparative periods are measured at the amount paid or expected to be payable
to the Commissioner General of Inland Revenue on taxable income for the respective year of assessment computed in accordance with the provisions of the Inland Revenue Act, No. 24 of 2017 as amended by subsequent legislation enacted or substantively enacted by the reporting date.
3.4.2.4.2 Deferred Taxation Deferred tax is provided using the liability method on temporary differences between the tax bases of assets and liabilities
and their carrying amounts for financial reporting purposes at the reporting date.
Deferred tax liabilities are recognised for all taxable temporary differences, except:
When the deferred tax liability arises from the initial recognition of goodwill or an asset or liability in a transaction that is not a business combination and, at the time of the transaction, affects neither the accounting profit nor taxable profit or loss.
In respect of taxable temporary differences associated with investments in subsidiaries, when the timing of the reversal of the temporary differences can be controlled and it is probable that the temporary differences will not reverse in the foreseeable future.
Deferred tax assets are recognised for all deductible temporary differences, the carry forward of unused tax credits and any unused tax losses. Deferred tax assets are recognised to the extent that it is probable
that taxable profit will be available against which the deductible temporary differences, and the carry forward of unused tax credits and unused tax losses can be utilised, except:
When the deferred tax asset relating to the deductible temporary difference arises from the initial recognition of an asset or liability in a transaction that is not a business combination and, at the time of the transaction, affects neither the accounting profit nor taxable profit or loss.
In respect of deductible temporary differences associated with investments in subsidiaries, associates and interests in joint ventures, deferred tax assets are recognised only to the extent that it is probable that the temporary differences will reverse in the foreseeable future and taxable profit will be available against which the temporary differences can be utilized.
The carrying amount of deferred tax assets is reviewed at each reporting date and reduced to the extent that it is no longer probable that sufficient taxable profit will be available to allow all or part of the deferred tax asset to be utilised. Unrecognised deferred tax assets are re-assessed at each reporting date and are recognised to the extent that it has become probable that future taxable profits will allow the deferred tax asset to be recovered.
Deferred tax assets and liabilities are measured at the tax rates that are expected to apply in the year when the asset is realised or the liability is settled, based on tax rates (and tax laws) that have been enacted or substantively enacted at the reporting date.
Deferred tax relating to items recognised outside profit or loss is recognised outside profit or loss. Deferred tax items are recognised in correlation to the underlying transaction either in OCI or directly in equity.
Deferred tax assets and deferred tax liabilities are offset if a legally enforceable right exists to set off current tax assets against current tax liabilities and the deferred taxes relate to the same taxable entity and the same taxation authority.
59

- Annual Report 2020
Notes to the Financial StatementsFor the year ended 31st December 2020
3.5 Statement of Cash Flows The Statement of Cash Flows has been prepared using the ‘Indirect Method’. Interest paid is classified as operating cash flows,
interest received and dividends received are classified as investing cash flows while dividend paid and Government grants received are classified as financing cash flows for the purpose of presentation of the Statement of Cash Flows.
3.6 Segmental Reporting Segmental information is provided for the different business segments of the Company. Business segmentation has been
determined based on the nature of goods provided by the Company after considering the risk and rewards of each type of product.
Revenue and Expenditure directly attributable to each segment are allocated to the respective segments. Revenue and Expenditure not directly attributable to a segment are allocated on the basis of their resource utilisation, wherever possible. Unallocated items comprise mainly income accrued and expenses incurred at Head office level.
Assets and Liabilities directly attributable to each segment are allocated to the respective segments. Assets and Liabilities which are not directly attributable to a segment are allocated on a reasonable basis wherever possible. The activities of the segments are described in Note 06 to the Financial Statements.
3.7 Related Party Transactions Disclosure has been made in respect of the transactions in which one party has the ability to control or exercise significant
influence over the financial and operating policies/decisions of the other, irrespective of whether or not a price is being charged.
A detailed Related Party Transaction analysis is presented in Note 37.
3.8 Earnings Per Share The Company presents Earnings per Share (EPS) data for its ordinary shares. EPS is calculated by dividing the profit or loss
attributable to ordinary shareholders of the Company by the weighted average number of ordinary shares outstanding during the period.
3.9 Events occurring after the reporting period Events after the reporting period are those events favorable and unfavorable occurring between the end of the reporting
period and the date when the Financial Statements are authorised for issue. The materiality of the events occurring after the reporting period is considered and appropriate adjustments or disclosures are made in the Financial Statements, where necessary.
The impact of coronavirus outbreak for the financial statements is disclosed under Note 43.
4 NEW STANDARDS AND CHANGES TO ACCOUNTING STANDARDS NOT EFFECTIVE AS AT THE REPORTING DATE A number of new standards and amendments to standards are effective for annual periods beginning after 1st January
2021 and earlier application is permitted; however, the Company has not early adopted the new or amended standards in preparing these financial statements.
COVID-19-Related Rent Concessions (Amendment to SLFRS 16). The amendments provide relief to lessees from applying SLFRS 16 guidance on lease modification accounting for rent
concessions arising as a direct consequence of the COVID-19 Pandemic. A lessee that applies the practical expedient is not required to assess whether eligible rent concessions are lease modifications, and accounts for them in accordance with other applicable guidance. The resulting accounting will depend on the details of the rent concession.
The practical expedient will only apply if
the revised consideration is substantially the same or less than the original consideration; the reduction in lease payments relates to payments due on or before 30 June 2021; and no other substantive changes have been made to the terms of the lease
The amendment applies to annual reporting periods beginning on or after 01st June 2020. The Company does not anticipate this amended to have a significant impact on the Company’s financial statements.
Interest Rate Benchmark Reform - Phase 2 (Amendments to SLFRS 9, LKAS 39, SLFRS 7, SLFRS 4 and SLFRS 16)
60

- Annual Report 2020
Notes to the Financial StatementsFor the year ended 31st December 2020
The amendments address issues that might affect financial reporting as a result of the reform of an interest rate benchmark, including the effects of changes to contractual cash flows or hedging relationships arising from the replacement of an interest rate benchmark with an alternative benchmark rate. The amendments provide practical relief from certain requirements in SLFRS 9, LKAS 39, SLFRS 7, SLFRS 4 and SLFRS 16 relating to:
changes in the basis for determining contractual cash flows of financial assets, financial liabilities and lease liabilities; and hedge accounting.
The amendments will require the Company to disclose additional information about the entity’s exposure to risks arising from interest rate benchmark reform and related risk management activities. The Company is in the process of assessing the impact of this standard on its accounting and reporting. This amendment is effective for annual periods beginning on or after 1st January 2021.
Property, Plant and Equipment: Proceeds before Intended Use (Amendments to LKAS 16).
This amendment prohibits deducting from the cost of an item of property, plant and equipment any proceeds from selling items produced while bringing that asset to the location and condition necessary for it to be capable of operating in the manner intended by management. Instead, an entity recognizes the proceeds from selling such items, and the cost of producing those items, in profit or loss.
The amendment applies to annual reporting periods beginning on or after 1st January 2022.
Onerous contracts - Cost of Fulfilling a Contract (Amendments to LKAS 37)
The amendments specify which costs an entity includes in determining the cost of fulfilling a contract for the purpose of assessing whether the contract is onerous. The amendments apply for annual reporting periods beginning on or after 1st January 2022 to contracts existing at the date when the amendments are first applied. At the date of initial application, the cumulative effect of applying the amendments is recognised as an opening balance adjustment to retained earnings or other components of equity, as appropriate. The Company does not anticipate this amended to have a significant impact.
Annual Improvements to SLFRS Standards 2018-2020. As part of its process to make non-urgent but necessary amendments to accounting Standards, the IASB International
Accounting Standards Board (the Board) has issued the Annual Improvements to SLFRS Standards 2018-2020. The amendments are effective for annual reporting periods beginning on or after 1 January 2022. Key Aspects covered is as follow:
I. SLFRS 1 First-time Adoption of International Financial Reporting Standards This amendment simplifies the application of SLFRS 1 for a subsidiary that becomes a first-time adopter of SLFRS
Standards later than its parent
II. SLFRS 9 Financial Instruments This amendment clarifies that - for the purpose of performing the ‘’10 per cent test’ for derecognition of financial
liabilities - in determining those fees paid net of fees received, a borrower includes only fees paid or received between the borrower and the lender, including fees paid or received by either the borrower or lender on the other’s behalf
Classification of Liabilities as Current or Non-current (Amendments to LKAS 1). The amendments in Classification of Liabilities as Current or Noncurrent (Amendments to LKAS 1) affect only the
presentation of liabilities in the statement of financial position not the amount or timing of recognition of any asset, liability income or expenses, or the information that entities disclose about those item
The Key amendments are as follows:
the classification of liabilities as current or non-current should be based on rights that are in existence at the end of the reporting period. The classification is unaffected by expectations about whether an entity will exercise its right to defer settlement of a liability. The standard also clarifies that settlement refers to the transfer to the counterparty of cash, equity instruments, other assets or services.
The amendment applies to annual reporting periods beginning on or after 1st January 2023
61

- Annual Report 2020
Notes to the Financial Statements
For
the
year
en
ded
31
st D
ecem
ber
20
20
2019
R
s.
Rs.
6
REV
ENU
E
Sale
of P
rodu
ce T
ea
2,
832,
067,
026
2,00
6,97
7,49
7
Tota
l Gro
ss R
even
ue
2,
832,
067,
026
2,00
6,97
7,49
7
6.1
Tim
ing
of R
even
ue
Rec
og
nit
ion
G
oods
tran
sfer
red
at p
oint
in ti
me
2,83
2,06
7,02
6 2,
006,
977,
497
To
tal R
even
ue
2,
832,
067,
026
2,00
6,97
7,49
7
6.1
Seg
men
tal I
nfo
rmat
ion
M
adu
lsim
a R
egio
n
Bog
owan
tala
wa
Reg
ion
To
tal
G
eogr
aphi
cal S
egm
ent
Uva
Hig
h
Uva
Med
ium
W
este
rn H
igh
20
20
2019
20
20
2019
20
20
2019
R
s.
Rs.
R
s.
Rs.
R
s.
Rs.
(a)
Seg
men
t R
even
ue
Re
venu
e
1,26
9,14
5,94
0 78
2,00
5,56
8 72
5,06
9,32
4 51
9,85
6,71
3 83
7,85
1,76
2 70
5,11
5,21
6 2,
832,
067,
026
2,00
6,97
7,49
7 C
ost o
f Sal
es
(1
,161
,418
,517
) (9
40,3
62,3
70)
(647
,006
,949
) (6
39,0
18,8
60)
(952
,850
,662
) (9
89,2
29,4
20)
(2,7
61,2
76,1
28)
(2,5
68,6
10,6
50)
Se
gmen
t Res
ults
107,
727,
423
(158
,356
,802
) 78
,062
,375
(1
19,1
62,1
47)
(114
,998
,900
) (2
84,1
14,2
04)
70,7
90,8
98
(561
,633
,153
)
Oth
er O
per
atin
g In
com
e
13,0
82,7
44
11,3
51,6
47
7,18
4,41
6 5,
449,
205
5,44
5,98
4 6,
229,
243
25,7
13,1
44
23,0
30,0
95
Adm
inis
trat
ion
& G
ener
al E
xpen
ses
(37,
504,
620)
(3
3,43
7,49
8)
(19,
969,
596)
(2
0,26
0,82
1)
(38,
187,
436)
(4
0,96
2,99
2)
(95,
661,
652)
(9
4,66
1,31
1)
83,3
05,5
47
(180
,442
,653
) 65
,277
,195
(1
33,9
73,7
63)
(147
,740
,352
) (3
18,8
47,9
53)
842,
390
(633
,264
,369
)
Hea
d O
ffice
O
ther
Op
erat
ing
Inco
me
20
,372
,158
44
,666
,509
A
dmin
istr
ativ
e Ex
pen
ses
(55,
143,
912)
(2
7,08
1,42
9)
Gai
n on
Cha
nge
in F
air V
alue
of T
imb
er S
tock
22
0,03
8,56
0 18
0,43
4,19
7
Profi
t/(L
oss)
from
Op
erat
ing
Act
iviti
es
186,
109,
196
(435
,245
,093
)
Net
Fin
ance
Cos
t
(318
,186
,563
) (3
45,8
21,1
27)
Lo
ss b
efor
e In
com
e Ta
x Ex
pen
se
(132
,077
,367
) (7
81,0
66,2
20)
In
com
e Ta
x Be
nefit
/( E
xpen
se)
(68,
817,
665)
17
,357
,685
N
et L
oss
for
the
Yea
r
(200
,895
,032
) (7
63,7
08,5
35)
N
et C
hang
e in
Fai
r Val
ue T
hrou
gh O
CI F
inan
cial
Ass
ets
(342
,967
) (2
40,8
29)
A
ctua
rial G
ain
/ (Lo
ss) o
n de
fined
ben
efit p
lans
, net
of t
ax
34,7
22,6
82
(33,
211,
266)
Re
valu
atio
n G
ain,
net
of t
ax
659,
886,
204
-
Oth
er C
omp
rehe
nsiv
e In
com
e/(E
xpen
se) n
et o
f Ta
x
69
4,26
5,91
9 (3
3,45
2,09
5)
Tota
l com
pre
hens
ive
Inco
me/
(Exp
ense
) for
the
Year
, net
of T
ax
49
3,37
0,88
7 (7
97,1
60,6
30)
A
seg
men
t is
a di
stin
guis
hab
le c
omp
onen
t of t
he C
omp
any
that
is e
ngag
ed e
ither
in p
rovi
ding
pro
duct
or s
ervi
ce (b
usin
ess
segm
ents
),or i
n p
rovi
ding
pro
duct
s or
ser
vice
s w
ithin
a p
artic
ular
ec
onom
ic e
nviro
nmen
t (g
eogr
aphi
cal s
egm
ents
),whi
ch is
sub
ject
to
risk
and
rew
ards
tha
t ar
e di
ffer
ent
from
tho
se o
f ot
her
segm
ents
. The
bus
ines
s se
gmen
ts a
re r
epor
ted
bas
ed o
n th
e ge
ogra
phi
cal s
egm
ents
of t
he c
omp
any.
62
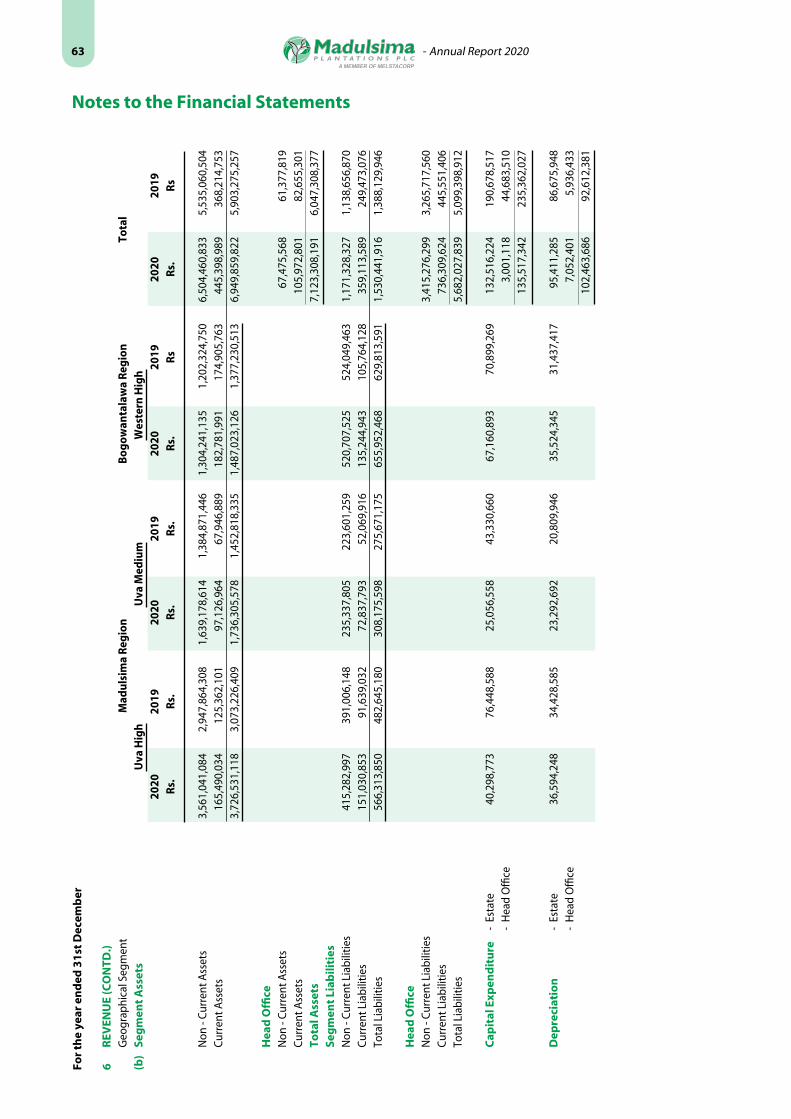
- Annual Report 2020
Notes to the Financial Statements
For
the
year
en
ded
31
st D
ecem
ber
6
REV
ENU
E (C
ON
TD.)
G
eogr
aphi
cal S
egm
ent
Mad
uls
ima
Reg
ion
B
ogow
anta
law
a R
egio
n
Tota
l(b
) Se
gm
ent
Ass
ets
U
va H
igh
U
va M
ediu
m
Wes
tern
Hig
h
2020
20
19
2020
20
19
2020
20
19
2020
20
19
Rs.
R
s.
Rs.
R
s.
Rs.
R
s R
s.
Rs
N
on -
Cur
rent
Ass
ets
3,
561,
041,
084
2,94
7,86
4,30
8 1,
639,
178,
614
1,38
4,87
1,44
6 1,
304,
241,
135
1,20
2,32
4,75
0 6,
504,
460,
833
5,53
5,06
0,50
4
Cur
rent
Ass
ets
16
5,49
0,03
4 12
5,36
2,10
1 97
,126
,964
67
,946
,889
18
2,78
1,99
1 17
4,90
5,76
3 44
5,39
8,98
9 36
8,21
4,75
3
3,72
6,53
1,11
8 3,
073,
226,
409
1,73
6,30
5,57
8 1,
452,
818,
335
1,48
7,02
3,12
6 1,
377,
230,
513
6,94
9,85
9,82
2 5,
903,
275,
257
H
ead
Offi
ce
Non
- C
urre
nt A
sset
s
67,4
75,5
68
61,3
77,8
19
Cur
rent
Ass
ets
10
5,97
2,80
1 82
,655
,301
To
tal A
sset
s
7,12
3,30
8,19
1 6,
047,
308,
377
Se
gm
ent
Liab
iliti
es
Non
- C
urre
nt L
iab
ilitie
s
415,
282,
997
391,
006,
148
235,
337,
805
223,
601,
259
520,
707,
525
524,
049,
463
1,17
1,32
8,32
7 1,
138,
656,
870
C
urre
nt L
iab
ilitie
s
151,
030,
853
91,6
39,0
32
72,8
37,7
93
52,0
69,9
16
135,
244,
943
105,
764,
128
359,
113,
589
249,
473,
076
To
tal L
iab
ilitie
s
566,
313,
850
482,
645,
180
308,
175,
598
275,
671,
175
655,
952,
468
629,
813,
591
1,53
0,44
1,91
6 1,
388,
129,
946
H
ead
Offi
ce
Non
- C
urre
nt L
iab
ilitie
s
3,41
5,27
6,29
9 3,
265,
717,
560
C
urre
nt L
iab
ilitie
s
736,
309,
624
445,
551,
406
To
tal L
iab
ilitie
s
5,68
2,02
7,83
9 5,
099,
398,
912
C
apit
al E
xpen
dit
ure
-
Esta
te
40,2
98,7
73
76,4
48,5
88
25,0
56,5
58
43,3
30,6
60
67,1
60,8
93
70,8
99,2
69
132,
516,
224
190,
678,
517
- H
ead
Offi
ce
3,00
1,11
8
44,6
83,5
10
135,
517,
342
235,
362,
027
D
epre
ciat
ion
-
Esta
te
36,5
94,2
48
34,4
28,5
85
23,2
92,6
92
20,8
09,9
46
35,5
24,3
45
31,4
37,4
17
95,4
11,2
85
86,6
75,9
48
-
Hea
d O
ffice
7,
052,
401
5,93
6,43
3
102,
463,
686
92,6
12,3
81
63

- Annual Report 2020
Notes to the Financial Statements
For the year ended 31st December 2020 2019 Rs. Rs.
7. OTHER OPERATING INCOME Amortization of Capital Grants 5,362,631 5,362,634 Rent Income 39,209,172 37,599,903 Sundry Income 1,163,499 1,448,526 Profit From Sale of Trees - 22,533,041 Dividend Income 350,000 752,500 46,085,302 67,696,604
8. NET FINANCING COST Finance Cost Overdraft Interest 4,827,193 7,448,063 Bank Loans Interest 27,278,910 52,747,673 Term Loan Interest 271,933,712 272,479,281 Interest on Government Lease 12,166,078 11,869,649 Finance Lease 2,047,559 1,324,636 318,253,452 345,869,302 Finance Income Interest income 66,889 48,175 66,889 48,175 Net finance Cost 318,186,563 345,821,127
9. LOSS BEFORE TAXATION Is stated after charging all the expenses including the following: Auditors’ remuneration - Audit 2,170,000 1,976,500 - Non Audit 225,000 100,000 Depreciation/ Amortization Leasehold right to Bare Land of JEDB / SLSPC Estates 4,330,858 4,235,836 Immovable Leased Assets of JEDB / SLSPC Estates 24,812,839 24,812,293 Tangible Assets 60,168,045 52,765,863 Mature Plantations 13,151,944 10,798,388
Impairment of immature plantation - Rubber 39,879,124 - - Cinnamon 868,813 - - Avocado 2,554,135 - Murunga 635,339 - Write off of mature / immature plantations - 2,965,338 Write off of slow moving inventories 3,811 - Write off of ESC Receivable 8,763,401 Provision for impairment of other receivable - 19,592,525
Personnel Cost Salaries and Wages 1,445,535,711 1,290,586,442 Defined Benefit Plan - Gratuity 147,654,685 147,681,391 Defined Contribution Plans - EPF/ESPS/CPPS 262,666,374 220,731,780
64

- Annual Report 2020
Notes to the Financial Statements
For the year ended 31st December 2020 2019 Rs Rs10 INCOME TAX EXPENSE
10.1Taxes charge in statement of profit/loss
(i) Current Tax Expense Income Tax charge for the year (Note 10.3) - -
(ii) Deferred Tax Relating to Origination and (reversal) of temporary differences (Note 29) 68,817,665 (17,357,685) Income Tax change/(reversal) exported in Statement of Profit or Loss 68,817,665 (17,357,685)
10.2 STATEMENT OF OTHER COMPREHENSIVE INCOME Deferred tax relating to items (charges) / credited directly to OCI during the year Tax effect on actuarial Gain / (Loss) (5,652,530) (5,406,485) Tax effect on Revaluation of Property, Plant and Equipment (107,423,336) - (113,075,866) (5,406,485)
10.3 Reconciliation of accounting profit to taxable income Accounting Loss before income tax expense (132,077,367) (781,066,220) Non Taxable receipt (220,038,560) (185,796,830) Aggregated Disallowed Items 388,006,739 306,574,987 Aggregated Allowable Items (261,863,042) (242,542,850) Statutory Loss from Business (225,972,230) (902,830,913) Other Source of Income 350,000 - Total Statutory /Taxable Income - - Income Tax Expense Tax at 14% - - As per the Inland Revenue Act No 24 of 2017 which is effective from the year of assessment 2018/19,the Company is liable to
pay income tax at the rate of 14% for its business income,as the management of the company has assessed that the company is conducting predominantly an agricultural business. Other income is taxed at 28%.
The Inland Revenue Amendment Act No 10 of 2021 was passed in the parliament and certified by the speaker on 13th May 2021. As per this amendment Act, the income tax rate applicable to companies has been reduced from 28% to 24%. Additionally, profits arising from the business of “agro farming” has been exempted for a period of 5 years commencing from 1st April 2019. Since this amendment Act was passed in the parliament subsequent to the reporting date, the Company considered these amendments as not substantively enacted as at the reporting date in accordance with LKAS 12 - “Income Taxes”. Therefore, the Company continued to apply the rates and methods used in the calculation of Income Tax provision in the previous year (i.e, 31st December 2019) for the calculation of Income Tax provision for the year ended 31st December 2020.
10.4 Accumulated Tax losses Tax losses brought forward 4,297,435,839 3,394,604,926 Adjustment in respect of prior years (585,971,690) - Loss for the year 225,972,230 902,830,913 Utilized during the year (350,000) - Tax losses carried forward 3,937,086,379 4,297,435,839
11 BASIC LOSS PER SHARE Basic Loss per share has been calculated by dividing the Loss for the year attributable to ordinary shareholders of the company
by the weighted average number of ordinary shares outstanding during the year and it is calculated as follows:
2020 2019 Rs Rs Loss attributable to shareholders (200,895,032) (763,708,535) Weighted average number of Ordinary Shares in issue 169,501,097 169,501,097 Basic Loss per share (1.19) (4.51)
11.1 DILUTED EARNING PER SHARE There were no potential diluted ordinary shares outstanding at any time during the year. Therefore,diluted Earning Per Share is
the same as Basic Earning Per Share shown above.
65

- Annual Report 2020
Notes to the Financial Statements
As at 31st December 2020
12 RIGHT TO USE OF LAND 2020 2019 Cost/Revaluation Rs. Rs.
Balance as at 1st January 222,567,308 218,811,513 Adjustment due to Initial Application of SLFRS 16 - 3,755,795 Remeasurement During the Year 1,995,117 - Balance as at 31st December 224,562,425 222,567,308
Accumulated Amortization Balance as at 1st January 113,641,594 109,405,758 Charge for the Year 4,330,858 4,235,836 Balance as at 31st December 117,972,452 113,641,594 Carrying value 106,589,973 108,925,714 The Right of Use - Lands consist of the lease rights on Janatha Estates Development Board/Sri Lanka State Plantations Corporation
Estates. Leases have been executed for a period of 53 years. All these leases are retroactive to 18 June 1992 the date of formation of the Company. The leasehold right to the land on all of these estates have been taken into the books of the Company on 18 June 1992 immediately after formation of the Company, in terms of the ruling obtained from the Urgent Issues Task Force (UITF) of the Institute of Chartered Accountants of Sri Lanka.
12.1.Leasehold rights to bare land of JEDB / SLSPC estate assets acquired by the Government of Sri Lanka
The government of Sri Lanka has initiated actions under provisions of the Land Acquisition act to acquire land from lands leased to the company in El-Teb, Mahadowa, Uvakallie and Veralapatana estates located in Badulla region.
The government of Sri Lanka has already acquired a total land extent of 4.39 hectares (refer Note A below).
(A) List of lands acquired by the Government as at 31 December 2020
Region Estate Purpose of AcquisitionExtent
(Hectares)Acquired
Year
1. Madulsima El-Teb Lower Division No 01 Tamil School 0.81 2014
2. Madulsima Mahadowa Lower Division No 01 Tamil School 0.44 2014
3. Madulsima Mahadowa Hospital Development 0.81 2009
4. Madulsima Mahadowa Chengaladi Road Expansion 0.12 2015
5. Madulsima Uvakellie Tamil School 0.80 1995
6. Madulsima Veralapatana Expansion of Madulsima town 0.81 1999
7. Madulsima Veralapatana Police Station & Quarters 0.60 2003
Total 4.39
No adjustments have been made to the Financial Statements in respect of these lands acquired as the compensation receivable on these acquisitions are not known and the government valuation is pending as at 31st December 2020.Accordingly,the transactions pertaining to those acquisitions are incomplete as at 31st December 2020.
66

- Annual Report 2020
Notes to the Financial Statements
As
at 3
1st
Dec
emb
er 2
02
0
13
. IM
MO
VA
BLE
LEA
SED
ASS
ETS
OF
JED
B/S
LSP
C E
STA
TES
(OTH
ER T
HA
N B
AR
E LA
ND
)
A
ll im
mov
able
ass
ets
in t
he J
EDB/
SLSP
C e
stat
es u
nder
fina
nce
leas
e ha
ve b
een
take
n in
to
the
finan
cial
sta
tem
ents
of
Com
pan
y re
troa
ctiv
e to
22n
d Ju
ne 1
992
For
this
pur
pos
e , t
he B
oard
de
cide
d at
its
mee
ting
on 0
8th
Mar
ch 1
995
that
thes
e as
sets
be
rest
ated
at t
heir
boo
k va
lues
as
they
ap
pea
r in
boo
k of
the
JED
B/SL
SPC
, on
the
day
imm
edia
tely
pre
cedi
ng th
e da
te o
f for
mat
ion
of c
omp
any.
The
ass
ets
wer
e ta
ken
into
the
Bala
nce
Shee
t as
at 2
2nd
June
199
2 an
d A
mor
tized
as
follo
ws.
Mat
ure
P
lan
tati
ons
Un
imp
rove
d
P
lan
t &
Wat
er S
up
ply
M
ini H
ydro
Tea
lan
ds
Bu
ildin
gs
Mac
hin
ery
Sch
eme
Sch
eme
Tota
l
R
s.
Rs.
R
s.
Rs
Rs.
R
s.
Rs.
C
ost
A
s at
1st
Jan
uary
201
9 14
6,66
3,08
5 4,
417,
562
29,9
80,8
29
394,
583,
320
3,34
6,57
9 9,
292,
578
588,
283,
953
A
s at
1st
Jan
uary
202
0 14
6,66
3,08
5 4,
417,
562
29,9
80,8
29
394,
583,
320
3,34
6,57
9 9,
292,
578
588,
283,
953
Re
valu
atio
n re
vers
al o
f dep
reci
atio
n -
- -
(118
,374
,996
) -
- (1
18,3
74,9
96)
Re
valu
atio
n G
ain
- -
- 93
,616
,676
-
- 93
,616
,676
A
s at
31s
t Dec
emb
er 2
020
146,
663,
085
4,41
7,56
2 29
,980
,829
36
9,82
5,00
0 3,
346,
579
9,29
2,57
8 56
3,52
5,63
3
Acc
um
ula
ted
Am
ort
izat
ion
A
s at
1st
Jan
uary
201
9 11
6,52
6,82
9 2,
208,
778
29,9
80,8
29
78,9
16,6
64
2,95
6,14
4 9,
292,
578
239,
881,
822
D
isp
osal
s/ T
rans
fer o
ut
- -
- -
- -
-
Cha
rge
for t
he Y
ear
4,88
8,76
9 83
,405
-
19,7
29,1
66
110,
952
- 24
,812
,292
A
s at
31s
t Dec
emb
er 2
019
121,
415,
598
2,29
2,18
3 29
,980
,829
98
,645
,830
3,
067,
096
9,29
2,57
8 26
4,69
4,11
4
As
at 1
st J
anua
ry 2
020
121,
415,
598
2,29
2,18
3 29
,980
,829
98
,645
,830
3,
067,
096
9,29
2,57
8 26
4,69
4,11
4
Cha
rge
for t
he Y
ear
4,88
8,77
0 83
,350
-
19,7
29,1
66
111,
553
- 24
,812
,839
Re
valu
atio
n re
vers
al o
f dep
reci
atio
n -
- -
(118
,374
,996
) -
- (1
18,3
74,9
96)
A
s at
31s
t Dec
emb
er 2
020
126,
304,
368
2,37
5,53
3 29
,980
,829
-
3,17
8,64
9 9,
292,
578
171,
131,
957
N
et C
arry
ing
Val
ue
A
s at
31s
t Dec
emb
er 2
019
25,2
47,4
87
2,12
5,37
9 -
295,
937,
490
279,
483
- 32
3,58
9,83
9
As
at 3
1st D
ecem
ber
202
0 20
,358
,717
2,
042,
029
- 36
9,82
5,00
0 16
7,93
0 -
392,
393,
676
Th
ese
asse
ts a
re b
eing
am
ortiz
ed in
equ
al a
nnua
l am
ount
s ov
er th
e fo
llow
ing
per
iods
.
Mat
ure
Plan
tatio
ns-T
ea
30 Y
ears
U
nim
pro
ved
Land
s 53
Yea
rs
Build
ings
25
Yea
rs
Plan
t & M
achi
nery
20
Yea
rs
Wat
er S
upp
ly S
chem
e 30
Yea
rs
Min
i Hyd
ro S
chem
e 10
Yea
rs
13
.1 F
air
valu
e h
iera
rch
y
Th
e fa
ir v
alu
e o
f th
e B
uild
ing
s w
as d
eter
min
ed b
y an
ext
ern
al in
dep
end
ent
valu
er, h
avin
g a
pp
rop
riat
e re
cog
niz
ed p
rofe
ssio
nal
qu
alifi
cati
on
s an
d e
xper
ien
ce in
th
e ca
teg
ory
of t
he
Bu
ildin
gs
bei
ng
val
ued
. B
ased
th
e va
luat
ion
tec
hn
iqu
es u
sed
it h
as b
een
cla
ssifi
ed u
nd
er L
evel
3 in
fai
r va
lue
hie
rarc
hy.
Val
uat
ion
tec
hn
iqu
es a
nd
sig
nifi
can
t u
no
bse
rvab
le in
pu
ts
are
dis
clo
sed
un
der
No
te 1
4.12
.1. T
he
valu
e o
f Bu
ildin
gs
wh
ich
are
car
ried
forw
ard
fro
m J
EDB
/SLS
PC a
gre
emen
t as
per
No
te 1
3 an
d s
ub
seq
uen
t im
pro
vem
ent
ther
eon
has
no
t b
een
se
par
atel
y id
enti
fied
, du
e to
inse
par
able
nat
ure
an
d t
ota
l rev
alu
atio
n g
ain
on
Bu
ildin
gs
are
reco
gn
ised
un
der
No
te 1
4.
Th
e fa
ir v
alu
e o
f th
e Pl
ant &
mac
hin
ery
was
det
erm
ined
by
an e
xter
nal
ind
epen
den
t val
uer
, hav
ing
ap
pro
pri
ate
reco
gn
ized
pro
fess
ion
al q
ual
ifica
tio
ns
and
exp
erie
nce
in th
e ca
teg
ory
o
f th
e Pl
ant
& M
ach
iner
y b
ein
g v
alu
ed. B
ased
on
th
e va
luat
ion
tec
hn
iqu
es u
sed
it
has
bee
n c
lass
ified
un
der
Lev
el 3
in
fai
r va
lue
hie
rarc
hy.
Val
uat
ion
tec
hn
iqu
es a
nd
sig
nifi
can
t u
no
bse
rvab
le in
pu
ts a
re d
iscl
ose
d u
nd
er N
ote
14.
12.2
.
67

- Annual Report 2020
13
. IM
MO
VA
BLE
LEA
SED
ASS
ETS
OF
JED
B/S
LSP
C E
STA
TES
(OTH
ER T
HA
N B
AR
E LA
ND
)
A
ll im
mov
able
ass
ets
in t
he J
EDB/
SLSP
C e
stat
es u
nder
fina
nce
leas
e ha
ve b
een
take
n in
to
the
finan
cial
sta
tem
ents
of
Com
pan
y re
troa
ctiv
e to
22n
d Ju
ne 1
992
For
this
pur
pos
e , t
he B
oard
de
cide
d at
its
mee
ting
on 0
8th
Mar
ch 1
995
that
thes
e as
sets
be
rest
ated
at t
heir
boo
k va
lues
as
they
ap
pea
r in
boo
k of
the
JED
B/SL
SPC
, on
the
day
imm
edia
tely
pre
cedi
ng th
e da
te o
f for
mat
ion
of c
omp
any.
The
ass
ets
wer
e ta
ken
into
the
Bala
nce
Shee
t as
at 2
2nd
June
199
2 an
d A
mor
tized
as
follo
ws.
Mat
ure
P
lan
tati
ons
Un
imp
rove
d
P
lan
t &
Wat
er S
up
ply
M
ini H
ydro
Tea
lan
ds
Bu
ildin
gs
Mac
hin
ery
Sch
eme
Sch
eme
Tota
l
R
s.
Rs.
R
s.
Rs
Rs.
R
s.
Rs.
C
ost
A
s at
1st
Jan
uary
201
9 14
6,66
3,08
5 4,
417,
562
29,9
80,8
29
394,
583,
320
3,34
6,57
9 9,
292,
578
588,
283,
953
A
s at
1st
Jan
uary
202
0 14
6,66
3,08
5 4,
417,
562
29,9
80,8
29
394,
583,
320
3,34
6,57
9 9,
292,
578
588,
283,
953
Re
valu
atio
n re
vers
al o
f dep
reci
atio
n -
- -
(118
,374
,996
) -
- (1
18,3
74,9
96)
Re
valu
atio
n G
ain
- -
- 93
,616
,676
-
- 93
,616
,676
A
s at
31s
t Dec
emb
er 2
020
146,
663,
085
4,41
7,56
2 29
,980
,829
36
9,82
5,00
0 3,
346,
579
9,29
2,57
8 56
3,52
5,63
3
Acc
um
ula
ted
Am
ort
izat
ion
A
s at
1st
Jan
uary
201
9 11
6,52
6,82
9 2,
208,
778
29,9
80,8
29
78,9
16,6
64
2,95
6,14
4 9,
292,
578
239,
881,
822
D
isp
osal
s/ T
rans
fer o
ut
- -
- -
- -
-
Cha
rge
for t
he Y
ear
4,88
8,76
9 83
,405
-
19,7
29,1
66
110,
952
- 24
,812
,292
A
s at
31s
t Dec
emb
er 2
019
121,
415,
598
2,29
2,18
3 29
,980
,829
98
,645
,830
3,
067,
096
9,29
2,57
8 26
4,69
4,11
4
As
at 1
st J
anua
ry 2
020
121,
415,
598
2,29
2,18
3 29
,980
,829
98
,645
,830
3,
067,
096
9,29
2,57
8 26
4,69
4,11
4
Cha
rge
for t
he Y
ear
4,88
8,77
0 83
,350
-
19,7
29,1
66
111,
553
- 24
,812
,839
Re
valu
atio
n re
vers
al o
f dep
reci
atio
n -
- -
(118
,374
,996
) -
- (1
18,3
74,9
96)
A
s at
31s
t Dec
emb
er 2
020
126,
304,
368
2,37
5,53
3 29
,980
,829
-
3,17
8,64
9 9,
292,
578
171,
131,
957
N
et C
arry
ing
Val
ue
A
s at
31s
t Dec
emb
er 2
019
25,2
47,4
87
2,12
5,37
9 -
295,
937,
490
279,
483
- 32
3,58
9,83
9
As
at 3
1st D
ecem
ber
202
0 20
,358
,717
2,
042,
029
- 36
9,82
5,00
0 16
7,93
0 -
392,
393,
676
Th
ese
asse
ts a
re b
eing
am
ortiz
ed in
equ
al a
nnua
l am
ount
s ov
er th
e fo
llow
ing
per
iods
.
Mat
ure
Plan
tatio
ns-T
ea
30 Y
ears
U
nim
pro
ved
Land
s 53
Yea
rs
Build
ings
25
Yea
rs
Plan
t & M
achi
nery
20
Yea
rs
Wat
er S
upp
ly S
chem
e 30
Yea
rs
Min
i Hyd
ro S
chem
e 10
Yea
rs
13
.1 F
air
valu
e h
iera
rch
y
Th
e fa
ir v
alu
e o
f th
e B
uild
ing
s w
as d
eter
min
ed b
y an
ext
ern
al in
dep
end
ent
valu
er, h
avin
g a
pp
rop
riat
e re
cog
niz
ed p
rofe
ssio
nal
qu
alifi
cati
on
s an
d e
xper
ien
ce in
th
e ca
teg
ory
of t
he
Bu
ildin
gs
bei
ng
val
ued
. B
ased
th
e va
luat
ion
tec
hn
iqu
es u
sed
it h
as b
een
cla
ssifi
ed u
nd
er L
evel
3 in
fai
r va
lue
hie
rarc
hy.
Val
uat
ion
tec
hn
iqu
es a
nd
sig
nifi
can
t u
no
bse
rvab
le in
pu
ts
are
dis
clo
sed
un
der
No
te 1
4.12
.1. T
he
valu
e o
f Bu
ildin
gs
wh
ich
are
car
ried
forw
ard
fro
m J
EDB
/SLS
PC a
gre
emen
t as
per
No
te 1
3 an
d s
ub
seq
uen
t im
pro
vem
ent
ther
eon
has
no
t b
een
se
par
atel
y id
enti
fied
, du
e to
inse
par
able
nat
ure
an
d t
ota
l rev
alu
atio
n g
ain
on
Bu
ildin
gs
are
reco
gn
ised
un
der
No
te 1
4.
Th
e fa
ir v
alu
e o
f th
e Pl
ant &
mac
hin
ery
was
det
erm
ined
by
an e
xter
nal
ind
epen
den
t val
uer
, hav
ing
ap
pro
pri
ate
reco
gn
ized
pro
fess
ion
al q
ual
ifica
tio
ns
and
exp
erie
nce
in th
e ca
teg
ory
o
f th
e Pl
ant
& M
ach
iner
y b
ein
g v
alu
ed. B
ased
on
th
e va
luat
ion
tec
hn
iqu
es u
sed
it
has
bee
n c
lass
ified
un
der
Lev
el 3
in
fai
r va
lue
hie
rarc
hy.
Val
uat
ion
tec
hn
iqu
es a
nd
sig
nifi
can
t u
no
bse
rvab
le in
pu
ts a
re d
iscl
ose
d u
nd
er N
ote
14.
12.2
.
Notes to the Financial Statements
As
at 3
1st
Dec
emb
er 2
02
0
14
. FR
EEH
OLD
PR
OP
ERTY
, PLA
NT
& E
QU
IPM
ENTS
C
OST
/REV
ALU
ATI
ON
R
eval
uat
ion
A
s at
01
st
D
isp
osa
ls/
reve
rsal
of
Rev
alu
atio
n
As
at 3
1st
A
s at
31
st
Li
fe o
f th
e Ja
nu
ary
Ad
dit
ion
s/
Tran
sfer
ou
t D
epre
ciat
ion
G
ain
D
ecem
ber
D
ecem
ber
Ass
et Y
ear
20
20
Tr
ansf
er in
20
20
2
01
9
Rs.
R
s.
Rs.
R
s.
Rs.
R
s.
Rs.
A
T C
OST
La
nd Im
pro
vem
ents
40
Yea
rs
55,3
68,8
72
- -
- -
55,3
68,8
72
55,3
68,8
72
Wat
er P
roje
cts
& S
anita
tion
20 Y
ears
25
,698
,539
-
- -
- 25
,698
,539
25
,698
,539
Eq
uip
men
t 8
Year
s 63
,406
,452
3,
145,
678
- -
- 66
,552
,130
63
,406
,452
C
omp
uter
4
Year
s 10
,849
,684
78
,702
-
- -
10,9
28,3
86
10,8
49,6
84
Furn
iture
& F
ittin
gs
10 Y
ears
5,
455,
916
- -
- -
5,45
5,91
6 5,
455,
916
A
T R
EVA
LUA
TIO
N
Imp
rove
men
ts to
Bui
ldin
gs
40 Y
ears
27
2,79
4,21
9 6,
570,
361
- (9
3,39
1,03
1)
591,
570,
377
777,
543,
926
272,
794,
219
Pl
ant &
Mac
hine
ry
15/2
0 Ye
ars
602,
566,
592
7,80
9,06
0 -
(123
,367
,339
) (4
0,75
0,31
3)
446,
258,
000
602,
566,
592
M
otor
Veh
icle
s 5
Year
s 17
2,22
4,37
7 -
- (1
21,5
17,1
77)
122,
872,
800
173,
580,
000
172,
224,
377
C
apita
l Wor
k-in
-Pro
gres
s
40,3
14,7
62
7,32
6,13
9 (9
,526
,003
) -
- 38
,114
,898
40
,314
,762
1,
248,
679,
413
24,9
29,9
40
(9,5
26,0
03)
(338
,275
,547
) 67
3,69
2,86
4 1,
599,
500,
667
1,24
8,67
9,41
3
D
EPR
ECIA
TIO
N
A
cc. D
epre
ciat
ion
A
s at
01
st
Ch
arg
e/
R
eval
uat
ion
A
s at
31
st
As
at 3
1st
A
s at
31
st
Jan
uar
y A
dju
stm
ents
O
n D
isp
osa
ls/
reve
rsal
of
Dec
emb
er
Dec
emb
er
Dec
emb
er
20
20
fo
r th
e Y
ear
Tran
sfer
ou
t D
epre
ciat
ion
2
02
0
20
20
2
01
9
Rs.
R
s.
Rs.
R
s.
Rs.
R
s.
Rs.
A
T C
OST
La
nd Im
pro
vem
ents
14,2
13,6
56
1,59
0,62
6 -
- 15
,804
,282
39
,564
,590
41
,155
,216
W
ater
Pro
ject
s &
San
itatio
n
22,6
94,3
17
450,
883
- -
23,1
45,2
00
2,55
3,33
9 3,
004,
222
Eq
uip
men
t
34,4
08,6
91
4,38
0,71
8 -
- 38
,789
,409
27
,762
,721
28
,997
,761
C
omp
uter
9,16
1,74
7 76
6,62
2 -
- 9,
928,
369
1,00
0,01
7 1,
687,
937
Fu
rnitu
re &
Fitt
ings
4,79
5,86
0 77
,987
-
- 4,
873,
847
582,
069
660,
056
A
T R
EVA
LUA
TIO
N
Imp
rove
men
ts to
Bui
ldin
gs
86
,519
,101
6,
871,
930
- (9
3,39
1,03
1)
- 77
7,54
3,92
6 18
6,27
5,11
8
Plan
t & M
achi
nery
93,2
94,2
95
30,0
73,0
44
- (1
23,3
67,3
39)
- 44
6,25
8,00
0 50
9,27
2,29
7
Mot
or V
ehic
les
10
5,56
0,94
2 15
,956
,235
-
(121
,517
,177
) -
173,
580,
000
66,6
63,4
35
Cap
ital W
ork-
in-P
rogr
ess
-
- -
- -
38,1
14,8
98
40,3
14,7
62
370,
648,
609
60,1
68,0
45
- (3
38,2
75,5
47)
92,5
41,1
07
1,50
6,95
9,56
0 87
8,03
0,80
5
Car
ryin
g V
alu
e
68

- Annual Report 2020
Notes to the Financial Statements
As at 31st December 2020
14. FREEHOLD PROPERTY, PLANT & EQUIPMENTS (Contd...)
14.1 The assets shown above are those immovable assets vested in the company by way of Gazette notification on the date of formation of the company (22 June 1992) and all investments in tangible assets of the Company since its formation. The assets taken over by way of estate leases are set out in Notes 12 and 13 to the Financial Statements.
14.2 Property, plant and equipment under construction
Capital work in progress represents the amount of expenditure recognised under property, plant and equipment during the construction of capital assets.
14.3 Title restriction on property, plant and equipment
There are no restrictions that existed on the title of the PPE of the Company as at the reporting date except assets disclosured under note 14.8.
14.4 Capitalisation of borrowing cost
There were no capitalised borrowing costs related to the acquisition of property, plant and equipment during the year ended 31st December 2020. (2019 – Nil).
14.5 Temporarily Idle property, plant and equipment
There are no temporarily idle property, plant or equipment as at the reporting date. (2019 - Nil)
14.6 Impairment of property, plant and equipment
The Board of Directors has assessed the potential impairment loss of PPE as at 31 December 2020 by considering the impact from the COVID-19 pandemic as well. Based on the assessment, no impairment provision is required to be made in the Financial Statements as at the reporting date in respect of PPE (2019/ - Nil).
14.7 Fully depreciated property, plant and equipment in use
Property, plant and equipment includes fully depreciated assets with a cost of Rs. 148.3 Mn (31 December 2019 - Rs. 146.30 Mn) which were in use during the year.
14.8 Property, plant and equipment pledged as security for liabilities
The value of the property, plant and equipment pledged as security against borrowings are disclosed in Note 27.4.
14.9 Valuation of Property, Plant and Equipment
The Company uses the revaluation model of measurement for Buildings, Plant & Machinery and Motor Vehicles in 12 estates with Head Office. The Company engaged Mr. W.M. Chandrasena FIV (SL), MRICS (UK) Independent Chartered Valuation Surveyor, Membership No F/14, to determine the fair value of its Buildings, Plant & Machinery and Motor Vehicles. Fair value is determined by reference to market-based evidence. Valuations are based on open market rates, adjusted for any difference in the nature, location or condition of the specific property. The date of the most recent valuation was 31st December 2020.
14.10 The details of Buildings, Plant & Machinery and Motor Vehicles which are stated at valuation are as follows,
Location Method of Valuation
Effective date of Valuation
Name of the Independent Valuer
Revalued Amount
Net Book Value before revaluation
Revaluation Gain/(Loss)
Building Cost Approach
31-12-2020
Mr. W.M. Chandrasena FIV (SL),MRICS (UK)
Independent Charted Valuation Surveyor,
Membership No F/14.
777,543,926 185,973,549 591,570,377
Freehold Plant & Machinery (Note 14)
Cost Approach
31-12-2020 446,258,000 487,008,313 (40,750,313)
Leasehold Plant & Machinery (Note 13)
Cost Approach
31-12-2020 369,825,000 276,208,324 93,616,676
Motor Vehicles Market Approach
31-12-2020 173,580,000 50,707,200 122,872,800
1,767,206,926 767,309,540
14.11 If property, plant and equipment were stated on the historical cost basis, their net book amounts would be as follows : Carrying value of revalued Plant and Machinery if carried at historical cost is Rs. 327 Mn as at 31st December 2020. Carrying value of revalued Motor Vehicles if carried at historical cost is Rs. 46.48 Mn as at 31st December 2020. Carrying value of revalued Buildings if carried at historical cost is Rs. 185.98 Mn as at 31st December 2020.
69

- Annual Report 2020
Estate Location (Region)
Fair Value as at 31 December 2020 (Rs.)
Method of Valuation
Significant Unobservable Inputs
Range of Estimates for unobservable inputs (Estimated Price per Sq. Ft.)
Inter-relationship between key unobservable inputs and fair value measurement
Battawatte Madulsima 50,669,373 Cost Approach Estimated Replacement cost per Sq. Ft.
850-3500 Positively correlated sensitivity
Cocogalla Metigahatenne 49,419,438 Cost Approach Estimated Replacement cost per Sq. Ft.
850-4500 Positively correlated sensitivity
Galloola Madulsima 40,692,764 Cost Approach Estimated Replacement cost per Sq. Ft.
500-4500 Positively correlated sensitivity
Mahadowa Madulsima 84,413,345 Cost Approach Estimated Replacement cost per Sq. Ft.
800-3000 Positively correlated sensitivity
Uvakellie Madulsima 12,144,942 Cost Approach Estimated Replacement cost per Sq. Ft.
850-2850 Positively correlated sensitivity
Verellapatna Madulsima 71,839,795 Cost Approach Estimated Replacement cost per Sq. Ft.
850-3250 Positively correlated sensitivity
El Teb Passara 72,475,733 Cost Approach Estimated Replacement cost per Sq. Ft.
1200-3500 Positively correlated sensitivity
Roeberry Pitamaruawa 76,127,258 Cost Approach Estimated Replacement cost per Sq. Ft.
1200-3000 Positively correlated sensitivity
Kew Bogawantalawa 52,044,665 Cost Approach Estimated Replacement cost per Sq. Ft.
1800-4000 Positively correlated sensitivity
Kirkoswald Bogawantalawa 132,483,547 Cost Approach Estimated Replacement cost per Sq. Ft.
500-4000 Positively correlated sensitivity
Theresia Bogawantalawa 51,740,490 Cost Approach Estimated Replacement cost per Sq. Ft.
850-3500 Positively correlated sensitivity
Venture Norwood 77,131,362 Cost Approach Estimated Replacement cost per Sq. Ft.
750-3750 Positively correlated sensitivity
Head Office Badulla 6,361,214 Cost Approach Estimated Replacement cost per Sq. Ft.
1820-1840 Positively correlated sensitivity
Total 777,543,926
Notes to the Financial Statements
Cost Approach - This reflects the amount that would be required currently to replace the service capacity of an asset.
14.12 Fair value measurement
14.12.1 Fair Value of Buildings
I Fair Value Hierarchy The fair value of the Building was determined by an external independent property valuer, having appropriate recognized
professional qualifications and experience in the category of the property being valued. The valuer provides the fair value of the property. Based on the valuation techniques used it has been classified under Level 3 in fair value hierarchy.
II Valuation technique and significant unobservable inputs (Level 3) The following table shows the valuation technique used in measuring the fair value of Buildings, as well as the significant
unobservable inputs used;
As at 31st December 2020
70

- Annual Report 2020
Type of Asset Valuation technique Significant unobservable input
Inter-relationship between key unobservable inputs and fair
value measurement
Plant and Machinery Cost ApproachThis reflects the amount that would be required currently to replace the service capacity of an asset
Depreciated Replacement CostRs. 7500 - 30,000,000
Positively correlated sensitivity
Notes to the Financial Statements
14.12.3 Fair Value of Motor Vehicles
I Fair Value Hierarchy The fair value measurement for all of Motor Vehicles has been categorized as level 2 fair Value based on the input to the valuation
technique used.
Type of AssetSignificant other observable
inputs (Level II)Rs.
TotalRs.
Motor Vehicle 173,580,000 173,580,000
Fair value measurements at 31 December 2020 173,580,000 173,580,000
14.12.2 Fair Value of Freehold and Leasehold Plant and Machinery
I Fair Value Hierarchy The fair value measurement for all of Plant & Machinery has been categorized as level 03 fair value based on the input to the
valuation technique used.
II Valuation technique and significant unobservable inputs (Level 3) The following table shows the valuation technique used in measuring the fair value of Plant & Machinery, as well as the
significant unobservable inputs used;
15. BEARER BIOLOGICAL ASSETS
15.1 MATURE PLANTATIONS Life of the As at 1st Additions/ Disposals/ As at 31st As at 31st Assets January 2020 Transfers in Transfers out December 2020 December 2019
Rs. Rs. Rs. Rs. Rs.
- Tea 30 years 434,251,992 6,143,880 - 440,395,872 434,251,992 - Rubber 20 years 1,727,490 - - 1,727,490 1,727,490 - Coffee 10 years 2,869,329 - - 2,869,329 2,869,329 438,848,811 6,143,880 - 444,992,691 438,848,811
Accumulated Depreciation Carrying Value As at 1st Depreciation As at 31st As at 31st As at 31st
January 2020 for the year December 2020 December 2020 December 2019 Rs. Rs. Rs. Rs. Rs.
- Tea 195,882,416 13,051,852 208,934,268 231,461,604 238,369,576 - Rubber 1,122,868 86,374 1,209,242 518,248 604,621 - Coffee 2,855,611 13,718 2,869,329 - 13,718 199,860,895 13,151,944 213,012,839 231,979,852 238,987,915
Investments in bearer plants since the formation of the company have been classified as shown above and mainly includes tea and rubber plantations. Bearer plants are stated at cost less accumulated depreciation and impairment in accordance with LKAS 16-Property, Plant and Equipment.
The immature plants are classified as mature plants when they are ready for commercial harvesting.
As at 31st December 2020
This reflects the market value of similar asset considering the current market transactions for Identical or similar assets discounted for age and condition of the assets being revalued. The current market values of revalued motor vehicles range from Rs. 10,000 to Rs. 12,500,000.
71
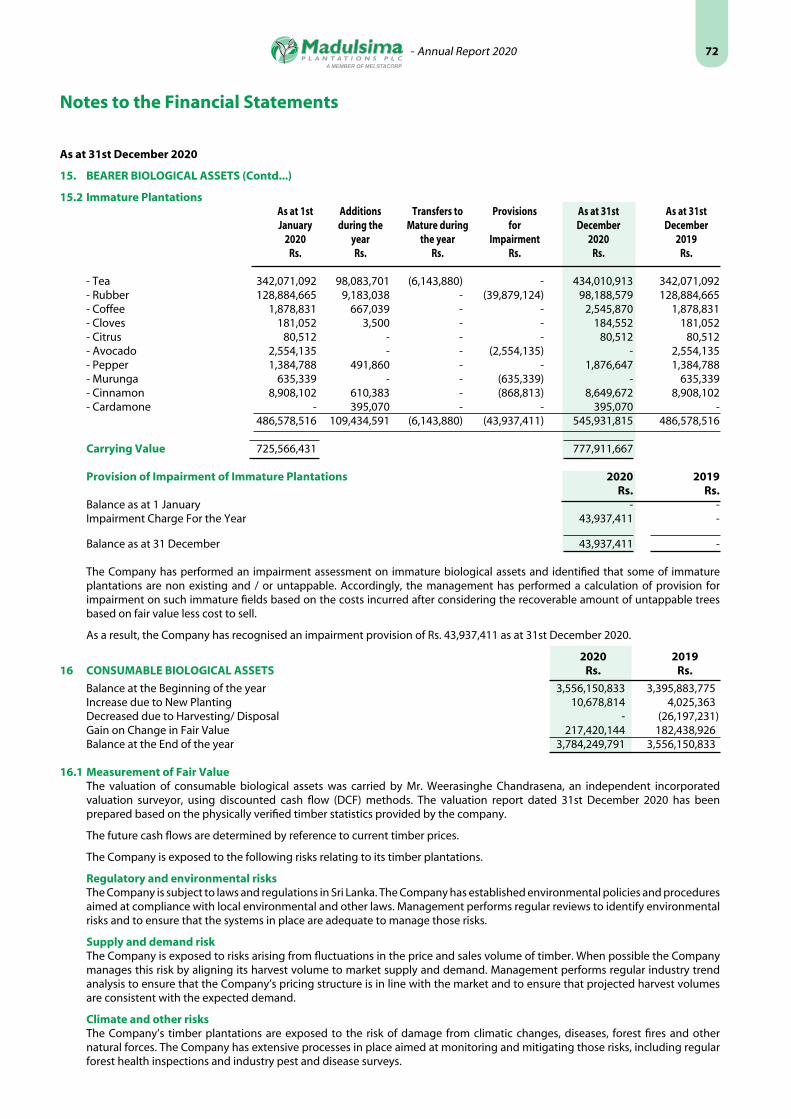
- Annual Report 2020
Notes to the Financial Statements
As at 31st December 2020
15. BEARER BIOLOGICAL ASSETS (Contd...)
15.2 Immature Plantations As at 1st Additions Transfers to Provisions As at 31st As at 31st January during the Mature during for December December
2020 year the year Impairment 2020 2019 Rs. Rs. Rs. Rs. Rs. Rs.
- Tea 342,071,092 98,083,701 (6,143,880) - 434,010,913 342,071,092 - Rubber 128,884,665 9,183,038 - (39,879,124) 98,188,579 128,884,665 - Coffee 1,878,831 667,039 - - 2,545,870 1,878,831 - Cloves 181,052 3,500 - - 184,552 181,052 - Citrus 80,512 - - - 80,512 80,512 - Avocado 2,554,135 - - (2,554,135) - 2,554,135 - Pepper 1,384,788 491,860 - - 1,876,647 1,384,788 - Murunga 635,339 - - (635,339) - 635,339 - Cinnamon 8,908,102 610,383 - (868,813) 8,649,672 8,908,102 - Cardamone - 395,070 - - 395,070 - 486,578,516 109,434,591 (6,143,880) (43,937,411) 545,931,815 486,578,516 Carrying Value 725,566,431 777,911,667 Provision of Impairment of Immature Plantations 2020 2019 Rs. Rs. Balance as at 1 January - - Impairment Charge For the Year 43,937,411 -
Balance as at 31 December 43,937,411 - The Company has performed an impairment assessment on immature biological assets and identified that some of immature
plantations are non existing and / or untappable. Accordingly, the management has performed a calculation of provision for impairment on such immature fields based on the costs incurred after considering the recoverable amount of untappable trees based on fair value less cost to sell.
As a result, the Company has recognised an impairment provision of Rs. 43,937,411 as at 31st December 2020.
2020 201916 CONSUMABLE BIOLOGICAL ASSETS Rs. Rs.
Balance at the Beginning of the year 3,556,150,833 3,395,883,775 Increase due to New Planting 10,678,814 4,025,363 Decreased due to Harvesting/ Disposal - (26,197,231) Gain on Change in Fair Value 217,420,144 182,438,926 Balance at the End of the year 3,784,249,791 3,556,150,833
16.1 Measurement of Fair Value The valuation of consumable biological assets was carried by Mr. Weerasinghe Chandrasena, an independent incorporated
valuation surveyor, using discounted cash flow (DCF) methods. The valuation report dated 31st December 2020 has been prepared based on the physically verified timber statistics provided by the company.
The future cash flows are determined by reference to current timber prices.
The Company is exposed to the following risks relating to its timber plantations.
Regulatory and environmental risks The Company is subject to laws and regulations in Sri Lanka. The Company has established environmental policies and procedures
aimed at compliance with local environmental and other laws. Management performs regular reviews to identify environmental risks and to ensure that the systems in place are adequate to manage those risks.
Supply and demand risk The Company is exposed to risks arising from fluctuations in the price and sales volume of timber. When possible the Company
manages this risk by aligning its harvest volume to market supply and demand. Management performs regular industry trend analysis to ensure that the Company’s pricing structure is in line with the market and to ensure that projected harvest volumes are consistent with the expected demand.
Climate and other risks The Company’s timber plantations are exposed to the risk of damage from climatic changes, diseases, forest fires and other
natural forces. The Company has extensive processes in place aimed at monitoring and mitigating those risks, including regular forest health inspections and industry pest and disease surveys.
72

- Annual Report 2020
Notes to the Financial Statements
16.1.1 Fair Value Hierarchy
The fair value measurement for the consumable biological assets has been categorized as Level 3 fair value based on the inputs to the valuation technique used.
NON FINANCIAL ASSETS - Consumable Biological Assets Level 1 Level 2 Level 3 As at 31st December Date of valuation Rs Rs Rs Assets measured at fair value Consumable Biological Assets - Timber 31st December 2020 - - 3,784,249,791 In determining the fair value, highest and best use of timber, current condition of the trees and expected timber content at
harvesting have been considered. Also, the valuers have made reference to market evidence of the company ,and the market prices of timber corporation,with appropriate adjustments for size and location. The appraised fair values are rounded with appropriate adjustments for size and location. The appraised fair values are rounded within the range of values.
16.2 INFORMATION ABOUT FAIR VALUE MEASUREMENTS USING SIGNIFICANT UNOBSERVABLE INPUTS (LEVEL 3)
Non Financial Assets
Valuation Techniques Unobservable Inputs
Range of Unobservable Inputs
Relationship of Unobservable inputs to Fair Value
Standing timber older than 4 years.
DCF Method: The valuation model considers present value of future net cash flows expected to be generated by the plantation from the timber content of managed timber plantation on a tree per- tree basis.
Discounting factorOptimum rotation (Maturity)Volume at rotationPrice per Cu. Ft.
12%
25-35 Years
25 to 85 lbs Cu. Ft.
Rs. 150/- Rs.600 /- per Cu. Ft
The higher the discount rate,the lower the fair value
Lower the rotation period, the higher the fair value.
The higher the weight the higher the fair value
The higher the price the higher the fair value
Young Plants (Age less than 4 years)
Cost techniques: The cost techniques consider the cost of creating a comparable plantation, taking in to account the cost of infrastructure, cultivation and preparation, buying and planting young trees with an estimate profit that would apply to this activity.
- Estimated cost of cultivation and preparation per hectare
- Estimated cost of buying and planting young plants per hectare
Rs. 200,000 - Rs. 250,000
Rs. 42,000 - Rs. 45,000
The estimated fair value would increase (decrease) if; The estimated cost of infrastructure, cultivation and preparation and buying and planting trees were higher/ (lower).
The future cash flows are determined by reference to current timber prices without considering the future increase of timber price. Trees have been valued as per the current timber prices per cubic meter based on the price list of the State Timber Corporation and prices of timber trees sold by the estates and prices of logs sawn timber at the popular timber traders in Sri Lanka.
Key assumption used in the Valuation
1. The harvesting is approved by the PMMD and Forest Department based on the forestry development plan 2. The price adopted are net of expenditure 3. Though the replanting is a condition precedent for harvesting, yet the cost are not taken in to consideration.
The valuations, as presented in the external valuation models based on net present values, take into account the long term exploitation of the timber plantations. Because of the inherent uncertainty associated with the valuation at fair value of the biological assets due to the volatility of the variables, their carrying value may differ from their realisable value. The Board of Directors retains their view that commodity markets are inherently volatile and that long term price projections are highly unpredictable. Hence, the sensitivity analysis regarding selling price and discount rate variations as included in this note allows every investor to reasonably challenge the financial impact of the assumptions used in the LKAS 41 against his own assumptions.
As at 31st December 2020
73

- Annual Report 2020
As at 31st December 2020
16. CONSUMABLE BIOLOGICAL ASSETS - TIMBER PLANTATIONS (CONTD.)
16.3 Sensitivity analysis of assumptions used in the valuation of timber plantations
Sensitivity variation sales price Values as appearing in the statement of financial position are very sensitive to price changes with regard to the average sales
prices applied. Simulations made for timber show that a rise or decrease by 10% of the estimated future selling price has the following effect on the net present value of biological assets:
-10% +10% Managed Timber Rs. Rs.
As at 31st December, 2020 (378,424,978) 378,424,978 As at 31st December, 2019 (376,028,798) 376,028,798
Sensitivity variation discount rate Values as appearing in the Statement of Financial Position are very sensitive to changes of the discount rate applied. Simulations
made for timber trees show that a rise or decrease by 1% of the discount rate has the following effect on the net present value of biological assets:
-1% +1% Managed Timber Rs. Rs.
As at 31st December, 2020 165,304,698 (149,189,870 As at 31st December, 2019 132,383,363 (119,522,754)
2020 201917. INVESTMENT IN EQUITY SECURITIES - FVOCI Rs. Rs. Investment in unquoted companies Investment in Bogo Power (Pvt) Ltd (3,500,000 Ordinary shares) 4,174,701 4,415,530 (Less) / add : Fair Value Change (342,967) (240,829) 3,831,734 4,174,701
Investment in ordinary shares of Bogo Power (Pvt) Ltd
The Company designated the investments shown below as equity securities at FVOCI because these equity securities represent investments that the Company intends to hold for the long term for strategic purposes.
The investment in ordinary shares of Bogo Power (Pvt) Ltd has been measured at fair value on a net assets value (Rs. 1.1 per share) basis and the fair value gain / (loss) has been classified as fair value reserve.
18. PRODUCE ON BEARER BIOLOGICAL ASSETS As at 01st January 2,053,351 4,058,080 Change in fair value less cost to sell 2,618,416 (2,004,729) As at 31st December 4,671,767 2,053,351
The volume of produce growing on bearer plants are measured using the estimated crop of the last harvesting cycle of the year as follows;
Tea – Three days crop (50% of 6 days cycle)
Produce that grows on mature bearer plantations are measured at fair value less cost to sell. The value of the unharvested green leaves is measured using the Tea Commissioner’s formula for bought leaf.
2020 2019 Rs. Rs.18.1 Gain /(Loss) On Fair Value Of Biological Assets Consumable Biological Assets Gain/(loss)arising from changes in fair value less cost to sell ( Note No 16) 217,420,144 182,438,926
Produce on Bearer Biological Assets Gain/(Loss) arising from changes in fair value less cost to sell (Note No 18) 2,618,416 (2,004,729) 220,038,560 180,434,197
19. INVENTORIES Input Materials 28,932,337 24,026,381 Biological Assets – Nurseries 10,319,696 7,806,811 Produce Stock (Tea) 319,166,490 217,278,952 Consumables & Spares 5,031,302 4,445,053 363,449,825 253,557,197
Notes to the Financial Statements
74

- Annual Report 2020
As at 31st December 2020 20. TRADE AND OTHER RECEIVABLES 2020 2019 Rs. Rs. Trade Receivables Produce Debtors 6,899,670 34,379,909 Other Receivables Employee Related Debtors 50,535,431 47,432,394 Value Added Tax Receivable 10,850,996 10,850,996 With Holding Tax Receivable 11,018,951 5,573,629 Income Tax Recoverable 6,517,024 6,517,024 ESC Receivable 18,401,214 27,164,615 Deposits and Prepayments 37,970,020 5,076,659 ACT Recoverable 41,034,639 41,034,639 Other Debtors 36,269,171 31,494,136 219,497,116 209,524,001 Less: Provision for Doubtful Debts (63,976,287) (63,976,287) 155,520,829 145,547,714
20.1 Provision for impairment of Other receivables Balance at the begining of the year 63,976,287 44,383,762 Provision made during the year - 19,592,525 Balance at 31st December 63,976,287 63,976,287 21. AMOUNTS DUE FROM RELATED PARTIES Melstacorp PLC 183,729 183,729 Bogo Power (Pvt) Limited - 1,974,242 Lanka Milk Foods (Pvt) Limited 113,003 - Continental Insurance PLC - 20,657 296,732 2,178,628
22. CASH AND CASH EQUIVALENTS
22.1 Favourable balance Cash at Bank and in Hand 27,432,637 47,533,164 27,432,637 47,533,164
22.2 Unfavorable balance Bank Overdraft (101,677,971) (27,931,815) Cash and Cash Equivalents for the Purpose of Cash Flows (74,245,334) 19,601,349
23 STATED CAPITAL Issued and fully paid number of shares Ordinary Shares Including one Golden Share held by the Treasury which has Special right 169,501,097 169,501,097 169,501,097 169,501,097 Value of issued and fully paid shares Ordinary Shares Including one Golden Share held by the Treasury which has Special right 1,624,760,670 1,624,760,670 1,624,760,670 1,624,760,670
Rights, preferences and restrictions of classes of capital The holders of ordinary share are entitled to receive dividends as declared from time to time and are entitled to one vote per
share at meetings of the Company
Notes to the Financial Statements
75
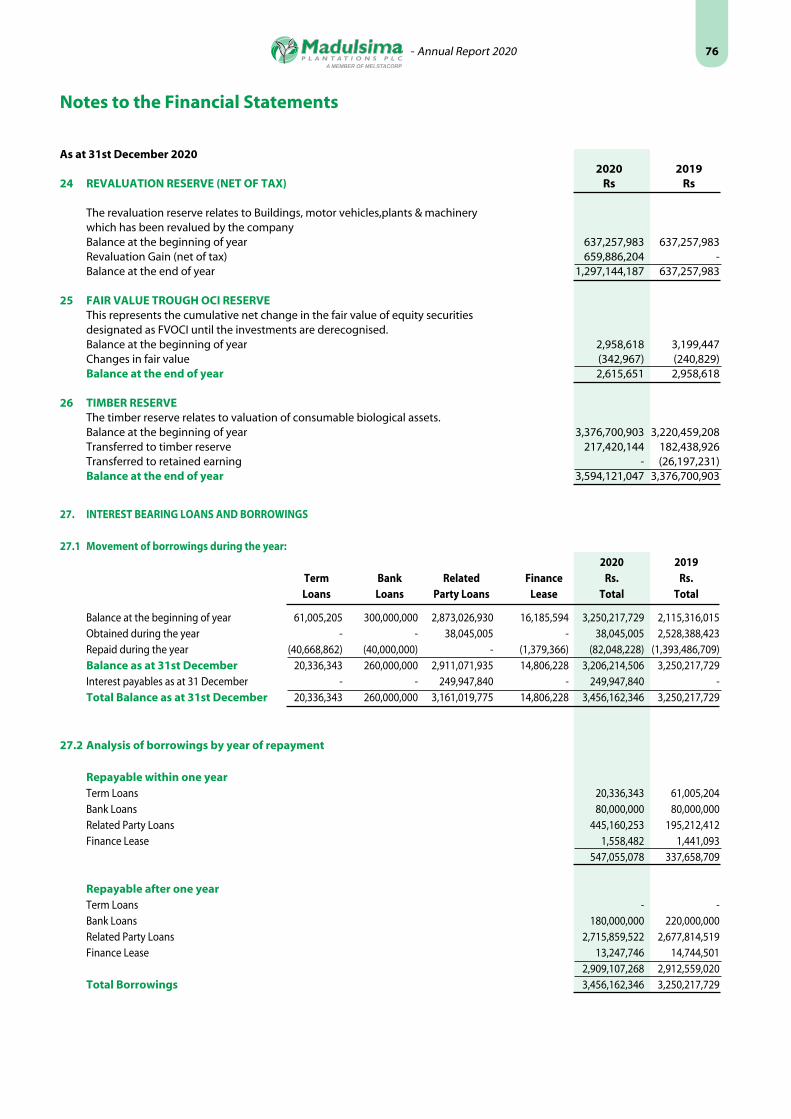
- Annual Report 2020
27. INTEREST BEARING LOANS AND BORROWINGS
27.1 Movement of borrowings during the year: 2020 2019 Term Bank Related Finance Rs. Rs. Loans Loans Party Loans Lease Total Total
Balance at the beginning of year 61,005,205 300,000,000 2,873,026,930 16,185,594 3,250,217,729 2,115,316,015 Obtained during the year - - 38,045,005 - 38,045,005 2,528,388,423 Repaid during the year (40,668,862) (40,000,000) - (1,379,366) (82,048,228) (1,393,486,709) Balance as at 31st December 20,336,343 260,000,000 2,911,071,935 14,806,228 3,206,214,506 3,250,217,729 Interest payables as at 31 December - - 249,947,840 - 249,947,840 - Total Balance as at 31st December 20,336,343 260,000,000 3,161,019,775 14,806,228 3,456,162,346 3,250,217,729
27.2 Analysis of borrowings by year of repayment Repayable within one year Term Loans 20,336,343 61,005,204 Bank Loans 80,000,000 80,000,000 Related Party Loans 445,160,253 195,212,412 Finance Lease 1,558,482 1,441,093 547,055,078 337,658,709 Repayable after one year Term Loans - - Bank Loans 180,000,000 220,000,000 Related Party Loans 2,715,859,522 2,677,814,519 Finance Lease 13,247,746 14,744,501 2,909,107,268 2,912,559,020 Total Borrowings 3,456,162,346 3,250,217,729
Notes to the Financial Statements
As at 31st December 2020 2020 201924 REVALUATION RESERVE (NET OF TAX) Rs Rs
The revaluation reserve relates to Buildings, motor vehicles,plants & machinery which has been revalued by the company Balance at the beginning of year 637,257,983 637,257,983 Revaluation Gain (net of tax) 659,886,204 - Balance at the end of year 1,297,144,187 637,257,983
25 FAIR VALUE TROUGH OCI RESERVE This represents the cumulative net change in the fair value of equity securities designated as FVOCI until the investments are derecognised. Balance at the beginning of year 2,958,618 3,199,447 Changes in fair value (342,967) (240,829) Balance at the end of year 2,615,651 2,958,618
26 TIMBER RESERVE The timber reserve relates to valuation of consumable biological assets. Balance at the beginning of year 3,376,700,903 3,220,459,208 Transferred to timber reserve 217,420,144 182,438,926 Transferred to retained earning - (26,197,231) Balance at the end of year 3,594,121,047 3,376,700,903
76

- Annual Report 2020
Notes to the Financial Statements
27
.3 T
erm
Lo
ans
Faci
lity
Ob
tain
edIn
tere
st r
ate
on
e ye
arw
ith
in
on
e ye
arR
epay
able
af
ter
on
e ye
arB
alan
ce a
s at
3
1 D
ecem
ber
Rep
aym
ent
term
s
Sri l
anka
Tea
Bo
ard
Lo
an
thro
ug
h H
NB
153,
000,
000
AW
PLR+
1.5%
(M
on
thly
Rev
iew
) 15
,362
,201
-15
,362
,201
59 e
qu
al m
on
thly
inst
allm
ent
of R
s 2,
559,
900/
= e
ach
an
d a
fin
al in
stal
lmen
t o
f Rs
. 2,5
62,7
01 c
om
men
cin
g
fro
m 3
1.01
.201
6
Sri l
anka
Tea
Bo
ard
Lo
an28
,000
,000
AW
PLR+
1%
(Mo
nth
ly R
evie
w)
747,
502
-74
7,50
236
eq
ual
mo
nth
ly in
stal
lmen
t o
f Rs
777,
777/
=
Co
mm
enci
ng
fro
m 3
1.08
.201
7
Sri l
anka
Tea
Bo
ard
Lo
an49
,000
,000
5% P
.A P
ayab
le
mo
nth
ly
--
-36
eq
ual
mo
nth
ly in
stal
lmen
t o
f Rs
1,47
0,00
5/=
C
om
men
cin
g fr
om
31.
05.2
017
Hat
ton
Nat
ion
al B
ank
PLC
-Tea
B
oar
d -
Dee
pav
ali
21,1
33,2
00In
tere
st fr
ee L
oan
4,
226,
640
-4,
226,
640
10 e
qu
al m
on
thly
inst
allm
ent
of R
s 2,
113,
320/
=
Co
mm
enci
ng
fro
m 1
0.12
.201
9
20,3
36,3
43-
20,3
36,3
43
Rel
ated
Par
ty L
oan
sM
elst
aco
rp P
LC (R
s.20
0Mn
)20
0,00
0,00
0A
WPL
R+1.
25%
(M
on
thly
Rev
iew
) -
200,
000,
000
200,
000,
000
Cap
ital
to
be
rep
aid
aft
er a
mo
rato
riu
m o
f 03
year
s an
d
inte
rest
pay
able
mo
nth
ly
Mel
stac
orp
PLC
(Rs.
50M
n)
50,0
00,0
00A
WPL
R+1.
25%
(M
on
thly
Rev
iew
) -
50,0
00,0
0050
,000
,000
Cap
ital
to
be
rep
aid
aft
er a
mo
rato
riu
m o
f 03
year
s an
d
inte
rest
pay
able
mo
nth
ly
Mel
stac
orp
PLC
-Sh
ort
Ter
m
Man
agem
ent
Loan
-A
WPL
R+1.
25%
(M
on
thly
Rev
iew
) 40
1,00
6,39
12,
265,
859,
522
2,66
6,86
5,91
3C
apit
al h
as b
een
gra
nte
d fo
r th
e p
urp
ose
of r
efin
anci
ng
th
e w
eekl
y d
efici
t o
f au
ctio
n p
roce
eds
on
th
e b
asis
of
imm
edia
te p
aym
ent
on
dem
and
.
Milf
ord
Exp
ort
s ce
ylo
n P
vt L
td
(Rs.
200M
n)
200,
000,
000
AW
PLR+
1%
(Mo
nth
ly R
evie
w)
44,1
53,8
6244
5,16
0,25
320
0,00
0,00
02,
715,
859,
522
244,
153,
862
3,16
1,01
9,77
5C
apit
al t
o b
e re
pai
d a
fter
a m
ora
tori
um
of 0
3 ye
ars
and
in
tere
st p
ayab
le m
on
thly
Ban
k Lo
ans
Hat
ton
Nat
ion
al B
ank
PLC
400,
000,
000
AW
PLR+
1.5%
(M
on
thly
Rev
iew
) 80
,000
,000
80,0
00,0
0018
0,00
0,00
018
0,00
0,00
026
0,00
0,00
026
0,00
0,00
020
eq
ual
qu
arte
rly
inst
allm
ents
of R
s 20
.0M
n
Co
mm
enci
ng
fro
m 3
0.11
.201
8
Fin
ance
Lea
seC
om
Ban
k Le
ase
& F
inan
ce16
,900
,000
AW
PLR+
1.5%
(M
on
thly
Rev
iew
) 1,
558,
482
1,55
8,48
213
,247
,746
13,2
47,7
4614
,806
,228
14,8
06,2
2896
eq
ual
mo
nth
ly in
stal
lmen
ts o
f Rs
285,
577.
16
Co
mm
enci
ng
fro
m 3
0.06
.201
9
27.
INTE
RES
T B
EAR
ING
LO
AN
S A
ND
BO
RR
OW
ING
S (C
ON
TD)
As
at 3
1st
Dec
emb
er 2
02
0
77

- Annual Report 2020
Notes to the Financial Statements
As at 31st December 2020 2020 2019 Rs. Rs.
28. RETIREMENT BENEFIT OBLIGATIONS Retirement Benefit Obligations 933,488,065 919,415,149 Unclaimed Retiring Gratuity 59,378,459 65,718,983 Total Retirement Benefit Obligations 992,866,524 985,134,132
28.1 The movement in the retirement benefit obligation over the year is as follows:
Balance at the beginning of the year 919,415,149 851,351,100 Interest cost 100,949,134 101,958,645 Current Service Cost 46,705,551 45,722,746 Actuarial (Gain)/ Loss during the year (40,375,212) 38,617,751 1,026,694,622 1,037,650,242 Less: Payments made during the year (93,206,557) (118,235,093) 933,488,065 919,415,149 Unclaimed Retiring Gratuity Balance at the beginning of the year 65,718,983 73,597,424 Less: Payments made during the year (6,340,524) (7,878,441) Total Unclaimed Retiring Gratuity 59,378,459 65,718,983 Balance at the end of the year 992,866,524 985,134,132
28.1.1 Provision recognized in the statement of Profit or Loss Interest cost 100,949,134 101,958,645 Current Service Cost 46,705,551 45,722,746 147,654,685 147,681,391
28.1.2 Provision recognized in the statement of other comprehensive income Actuarial (Gain)/ Loss during the year (40,375,212) 38,617,751 (40,375,212) 38,617,751
As at 31st December 2020 27.4. BANK SECURITIES PLEDGED
Following assets have been pledged as security for liabilities.
Nature of Liability Loan FacilityRs.
Security
Term Loan
Hatton National Bank PLC 400,000,000
a) Existing Registered Primary Floating Mortgage Bond for Rs.160 Mn. Over leasehold property at Verellapatana Estate and everything standing thereon ( Including the existing buildings and /or the buildings which are to be constructed in together with any further developments, modification or alterations thereto) with all fixtures, fittings services.and such other rights attached or appertaining therto.( Mortgaged Property).
b) Existing Primary Floating on the Mortgage Bond for Rs 224.Mn.Over leasehold property at Mahadowa Estate and everything standing thereon (Including the existing buildings and /or the buildings which are to be constructed in together with any further developments, modification or alterations thereto) with all fixtures, fittings services.and such other rights attached or appertaining therto.(Mortgage property.)(Also Secures the existing term loan of Rs 76.8 Mn - granted under special tea relief package).
c) Existing Registered Primary floating Mortgage bond for 150.Mn. over leasehold property at Battawatte Estate and everything standing thereon (Including the existing building and / or the buildings which are to be constructed in together with any further developments, mogifications or alteraions thereto) with all fixtures, fitting services and such other rights attached or appertaining thereto (the Mortaged property).
Hatton National Bank PLC 63,000,000 Existing Corporate guarantee from DCSL for Rs.160 Mn.
Standard Chartered Bank PLC 50,000,000 Corporate Guarantee (Shares of DCSL For Rs 50 Mn)
78

- Annual Report 2020
Notes to the Financial Statements
As at 31st December 2020 28. RETIREMENT BENEFIT OBLIGATIONS (CONTD.)
An actuarial valuation for defined benefit obligation was carried out as at 31 December 2020 by Messrs Actuarial and Management Consultants (Private) Limited, a firm of professional actuaries. The valuation method used by the actuaries to value the obligation is the “Projected Unit Credit Method”, a method recommended by the Sri Lanka Accounting Standard LKAS – 19 “Employee Benefits”.
The Present Value of Retirement Benefit Obligation is carried on annual basis.
The following payments are expected from the defined benefit plan obligation in future years. 2020 2019 Rs. Rs.
Within the next 12 months 183,257,311 113,295,001 Between 1- 2 years 122,447,216 130,773,592 Between 2 and 5 years 170,674,147 178,821,698 Beyond 5 years 516,487,850 562,243,841 992,866,524 985,134,132
The weighted average duration of the Defined Benefit plan obligation at the end of the reporting period is 3.68 years and 8.03 years for staff and workers respectively.
The key assumptions used by Messrs. Actuarial & Management Consultants (Pvt) Ltd include the following.
2020 2019
(i) Rate of Interest 9.00% 11.00% (ii) Rate of Salary Increase Staff (p.a.) 7.50% 7.50% Workers 5.68% 15% (once in 2 years) (iii) Retirement Age Workers 60 years 60 years Staff 58 or 60 years 58 or 60 years (iv) Staff Turnover 10% 10%
In addition to the above, demographic assumptions such as mortality, withdrawal and disability and retirement age were considered for the actuarial valuation. 1949/52 Mortality Table issued by the Institute of Actuaries, London and “A1967/70 Mortality Table” issued by the Institute of Actuaries was used to estimate the gratuity liability of the Company.
Sensitivity Analysis Values appearing in the financial statements are very sensitive to the changes of financial and non financial assumptions used.
The sensitivity was carried for the change of discount rate and salary/wage escalation rate. Simulation made for retirement obligation show that a rise or decrease by 1% of the discount rate and salary/wage has the following effect on the retirement benefit obligation.
Variable Rate of Wage increment (Workers - every two years/ Staff Per annum)
2020 2019 Discount Rate Increase Decrease Increase Decrease
Sensitivity level 1% 1% 1% 1%
Impact on defined benefit obligation Rs. (67,890,639) 78,026,042 (64,094,945) 73,250,490
2020 2019 Future Salary Increment rate Increase Decrease Increase Decrease
Sensitivity level 1% 1% 1% 1%
Impact on defined benefit Obligation Rs. 81,469,827 (71,879,435) 38,148,311 (36,083,793)
79

- Annual Report 2020
Notes to the Financial Statements
As at 31st December 2020 2020 2019 Rs. Rs.
29. DEFERRED TAX Deferred tax assets (Note 29.1) (443,585,429) (458,062,234) Deferred tax liability (Note 29.2) 903,731,594 736,314,868 Net Deferred tax liability 460,146,165 278,252,634
29.1 Deferred tax assets Balance at the Beginning of the year 458,062,234 384,232,229 Originated/ (reversed) during the year-recognized in profit or loss (8,824,275) 68,423,520 Originated during the year recognized in other comprehensive income (5,652,530) 5,406,485 Balance as at 31st December 443,585,429 458,062,234
29.2 Deferred tax liabilities Balance at the Beginning of the year 736,314,868 682,179,793 Originated/ (reversed) during the year-recognized in profit or loss 59,993,390 51,065,836 Originated during the year recognized in other comprehensive income 107,423,336 - Originated during the year recognized in equity - 3,069,239 Balance as at 31st December 903,731,594 736,314,868
29.3 Provision for the year Provision / (Reversal) during the year recognized in Profit/(Loss) 68,817,665 (17,357,685) Provision/(Reversal) during the year recognized in Other Comprehensive Income 113,075,866 (5,406,485) Provision / (Reversal) during the year recognized in Comprehensive Income 181,893,531 (22,764,170)
29.4 Deferred Taxation Reconciliation Deferred tax assets and liabilities are measured based on the tax rates that have been enacted or substantially enacted by the end
of the reporting period. In accordance with the inland Revenue Act No.24 of 2017 effective from 1st April 2018,the company has used effective rate of 14% as at 31st December 2020 (2019-14%)
2020 2019 Temporary Tax Temporary Tax Differences Effect Differences Effect Rs Rs Rs Rs Deferred Tax Liability Temporary difference on PPE 1,874,146,217 262,380,470 957,507,413 134,051,038 Temporary difference on Bearer Biological Assets 777,911,667 108,907,633 725,566,431 101,579,300 Temporary difference on Consumable Biological Assets 3,784,249,791 529,794,972 3,556,150,834 497,861,117 Temporary difference on Produced on bearer Biological Assets 4,671,767 654,047 2,053,351 287,469 Temporary difference on Net Lease Liability 14,246,231 1,994,472 18,113,882 2,535,943 As at 31st December 6,455,225,673 903,731,594 5,259,391,911 736,314,868 Deferred Tax Assets Temporary difference on Provision for doubtful Debts (63,976,287) (8,956,680) (63,976,289) (8,956,680) Temporary difference on retirement benefit obligation (992,866,524) (139,001,313) (985,134,133) (137,918,779) Carried forward tax losses (2,111,624,545) (295,627,436) (2,222,762,679) (311,186,775) As at 31st December (3,168,467,356) (443,585,429) (3,271,873,101) (458,062,234)
As at 31st December 3,286,758,317 460,146,165 1,987,518,810 278,252,633 The deferred tax asset has been recognised in the Financial Statements to the extent of forecasted taxable profit. Therefore, the tax asset arising
from accumulated tax losses carried forward was limited only to the extent of existing temporary differences as at 31st December 2020. The Company expects to generate taxable profit by improving operational performance in the future.
Accordingly a deferred tax assets of Rs. 295,627,436/- hash been recognised on carried forward tax loss of Rs. 2,111,624,545/- as at 31st December 2020. The company has not recognised deferred tax assets amounting to Rs. 255,564,657/- arising on carried forward tax losses amounting to Rs. 1,825,461,834/- as it is not probable that the future taxable profit will be adequate to utilize the available tax losses in the foreseeable future. (2019: Unrecognized deferred tax Rs. 290,454,243/- on Rs. 2,074,673,161/- carried forward tax lossses).
80

- Annual Report 2020
Notes to the Financial Statements
As at 31st December 2020 2019 Rs. Rs.30. DEFERRED GRANTS AND SUBSIDIES
Balance at the beginning of the year 138,072,745 143,390,922 Add: Grants Received during the year - 44,457 138,072,745 143,435,379 Less: Amortization for the year (5,362,631) (5,362,634) Balance at the end of the year 132,710,114 138,072,745
31 NET LIABILITY TO LESSOR OF JEDB/SLSPC ESTATES Gross Liability At the beginning of the year 90,811,832 31,550,440 Impact due to initial application of SLFRS 16 - 59,687,972 Re-measurement of Right-of-Use Asset 1,995,117 - 92,806,949 91,238,412 Interest charges for the year 12,166,078 11,869,649 Payments made during the year (12,629,285) (12,296,229) Total Net Liability 92,343,742 90,811,832
31.1 Leasehold rights can be analysised as follows Amount Payable within One Year 569,187 455,933 Amount Payable after One Year and Less than Five Years 3,151,021 2,704,553 Amount Payable More than Five Years 88,623,534 87,651,346 Total Net Liability 92,343,742 90,811,832 Amounts recognised in statement of profit or loss and other comprehensive income Interest on lease liability 12,166,078 11,869,649 Amortization of Leasehold right to Bare Land of JEDB / SLSPC Estates 4,330,858 4,235,836 Amount recognized in statement of cash flows Total cash outflows for leases 12,629,285 12,296,229 Maturity analysis of contractual undiscounted cash flows Within one year 12,697,620 11,912,064 1-2 years 12,697,620 11,912,064 2-5 Years 50,790,480 35,736,192 More than 5 years 231,731,565 241,219,296
81

- Annual Report 2020
Notes to the Financial Statements
For the year ended 31st December 2020 2019 Rs. Rs.32. TRADE AND OTHER PAYABLES Trade Creditors 120,678,000 63,545,025 Others Creditors 27,673,457 11,726,802 Employee Related Creditors 222,585,576 178,525,630 ESC Payable - 2,604,414 Accrued Expenses 13,389,859 14,990,263 384,326,892 271,392,134
33 AMOUNTS DUE TO RELATED PARTIES Stassen Exports (Pvt) Limited 739,462 551,688 Balangoda Plantations PLC 7,380,788 5,516,875 Distilleries Company of Sri Lanka Limited 45,047,051 45,038,357 Melsta Logistics (Pvt) Ltd. 1,415,541 3,434,720 Belventage Pvt Ltd 3,248,326 2,816,326 Bogo Power (Pvt) Limited 3,033,080 - Melsta Technologies Pvt Ltd. 929,837 227,925 61,794,085 57,585,891
34 CAPITAL COMMITMENTS Capital Commitments as at the reported date Budgeted, but not provided for 237,242,102 104,257,000 Total 237,242,102 104,257,000
35 CONTINGENCIES There have been no contingent liabilities and capital commitments outstanding as at the reporting date.
36 COMPARATIVE INFORMATION Where necessary information has been rearranged to confirm to current year’s presentation and classification.
82

- Annual Report 2020
Notes to the Financial Statements
As at 31st December 2020
37. RELATED PARTY DISCLOSURES The details of the significant related party disclosures are as follows.
37.1 Transactions with the Parent and Related entities.
The related party transactions were made on relevant commercial terms with the respective parties
37.2 Terms and conditions Transactions with related parties are carried out in the ordinary course of business on an relevant commercial terms. Outstanding
balances at the year-end is unsecured and net settlement occurs in cash.
37.3 Non recurrent related party transactions There were no non recurrent related party transactions which in aggregate value exceeds 10% of the equity or 5% of the total
assets whichever is lower of the Company as per 31 December 2020 audited Financial Statements.
37.4 Recurrent related party transactions There were recurrent related party transactions which in aggregate value exceeds 10% of the gross revenue/income of the
Company as per 31 December 2020 audited Financial Statements. Details of related party disclosures are as follows,
Company Relationship Nature ofTransaction
Transaction Amount Balance as at 31 December
2020Rs.
2019Rs.
2020Rs.
2019Rs.
Melstacorp PLC Parent Company Loan & Interest 289,508,307 2,465,854,238 2,666,865,913 2,394,607,859
Settlements 17,250,253 1,225,013,512
Reimbursement of expenses
- 183,729
Other Related Parties
Stassen Exports (Pvt) Ltd
Related Company
Rent of Colombo Office 2,280,000 2,280,000 739,462 551,688
Reimbursement of expenses
11,323,068 18,312
Settlements 13,415,294 2,160,000
Balangoda Plantations PLC
Related Company
Fertilizer supplied - 144,000 7,380,788 5,516,875
Reimbursement of expenses
1,863,913 2,342,746
Fertilizer Received - 160,325
Distilleries Company of Sri Lanka PLC
Related Company
Factory Machinery Purchase
- 795,242 45,047,051 45,038,357
Vehicle expenses 8,694 -
Settlements
Bogo Power (Pvt) Ltd
Related Company
Maintenance expenditure
3,485,653 3,606,277 3,033,080 1,974,242
Rent & Dividend Income
23,812,366 24,106,313
Settlements 32,305,341 25,738,349
Melsta Logistics (Pvt) Ltd
Related Company
Vehicle expenses 1,291,284 6,777,065 1,415,541 3,434,720
Settlements 3,310,463 3,342,346
Milford Exports Ceylon (Pvt) Ltd
Related Company
Loan & Interest 17,820,438 24,500,986 244,153,862 228,235,342
Loan Interest Paid 1,901,918 23,358,082
Melsta Technologies (Pvt) Ltd
Related Company
IT Services 701,912 586,200 929,837 227,925
Settlements 792,275
Continental Insurance lanka Ltd
Related Company
Refunds-Debit Notes 94,720 68,740 - 20,657
Credit Notes 74,063 48,083
83

- Annual Report 2020
Notes to the Financial Statements
37.5 Transactions with the Key Management Personnel of the Company and parent Key management personnel includes members of Board of directors of the company and key employees having authority and
responsibility of planning, directing and controlling the activities of the entity. 2020 2019 Rs. Rs. Short term employment Benefits 7,504,800 6,898,219
37.6 Other Related Party Transactions Guarantees given by Distilleries Company of Sri Lanka PLC on behalf of the Company. * Corporate Guarantee of Rs. 50 Mn. for Standard Chartered Bank overdraft facility * Corporate Guarantee of Rs.160 Mn. for Hatton National Bank overdraft facility 38. RELATED PARTY TRANSACTIONS There are no related party transactions other than those disclosed in Notes 21, 33 & 37 to the Financial Statements.
39. RECONCILIATION OF LIABILITIES ARISING FROM FINANCING ACTIVITIES Sri Lanka Accounting Standard - LKAS 7 (Statement of Cash flows), requires an entity to disclose information that enables users
of Financial Statements to evaluate changes in liabilities arising from financing activities, including both changes arising from cash flows and non-cash changes. Accordingly, changes in liabilities arising from financing activities for the year ended 31st December 2020 are disclosed below.
The funds borrowed by the Company are given in Note 27. 2020 2019 Rs. Rs.
Balance as at 01 January 2020 3,250,217,728 2,115,316,015 Net Cash flows from Financing Activities (44,003,223) 995,985,485 Non Cash Changes 249,947,841 138,916,228 Balance as at 31 December 2020 3,456,162,346 3,250,217,728
40. FINANCIAL RISK MANAGEMENT OBJECTIVES AND POLICIES
40.1 Financial Risk Management Framework The Board of Directors has the overall responsibility for the establishment and oversight of the company’s financial risk
management framework which includes developing and monitoring the company’s financial risk management policies.
The Company’s principal financial liabilities comprise loans and borrowings and trade and other payables. The main purpose of these financial liabilities is to finance the company’s operations. The Company has loan and other receivables, trade and other receivables, and cash and short-term deposits that arrive directly from its operations. Accordingly the Company has exposure to namely Credit Risk, Liquidity Risk, Currency Risk and Interest Rate Risk from its use of financial instruments.
This note presents information about the company’s exposure to each of the above risks, the company’s objectives, policies and processes for measuring and managing risk.
Company Relationship Nature of transaction Amount (Credited)/Debited
2020Rs.
2019Rs.
Melstacorp PLC Parent Company Loans & Interest 289,508,307 2,465,854,238
Revenue as per latest audited financial statements 2,832,067,026 2,006,977,497
Percentage on revenue 10% 123%
Transactions with related parties are carried out in the ordinary course of business on relevant commercial terms.
As at 31st December 2020
37. RELATED PARTY DISCLOSURES (Contd…)
84

- Annual Report 2020
Notes to the Financial Statements
As at 31st December 2020
40.2 Credit Risk This is the risk of financial loss to the company if a customer or counterparty to a financial instrument fails to meet its contractual
obligations, and arise principally from the company’s receivable from customers.
40.2.1 Trade and Other Receivables The Company establishes an allowance for impairment that represents its estimate of incurred losses in respect of trade and
other receivables. The Company has a minimal credit risk of its trade receivables as the repayment is guaranteed within seven working days by
the Tea auction systems.
40.2.2 Cash and Cash Equivalents The Company held cash and Cash Equivalents of Rs.27.4 Mn as at 31st December 2020 (2019 – Rs. 47.5 Mn) which represents
its maximum credit exposure on these assets.
40.3 Liquidity Risk Liquidity risk is the risk that the company will encounter difficulty in meeting the obligations associated with its financial
liabilities that are settled by delivering cash or another financial asset. The Company’s approach to managing liquidity is to ensure, as far as possible, that it will always have sufficient liquidity to meet its liabilities when due, under both normal and stressed conditions, without incurring unacceptable losses or risking damage to the Company’s reputation.
The Company does not concentrate on a single financial institution, thereby minimizing the exposure to liquidity risk through
diversification of funding sources. The Company aims to fund investment activities by funding the long-term investment with long term financial sources and short term investment with short term financing.
The Table below summarizes the maturity profile of the company financial liabilities based on contractual undiscounted
payments.
Carrying Contractual On Less than 3 to 12 2 to 5 > 5 Amount Cash flows Demand 3 Months Months years years
Rs. Rs. Rs. Rs. Rs. Rs. Rs.
As at 31st December 2020 Interest bearing loans & borrowing 3,456,162,346 3,456,162,346 - 136,763,789 410,291,308 2,909,107,267 - Trade & other payables 384,326,892 384,326,892 384,326,892 - - - - Amount due to related companies 61,794,085 61,794,085 61,794,085 - - - - Bank Overdraft 101,677,971 101,677,971 101,677,971 - - - - Lease liability to SLSCC and JEDB 92,343,742 307,917,285 - 3,174,405 9,523,215 63,488,100 231,731,565 4,096,305,036 4,311,878,579 547,798,948 139,938,174 419,814,523 2,972,595,367 231,731,565 As at 31st December 2019
Interest bearing loans & borrowing 3,250,217,728 3,250,217,728 - 35,611,574 302,047,135 2,912,559,019 - Trade & other payables 271,392,134 271,392,134 271,392,134 - - - - Amount due to related companies 57,585,891 57,585,891 - - 57,585,891 - - Bank Overdraft 27,931,815 27,931,815 27,931,815 - - - - Lease liability to SLSCC and JEDB 90,811,832 300,779,616 - 2,978,016 8,934,048 35,736,192 253,131,360 3,697,939,400 3,907,907,184 294,323,949 38,589,590 368,567,074 2,948,295,211 253,131,360
85

- Annual Report 2020
Notes to the Financial Statements
As at 31st December 2020
40.4 Market Risk Market risk is the risk that the fair value or future cash flows of a financial instrument will fluctuate because of changes in
market prices. Market prices comprise four types of risk, currency risk interest rate risk & other price risk such as equity price risk. Financial instrument affected by market risk include loans & borrowings, deposits & derivative financial instruments.
40.4.1 Currency Risk
The Company exposed to currency risk only on purchases that are denominated in a currency other than Sri Lankan Rs. (LKR). The foreign currencies in which these transaction primarily denominated are United Stated Dollar. (USD)
Since the frequency of the transaction done in foreign currencies is very low, the company is not export to a higher degree of currencies risk.
40.4.2 Interest Rate Risk
Interest rate risk is the risk that the fair value or future cash flows of a financial instrument will fluctuate because of changes in market interest rates. The Company’s exposure to the risk of changes in market interest rates relates primarily to the Company’s long-term debt obligations with floating interest rates. The Company manages its interest rate risk by having a balanced portfolio of fixed and variable rate loans and borrowings.
The Company held long term borrowings with floating interest rates of Rs. 3.5 Bn. (2019 – Rs. 3.2 Bn.) which represents its maximum credit exposure on these liabilities.
The following table demonstrate,the sensitivity to a reasonably possible change in interest on that portion of loans and borrowings affected.With all other variables held constant,the company’s Profit Before Tax is affected through the impact on floating rate borrowings as follows.
Increase/ Effect on decrease in Profit Before Interest rate Tax Company % Rs. 000
2020 1% (30,760,709) -1% 30,760,709 2019 1% (28,557,599) 1% 28,557,599
40.4.3 Capital Management The Company’s policy is to retain a strong capital base so as to maintain investor, creditor & market confidence and to sustain
future development of the business. Capital consists of share capital, reserves and retain earning. The Board of Directors monitors the return on capital, interest covering ratio, dividend to ordinary shareholders.
The gearing ratio at the reporting date is as follows.
As at As at 31.12.2020 31.12.2019 Rs. Rs.
Interest bearing borrowing Total Liabilities 5,682,027,839 5,099,398,912 Less: Cash and cash equivalents (27,432,637) (47,533,164) Net Debt 5,654,595,202 5,051,865,748 Equity 1,441,280,352 947,909,464 Gearing ratio 3.92 5.33
41. FAIR VALUE OF FINANCIAL INSTRUMENTS
The Company measures fair values using the following fair value hierarchy that reflects the significance of the inputs used in making the measurements.
Level 1 : Quoted market price (unadjusted) in an active market for an identical instrument.
Level 2 : Valuation techniques based on observable inputs, either directly – i.e. as prices or indirectly – i.e. derived from prices. This category includes instruments valued using: quoted market prices in active markets for similar instruments; quoted prices for identical or similar instruments in markets that are considered less than active; or other valuation techniques where all significant inputs are directly or indirectly observable from market data.
Level 3 : Valuation techniques using significant unobservable inputs. This category includes all instruments where the valuation technique includes inputs not based on observable data and the unobservable inputs have a significant effect on the instrument’s valuation. This category includes instruments that are valued based on quoted prices for similar instruments where significant unobservable adjustments or assumptions are required to reflect differences between the instruments.
86
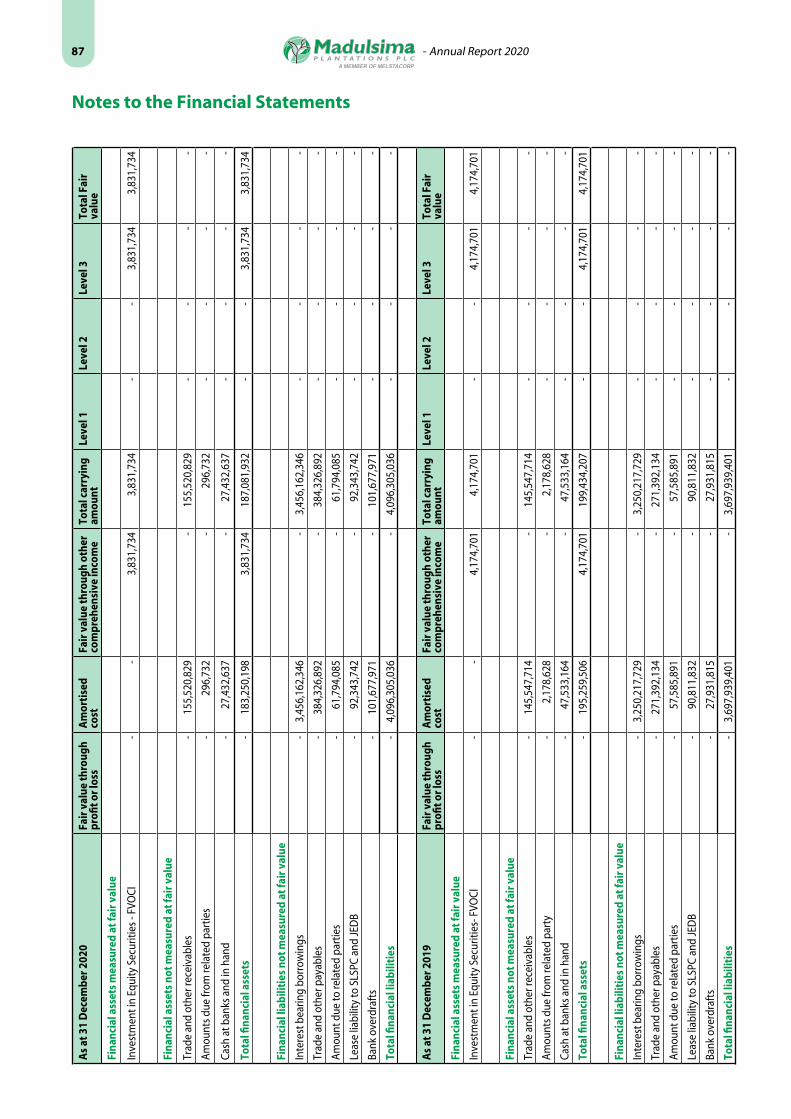
- Annual Report 2020
Notes to the Financial StatementsA
s at
31
Dec
embe
r 202
0Fa
ir v
alue
thro
ugh
profi
t or l
oss
Am
orti
sed
cost
Fair
val
ue th
roug
h ot
her
com
preh
ensi
ve in
com
eTo
tal c
arry
ing
amou
ntLe
vel 1
Leve
l 2Le
vel 3
Tota
l Fai
r va
lue
Fina
ncia
l ass
ets
mea
sure
d at
fair
val
ue
Inve
stm
ent i
n Eq
uity
Sec
uriti
es -
FVO
CI-
-3,
831,
734
3,83
1,73
4-
-3,
831,
734
3,83
1,73
4
Fina
ncia
l ass
ets
not m
easu
red
at fa
ir v
alue
Trad
e an
d ot
her r
ecei
vabl
es-
155,
520,
829
-15
5,52
0,82
9-
--
-
Am
ount
s du
e fr
om re
late
d pa
rtie
s-
296,
732
-29
6,73
2-
--
-
Cash
at b
anks
and
in h
and
-27
,432
,637
-27
,432
,637
--
--
Tota
l fina
ncia
l ass
ets
-18
3,25
0,19
83,
831,
734
187,
081,
932
--
3,83
1,73
43,
831,
734
Fina
ncia
l lia
bilit
ies
not m
easu
red
at fa
ir v
alue
Inte
rest
bea
ring
borr
owin
gs-
3,45
6,16
2,34
6-
3,45
6,16
2,34
6-
--
-
Trad
e an
d ot
her p
ayab
les
-38
4,32
6,89
2-
384,
326,
892
--
--
Am
ount
due
to re
late
d pa
rtie
s-
61,7
94,0
85-
61,7
94,0
85-
--
-
Leas
e lia
bilit
y to
SLS
PC a
nd JE
DB
-92
,343
,742
-92
,343
,742
--
--
Bank
ove
rdra
fts
-10
1,67
7,97
1-
101,
677,
971
--
--
Tota
l fina
ncia
l lia
bilit
ies
-4,
096,
305,
036
-4,
096,
305,
036
--
--
As
at 3
1 D
ecem
ber 2
019
Fair
val
ue th
roug
h pr
ofit o
r los
sA
mor
tise
d co
stFa
ir v
alue
thro
ugh
othe
r co
mpr
ehen
sive
inco
me
Tota
l car
ryin
g am
ount
Leve
l 1Le
vel 2
Leve
l 3To
tal F
air
valu
e
Fina
ncia
l ass
ets
mea
sure
d at
fair
val
ue
Inve
stm
ent i
n Eq
uity
Sec
uriti
es- F
VOCI
--
4,17
4,70
14,
174,
701
--
4,17
4,70
14,
174,
701
Fina
ncia
l ass
ets
not m
easu
red
at fa
ir v
alue
Trad
e an
d ot
her r
ecei
vabl
es-
145,
547,
714
-14
5,54
7,71
4-
--
-
Am
ount
s du
e fr
om re
late
d pa
rty
-2,
178,
628
-2,
178,
628
--
--
Cash
at b
anks
and
in h
and
-47
,533
,164
-47
,533
,164
--
--
Tota
l fina
ncia
l ass
ets
-19
5,25
9,50
64,
174,
701
199,
434,
207
--
4,17
4,70
14,
174,
701
Fina
ncia
l lia
bilit
ies
not m
easu
red
at fa
ir v
alue
Inte
rest
bea
ring
borr
owin
gs-
3,25
0,21
7,72
9-
3,25
0,21
7,72
9-
--
-
Trad
e an
d ot
her p
ayab
les
-27
1,39
2,13
4-
271,
392,
134
--
--
Am
ount
due
to re
late
d pa
rtie
s-
57,5
85,8
91-
57,5
85,8
91-
--
-
Leas
e lia
bilit
y to
SLS
PC a
nd JE
DB
-90
,811
,832
-90
,811
,832
--
--
Bank
ove
rdra
fts
-27
,931
,815
-27
,931
,815
--
--
Tota
l fina
ncia
l lia
bilit
ies
-3,
697,
939,
401
-3,
697,
939,
401
--
--
87

- Annual Report 2020
Notes to the Financial Statements
42. EVENTS AFTER THE REPORTING DATE
42.1 Increase of Daily wage rate of Plantation Workers
In the past wages of the Plantation workers were negotiated between Trade Unions and Regional Plantation Companies (RPCs), once in every two years and a Collective Agreement was signed between the parties. However, the last wage negotiations between the parties were not successful and therefore, the matter was referred to the Wages Board by the Minister of Labour. Consequently, The Wages Board without considering objections of the RPC’s decided the minimum daily wage of Rs. 1,000/- comprising of a minimum daily wage of Rs. 900/- and a budgetary relief allowance of Rs. 100/- for workers in tea and rubber growing and manufacture trade and gazetted its decision on 05th March 2021.
However, RPCs instituted a “Writ Application” in the Court of Appeal seeking an interim order, staying and/or suspending the operation of the decision of the Wages Board, but the Honorable Judges of the Court of Appeal issued notice on the Respondents of the case and was not inclined to issue an interim order and the Respondents were directed to file Objections and RPCs were directed to file Counter Objections. The matter was taken for argument at the Court of Appeal on 05th May 2021, counsel for RPCs conducted his oral submission. The matter was postponed for respondent’s submissions to 31st May 2021.
As this matter is under the purview of the Court of Appeal at the time of approval of these financial statements, the Board of Directors of the Company concurred with the independent legal experts and decided to continue using the same daily wage rate used in the previous year for the estimation of the benefits to be paid as gratuity at retirement in the calculation of Retirement Benefit Obligations as at 31st December 2020.
The retirement benefit obligations of plantation workers considering the daily wage rate of Rs. 1,000 is Rs. 1,305 Mn. as at 31st December 2020.
Subsequent to the reporting period, no circumstances have arisen which would require adjustments to or disclosures in the financial statements other than above.
43 IMPACT OF COVID 19 ON THE FINANCIAL STATEMENTS
On 11th March 2020, the World Health organization declared the coronavirus outbreak as a pandemic. Responding to the potentially serious threat the COVID – 19 presents to the public health, the Sri Lankan Government authorities have taken measures to contain the outbreak, including introducing restrictions on the cross border movement of people, entry restriction of foreign visitors and the ‘lock-down’ of certain areas in the Country.
The Company has taken various precautionary measures to protect employees and workmen, their families, and the eco system in which they interact, while at the same time ensuring business continuity. As a step in this direction and taking into account the directives issued by the Government of Sri Lanka, the Company has carried out operations in limited manner during the lock down period. Further, deferment of Capital expenditures, cancellation of company events, restructuring of overhead, deferment of staff bonus payments, reduction salaries senior management during the period were several measures taken by the Company to conserve cash during the lock down period.
The company has been closely monitoring the impact of COVID 19 on the business operations. Despite many challenges, the company being in essential service sector has recommenced all operations which were temporally suspended on 20th March 2020 and have been operational at a reduced scale based on curfew timelines in certain zones. The company is regularly monitoring the situation and operations are being increased up to full capacity level in a phased manner.
The Board of Directors has carries out a preliminary assessment over future business plan after incorporating the potential impact of COVID 19 outbreak, and is of the view that the COVID 19 outbreak may not have significant impact on the business continuity of the company. The Board will continue to monitor the economic conditions and its impact on the business operations and take mitigation actions to minimize the potential impacts and business continuity.
88
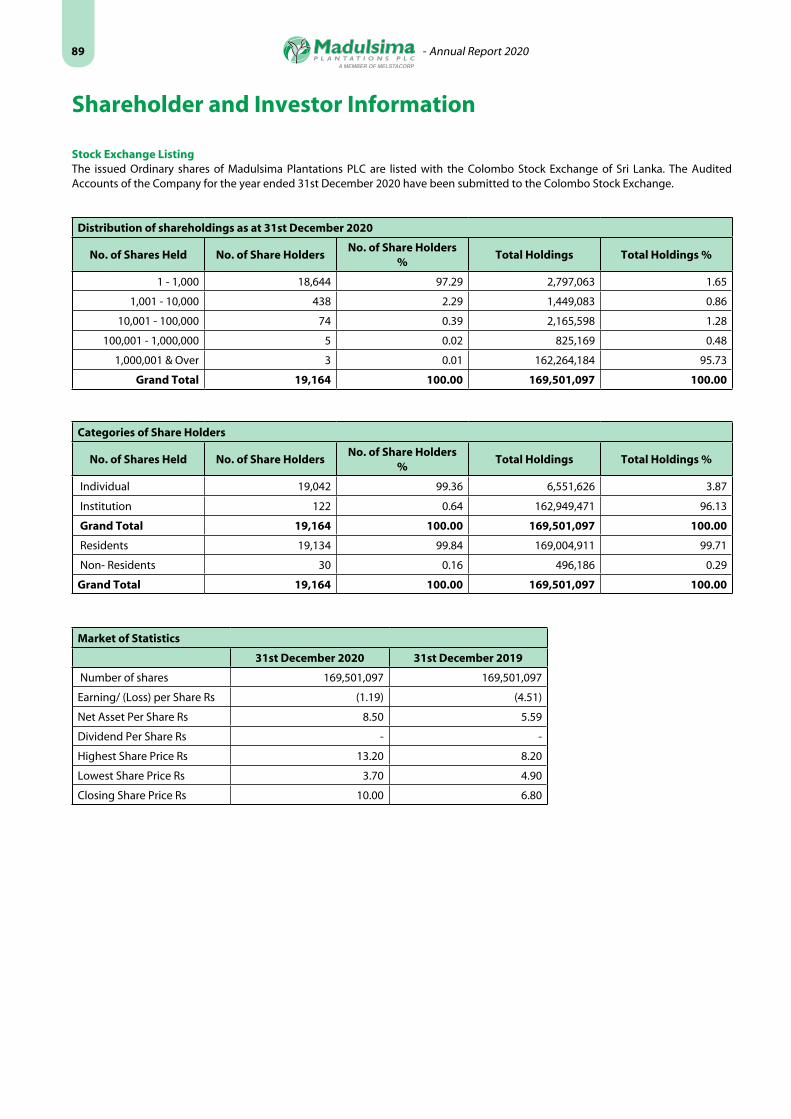
- Annual Report 2020
Shareholder and Investor Information
Stock Exchange ListingThe issued Ordinary shares of Madulsima Plantations PLC are listed with the Colombo Stock Exchange of Sri Lanka. The Audited Accounts of the Company for the year ended 31st December 2020 have been submitted to the Colombo Stock Exchange.
Distribution of shareholdings as at 31st December 2020
No. of Shares Held No. of Share HoldersNo. of Share Holders
%Total Holdings Total Holdings %
1 - 1,000 18,644 97.29 2,797,063 1.65
1,001 - 10,000 438 2.29 1,449,083 0.86
10,001 - 100,000 74 0.39 2,165,598 1.28
100,001 - 1,000,000 5 0.02 825,169 0.48
1,000,001 & Over 3 0.01 162,264,184 95.73
Grand Total 19,164 100.00 169,501,097 100.00
Categories of Share Holders
No. of Shares Held No. of Share HoldersNo. of Share Holders
%Total Holdings Total Holdings %
Individual 19,042 99.36 6,551,626 3.87
Institution 122 0.64 162,949,471 96.13
Grand Total 19,164 100.00 169,501,097 100.00
Residents 19,134 99.84 169,004,911 99.71
Non- Residents 30 0.16 496,186 0.29
Grand Total 19,164 100.00 169,501,097 100.00
Market of Statistics
31st December 2020 31st December 2019
Number of shares 169,501,097 169,501,097
Earning/ (Loss) per Share Rs (1.19) (4.51)
Net Asset Per Share Rs 8.50 5.59
Dividend Per Share Rs - -
Highest Share Price Rs 13.20 8.20
Lowest Share Price Rs 3.70 4.90
Closing Share Price Rs 10.00 6.80
89

- Annual Report 2020
Shareholder and Investor Information
Twenty Five Major Shareholders as at 31st December 2020
No Name No. of Shares %
1 Melstacorp PLC 94,767,483 55.910
2 Stassen Exports (Pvt) Limited 63,696,701 37.579
3 Secretary to the Treasury 3,800,000 2.242
4 Mrs. J. K. P. Singh 260,851 0.154
5Deutsche Bank AG Singapore A/C 2 (DCS CLT ACC For Deutsche Bank AG Singapore - PWM WM Client)
149,090 0.088
6 Mr. S. Gobinath 125,000 0.074
7 Dr. M. K. S. Hapuarachchi 122,476 0.072
8 Mr. W. Ajith Kumara 93,000 0.055
9 Merchant Bank of Sri Lanka & Finance PLC/W B R Somaweera 85,500 0.050
10 Mr. T. D. P. Maduranga 80,395 0.047
11 Mr. R. A. P. Jayawardena 69,295 0.041
12 Mrs. M. De Zoysa 67,101 0.040
13 Mr. R. E. Rambukwelle 63,100 0.037
14 Mr. R. Kuhan 55,250 0.033
15 Mr. P. H. Pilana Godakandage 55,000 0.032
16 Mr. G. V. Sanjaya 50,161 0.030
17 Mr. Z. G. Carimjee 50,000 0.029
18 Mr. D. C. Hemapala 50,000 0.029
19 Mr. K. K. P. Ranga 44,873 0.026
20 Mrs. H. R. P. Sanjeevani 44,511 0.026
21 Gampaha District Co-Operative Rural Bank Union Ltd 43,900 0.026
22 Dr. G. S. Perera 41,200 0.024
23 Hatton National Bank PLC/Ravindra Erle Rambukwelle 40,000 0.024
24 Mr. S. Nitharshan 40,000 0.024
25 Mrs. T. S. Perera 39,563 0.023
163,934,450 96.716
Other 5,566,647 3.284
Total 169,501,097 100.000
The Percentage of ordinary shares held by the public was 6.51% (2019 - 6.51%) of the issued share capital as at 31st December 2020.
Total number of shareholders representing the public holds are 19,234.
The float adjusted market capitalization as at 31st December 2020 is Rs. 110,354,910.00
The float adjusted Market Capitalization of the company falls under Option 05 of Rule 7.13.1 (a) of the Listing Rules of the Colombo Stock Exchange and the company has compiled with the minimum public holdings requirement applicable under the said option
90

- Annual Report 2020
Statement of Value Addition
Performance of Estates 2020 and 2019
Estate Elevation Year Tea Extent ha Total Crop kg Yield kg/ha COP Rs/kg NSA Rs/kg *
Battawatte Uva High2020 209 554,620 1,054 591.43 539.20
2019 217 345,199 824 650.77 434.52
Cocogalla Uva High2020 146 244,653 816 640.36 523.63
2019 148 97,192 648 909.59 415.08
El Teb Uva Medium2020 320 703,660 1,208 585.13 555.54
2019 326 534,996 911 643.49 498.01
Galloola Uva High2020 120 111,319 931 612.40 546.26
2019 122 75,310 617 711.33 503.80
Mahadowa Uva High2020 439 594,714 903 636.10 512.50
2019 461 499,054 731 677.82 477.31
Roeberry Uva Medium2020 425 646,629 1,098 628.46 498.04
2019 435 534,297 747 718.51 414.84
Uvakellie Uva High2020 173 181,491 1,044 533.51 540.71
2019 179 146,499 812 640.19 501.85
Verellapatna Uva High2020 227 625,930 1,786 518.41 535.71
2019 231 436,321 1,136 628.43 455.46
Kew Western High2020 321 315,886 976 813.27 571.77
2019 324 311,305 962 829.73 501.44
Kirkoswald Western High2020 487 509,393 1,002 865.11 567.63
2019 487 567,763 1,137 809.35 488.97
Theresia Western High2020 299 283,051 948 795.33 546.73
2019 315 312,958 994 777.39 452.35
Venture Western High2020 243 312,865 1,243 667.14 567.79
2019 259 258,464 998 794.00 445.74
Company2020 3,408 5,084,211 1,077 649.46 539.11
2019 3,505 4,119,358 900 720.37 464.90
Year ended 31.12.2020 Year ended 31.12.2019
% Rs.’000 % Rs.’000
REVENUE - 2,832,067 - 2,006,977
Other Income - 46,085 - 67,697
Total Revenue - 2,878,152 - 2,074,674
Cost Of Materials and Services Bought - 1,059,662 - 1,037,730
Value Addition 100 1,813,719 100 1,036,944
DISTRIBUTION OF VALUE ADDITION
A To Employee as Remuneration 88 1,593,963 124 1,290,586
B To Government as taxes - - 7 71,586
C To Lenders of Capital as Interest 18 318,187 33 345,869
D To Shareholders as Dividends - - - -
E Retained in Business - - - -
E1 Provision for Depreciation 6 102,464 9 92,612
E2 Profit /(Loss) Retained (11) (200,895) (74) (763,709)
100 1,813,719 100 1,036,944
91

- Annual Report 2020
Financial Information
2020Rs.’000
2019Rs.’000
2018Rs.’000
2017Rs.’000
2016Rs.’000
Revenue 2,832,067 2,006,977 2,144,945 2,605,104 1,842,069
Profit before Income Tax Expense (132,077) (781,066) (425,166) 108,658 (286,701)
Income Tax Expense (68,818) 17,358 (175,033) (64,062) (5,885)
Profit after Income Tax Expense (200,895) (763,709) (600,199) 44,596 (292,586)
Profit/(Loss) brought forward (4,693,769) (3,740,607) (2,900,407) (2,817,538) (2,562,132)
Dividend - - - - -
Retained Earnings/(Loss) (5,077,361) (4,693,769) (3,740,607) (2,900,407) (2,817,538)
Non Current Assets 6,571,936 5,596,438 5,296,897 4,913,935 4,812,151
Current Assets 551,372 450,870 464,535 343,831 437,507
Current Liabilities 1,095,423 695,024 643,483 1,285,338 1,614,397
Deferred Income 132,710 138,073 143,390 148,546 152,911
Non Current Liabilities 4,586,605 4,404,374 3,313,878 1,373,900 1,007,341
Net Assets 1,441,280 947,909 1,804,071 2,449,982 2,474,960
Share Capital 1,624,761 1,624,761 1,624,761 1,624,761 1,624,761
Timber Reserve 3,594,121 3,376,701 3,220,459 3,063,430 2,933,813
Revaluation Reserve 1,297,144 637,258 637,257 659,258 731,341
Retained Profit/(Loss) (5,077,361) (4,693,769) (3,681,606) (2,900,407) (2,817,538)
Fair Value through OCI reserve 2,616 2,959 3,199 2,940 2,583
Share Holders' Funds 1,441,280 947,909 1,804,072 2,449,982 2,474,960
Number of Shares ('000) 169,501 169,501 169,501 169,501 169,501
Earning/(Loss) per Share (Rs) (1.19) (4.51) (3.54) 0.26 (1.73)
Dividend per Share (Rs) - - - - -
Net Assets per Share (Rs) 8.50 5.59 10.64 14.45 14.60
District Wise Performance
2020 2019 2018 2017 2016
Total Production Kgs.
Madulsima 3,663,016 2,668,868 2,750,106 3,105,439 3,023,199
Bogawantalawa 1,421,195 1,450,490 1,394,128 1,306,877 1,452,012
Total 5,084,211 4,119,358 4,144,234 4,412,315 4,475,210
Estate Crop Kgs
Madulsima 2,285,484 1,718,233 1,653,172 1,798,370 1,829,367
Bogawantalawa 1,386,475 1,435,694 1,371,986 1,274,860 1,452,012
Total 3,671,959 3,154,197 3,025,158 3,073,229 3,281,380
Yield Kg/ha
Madulsima 1,110 810 765 831 842
Bogawantalawa 1,027 1,037 973 903 1,025
Total 1,077 900 847 860 914
COP Rs/kg
Madulsima 592.57 674.83 626.16 552.40 466.01
Bogawantalawa 796.11 804.17 771.30 708.76 628.86
Total 649.46 720.37 679.75 623.44 524.13
NSA Rs/kg *
Madulsima 528.97 458.98 519.19 546.50 521.01
Bogawantalawa 564.64 476.18 556.14 580.53 440.60
Total 539.11 464.90 531.59 572.39 426.67
Profit/(Loss) Rs/kg *
Madulsima (63.60) (215.85) (106.97) (5.90) (55.00 )
Bogawantalawa (231.47) (327.99) (215.16) (128.23) (188.26)
Total (110.35) (255.47) (148.16) (51.05) (97.46)
92

- Annual Report 2020
Notes
93

- Annual Report 2020
Form of Proxy
I/We……………………………………………………….………………………………….………………………………………………
of……………………………………….………………………………….………………….………………….being a member /members
of Madulsima Plantations PLC hereby appoint…………………………………….of………………………………………. whom failing.
Don Harold Stassen Jayawardena or failing himNoor Mohamed Abdul Gaffar or failing himDon Hasitha Stassen Jayawardena or failing himArinesarajah Shakthevale or failing himD S Kamantha Amarasekera or failing him
as my/our proxy to represent me/us and*……… ………………………………………………….. to vote on my/our behalf at the Twenty Eighth (28th) Annual General Meeting of the Company will be held as a “Virtual Meeting” at 10.00 a.m. on Thursday, 29th July 2021, at the “Mini Auditorium” DCSL, 110, Norris Canal Road, Colombo 10, Sri Lanka and at any adjournment thereof and at every poll which may be taken in consequence of the above said meeting. I/We the undersigned hereby authorize my/our Proxy to vote on my/our behalf in accordance with the preference indicated below:
² Please delete the inappropriate words
1) To receive and consider the Report of the Directors and the Financial Statements of the Company for the year ended 31st December 2020 together with the Auditors’ Report thereon
2) To re-elect Mr D H S Jayawardena who is above the age of 70 years as a Director of the Company in terms of Sections 210 and 211 of the Companies Act No. 7 of 2007.
3) To re-elect Dr N M Abdul Gaffar who is above the age of 70 years as a Director of the Company in terms of Sections 210 and 211 together of the Companies Act No. 7 of 2007.
4) To re-elect Dr A Shakthevale who is above the age of 70 years as a Director of the Company in terms of Sections 210 and 211 of the Companies Act No. 7 of 2007.
5) To re-elect Mr D S K Amarasekera who retires by rotation at the Annual General Meeting In terms of Article 92 of the Articles of Association as a Director of the Company
6) To authorize the Directors to determine the remuneration of the Auditors, Messrs KPMG who are deemed to have been reappointed as Auditors in terms of Section 158 of the Companies Act No.07 of 2007.
7) To pass the following special resolution to amend the Articles of Association by including No. 52 (a) immediately after the existing Article 52 of the Articles of Association as follows :
52. (a) “Notwithstanding any provision in this Articles suggesting the contrary, a meeting of Shareholders may be held by means of Audio or Audio visual communication by which all shareholders participating and constituting quorum can simultaneously hear each other throughout the meeting or by any means of virtual meeting whereby shareholders regardless of their location could connect or linkup online through Video/Audio/Text”.
Signed on this …..............................................day of ….................................................Two Thousand and Twenty one.
……………………………Signature/s
For Against
94

- Annual Report 2020
INSTRUCTIONS FOR COMPLETION OF FORM OF PROXY
1. Kindly perfect the Form of Proxy by filling in the mandatory details required above, signing in the space provided and filling in the date of signature.
2. If the Form of Proxy is signed by an Attorney, the relative power of attorney should also accompany the proxy form for registration, if such power of attorney has not already been registered with the Company.
3. In the case of a Company/Corporation, the Form of Proxy shall be executed in the manner specified in the Articles of Association.
4. In the absence of any specific instructions as to voting, the proxy may use his/her discretion in exercising the vote on behalf of his appointor.
5. Duly filled Forms of Proxy should be sent to reach the Company Secretary via e-mail to [email protected], or facsimile on +94 11 2540333 or by post to the registered address of the Company, Madulsima Plantations PLC. # 833, Sirimavo Bandaranaike Mawatha, Colombo 14, Sri Lanka not less than forty eight (48) hours before the time fixed for the meeting.
Please provide the following details (mandatory):
NIC/PP/Company Registration No. of the Shareholder/s : …………………………………………………………….…………
Folio No : …………………………………………………………….…………
E.mail address of the Shareholder/(s) or proxy holder
(other than a Director appointed as proxy) : …………………………………………………………….…………
Mobile No : …………………………………………………………….…………
Fixed Line : …………………………………………………………….…………
95

Annual Report 2020
MADULSIMA PLANTATIONS PLC
833, Sirimavo Bandaranayaike Mawatha, Colombo - 14 TEL : +94552226115 / FAX : +94552226292
E MAIL : [email protected]/our-core-sectors/plantation-services