madis: a multimedia-aided disaster information …chens/pdf/collaboratecom2012.pdfmadis: a...
TRANSCRIPT

MADIS: A Multimedia-Aided Disaster InformationIntegration System for Emergency ManagementYimin Yang, Wenting Lu, Jesse Domack, Tao Li, Shu-Ching Chen, Steven Luis, Jainendra K Navlakha
School of Computing and Information SciencesFlorida International University
Miami, FL 33199, USA{yyang010, wlu, jdoma001, taoli, chens, luiss, navlakha}@cs.fiu.edu
Abstract—With the proliferation of smart devices, disasterresponders and community residents are capturing footage,pictures and video of the disaster area with mobile phones andwireless tablets. This multimedia disaster situation informationis critical for assisting emergency management (EM) personnelto effectively respond in a timely manner. Currently, howeverthe data is not integrated in incident command systems wheresituation reports, incidence action plans, etc. are being held.Therefore, we have designed and developed a Multimedia-Aided Disaster information Integration System (MADIS), whichutilizes advanced data mining techniques to analyze situationreports and pictures as well as text captured in the field andautomatically link the reports directly to relevant multimediacontent. Specifically, a dynamic hierarchical image classificationapproach is proposed to categorize disaster images into differentsubjects by fusing image and text information. Situation reportsare analyzed using advanced document processing techniquesand then associated with processed multimedia data. In order toseamlessly incorporate user interactive activities for improvinginformation integration, a user feedback processing scheme isproposed to refine the association between situation reports andimages as well as the affinity among images. The system isdeveloped on Apple’s mobile operating system (iOS) and runs oniPad tablets, and its usefulness is evaluated by domain expertsfrom the local EM department.
Index Terms—Multimedia, disaster information management,emergency management, mobile application, hierarchical classi-fication.
I. INTRODUCTION
In recent years, disasters such as hurricanes and earthquakeshave caused huge damages in terms of both property lossand human lives. In 2005, hurricane Katrina reported a totalproperty damage of $81 billion. Thousands of people died inthe actual hurricane and in subsequent floods. In 2010, theHaiti earthquake affected billions of people, and an estimated550,000 buildings collapsed or were severely damaged. Inorder to reduce such loss, emergency managers are requiredto not only be well prepared but also provide rapid responseactivities [1].
For fulfilling a response plan in a disaster event, emergencymanagement (EM) personnel should integrate jurisdictionalresources, coordinate multi-agency responses, and establishexecuting processes among the EM community. However,currently decision makers responsible for emergency responsesrely mostly on situation reports, which are usually textual
description of the disaster scene. The limitation of plaintextual information provided by situation reports lowers theefficiency of assessing the disaster situation; hence the urgentneed of additional multimedia information, such as picturesand videos taken at the disaster scene, for enhancing thetext-based reports and providing more details of the disasterevent. A system that integrates multi-source information suchas textual reports and multimedia data would greatly assistemergency managers in making a better assessment of adisaster situation and performing efficient and timely responsescorrespondingly. Furthermore, due to its portable and ease-of-use characteristics [2], mobile devices have been proven to bea must-have utility in disaster management areas, especiallywhen considering quick emergency response.
In this paper, built on our previous work [3], [4], wehave designed and developed a Multimedia-Aided Disasterinformation Integration System (MADIS) that semanticallyassociates situation reports with disaster-related multimediadata and is implemented within an iPad-specific applicationthat conveys all such information via a unified and intuitivegraphical interface. The mobility of the iPad device providesthe EM personnel with free and fast interaction in communi-cating between both the command centers and the actual disas-ter sites. Compared with the original prototype, the advancedsystem has improved from both back-end techniques andfront-end user experience perspectives. Specifically, a dynamicweighting scheme is introduced for automatically integratingmulti-source multimedia information; a more comprehensiveuser feedback mechanism is designed for improving integra-tion results; user interfaces are refined and more functionalitiesare included for better user experiences. The proposed MADISsystem tries to solve the following problems and challenges:
• Classification of images into different subjects by fusingimage and text information: Images taken at disasterscenes usually come along with descriptive informationwhich is of great help for better understanding of theimagery data. However, how to effectively fuse textinformation with visual data for identifying the subjectsin images is a challenging problem. In order to solvethis issue, a dynamic hierarchical classification mecha-nism is proposed to classify images into various subjects

using semantic analysis techniques based on MultipleCorrespondence Analysis (MCA) [5] and a self-adaptiveweighting scheme for information fusion.
• Associating situation reports with classified images:After the images have been properly classified, the nextproblem is how to analyze the situation reports and buildthe relationship between the report and multimedia data.An intuitive solution is to identify the same subjectsas assigned to the images. For solving this problem,advanced text and document processing techniques suchas GATE [6] system and WordNet [7] are utilized to ana-lyze and extract location and subject-related information,which is further used to build the association betweensituation reports and classified images.
• Incorporating user feedback for better association: Userfeedback plays an important role in refining data integra-tion results and helps to improve the system and providebetter services. There are different types of feedbackregarding the targeted resources. For example, users maynot only show interest in the relationship between imagesand reports but also in the affinities among images. Inour proposed system, a comprehensive user feedbackprocessing mechanism is presented to refine both report-image association and image-image affinity based on theMarkov Model Mediator (MMM) [8] mechanism inspiredby the Markov model theory [9].
The rest of the paper is organized as follows. Section 2presents the overview of MADIS. Section 3 discusses thedynamic hierarchical image classification based on MCA indetail. Section 4 describes the document processing procedureand how to associate classified images with situation report.Section 5 discusses the incorporation of user feedback forbetter association. Section 6 describes the system evaluation.Finally, section 7 concludes the paper.
II. MADIS OVERVIEW
MADIS is a multi-source information integration frameworkdesigned and developed on mobile platform for enhancingsituation report and enabling quick emergency response. Thesystem adopts advanced data mining techniques for mul-timedia content analysis and document processing, whichsemantically associates situation reports with multimedia data.The developed iPad application provides the EM personnelwith an intuitive and interactive solution for fast and efficientdisaster situation assessment.
As depicted in Figure 1, MADIS takes as input images,text, situation reports, and user feedback for multi-sourceinformation integration and renders a user-friendly mobileplatform for effective and timely emergency responses. Tofuse image and textual information for image classification, thesystem performs multimedia analysis based on the collecteddata and categorizes the images into different subjects viaa hierarchical structure and dynamic weighting schema. Atthe same time, document analysis is conducted upon thesituation reports, which tries to build the association withthe classified images. The MMM mechanism is applied to
incorporate user feedback for adjusting the affinity betweenimages and obtaining better association results. At the front-end of the system, a series of controllers are used to controldifferent views of the system, including report lists, relatedimages for reports, images filter, image timelines, and relatedimages for image, which will be touched in the next section.
Fig. 1. MADIS Overview
A. MADIS Architecture
The implementation of MADIS follows a three-tiered ar-chitecture: (1) the client (iPad application); (2) the RESTful,JSP-based API; and (3) the production database.
The production database is a relational database built usingPostgreSQL. It stores all the data related to the situationreports, including multimedia data as well as user-feedback.The relational schema of the database models the semanticrelationship between the situation reports and the multimediadata as shown in Figure 2. In their contents, situation reportsmay reference one or more geographic locations and subjects,which are in turn described by pictures taken at the disasterarea. For example, in the scenario of a hurricane that affectsSouth Florida, geographic locations may be Miami-Dade orMiami Beach. Such locations are represented by images,which can be categorized into before or after the naturalhazard. The subjects of images are the damages affectingthe corresponding locations, such as ”building collapse” and”flooding” in the hurricane disaster.

Fig. 2. MADIS Database Relational Schema
The RESTful, JSP-based API answers requests from theuser interface by accessing the production database via struc-tured queries. The REST API is implemented as a Java Tomcatservlet and follows the Model-View-Controller (MVC) designpattern. All the requests and responses are in XML format. Forexample, through this RESTful API, the front-end applicationcan retrieve situation report related information, such as thelist of reports, the list of locations and subjects associatedwith the reports, and the list of images that related to suchlocations and subjects, etc. It can also send user feedback tothe back end and re-arrange related images based on feedbackprocessing results. Over the above two layers, the top tieris implemented in iOS, specifically for Apple’s iPad devices.The iPad application communicates with the server layer viaRESTful API and XML-based responses, finally presenting auser-friendly graphical interface for information retrieval andactive interaction.
B. MADIS Major Components
The major components of MADIS are illustrated in Figure 3and described as follows.
• Report List: This component shows the main report list,which displays one to three related images next to eachentry. They are the most recently taken pictures, each ofa different subject associated with the report as shown inFigure 3(a).
• Related Images for Report: Once the user enters aspecific report page, he/she can browse the related imagesassociated with current report. Long press on any oneimage will bring up the voting options for user feedbackas shown in Figure 3(b).
• Image Filter: This component allows a user to filter theimage list based on several factors simultaneously. Theimages can be filtered by locations, subjects, or keywords(which are the synonyms of locations and subjects, beinghighlighted in the report) as shown in Figure 3(c). In eachcase, the user can select multiple values to filter on andthe image list is updated dynamically. This feature canbe useful for displaying only the images that pertain to aspecific aspect of the report.
• Image Timeline: Users may enter the image page andview the timeline by selecting an image from the relatedimage list. The timeline is a set of images that depict thesame location and are organized by date from earliest tolatest. Users are allowed to vote for an image to reportrelationship under this view as shown in Figure 3(d).
(a) Report List (b) Related Images for Report
(c) Image Filter (d) Image Timeline
(e) Related Images for Image (f) Image Description
Fig. 3. MADIS Major Components
• Related Images for Image: Besides the report-imageassociation, the system also presents the image-imagerelationships and provides the user with voting options asshown in Figure 3(e), where the anchor image is selectedfrom the report page. In addition, the user can tap thedescription button to get a basic description of the imageand additional metadata we may have on the picture, suchas taken date and author as shown in Figure 3(f).
III. DYNAMIC HIERARCHICAL IMAGE CLASSIFICATION
The adaptive hierarchical image classification frameworkaddresses multi-source data fusion via MCA and dynamicweighting scheme. MCA has been proven to be effective formultimedia semantic analysis, especially for video conceptdetection [10]. In the disaster image classification scenario,
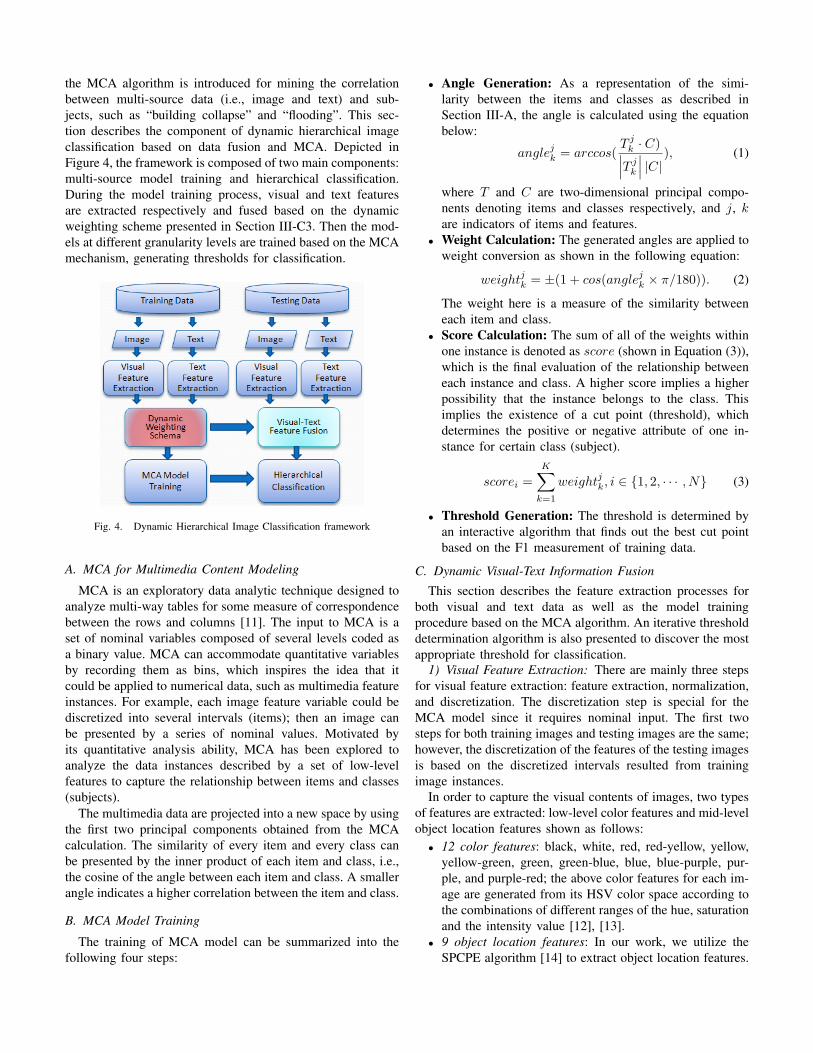
the MCA algorithm is introduced for mining the correlationbetween multi-source data (i.e., image and text) and sub-jects, such as “building collapse” and “flooding”. This sec-tion describes the component of dynamic hierarchical imageclassification based on data fusion and MCA. Depicted inFigure 4, the framework is composed of two main components:multi-source model training and hierarchical classification.During the model training process, visual and text featuresare extracted respectively and fused based on the dynamicweighting scheme presented in Section III-C3. Then the mod-els at different granularity levels are trained based on the MCAmechanism, generating thresholds for classification.
Fig. 4. Dynamic Hierarchical Image Classification framework
A. MCA for Multimedia Content Modeling
MCA is an exploratory data analytic technique designed toanalyze multi-way tables for some measure of correspondencebetween the rows and columns [11]. The input to MCA is aset of nominal variables composed of several levels coded asa binary value. MCA can accommodate quantitative variablesby recording them as bins, which inspires the idea that itcould be applied to numerical data, such as multimedia featureinstances. For example, each image feature variable could bediscretized into several intervals (items); then an image canbe presented by a series of nominal values. Motivated byits quantitative analysis ability, MCA has been explored toanalyze the data instances described by a set of low-levelfeatures to capture the relationship between items and classes(subjects).
The multimedia data are projected into a new space by usingthe first two principal components obtained from the MCAcalculation. The similarity of every item and every class canbe presented by the inner product of each item and class, i.e.,the cosine of the angle between each item and class. A smallerangle indicates a higher correlation between the item and class.
B. MCA Model Training
The training of MCA model can be summarized into thefollowing four steps:
• Angle Generation: As a representation of the simi-larity between the items and classes as described inSection III-A, the angle is calculated using the equationbelow:
anglejk = arccos(T jk · C)∣∣∣T jk
∣∣∣ |C|), (1)
where T and C are two-dimensional principal compo-nents denoting items and classes respectively, and j, kare indicators of items and features.
• Weight Calculation: The generated angles are applied toweight conversion as shown in the following equation:
weightjk = ±(1 + cos(anglejk × π/180)). (2)
The weight here is a measure of the similarity betweeneach item and class.
• Score Calculation: The sum of all of the weights withinone instance is denoted as score (shown in Equation (3)),which is the final evaluation of the relationship betweeneach instance and class. A higher score implies a higherpossibility that the instance belongs to the class. Thisimplies the existence of a cut point (threshold), whichdetermines the positive or negative attribute of one in-stance for certain class (subject).
scorei =
K∑k=1
weightjk, i ∈ {1, 2, · · · , N} (3)
• Threshold Generation: The threshold is determined byan interactive algorithm that finds out the best cut pointbased on the F1 measurement of training data.
C. Dynamic Visual-Text Information Fusion
This section describes the feature extraction processes forboth visual and text data as well as the model trainingprocedure based on the MCA algorithm. An iterative thresholddetermination algorithm is also presented to discover the mostappropriate threshold for classification.
1) Visual Feature Extraction: There are mainly three stepsfor visual feature extraction: feature extraction, normalization,and discretization. The discretization step is special for theMCA model since it requires nominal input. The first twosteps for both training images and testing images are the same;however, the discretization of the features of the testing imagesis based on the discretized intervals resulted from trainingimage instances.
In order to capture the visual contents of images, two typesof features are extracted: low-level color features and mid-levelobject location features shown as follows:
• 12 color features: black, white, red, red-yellow, yellow,yellow-green, green, green-blue, blue, blue-purple, pur-ple, and purple-red; the above color features for each im-age are generated from its HSV color space according tothe combinations of different ranges of the hue, saturationand the intensity value [12], [13].
• 9 object location features: In our work, we utilize theSPCPE algorithm [14] to extract object location features.

Specifically, each image is divided into 3× 3 equal-sizedregions, i.e., nine locations are ordered from left to rightand from top to bottom: L1, · · · , L9, where Li = 1if there is an object in the image whose centroid fallsinside Li, 1 ≤ i ≤ 9, otherwise Li = 0. And the objectwith its area less than 8% area of the total region can beignored. In order to effectively determine whether there isan object inside a designated region or not, we adopt theminimal bounding rectangle (MBR) concept in R-tree toguarantee that each object can be covered by a rectangle.
Therefore a total number of 21 features are obtained foreach image, and these visual features will be integrated withcorresponding text feature.
2) Text Feature Extraction: As for text feature extraction,it requires more preprocessing than visual features. First, thepunctuation characters are removed and then the stop words,thus obtaining a list of valid words for each image instance.After that we analyze the above valid words related to eachimage, and then obtain the top N high-frequency words inthe list by using MALLET [15], a Java-based package forstatistical natural language processing. Since the extractedvisual feature is a 21-dimension vector, in order to balancethe contribution of different features to the subsequent classi-fication results, we choose the top 21, (i.e., N=21) words withhigh frequencies as the text features. Finally, each originaltext should be represented as an N-dimension feature vectorby the combination of these high-frequency words accordingto the tf-idf schema discussed by Salton and McGill in [16].Each dimensionality represents the number of times the high-frequency word appears in the text. The feature extractionprocess of the testing data set is similar to that of the trainingdata set except for the “get word frequency” step.
3) Dynamic Weighting Scheme: Among the above 21 vi-sual features, some of them might carry significant semanticinformation about the image, whereas some others might beless important. Particularly in the classification, the extract-ed features should be more representative and carry moresignificance. For example, when identifying sun and grass,color features red and green will play more important rolesthan other color features, such as yellow, blue, etc.; whereaswhen distinguishing sky from sea, the object location featuresmight be more crucial than the color feature blue. Therefore,it might be helpful to dynamically assign different weightsto different visual features so that the features with moreimportance can be captured and play more meaningful roles onthe classification. In order to find out a suitable weight for eachfeature, a possible solution is to take the metric learning [17]–[19] into consideration. In this paper, we utilize the idea ofmetric learning and incorporate the concept of dynamic featureweighting into our solution. Fig. 5 presents the framework ofdynamic weighting.
Specifically in the classification, given that human percep-tion of an image is well approximated by its text, a goodweighting schema for the extracted visual features guidedby text information may lead to a high-quality similaritymeasurement, and therefore better classification results. Let
Feature Extraction
Training
Images
Training
Texts
Visual Features Text Features
Dynamic Weighting Schema
Visual Feature Weights
Feature Extraction
Fig. 5. Framework of Dynamic Weighting
Sf (f i, fj ;α) =∑
l fi,lfj,lαl be the image-based similaritymeasurement between the i-th and the j-th images when theparameterized weights are given by α, where fi,l is the l-thfeature in the visual feature set fi and fj,l is the l-th featurein the visual feature set fj . Let St(ti, tj) =
∑k ti,ktj,k be
the similarity measurement between the i-th and the j-th textfeatures, in general, the words with high frequency extractedfrom texts. Here for each k, ti,k denotes whether the k-thword appears in the i-th text or not. To learn appropriateweights α for visual features, we can enforce the consistencybetween similarity measurements Sf (fi, fj ;α) and St(ti, tj).The above idea leads to the following optimization problem:
α∗ = argmin∑i ̸=j
(Sf (fi, fj ;α)− St(ti, tj))2
s.t.α ≥ 0.
(4)By rewriting and calculating the summation in Equation (4),
the optimization problem can be addressed using quadraticprogramming techniques [20]. After obtaining the optimalweighting information for each visual feature, we can get theweighted visual features.
Similar to the visual feature, among those high-frequencywords, some of them also might be more significant to thesubsequent classification, whereas some others might be lessimportant. Therefore, in order to learn appropriate weightsβ for text features, we can perform the similar weightingprocedure to the text features. Note that the consistency isenforced between the similarity measurements of the weightedvisual features under known weights α and vice versa. Afterobtaining the optimal weighting information for each textfeature, both of the optimal weights α and β can be utilizedin the subsequent hierarchical classification.
D. Hierarchical Classification
Much work has been done in the field of hierarchicalclassification [21]–[25]. For example, Fan et al. have builthierarchical mixture models for semantic image classifica-tion [22]; then extended the work by incorporating concept
ontology for hierarchical image concept organization [24]. Fei-Fei et al. have also incorporated prior knowledge to improvehierarchical image classification [23]. In order to explore theextensive relationship between various subjects and performthe classification in a more efficient way, an intuitive andsimple hierarchical classification mechanism is adopted forour system [3]. Specifically, a topology tree is designed andused to classify images into pre-defined subjects in a top-down manner. Based on the fact that visual and text featuresat different layer may have unequal importance, the dynamicweighting scheme is applied at each granularity level to obtaina better integration result.
IV. DOCUMENT ANALYSIS AND IMAGE ASSOCIATION
This section addresses the problem of how to associatelocations and subjects to documents, hence the association ofsituation report and classified images. Specifically, the GATEsystem is used to extract entities from document, and theWordNet tool is used to explore the synonyms of subjectsin order to overcome the exact match limitation.
A. GATE System and Entity Extraction
Natural language processing for information retrieval playsan important role in the proposed system. The GATE systemis applied to identify certain types of entities, such as date andlocation.
The GATE system requires three main processing resources:Tokenizer, Gazetteer and Grammar. GATE’s annotation APIcommunicates these resources by a directed graph. The im-plementation of the processing resources focuses on the ro-bustness and usability of the system, as well as the cleardistinction between declarative data representations and finitestate algorithms. The Tokenizer splits text into simple tokens,for example, symbols, numbers, or words in different types,such as words with an initial capital, and so on. The Gazetteeris used to group entities and names of useful indicators such asIP, cities, organizations, or names of people. As for Grammar,it is constructed from hand-crafted rules to represent patternsby analyzing a specific text string or annotations previouslyattached to tokens.
B. WordNet for Synonym Extraction
WordNet is a lexical database for the English language. Itgroups English words into sets of synonyms called synsets,provides short, general definitions, and records the varioussemantic relations between these synonym sets. The devel-opment of synonym extraction component is based on theopen source package which uses synonyms defined by Word-Net [7]. The usage of the package requires users to downloadthe WordNet prolog database. Inside this archive is a filenamed wn s.pl, which contains the WordNet synonyms. Wemainly use two classes in the package, i.e., Syns2Index andSynLookup. Specifically, the class Syns2Index is used forconverting the prolog file wn s.pl into a Lucene index suitablefor looking up synonyms, and the class SynLookup is forlooking up synonyms.
C. Report-Image Association
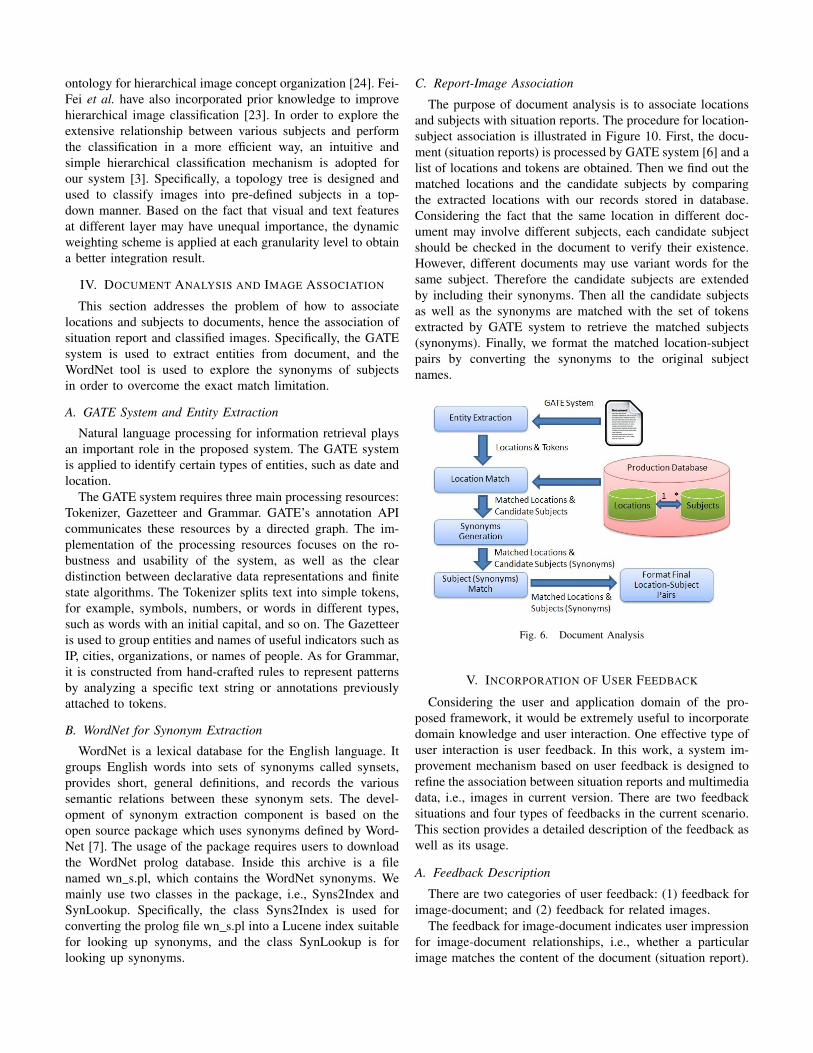
The purpose of document analysis is to associate locationsand subjects with situation reports. The procedure for location-subject association is illustrated in Figure 10. First, the docu-ment (situation reports) is processed by GATE system [6] and alist of locations and tokens are obtained. Then we find out thematched locations and the candidate subjects by comparingthe extracted locations with our records stored in database.Considering the fact that the same location in different doc-ument may involve different subjects, each candidate subjectshould be checked in the document to verify their existence.However, different documents may use variant words for thesame subject. Therefore the candidate subjects are extendedby including their synonyms. Then all the candidate subjectsas well as the synonyms are matched with the set of tokensextracted by GATE system to retrieve the matched subjects(synonyms). Finally, we format the matched location-subjectpairs by converting the synonyms to the original subjectnames.
Fig. 6. Document Analysis
V. INCORPORATION OF USER FEEDBACK
Considering the user and application domain of the pro-posed framework, it would be extremely useful to incorporatedomain knowledge and user interaction. One effective type ofuser interaction is user feedback. In this work, a system im-provement mechanism based on user feedback is designed torefine the association between situation reports and multimediadata, i.e., images in current version. There are two feedbacksituations and four types of feedbacks in the current scenario.This section provides a detailed description of the feedback aswell as its usage.
A. Feedback Description
There are two categories of user feedback: (1) feedback forimage-document; and (2) feedback for related images.
The feedback for image-document indicates user impressionfor image-document relationships, i.e., whether a particularimage matches the content of the document (situation report).

On the other hand, the feedback for related images impliesthe fondness of a particular image regarding the target image,which to some sense reflects the similarity (affinity) of imagepairs. There are four types of feedback impressions describedas follows: (1) no action: system made a correct match, nochanges should be made; (2) thumbs up: system made a correctmatch, but some image(s) is/are more relevant than others;(3) thumbs down: system made a correct match, but someimage(s) is/are less relevant than others; (4) flag: image iscompletely inappropriate, should be hidden from all futureimage lists.
The processing for flag feedback is the same for boththe situations, i.e., hidden from all future image lists. Thefollowing two sections will discuss the processing of thumbsup/down feedback in both scenarios.
B. Feedback for Report-Image
The processing or image-document feedback is based ona rather simple counter mechanism. Specifically, a counter iscreated for each image belonging to certain situation reportsand update the counter by increasing 1 (for thumbs up feed-back) or decrease 1 (for thumbs down feedback). Then theimage list is re-ranked for each report.
C. Feedback for Image-Image
The processing for related images feedback is based onthe simplified MMM mechanism [8], which is used to modelthe searching and retrieval process for content-based imageretrieval. It is different from the common image retrievalmethods in that the MMM model carries out the searchingand similarity computing process dynamically, taking intoconsideration not only the image content features but alsoother characteristics of images such as their access frequenciesand access patterns.
1) Markov Model Mediator (MMM): MMM is aprobability-based mechanism that adopts the Markov modelframework and the mediator concept. The MMM mechanismmodels an image database by a 5-tuple λ = (S, F,A,B, π),where S is a set of images called states; F is a set ofdistinct features of the images; A denotes the states transitionprobability distribution, where each entry (i, j) indicates therelationship between image i and j captured through theoff-line training procedure; B is the feature matrix of allimages; and π is the initial state probability distribution.
All the disaster images and their relationships in our systemare modeled by an MMM, where S represents the wholeimage set. F is a set of distinct features of the images,i.e., 12-dimension color descriptor and 9-dimension locationdescriptor in the MADIS. A describes the relationships amongall the images in the database based on user’s feedback. Bconsists of the 21-dimension feature vectors for all the images.π indicates how likely an image would be accessed with anyprior knowledge of user preference.
The training of MMM basically involves the construc-tion of the two statistical matrices, A and π. A sequenceof user feedback characterizing access patterns and access
frequencies is used to train the model parameters. SupposeR = {R1, R2, ..., RT } is a collection of user feedback duringa period of time, where each Rt (t = 1...T ) is a list of userfeedback for an anchor image. Let Pm,t denote the feedbackpattern of image m with respect to collection item Rt pertime period, where the value of Pm,t is 1 when m appears inRt and zero otherwise. The value of ACt denotes the accessfrequency of Rt per time period. The pairs of user feedbackpattern Pm,t and access frequency ACt provides the capabilityof capturing user preference. Specifically, the training of thetwo parameters, A and π, are described as follows:
• Matrix A: Intuitively, the more frequently two images areaccessed together, the more closely related they are. Inorder to capture the relative affinity measurements amongall the images, a matrix AF is constructed with eachelement afm,n denoting the relative affinity relationshipbetween two images m and n:
afm,n =T∑
t=1
Pm,t × Pn,t ×ACt. (5)
Each entry in the state transition probability distributionmatrix (A) is obtained by normalizing AF per row as in
am,n =afm,n∑n∈d afm,n
. (6)
• Matrix π: The preference of the initial states for userfeedback can be obtained from the training data set. Forany image m, the initial state probability is defined asthe fraction of the number of occurrences of image mwith respect to the total number of occurrences for allthe images in the image database D from the trainingdata set.
πm =
∑Tt=1 Pm,t∑N
l=1
∑Tt=1 Pl,t
, (7)
where N is the total number of images in database.2) Off-line Training Based on User Feedback: Since the
related image retrieval is within a specific subject whichutilizes the classification results and implies the cooperationof domain knowledge, the MMM model is refined to keep justthe affinity matrix to describe the relationship between imagepairs. The challenge then becomes how to update the affinitymatrix based on different types of user feedback. In this work,we propose to process positive feedback (thumbs up) andnegative feedback (thumbs down) separately. Specifically, twoaffinity matrices are created for positive and negative feedbackrespectively, and they are summed up and normalized to formthe final affinity matrix.
VI. SYSTEM EVALUATION
The evaluation of the proposed system was carried outfrom two perspectives. First, experiments are conducted tovalidate the effectiveness of the proposed dynamic hierarchicalclassification framework. Second, an evaluation activity isinitiated at Miami-Dade Emergency Management (MDEM)department, where the personnel are asked to perform a set of

specific tasks using the developed application and then answera series of questions based on their experience.
A. Algorithm Evaluation
In this section, two sets of experiments are designed fordemonstrating the effectiveness of the dynamic weightingscheme and the MCA-based hierarchical classification modelrespectively.
1) Real World Dataset: Our experiments are based on acollection of disaster images with their corresponding textsdownloaded from the Flickr website. The dataset covers sixdisaster-related subjects as follows: (1) building collapse;(2) Flooding; (3) human Relief; (4) earthquake damage; (5)damage to sea grass; (6) death of animals.
2) Dynamic Weighting Scheme Evaluation: To demonstratethe effectiveness of the dynamic weighting scheme for fusingthe visual and text features, the performance of differentmodels is compared, i.e., visual model, text model, and visual-text model. The precision, recall, F1, and accuracy [26] arecalculated as the measurements of performance using 3-foldcross validation. As can be seen from Tables I through III,the average F1 score of the whole classification frameworkis 83.9%, which is about 13% and 6% more than the visualmodel and text model respectively; in addition, comparedwith the single-course model, the overall accuracy of visual-text model has also improved by 9% and 7% respectively.The promising results verify the significance of the proposeddynamic weighting algorithm, which effectively integratesdifferent sources of information and enhances the performanceof the whole framework.
TABLE IPERFORMANCE OF VISUAL-BASED MODEL.
Subjects Precision Recall F1 Accuracy(1) 74.9% 67.9% 71.1% 71.2%(1) 68.0% 62.2% 63.9% 74.8%(3) 81.0% 81.0% 81.0% 77.4%(4) 70.2% 64.5% 65.0% 75.7%(5) 79.5% 70.8% 72.4% 77.8%(6) 84.2% 63.4% 71.3% 72.6%
Average 76.3% 68.3% 70.8% 74.9%
TABLE IIPERFORMANCE OF TEXT-BASED MODEL.
Subjects Precision Recall F1 Accuracy(1) 79.8% 93.8% 86.1% 84.0%(2) 67.9% 88.8% 74.3% 75.3%(3) 60.8% 92.7% 73.4% 60.2%(4) 43.5% 58.1% 49.7% 56.7%(5) 94.5% 85.9% 90.0% 91.7%(6) 92.9% 93.5% 93.2% 92.3%
Average 73.2% 85.5% 77.8% 76.7%
3) MCA Model Evaluation: On the other hand, to illustratethe efficacy of the hierarchical MCA Modeling mechanism,we first implement the above 3 classification models byLibSVM [27], one of the most popular classification tools,and then compare their classification performance with thoseof the MCA model, as shown in Figure 7. From the results,
TABLE IIIPERFORMANCE OF VISUAL-TEXT MODEL.
Subjects Precision Recall F1 Accuracy(1) 83.6% 94.9% 88.9% 87.5%(2) 81.8% 86.8% 83.6% 87.5%(3) 69.5% 95.0% 80.0% 71.4%(4) 60.4% 75.1% 66.1% 71.0%(5) 97.1% 86.7% 91.6% 93.1%(6) 94.9% 91.5% 93.0% 92.4%
Average 81.2% 88.3% 83.9% 83.8%
we have the following observations: (1) compared with thesingle text model and visual model, the classification resultsare improved using the dynamic visual-text information fusionmethod, which demonstrates the effectiveness of our proposedapproach; (2) compared with the classification performance ofLibSVM, our proposed MCA model outperforms the other oneach type of features. The reason for the overall performanceof the MCA model is better than that of the LibSVM isthat the MCA model could effectively integrate text featuresand visual features by the dynamic weighting schema andhierarchical classification structure, consequently achievingbetter classification performance.
Fig. 7. Comparison between MCA and LibSVM
B. Application Evaluation
To validate the usability and performance of the proposedsystem, the EM personnel at MDEM department are requestedto perform the following tasks and answer twelve questions,where ten of them are multiple choice questions with a 5-levelagreement scale (Strongly Agree, Agree, Not Sure, Disagree,and Strongly Disagree) and the other two are open-endedquestions.
The set of tasks includes (1) finding hurricane Katrinasituation report; (2) reviewing associated images and selectthumbs up/down or flag as needed; (3) filtering the imagesbased on one of the locations/subjects; (4) viewing the de-scription and timeline of one selected image; and (5) browsingthe related images and select thumbs up/down or flagging asneeded. Some of the multiple choice questions are: (1) Iwas able to locate the situation report I was interested in; (2)I found that the images are correctly associated with the report;(3) I was able to give feedback (thumbs up/down, flag) to theassociated images; (4) I was able to filter the images based

on location/subject; and (5) I found that the system useful inenhancing the situation report for emergency management.
Several personnel at the MDEM department participatedin the evaluation. It is worth noting that all the participantswere new to the application and there was no training processinvolved. The evaluation results indicate that most of thepersonnel are satisfied with the performance of the system.Specifically, eight out of ten questions receive “StronglyAgree” or “Agree” from all of the participants, which impliesa high level of satisfaction with the system performance.
Other feedbacks collected from the opening questions aresummarized as follows, and some of them suggests our po-tential future work.
• Positive feedbacks: (1) the concept is extremely helpfuland will prone very useful for emergency managers; (2)the system is very friendly and easy to use; and (3) theabilities provided by the system is impressive, such asfiltering by location and subject, association of reportswith images, image timeline, pre-classification of images,and so on.
• Suggestions: (1) the disaster ontology could be extendedfor categorizing images; (2) extra functionalities such asgroup selection and de-selection of images are welcomed;and (3) labor intervene should be reduced to enhanceautomated function.
VII. SYSTEM OPERATION AND CONCLUSION
Florida International University (FIU) has spent over $170Kin the development and maintenance of the system, whichis managed in a version control system and run through atest suite that validates key functionalities such as report listcontrol, image filtering, feedback processing, and so on. Byinteracting with MDEM personnel through evaluation and ex-ercise activities, the system has constantly been being updatedby improving user interface experience and back-end supporttechniques.
Feedback from our collaborative partners at MDEM and thepotential users suggests that our system will be very useful foremergency managers to gain insight of the situation at actualdisaster scene and make quick response. We are encouragedto further develop the system into an operational pilot andpromote the commercialization of the system for benefittingthe whole EM community.
ACKNOWLEDGMENT
This work is partially supported by the U.S. Departmentof Homeland Security under grant Award Number 2010-ST-062-000039, U.S. Department of Homeland Security’sVACCINE Center under Award Number 2009-ST-061-CI0001,NSF HRD-0833093, and Army Research Office under grantnumber W911NF-10-1-0366 and W911NF-12-1-0431.
REFERENCES
[1] L. Zheng, C. Shen, L. Tang, T. Li, S. Luis, S.-C. Chen, and V. Hristidis.Using data mining techniques to address critical information exchangeneeds in disaster affected public-private networks. In ACM SIGKDD,pages 125–134, 2010.
[2] L. Zheng, C. Shen, L. Tang, T. Li, S. Luis, and S.-C. Chen. Applyingdata mining techniques to address disaster information managementchallenges on mobile devices. In ACM SIGKDD, pages 283–291, 2011.
[3] Y. Yang, H.-Y. Ha, F. Fleites, S.-C. Chen, and S. Luis. Hierarchicaldisaster image classification for situation report enhancement. In IEEEInternational Conference on Information Integration and Reuse, pages181–186, 2011.
[4] S. Luis, F. Fleites, Y. Yang, H.-Y. Ha, and S.-C. Chen. A visualanalytics multimedia mobile system for emergency response. In IEEEInternational Symposium on Multimedia, pages 337–338, 2011.
[5] N. J. Salkind. Encyclopedia of measurement and statistics. Sage,Newbury Park, CA, 2006.
[6] H. Cunningham, D. Maynard, K. Bontcheva, and V. Tablan. Gate: Aframework and graphical development environment for robust nlp toolsand applications. In Proceedings of the 40th Anniversary Meeting of theAssociation for Computational Linguistics, Jul. 2002.
[7] Princeton University. Wordnet, a lexical database for english.http://wordnet.princeton.edu/, Jul. 2011.
[8] M.-L. Shyu, S.-C. Chen, M. Chen, and C. Zhang. Affinity relationdiscovery in image database clustering and content-based retrieval. InProceedings of ACM Multimedia, pages 372–375, 2004.
[9] L. R. Rabiner and B. H. Huang. An introduction to hidden markovmodels. IEEE ASSP Magazine, 3(1):4–16, 1986.
[10] L. Lin, M.-L. Shyu, G. Ravitz, and S.-C. Chen. Video semantic conceptdetection via associative classification. In IEEE International Conferenceon Multimedia and Expo, pages 418–421, Jul. 2009.
[11] H. Abdi and D. Valentin. Multiple correspondence analysis. Encyclo-pedia of measurement and statistics, 2007.
[12] K. Van de Sande, T. Gevers, and C. Snoek. Evaluation of colordescriptors for object and scene recognition. In Proceedings of theIEEE Computer Society Conference on Computer Vision and PatternRecognition, pages 1–8, 2008.
[13] J.C. Femiani and A. Razdan. Interval hsv: Extracting ink annotations.In Proceedings of the IEEE Computer Society Conference on ComputerVision and Pattern Recognition, pages 2520–2527, 2009.
[14] S.-C. Chen, S. Sista, M.-L. Shyu, and R. L. Kashyap. An indexingand searching structure for multimedia database systems. In SPIEConference on Storage and Retrieval for Media Databases, pages 262–270, 2000.
[15] A.K. McCallum. MALLET: A machine learning for language toolkit.http://mallet.cs.umass.edu, 2002.
[16] G. Salton and M.J. McGill. Introduction to modern information retrieval.1986.
[17] J.V. Davis, B. Kulis, P. Jain, S. Sra, and I.S. Dhillon. Information-theoretic metric learning. In ICML, pages 209–216. ACM, 2007.
[18] K.Q. Weinberger and G. Tesauro. Metric learning for kernel regres-sion. In Eleventh international conference on artificial intelligence andstatistics, pages 608–615, 2007.
[19] B. Shao, M. Ogihara, D. Wang, and T. Li. Music recommendationbased on acoustic features and user access patterns. IEEE Transactionson Audio, Speech, and Language Processing, 17(8):1602–1611, 2009.
[20] P.E. Gill, W. Murray, and M.H. Wright. Practical optimization. 1981.[21] K. Barnard and D. Forsyth. Learning the semantics of words and
pictures. In Proceedings of the IEEE Computer Society Conferenceon Computer Vision and Pattern Recognition, pages 408–415, 2001.
[22] J. Fan, H. Luo, Y. Gao, and M.-S. Hacid. Mining image databases onsemantics via statistical learning. In ACM SIGKDD, pages 22–31, 2005.
[23] L. Fei-Fei and P. Perona. A bayesian hierarchical model for learningnatural scene categories. In Proceedings of the IEEE Computer SocietyConference on Computer Vision and Pattern Recognition, pages 524–531, 2005.
[24] J. Fan, Y. Gao, H. Luo, and R. Jain. Mining multilevel image seman-tics via hierarchical classification. IEEE Transactions on Multimedia,10(2):167–187, 2008.
[25] B. Geng, L. Yang, C. Xu, and X.-S. Hua. Collaborative learning forimage and video annotation. In ACM SIGIR, pages 443–450, 2008.
[26] D.L. Olson and D. Delen. Advanced data mining techniques. Springer,USA, 2008.
[27] C.C. Chang and C.J. Lin. LIBSVM: a library for support vectormachines. 2001.