madagascar conservation & development
TRANSCRIPT
VOLU M E 1 4 I SSU E 1 DECEM BER 201 9
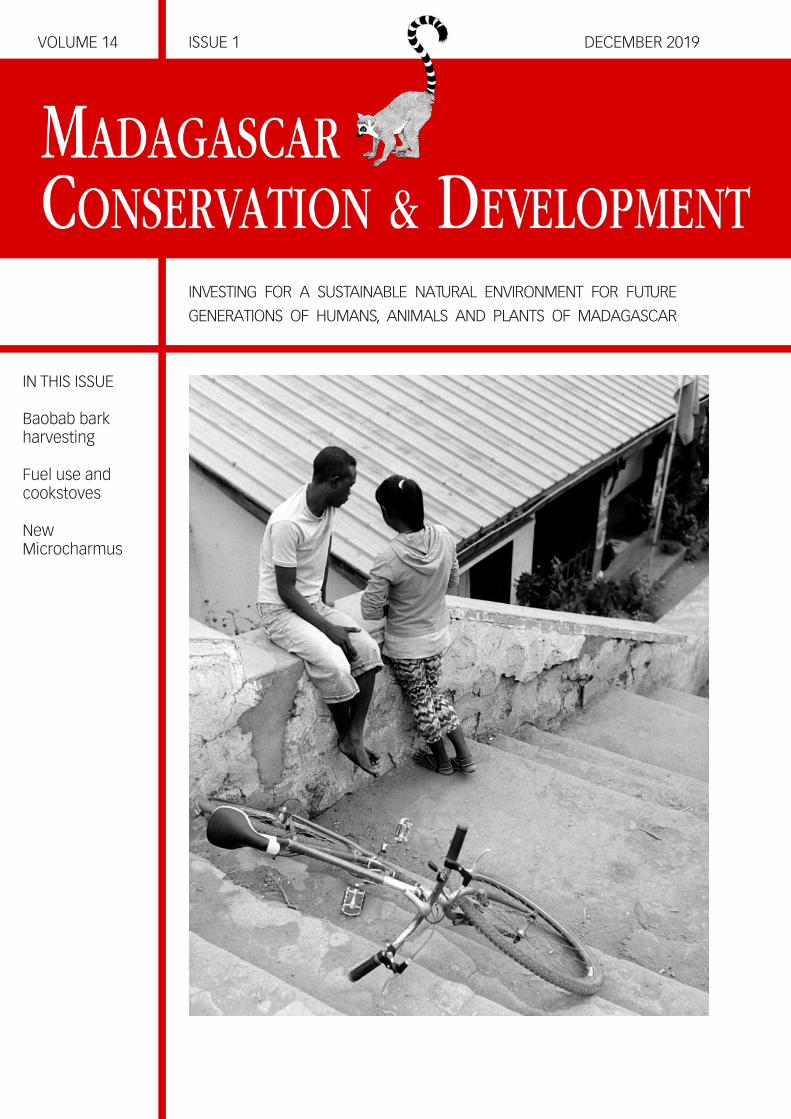
INVESTING FOR A SUSTAINABLE NATURAL ENVIRONMENT FOR FUTURE
GENERATIONS OF HUMANS, ANIMALS AND PLANTS OF MADAGASCAR
I N TH I S I SSU E
Baobab barkh arvesti n g
Fu el u se an dcookstoves
N ewM i croch armu s

Madagascar Conservation & Development is the journal of
Indian Ocean e-Ink. I t is produced under the responsibi l i ty
of this institution. The views expressed in contributions to
MCD are solely those of the authors and not those of the
journal editors or the publ isher.
Al l the Issues and articles are freely avai lable at
http://www. journalmcd.com
Contact Journal MCD
[email protected] for general inquiries regarding MCD
[email protected] to support the journal
Madagascar Conservation & Development
Institute and Museum of Anthropology
University of Zurich
Winterthurerstrasse 1 90
CH-8057 Zurich
Switzerland
Indian Ocean e-Ink
Promoting African Publ ishing and Education
www.ioeink.com
Missouri Botanical Garden (MBG)
Madagascar Research and Conservation Program
BP 3391
Antananarivo, 1 01 , Madagascar
MADAGASCAR CONSERVATION & DEVELOPMENT PAGE 2VOLUME 1 4 | ISSUE 01 — DECEMBER 201 9
TABLE OF CONTENTS
EDITORIAL
3 We have got to up our game substantial ly for forests, carbon,
biodiversity, and ultimately people. Waeber, P. O. , Wilmé, L.
47 Impressum
ARTICLES
6 Bark harvesting: a threat for the Grandidier’s baobab
Adansonia grandidieri in western Madagascar. Andriafidison,
A. , Raveloson, C. O. , Mananjara, W. S. , Razafimanahaka, J. H.
1 2 Fuel use and cook stove preferences in the SAVA region.
Blanco, M. R. , Greene, L. K. , Davis, L . J. , Welch, C.
1 9 Développement d'un logiciel (3C-BIOVIS) pour la
détermination de la disponibi l i té des ressources fourragères
par une approche de modél isation et télédétection.
Razafinarivo, T. D. , Rahetlah, V. B. , Salgado, P. , Rakotozandriny,
N. J. , Andriarimalala, J. H. , Ralainindriana, I. , Artus, H. ,
Le Mezo, L.
26 Additions to the geographical d istribution of the Malagasy
fami ly Microcharmidae Lourenço 1 996 (Scorpiones:
Buthoidea) and description of three new species of
Microcharmus Lourenço 1 995. Lourenço, W. R. , Waeber, P. O. ,
Wilmé, L.
37 Wild l i fe hunting in complex human-environmental systems:
How understanding natural resource use and human welfare
can improve conservation in the Ankarafantsika National Park,
Madagascar. Borgerson, C. , Randrianasolo, J. F. , Andraina, T. R. ,
Anjaranirina, E. J. G. , Randriamady, H. J. , Merson, S. , Dollar, L . ,
Golden, C. D.
ADDENDA
46 Addenda to the article Three new species of Grosphus Simon,
1 880, (Scorpiones: Buthidae) from Madagascar; possible
vicariant cases within the Grosphus bistriatus group of
species. Madagascar Conservation & Development 1 1 , 2:
52–65. Lourenço, W. R. , Wilmé, L.
MADAGASCAR CONSERVATION & DEVELOPMENT PAGE 3VOLUME 1 4 | ISSUE 01 — DECEMBER 201 9
A recently publ ished contribution in Nature by Lenton et al . (201 9)
shows that Earth is risking an irreversible planetary tipping point.
This means that the Earth’s cl imate system is in a state of emer-
gency, rushing its way towards a point of no return. The authors
have identified nine tipping points—inter al ia—melting Arctic and
Antarctic ice sheets, retreating permafrost, changing boreal forest
fire and pest regimes, and increased frequency of droughts in the
Amazon forest. These signals are raising global concerns. Whi le
science expected these tipping points to be reached at 3°C in-
crease (e.g. , Lemoine and Traeger 201 6), recent trends are corrob-
orating the hypothesis that these points of irreversible and abrupt
system change already show high probabi l i ty of being reached
within the bounds of 1 .5–2°C. During the COP21 of the United Na-
tion Framework Convention on Cl imate Change (UNFCCC), 1 95
countries adopted the Paris Agreement to l imit global temperature
rise to wel l below 2°C.
Planetary boundaries are shifting and we are facing a global
environmental crisis. What does this mean for forests and biodi-
versity? A report released in May this year by the Intergovernmen-
tal Science-Pol icy Platform on Biodiversity and Ecosystem
Services (IPBES)—the Intergovernmental Panel on Cl imate Change
(IPCC)-pendant for biodiversity—shows that 1 mi l l ion animal and
plant species are at high risk of extinction due to deforestation,
overfishing, and other human activities (Tol lefson 201 9).
Forests—tropical , temperate, and boreal—are home to the major-
ity of al l terrestrial species. Deforestation continues unabated and
thus the risk of losing biodiversity increases. Deforestation is tak-
ing place mainly in the tropics, also because the largest forest ar-
eas are pantropical . Fifteen percent of tropical forests are
designated for the conservation of biodiversity versus 1 3% at the
global level (Pancel and Köhl 201 6). The Global Deal for Nature
(GDN)—a science-driven plan to save the diversity and abundance
of l i fe on our planet—suggests to increase conservation efforts:
by 2030 we need 30% of the terrestrial area under protection for
biodiversity conservation, with an additional 20% for cl imate
buffering in order to stay below the 1 .5°C threshold (Dinerstein et
al . 201 9). Reasons for deforestation are the usual suspects but
vary from region to region. In Latin America and South East Asia,
commodity driven deforestation accounts for 64 and 61%, respec-
tively. In Africa, 93% is due to subsistence agriculture. At higher
latitudes, deforestation is mainly an affair between wi ldfires (59%
Russia/ China/ South Asia) and forestry production (95% in Eu-
rope, 48% in North America); 68% of Austral ia’s deforestation is
caused by wi ldfires (Curtis et al . 201 8).
Burning forests have been in global media for a large portion
of the past months, especial ly tropical forests with high biodiver-
sity. Interestingly, when temperate forests in rich countries burn,
media report on property loss, desperate people and economic
aspects but seldom on loss in biodiversity or cl imate change. The
Amazon made headl ines due to ever-increasing fires, despite this
year not having been exceptional ly dry (Barlow et al . 201 9). Should
deforestation continue, a tipping point wi l l be reached far sooner
than expected (Lovejoy and Nobre 201 8). Other global fire
hotspots—with less media attention—burning every year (here
we are not referring to wi ldfires but human induced fires) are
Congo Basin, Indonesia, and Malaysia (Gaveau et al . 201 8, Tu-
rubanova et al . 201 8, Tyukavina et al . 201 8). These regions are
renowned for high biodiversity but also for highly contested land
used for production, be it smal l -scale subsistence farming or
commodity production at larger scales.
Humans are driving a lot of (land-use based) change, whi le
the cl imate is acting as the Uber-driver and ampl ifier, potential ly
reducing system resi l ience and pushing trends beyond breaking
points. Is Earth lost, or is there a shred of hope left? Wel l , we
would be more than happy to report here that things are actual ly
on a good track. There certain ly is a global awareness across re-
gions, countries, and societies that we humans need to take care
of our planet. At the UN level , a number of in itiatives embarked to
restore and reforest our planet to turn the tide within this decade
with a growing number of countries, corporations, civi l societies,
indigenous people and NGOs endorsing reforestation. Many
pledges have been making global headl ines. However, a recently
publ ished five years assessment by the New York Declaration on
Forests shows a rather sombre picture. Since the declaration’s in-
auguration in 201 4, more than 200 parties have endorsed the
stated targets and goals. Yet, compared to the 2002–201 3 base-
l ine, tropical primary forest loss has accelerated by 44% (4.3 mi l -
l ion hectares per year versus 3M hectares per year basel ine). The
stated targets for 2020 wi l l be impossible to meet (NYDF Assess-
ment Partners 201 9). Have we fai led? Almost.
A study assessing the numbers of trees on Earth publ ished
by Crowther et al . (201 5) made the restoration initiatives change
gears and relabel their campaign from the bi l l ion trees to the tri l -
l ion trees campaign. Since, reforestation has dramatical ly gained
in momentum. However, trying to get numbers on how many for-
est restoration landscape (FLR) projects have been undertaken in
the past five years has proven to be difficult since there are many
different in itiatives at various scales involving various groups of
actors, making the task of keeping track chal lenging. Lewis et al .
(201 9) calculated that based on the 43 Bonn Chal lenge countries,
and based on their pledges/goal to reforest 350M hectares by
2030, outcomes of carbon sequestration depend on the forest
strategy appl ied. Forty-two pentagrams of carbon (PgC) could be
stored by the year 21 00 if the entirety of pledges would actual ly
reach the 350M hectares and be ful ly based on natural regenera-
tion. I f the strategy would be for agroforestry, 7 PgC would be se-
questered, and under monoculture only 1 PgC. By 201 9, a total of
EDITORIAL http://dx.doi .org/1 0.431 4/mcd.v1 4i1 .8
We have got to up ourgame substantial ly forforests, carbon,biodiversity, andultimately people
Citation Waeber, P. O. and Wi lmé, L. 201 9. We have got to up our game substantial ly for forests, carbon, biodiversity, and ultimately people. Madagascar Conservation& Development 1 4, 1 . 3-5. http://dx.doi .org/1 0.431 4/mcd.v1 4i1 .8
MADAGASCAR CONSERVATION & DEVELOPMENT PAGE 4VOLUME 1 4 | ISSUE 01 — DECEMBER 201 9
292M hectares had been pledged for restoration. Out of these,
only 34% of area for restoration are to fal l under the natural re-
generation strategy (with the lowest implementation cost), 21 %
account for agroforestry, whi le 45% of al l commitments involve
the planting of monocultures. According to the IPCC, 1 99 PgC
need to be removed from the atmosphere by 21 00 to keep global
warming below the 1 .5°C. Of course, reforestation is just one
pathway to achieve this. However, the right restoration strategy
needs to be envisaged, whi le also keeping an eye on deforesta-
tion. “Restoring forests can’t offset forest loss. They have to be
complementary, and they have to be done at the same time”
(Stephanie Roe, one of the NYDF assessment lead author in an in-
terview for Mongabay 201 9).
Madagascar’s forests host some 80% of its terrestrial biodi-
versity (Waeber et al . 201 9) and is threatened by ongoing defor-
estation. Madagascar—a signatory to the Bonn Chal lenge and
now also member of the African Forest Landscape Restoration Ini-
tiative AFR1 00—has pledged to restore 4M hectares by 2030. In
this context, the president of Madagascar announced in 201 9 a
plan to annual ly plant trees on 40,000 hectares over five years.
These are ambitious plans. Madagascar’s FLR strategy, released in
early 201 7, identifies main governance chal lenges and the need
for trans-sectoral col laboration. A study conducted by CIFOR (Ran-
jatson et al . 201 9) identified main barriers to implementation in
the lack of weak forest law enforcement and particularly tenure
security for smal lholder farmers, an issue sti l l unresolved despite
years of REDD+ experience in Madagascar (Hockley et al . 201 8).
Unresolved land tenures are a recipe for trouble. In a frenzy to
achieve the set targets, mainly fast growing exotic species such
as pine, acacia and eucalyptus risk to be favoured to serve har-
vesting for firewood, charcoal or construction. The 22 regions in
Madagascar are each responsible to reforest some 2000 hectares.
The regional governments, on their turn, rely on schools, NGOs, or
the private sector to fulfi l the goal . However, there are no guide-
l ines provided by the government on how and where to target
land with what kind of native species. The government also plans
to use drones to spread seeds in remote areas. However, even af-
ter 30 years of natural restoration, a recovering forest is much
poorer in terms of species richness, abundance and composition
(Klanderud et al . 201 0).
According to Lenton et al . 201 9, in order to reduce the
chances of these irreversible changes actual ly happening, coun-
tries need to ensure that greenhouse gas emissions do not lead to
an increase above 1 .5°C. I t would take, however, at least 30 years
to achieve this target—time we do not have anymore. Govern-
ments seem not to have the power nor maybe the necessary
long-term vision to step up to the plate, whi le other segments of
society have shown more courage. I t seems quite embarrassing
that young people l ike Greta Thurnberg have to skip school in or-
der to protest for our Earth—we have the highest admiration for
such civi l courage and perseverance. Many scientists and conser-
vationists should mustard up some of hers, speak out, and take
action on their own warnings to humanity (Gardner and Wordley
201 9). There wi l l be more and more such protests in the future,
where societies are tired of the pol i tical inertia and corporate
greediness, irresponsibi l i ty and non-accountabi l i ty (many of these
are directly or indirectly driving deforestation for the production of
commodities). We need transformational partnerships where pol i-
tics, representatives from the corporate and financial worlds,
NGOs and civi l societies sit at one table and start talking about
tangible and feasible actions. Scientists and practitioners need to
provide and share expert guidance when it comes to restoration
and reforestation. We need local ly tai lored solutions; there is not
one-fits-al l solution. Verbatim intentions alone wi l l not suffice to
slow down negative trends or even reverse them. Wrong planning
and planting risks only to exacerbate and undermine good inten-
tions. The right trees need to be put in the right place and need to
benefit the people in the vicin ity. A robust and systematic moni-
toring needs to accompany the process of restoration whi le re-
porting needs to adhere to ethical principles of transparency,
accountabi l i ty and timel iness. Time for voluntary, non-binding
commitments is over.
Patrick O. Waeber
Forest Management and Development
Swiss Federal Institute of Technology (ETH) Zurich, Switzerland
powaeber@gmai l .com; [email protected]
Lucienne Wilmé
Missouri Botanical Garden
Madagascar Research & Conservation Program, BP 3391 ,
Antananarivo 1 01
lucienne.wi [email protected]
REFERENCESBarlow, J. , Berenguer, E. , Carmenta, R. and França, F. 201 9. Clarifying Amazonia's
burning crisis. Global change biology. <https://doi .org/1 0.1 1 1 1 /gcb.1 4872>
Crowther, T. W. , Gl ick, H. B. , Covey, K. R. , Bettigole, C. , Maynard, D. S. , et al . 201 5.
Mapping tree density at a global scale. Nature 525: 201 –205.
<https://doi .org/1 0.1 038/nature1 4967>
Curtis, P. G. , Slay, C. M. , Harris, N. L. , Tyukavina, A. , & Hansen, M. C. 201 8. Classify-
ing drivers of global forest loss. Science 361 , 6407: 1 1 08–1 1 1 1 .
<https://doi .org/1 0.1 1 26/science.aau3445>
Dinerstein, E. , Vynne, C. , Sala, E. , Joshi , A. R. , Fernando, S. , et al . 201 9. A global
deal for nature: guiding principles, mi lestones, and targets. Science Ad-
vances 5, 4: eaaw2869. <https://doi .org/1 0.1 1 26/sciadv.aaw2869>
Gardner, C. J. and Wordley, C. F. 201 9. Scientists must act on our own warnings to
humanity. Nature Ecology & Evolution 3, 9: 1 271 –1 272.
<https://doi .org/1 0.1 038/s41 559-01 9-0979-y>
Gaveau, D. L. , Locatel l i , B. , Sal im, M. A. , Yaen, H. , Pacheco, P. and Shei l , D. 201 8.
Rise and fal l of forest loss and industrial plantations in Borneo (2000–201 7).
Conservation Letters 1 2, 3: e1 2622. <https://doi .org/1 0.1 1 1 1 /conl . 1 2622>
Hockley, N. , Mandimbiniaina, R. and Rakotonarivo, O. S. 201 8. Fair and equitable
conservation: do we real ly want it, and if so, do we know how to achieve it?
Madagascar Conservation & Development 1 3, 1 : 3–5.
<https://doi .org/1 0.431 4/mcd.v1 3i1 . 1 1 >
Lemoine, D. and Traeger, C. P. 201 6. Economics of tipping the cl imate dominoes.
Nature Cl imate Change 6, 5: 51 4–51 9.
<https://doi .org/1 0.1 038/ncl imate2902>
Lenton, T. M. , Rockström, J. , Gaffney, O. , Rahmstorf, S. , Richardson, K. , et al . 201 9.
Cl imate tipping points—too risky to bet against. Nature 575: 592–595.
<https://doi .org/1 0.1 038/d41 586-01 9-03595-0>
Lovejoy, T. E. and Nobre, C. 201 8. Amazon tipping point. Science Advances 4, 2:
eaat2340. <https://doi .org/1 0.1 1 26/sciadv.aat2340>
Mongabay. 201 9. Worldwide deforestation rising despite bold commitments, re-
port finds. Avai lable onl ine <https://news.mongabay.com/201 9/09/world-
wide-deforestation-rising-despite-bold-commitments-report-finds/>
MADAGASCAR CONSERVATION & DEVELOPMENT PAGE 5VOLUME 1 4 | ISSUE 01 — DECEMBER 201 9
NYDF Assessment Partners. 201 9. Protecting and Restoring Forests: A Story of
Large Commitments yet Limited Progress. New York Declaration on Forests
Five-Year Assessment Report. Cl imate Focus (coordinator and editor). Avai l -
able onl ine <https://forestdeclaration.org>
Pancel , L. and Köhl , M. 201 6. Tropical Forestry Handbook. Springer Berl in Heidel-
berg 4 vol . : i–lx,1 –3633. <https://doi .org/1 0.1 007/978-3-642-41 554-8>
Ranjatson, P. , McLain, R. , Mananga, J. , Randrianasolo, R. , Razafimbelo, Ny T. , Lawry,
S. 201 9. Tenure Security and Forest Landscape Restoration: Results from
Exploratory Results from Explanatory Research in Boeny, Madagascar. Pa-
per prepared for presentation at the“201 9 World Bank Conference On Land
And Poverty”. The World Bank, Washington DC. Avai lable onl ine
<http://www.cifor.org/publ ications/pdf_fi les/Papers/PMcLain1 901 .pdf>
Styger, E. , Rakotondramasy, H. M. , Pfeffer, M. J. , Fernandes, E. C. andBates, D. M.
2007. Influence of slash-and-burn farming practices on fal low succession
and land degradation in the rainforest region of Madagascar. Agriculture,
Ecosystems & Environment 1 1 9(3–4): 257–269.
<https://doi .org/1 0.1 01 6/j .agee.2006.07.01 2>
Tol lefson, J. 201 9. Humans are driving one mi l l ion species to extinction. Nature
569: 1 71 . <https://doi .org/1 0.1 038/d41 586-01 9-01 448-4>
Turubanova, S. , Potapov, P. V. , Tyukavina, A. and Hansen, M. C. 201 8. Ongoing pri-
mary forest loss in Brazi l , Democratic Republ ic of the Congo, and Indonesia.
Environmental Research Letters 1 3, 7: 074028.
<https://doi .org/1 0.1 088/1 748-9326/aacd1 c>
Tyukavina, A. , Hansen, M. C. , Potapov, P. , Parker, D. , Okpa, C. , Stehman, S. V. , et al .
201 8. Congo Basin forest loss dominated by increasing smal lholder clear-
ing. Science Advances 4, 1 1 : eaat2993.
<https://doi .org/1 0.1 1 26/sciadv.aat2993>
Waeber, P. O. , Rafanoharana, S. , Rasamuel , H. A. and Wi lmé, L. 201 9. Parks and re-
serves in Madagascar: managing biodiversity for a sustainable future. [On-
l ine First] , IntechOpen. <https://doi .org/1 0.5772/intechopen.85348>
MADAGASCAR CONSERVATION & DEVELOPMENT PAGE 6VOLUME 1 4 | ISSUE 01 — DECEMBER 201 9
ABSTRACT
The Grandidier’s baobab conveys the image of Madagascar world-
wide. Local ly, these trees have multiple uses with al l parts of the
plant being exploited by the population. We investigated the pat-
terns of bark harvesting on the Grandidier’s baobab in three dis-
tricts in the Menabe Region: Mahabo, Manja and Morondava.
Fol lowing 1 03 transects of 1 km each, we found that 54.0% of the
baobab trees had been subject to bark extraction. The mean total
area exploited per tree was 3,1 ± 0.2m2. Between Apri l 201 3 and
January 201 4, we also monitored four markets that regularly sel l
baobab products: Bemanonga, Mahabo, Morondava and Analaiva.
Bemanonga revealed to be the largest market for the baobab bark
with 21 ,594 straps and 34,51 7m of ropes recorded during the ob-
servation period. We estimate that some 9800 Grandidier’s
baobab trees have been affected by debarking to supply the de-
mands recorded over the ten months monitoring period. I f this de-
mand remains constant, al l baobab trees in Menabe would be
debarked within the next 39 years. Since most baobab trees have
been located in hard-to-reach areas and in protected areas, bark
extraction may intensify in accessible sites and populations with-
out protected status may disappear local ly. This would result in lo-
cal extinction of the species within a short period. To ensure
sustainable management of the Grandidier’s baobab, we recom-
mend enriching the population by planting young baobabs, regu-
lating access to the resources through local management
structures and promoting alternatives to baobab ropes.
RÉSUMÉ
Le baobab de Grandidier est une espèce emblématique de Mada-
gascar. I l évoque la Grande Île dans le monde entier. Dans sa zone
d’occurrence, c’est une espèce à usage multiple pour les riverains
qui uti l isent toutes les parties de ce baobab. La présente étude
porte sur l ’exploitation de l ’écorce du baobab de Grandidier dans
la région Menabe, plus particul ièrement dans les districts de
Mahabo, Manja et de Morondava. Pour estimer l ’étendue de l ’ex-
ploitation des écorces sur les pieds de baobabs, des observations
ont été réal isées sur 1 03 transects de 1 km de long entre avri l
201 3 et janvier 201 4. Pour évaluer l ’ importance des écorces de
baobab pour les riverains, des observations ont été conduites au
niveau de quatre marchés de la région dans les vi l les de
Bemanonga, Mahabo, Morondava et Analaiva au cours de la
même période. Au total , 21 594 lanières d’écorce et 34 51 7 m de
corde de baobab ont été recensés dans les quatre marchés. La
plus importante quantité d’écorce de baobabs commercial isée a
été enregistrée à Bemanonga. À partir des données récoltées, i l
est estimé que près de 9800 pieds de baobabs à écorcer sont
nécessaires pour couvrir les besoins des riverains pendant la
seule période d’études de 1 0 mois. Si la demande devait se main-
tenir à ce niveau, tous les pieds de baobab de la région Menabe,
dont la population avait été estimée à environ un mi l l ion d’indi-
vidus, seraient écorcés au cours des 39 prochaines années.
Comme la plupart des pieds de baobab ont été local isés dans des
zones diffici les d’accès et dans les aires protégées, l ’extraction
des écorces pourrait s’ intensifier dans les sites accessibles et les
populations qui ne bénéficient d’aucun statut de protection pour-
raient disparaître localement. Pour assurer la gestion durable du
baobab de Grandidier, i l est ainsi recommandé de renforcer la
population existante par la plantation de jeunes plants, la régula-
tion de l ’accès aux ressources par des structures locales de ges-
tion et la promotion d’al ternatives aux cordes réal isées avec les
écorces de baobab.
INTRODUCTIONMadagascar has a unique biodiversity that places the country
among the world’s conservation priorities (Myers et al . 2000,
Brooks et al . 2002). Considering the vascular plants only, 1 1 ,220
species were recorded in Madagascar, of which 82% are endemic
(Cal lmander et al . 201 1 ). The eastern Malagasy rainforest is among
the centres of species richness with more than 3000 species per
1 0,000 km2 (Mutke et al . 201 1 ). The western tropical dry forest has
a lower species richness but is famous for the iconic baobabs,
which have important functions for people and the ecosystem
ARTICLE http://dx.doi .org/1 0.431 4/mcd.v1 4i1 .3
Bark harvesting: a potential threat for theGrandidier’s baobab Adansonia grandidieri inwestern Madagascar
Daudet Andriafid isonI, Cynthia OnjanantenainaRavelosonI I, Wi l ly Sylvio MananjaraI, Ju l ie HantaRazafimanahakaI
Correspondence:
Daudet Andriafid ison
Madagasikara Voakajy, Lot I I F 1 4 P Bis A Andraisoron, BP 51 81 ,
Antananarivo 1 01 , Madagascar
Emai l : andriafid [email protected]
Citation Andriafid ison, A. , Raveloson, C. O. , Mananjara, W. S. , Razafimanahaka, J. H. 201 9. Bark harvesting: a threat for the Grandidier’s baobab Adansonia grandidieri
in western Madagascar. Madagascar Conservation & Development 1 4, 1 : 6–1 1 . http://dx.doi .org/1 0.431 4/mcd.v1 4i1 .3
I Madagasikara Voakajy, Lot I I F 1 4 P Bis A Andraisoron, BP 51 81 , Antananarivo, MadagascarI I Direction Régionale de l 'Environnement, de l 'Écologie et des Forêts Menabe, Morondava, Madagascar
MADAGASCAR CONSERVATION & DEVELOPMENT PAGE 7VOLUME 1 4 | ISSUE 01 — DECEMBER 201 9
and are facing multiple threats (Mi les et al . 2006, Graf et al . 2009,
Ehrensperger et al . , 201 3, Grinand et al . 201 3, Zinner et al . 201 3).
Eight species of baobabs are known worldwide, six of which
are endemic to western Madagascar (Cron et al . 201 6, Karimi et al .
201 9). According to Cuni Sanchez (201 0), the baobab tree has a
multi tude of use in Africa and Austral ia. Besides uti l izing the fruit,
bark and leaves, the size and shape of the tree lends itself to spa-
ces for water storage, prisons, toi lets, burial grounds, sleeping
places, shelters, ri tual sites and venues for prayers (Mukamuri and
Kozanayi 1 999, Wickens and Lowe 2008). Malagasy baobabs have
multiple functions and uses. The Grandidier’s baobab Adansonia
grandidieri stands out because of its iconic image representing
Madagascar on most documentaries and advertisements. The Al-
lée des Baobabs in Morondava attracts many tourists and is a ma-
jor source of income for the Region (Scales 201 4).
Non-timber forest products (NTFPs) are important resources
for people in western Madagascar. Bushmeat, medicinal plants,
materials for construction, weaving and other handicrafts are col-
lected from the wi ld (Garcia and Goodman 2003, Norscia and Bor-
gognini-Tarl i 2006, Randrianandrianina et al . 201 0, Scales 201 2).
These resources are col lected for household consumption, but
also sold on markets as a source of income. NTFPs often provide
economic buffers to the Malagasy rural populations when crops
fai l and can help provide additional seasonal income when the
benefits of other economic activities are reduced (Neudert et al .
201 7).
NTFPs significantly contribute to l ivel ihood security in the
Menabe Region and have traditional ly been used by rural commu-
nities for subsistence and trade (Ramohavelo and Sorg 2008). Tu-
bers from Dioscorea maciba and Tacca pinnatifida , Tenrec
ecaudatus bushmeat (a mammal species), and honey are impor-
tant NTFPs for local l ivel ihoods (Ramohavelo and Sorg 2008).
Grandidier’s baobab Adansonia grandidieri trees also provide lo-
cal ly important NTFP products, mainly for consumption (fruits,
seeds, leaves and bark as infusion) and construction (Baum 1 996,
Marie et al . 2009). The Grandidier’s baobab is l isted as Endangered
on the IUCN Red List of Threatened Species; the major threat is
poor regeneration (IUCN 201 6). This species is the most heavi ly
exploited of Madagascar’s baobabs (Perrier de la Bâthie 1 924,
Bond 2002, Rakotondrazanany 201 6, pers. comm.). The fruits and
seeds are col lected for food and extraction of cooking oi l , the bark
is used to make ropes, and the spongy wood is dried and sold for
thatch. However, the greatest threat to Grandidier’s baobab
comes from the conversion of its habitat into agricultural land.
Mature trees are left standing, presumably because of their cul-
tural importance and the value of the fruit, bark and wood. The
impacts of local exploitation of NFTPs from this species remains
poorly understood, l imiting our abi l i ty to define appropriate con-
servation measures, especial ly in areas of conservation impor-
tance from where sustainable extraction is permitted.
In this article, we focus on the activity of bark col lection from
the Grandidier’s baobab. We aim to understand the importance of
this activity to rural communities in the Menabe Region and the
potential impacts of bark harvesting on the species population.
This information helps designing targeted conservation strategies
for the Grandidier’s baobab.
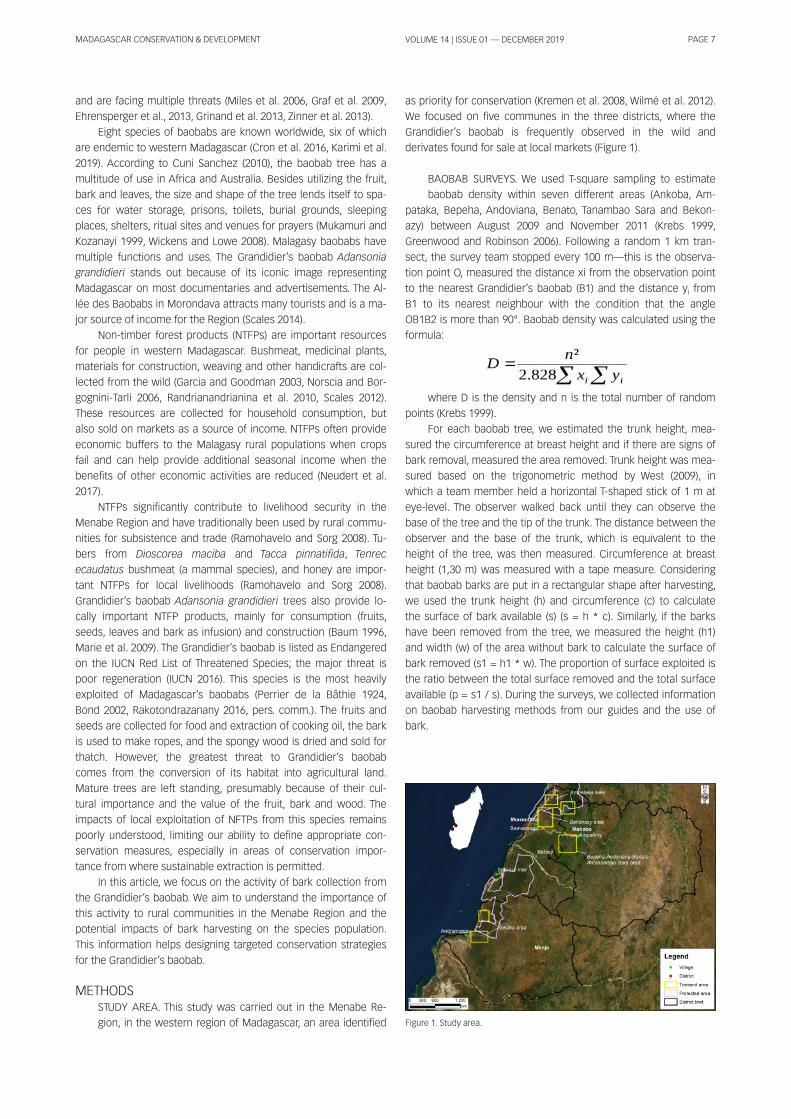
METHODSSTUDY AREA. This study was carried out in the Menabe Re-
gion, in the western region of Madagascar, an area identified
as priority for conservation (Kremen et al . 2008, Wi lmé et al . 201 2).
We focused on five communes in the three districts, where the
Grandidier’s baobab is frequently observed in the wi ld and
derivates found for sale at local markets (Figure 1 ).
BAOBAB SURVEYS. We used T-square sampl ing to estimate
baobab density within seven different areas (Ankoba, Am-
pataka, Bepeha, Andoviana, Benato, Tanambao Sara and Bekon-
azy) between August 2009 and November 201 1 (Krebs 1 999,
Greenwood and Robinson 2006). Fol lowing a random 1 km tran-
sect, the survey team stopped every 1 00 m—this is the observa-
tion point O, measured the distance xi from the observation point
to the nearest Grandidier’s baobab (B1 ) and the distance yi from
B1 to its nearest neighbour with the condition that the angle
OB1 B2 is more than 90°. Baobab density was calculated using the
formula:
where D is the density and n is the total number of random
points (Krebs 1 999).
For each baobab tree, we estimated the trunk height, mea-
sured the circumference at breast height and if there are signs of
bark removal , measured the area removed. Trunk height was mea-
sured based on the trigonometric method by West (2009), in
which a team member held a horizontal T-shaped stick of 1 m at
eye-level . The observer walked back unti l they can observe the
base of the tree and the tip of the trunk. The distance between the
observer and the base of the trunk, which is equivalent to the
height of the tree, was then measured. Circumference at breast
height (1 ,30 m) was measured with a tape measure. Considering
that baobab barks are put in a rectangular shape after harvesting,
we used the trunk height (h) and circumference (c) to calculate
the surface of bark avai lable (s) (s = h * c). Simi larly, i f the barks
have been removed from the tree, we measured the height (h1 )
and width (w) of the area without bark to calculate the surface of
bark removed (s1 = h1 * w). The proportion of surface exploited is
the ratio between the total surface removed and the total surface
avai lable (p = s1 / s). During the surveys, we col lected information
on baobab harvesting methods from our guides and the use of
bark.
Figure 1 . Study area.
MADAGASCAR CONSERVATION & DEVELOPMENT PAGE 8VOLUME 1 4 | ISSUE 01 — DECEMBER 201 9
MARKET MONITORING. Between Apri l 201 3 and January 201 4,
we employed four local observers to record baobab products
avai lable for sale at four markets: Morondava, Mahabo, Be-
manonga, Analaiva (Figure 1 ). This method al lowed us to estimate
the supply of various baobab products (fruits, straps, ropes, barks,
bark parts or pieces for infusion and powder), prices, provenance
and quantity. The observers recorded data weekly with a logbook
to ensure data are recorded in a simi lar way. We used Kruskal l -
Wal l is test to compare monitoring efforts between markets and
the frequency of observation of the different products.
For the barks and derived products, observers recorded the
number of straps (strips of baobab bark) observed per vendor and
estimated the length of the ropes made from baobab bark. They
also recorded the price per strap and per meter of rope. Strap di-
mensions varied between 25–30 cm in width and 2–2.5 m in
length. In the analysis, we assumed that al l straps were 25 cm
wide and 2 m long, and that the same dimensions of baobab bark
are extracted. Open discussions with rope makers revealed that 1
m of rope can be produced with one strap. Using these data, we
calculated the total surface of baobab barks needed to produce
the products avai lable on the market (surface = width * length).
Using the unit cost of each product, we calculated the price of
baobab bark per square meter.
RESULTSPATTERNS OF BARK HARVESTING. We recorded a total of 1 247
Adansonia grandidieri trees, of which 54.0% have been sub-
ject to bark extraction. Baobab density varied between our study
sites and was highest in Analaiva and Andranopasy and lowest in
Ampanihy and Bemanonga. In contrast, levels of bark extraction
were highest in Bemanonga and Befasy and were lowest in An-
dranopasy and Ampanihy (Table 1 ). Large trees with a total bark
surface of 1 4.8 ± 0.3 m2 were preferred for bark extraction (Mann-
Whitney, U = 1 41 981 , Z = -2.981 , p = 0.0003). Smal ler trees with a
total bark surface below 1 3.2 ± 0.4 m2 were left intact. In general ,
only parts of the barks are removed, with an average height of
0.7 m and 0.9 m width on each tree. This was described as the tra-
ditional way to harvest the barks by the local guides. We also ob-
served 41 baobab trees that had been del iberately fel led for bark
extraction, of which 1 6 were in Andranopasy, 1 4 in Ampanihy, 7 in
Analaiva and 4 in Befasy. This practise was described as unusual
and due to the increasing demands for baobab ropes. In 201 0, we
also found eight baobabs that were fel led natural ly by cyclones in
Befasy. Barks of fal len and cut trees were extracted from the en-
tire trunk.
PATTERNS OF BAOBAB BARK TRADE. We made 1 240 observa-
tions of baobab products from the four local markets. Al-
though monitoring effort varied between sites (n = 1 03, 71 , 70 and
52 days, respectively: 6.7 ± 0.7 days per month), up to 80% of
baobab products were observed in Bemanonga despite this site
only accounting for 35% of our monitoring effort. Observations of
baobab products in the other three markets never represented
more than 8% of the records from Analaiva, Mahabo and Moron-
dava.
Three baobab species were reported in the markets: Adanso-
nia grandidieri (91 %), A. za (9%) and A. rubrostipa (only one
record). Baobab products found in the markets included ropes
made of fibres (36.0%), fruits (31 .5%), thin straps made from fibres
and used as twine (21 .5%), bark pieces for infusion (4.6%), fungi
col lected from dead trees (5.1 %), thick straps used for roofing and
wal ls (1 .0%), and seeds as wel l as leaves (0.1 % each).
Observation of Adansonia grandidieri straps and ropes was
significantly more frequent in Bemanonga with 58.6 ± 8.0 records
per month compared to 2.1 ± 0.4 records for the other markets
(Kruskal l Wal l is test: H3= 25.271 , p < 0.001 ). In total , 21 ,594 straps
and 34 51 7 m of rope were recorded from Bemanonga compared
to less than 1 500 straps and 1 500 m of ropes in Analaiva, Mahabo
and Morondava (Table 2). Only straps were avai lable in Moron-
dava, where it is more expensive compared to the other markets
(Table 2). This is probably because 45.6 % of the straps in this mar-
ket are from Andranopasy (Table 3), a commune 1 26 km away
from Morondava. In Mahabo, ropes were twice as expensive as
the straps (Table 2), al though individual bark workers reported that
a strap (general ly of 0.25 cm wide and 2 m long) can make 1m of
rope.
Straps are sold at $US0.1 0 ± 0.002 per unit whi le ropes are
sold at $US0.1 7±0.003 per meter. Al l straps sold in Mahabo market
were from Ampanihy, a commune within the district and only 5.5%
of the ropes are from outside the district (Table 3). Analaiva is the
only market where ropes are cheaper than the straps (Table 2).
This suggests that the demand for ropes in this market is low.
Ropes not sold local ly are sold in Bemanonga (Table 3) where the
price is higher. Straps and ropes from Befasy and Belo-sur-Mer are
also found in Bemanonga market (Table 3).
BARK TRADE AND HARVESTING. We estimated the number of
baobab trees partial ly debarked between Apri l 201 3 and Jan-
uary 201 4 to make the total quantity of ropes recorded (34,51 7m)
to vary between 5230 and 5991 . Estimations of strap and ex-
ploited bark surface area per one meter of rope are based on: (i ) A
typical strap being approximately 25 cm wide and 2 m long
(0.5 m2); (i i ) the mean surface exploited per baobab tree being
3.1 ± 0.2 m2.
According to our calculations, 62.3% of the trees could be
from Bemanonga, 26.4% from Analaiva, 5.6% from Befasy, 3.3%
from Ampanihy and 2.5% from Andranopasy and Belo-sur-Mer.
Analaiva and Bemanonga have the lowest estimated baobab den-
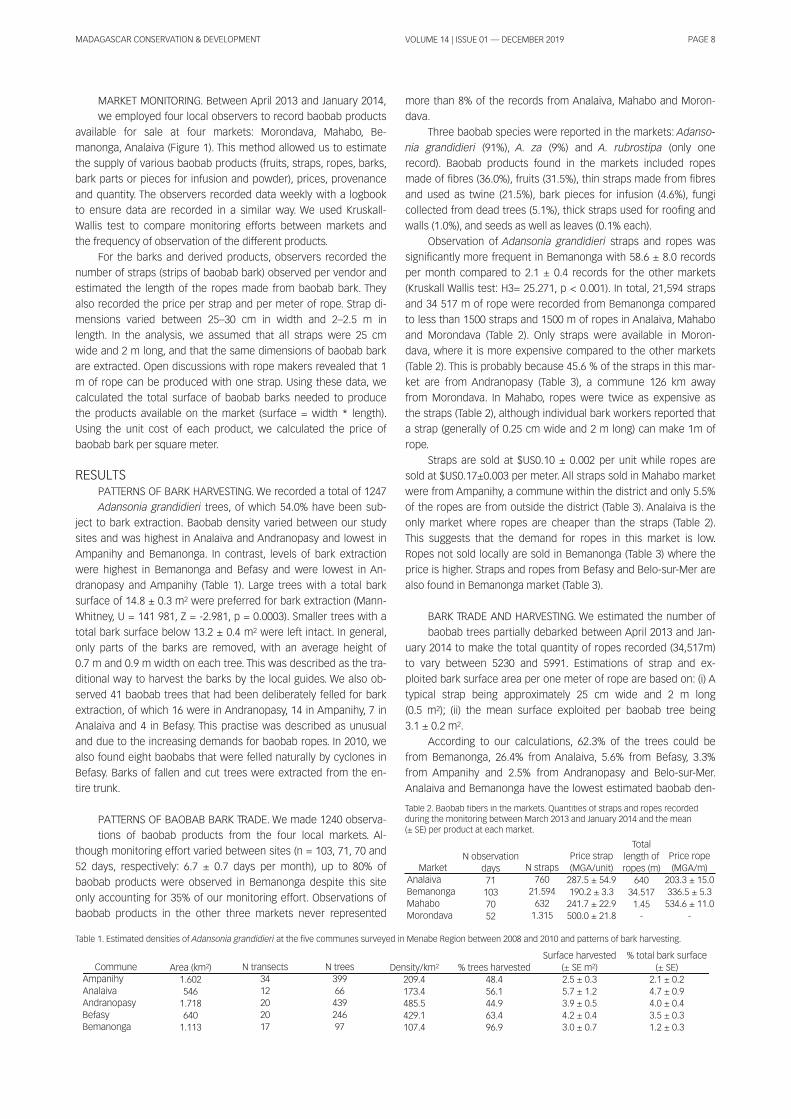
CommuneAmpanihyAnalaivaAndranopasyBefasyBemanonga
Area (km2)1 .6025461 .71 86401 .1 1 3
N transects341 220201 7
N trees3996643924697
Density/km2
209.41 73.4485.5429.11 07.4
% trees harvested48.456.144.963.496.9
Surface harvested(± SE m2)2.5 ± 0.35.7 ± 1 .23.9 ± 0.54.2 ± 0.43.0 ± 0.7
% total bark surface(± SE)
2.1 ± 0.24.7 ± 0.94.0 ± 0.43.5 ± 0.31 .2 ± 0.3
Table 1 . Estimated densities of Adansonia grandidieri at the five communes surveyed in Menabe Region between 2008 and 201 0 and patterns of bark harvesting.
MarketAnalaivaBemanongaMahaboMorondava
N observationdays711 037052
N straps760
21 .5946321 .31 5
Price strap(MGA/unit)287.5 ± 54.91 90.2 ± 3.3241 .7 ± 22.9500.0 ± 21 .8
Totallength ofropes (m)
64034.51 71 .45-
Price rope(MGA/m)
203.3 ± 1 5.0336.5 ± 5.3534.6 ± 1 1 .0
-
Table 2. Baobab fibers in the markets. Quantities of straps and ropes recordedduring the monitoring between March 201 3 and January 201 4 and the mean(± SE) per product at each market.

MADAGASCAR CONSERVATION & DEVELOPMENT PAGE 9VOLUME 1 4 | ISSUE 01 — DECEMBER 201 9
sity (Table 1 ) but have the highest bark harvesting rate (2.7 and
5.1 % of the populations, respectively).
DISCUSSIONThis study showed that more than half of the Grandidier’s baobab
trees in the wi ld have been subject to bark extraction. Since only
part of the bark has been removed, the trees are sti l l standing
many years after the extraction. However, we started to observe
intensive harvesting which consists in cutting down the trees to
remove al l the bark. I f this practise continues, i t wi l l cause the de-
cl ine of the species in the short term.
Ropes made with baobab barks are used as harnesses for
the cattle and for attaching canoes (Wickens and Lowe 2008,
Marie et al . 2009). They are preferred to the nylon ropes because
of their low cost but also, they last longer and do not harm the
cattle. In vi l lages where the palm Bismarckia nobilis is growing, it
is also used in place of the baobabs for making ropes (Mami laza
2009). However, people would sti l l prefer using baobab ropes and
straps if those were avai lable. Sel l ing 1 0m of ropes per day would
be necessary for a person l iving only on baobab rope trade to
reach the poverty l ine of $US2 per day (World Bank 201 4). Al-
though baobab bark harvesting and making ropes does not repre-
sent a major activity in the Menabe, it can be an important source
of income for some. This aspect should be considered when de-
veloping rules related to bark harvesting. Planting the palm Bis-
marckia nobilis is an alternative measure to be promoted as it is a
fire-resistant fast-growing species with simi lar use by local popu-
lations as the baobabs.
This study could not solve the ‘dispute’ between local com-
munities and scientists regarding the impact of bark harvesting on
the baobab trees. On one hand, community members argue that
bark removal do not harm the baobab trees whi le they agree that
bark does not regenerate. However, in the wi ld, the baobabs are
sti l l standing. On the other hand, scientists advocate that bark
harvesting might represent a threat to the trees as they are more
exposed to ecological and cl imatic threats (Wickens and Lowe
2008). In the Al lée des Baobabs, lower barks have been removed
on almost al l the trees but they are sti l l standing (Wickens and
Lowe 2008). In order to determine if the Grandidier’s baobab barks
can be sustainably managed and how, in-depth studies on the im-
pact of bark harvesting is required (Ticktin 2004). In fact, trees may
recover from bark harvesting depending on the species, the tech-
nique used and the environmental conditions (Delvaux et al .
2009). Bark harvesting also has different impacts on tree growth
or fruit production and hence on population sizes (Gaoue and
Ticktin 2008, Schumann et al . 201 0, Schmidt et al . 201 1 ).
The most recent population estimation of the Grandidier’s
baobab is at one mi l l ion trees (Viei l ledent et al . 201 3). During a pe-
riod of 1 0 months, we recorded 34 51 7m of baobab ropes at the
four markets monitored. Assuming that these ropes came exclu-
sively from the partial ly debarked baobabs, they would come from
5230–5991 trees. By extrapolation, there should be enough
baobab bark stock for 1 91 2 months (1 59 years) of baobab barks in
the wi ld. However, we also found that 54% of the baobabs we
found during the field surveys have already been debarked. As a
result, i f the demand remains constant, there is stock only for
about 73 years (1 59 years * 46%).
Other studies in Africa reported that bark harvesting affects
negatively the survival of baobab trees (e.g. , Hal l and Bawa 1 993,
Peters 1 994, Cunningham 2001 ). Survival is threatened because
the extraction of barks could make the individual more suscepti-
ble to pathogen attacks or could expose stem cortex tissue, im-
pairing the flow of water and nutrients, hence reducing survival
rates (Cunningham 2001 ). Botha et al . (2004) also found that on
other tree species, bark removal affected fruit production. In the
wi ld, we have seen that some Grandidier’s baobab had fruits
whi le others did not. Bark harvesting might be a factor contribut-
ing to this variation.
Effective management of the protected areas wi l l play a cen-
tral role to ensure conservation of the Grandidier’s baobab. The
Menabe region, where the Grandidier’s baobab is most abundant,
has four protected areas: Kirindy-Mitea National Park (72 200 ha),
Andranomena (6420 ha) and Ambohi janahary Special Reserves
(27 650 ha) and the Menabe-Antimena Reserve (1 25 000 ha)
(Gardner 201 1 , Waeber et al . 201 9). These protected areas repre-
sent 36% of the Menabe terrestrial ecosystems. I f these protected
areas also had 36% of the baobab population—bark harvesting is
prohibited in protected areas—people wi l l have access to only
640 000 baobab trees, providing barks for some 40–47 years using
the traditional method (i .e. , removing the bark without sophisti-
cated, modern tools at heights not exceeding that of the ex-
ploiter). After this period, risks of fel l ing trees to meet the
demands of the market wi l l increase in accessible areas (Marie et
al . 2009). We thus recommend the establ ishment of local manage-
ment structures that can monitor and regulate exploitation of
baobab barks outside of protected areas by fol lowing the rights
transfer system by which communities can regulate access to
natural resources in their territory, including the baobabs (Antona
et al . 2004). In this case, i t is necessary that the governement who
gives the rights bui lds the capacity of the communities to do so
and support them unti l they can independently manage the re-
sources and get benefits.
ACKNOWLEDGEMENTSWe are grateful to the Ministère de l ’Environnement, de l ’Écologie
et des Forêts for granting us the permit to conduct this research.
We thank al l who participated and assisted in the project: our lo-
cal guides, the Direction Régionale de l ’Environnement et des
Forêts Menabe, and the Madagascar National Parks team in Mo-
rondava. We received support from the Département des Eaux et
MarketStrapsAnalaivaBemanongaMahaboMorondava
RopesAnalaivaBemanongaMahabo
Ampanihy
--
1 00-
--
94.5
Analaiva
36.80.6--
1 0043.35.5
Andranopasy
---
45.6
---
Befasy
-9.1-5.7
-3.9-
Belo-sur-Mer
-2.9--
-0.9-
Bemanonga
63.287.4-
48.7
-52.0-
Table 3. Origin of the baobab bark products avai lable at the markets monitored. (Numbers indicate the percentage of products in the market coming from the Commune)
MADAGASCAR CONSERVATION & DEVELOPMENT PAGE 1 0VOLUME 1 4 | ISSUE 01 — DECEMBER 201 9
Forêts at the École Supérieure des Sciences Agronomiques (Uni-
versity of Antananarivo). We acknowledge Eunicia Mami laza and
Noromampiandra Razafindrakoto, José Ravelomanantsoa and Ro-
bel Rajaonarison who assisted with data col lection during the
baobab surveys. We thank Fauna & Flora International and the
Global Trees Campaign for funding this project.
REFERENCESAntona, M. , Biénabe, E. M. , Sal les, J. -M. , Péchard, G. , Aubert, S. and Ratsimbarison,
R. 2004. Rights transfers in Madagascar biodiversity pol icies: achievements
and significance. Environment and Development Economics 9, 6: 825–847.
<https://doi .org/1 0.1 01 7/S1 355770X04001 640>
Baum, D. A. 1 996. The ecology and conservation of the baobabs of Madagascar.
Primate Report 46: 31 1 –327.
Bond, J. 2002. Baobabs. In: Guide to Madagascar, 7th edn. Bradt H. (ed. ), pp 40–46.
Bradt Publ ications, Chalfont St. Peter.
Botha, J. , Witkowski , E. T. F. and Shackleton, C. M. 2004. The impact of commercial
harvesting on Warbugia salutaris (pepper-bark tree) in Mpumalanga, South
Africa. Biodiversity & Conservation 1 3, 9: 1 675–1 698.
<https://doi .org/1 0.1 023/B:BIOC.0000029333.72945.b0>
Brooks, T. M. , Mittermeier, R. A. , Mittermeier, C. G. , da Fonseca, G. A. B. , Rylands, A.
B. et al . 2002. Habitat loss and extinction in the hotspots of biodiversity.
Conservation Biology 1 6, 4: 909–923.
<https://doi .org/1 0.1 046/j . 1 523-1 739.2002.00530.x>
Cal lmander, M. W. , Phi l l ipson, P. B. , Schatz, G. E. , Andriambololonera, S. , Rabarima-
narivo, M. et al . 201 1 . The endemic and non-endemic vascular flora of
Madagascar updated. Plant Ecology and Evolution 1 44, 2: 1 21 –1 25.
<https://doi .org/1 0.5091 /plecevo.201 1 .51 3>
Cron, G. V. , Karimi , N. , Glennon, K. L. , Udeh, C. , Witkowski , E. T. F. , et al . 201 6. One
African baobab species or two? A re-evaluation of Adansonia ki l ima. South
African Journal of Botany 1 03: 31 2.
<https://doi .org/1 0.1 01 6/j .sajb.201 6.02.036>
Cuni Sanchez, A. , Osborne, P. E. and Haq, N. 201 0. Identifying the global potential
for baobab tree cultivation using ecological n iche model l ing. Agroforestry
Systems 80, 2: 1 91 –201 . <https://doi .org/1 0.1 007/s1 0457-01 0-9282-2>
Cunningham, A. 2001 . Appl ied ethnobotany: people, wi ld plant uses and conser-
vation. Earthscan Publ ications Ltd. , London, UK.
Delvaux, C. , Sinsin, B. , Darchambeau, F. and Van Damme, P. 2009. Recovery from
bark harvesting of 1 2 medicinal tree species in Benin, West Africa. Journal
of Appl ied Ecology 46, 3: 703–71 2.
<https://doi .org/1 0.1 1 1 1 /j . 1 365-2664.2009.01 639.x>
Ehrensperger, T. , Urech, Z. L. , Rehnus, M. and Sorg, J. P. 201 3. Fire impact on the
woody plant components of dry deciduous forest in Central Menabe,
Madagascar. Appl ied Vegetation Science 1 6, 4: 61 9–628.
<https://doi .org/1 0.1 1 1 1 /avsc.1 2034>
Gaoue, O. G. and Ticktin, T. 2008. Impacts of bark and fol iage harvest on Khaya
senegalensis (Mel iaceae) reproductive performance in Benin. Journal of Ap-
pl ied Ecology 45, 1 : 34–40.
<https://doi .org/1 0.1 1 1 1 /j . 1 365-2664.2007.01 381 .x>
Garcia, G. and Goodman, S. M. 2003. Hunting of protected animals in the Parc Na-
tional d'Ankarafantsika, north-western Madagascar. Oryx 37, 1 : 1 1 5–1 1 8.
<https://doi .org/1 0.1 01 7/S0030605303000206>
Gardner, C. J. 201 1 . IUCN management categories fai l to represent new, multiple-
use protected areas in Madagascar. Oryx 45, 3: 336–346.
<https://doi .org/1 0.1 01 7/S003060531 0001 808>
Graf, E. , Andriambelo, L. H. and Sorg, J. -P. 2009. Ecological and social issues, avai l -
abi l i ty and uses of four timber tree species in Menabe, Madagascar. Bois et
Forêts des Tropiques 302, 4: 33–41 .
Greenwood, J. J. D. and Robinson, R. A. 2006. General census methods. In : Ecologi-
cal Census Techniques. Sutherland, W. J. (ed. ), pp 87–1 83. Cambridge Uni-
versity Press, Cambridge.
Grinand, C. , Rakotomalala, F. , Gond, V. , Vaudry, R. , Bernoux, M. and Viei l ledent, G.
201 3. Estimating deforestation in tropical humid and dry forests in Mada-
gascar from 2000 to 201 0 using multi -date Landsat satel l i te images and the
random forests classifier. Remote Sensing of Environment 1 39: 68–80.
<https://doi .org/1 0.1 01 6/j . rse.201 3.07.008>
Hal l , P. and Bawa, K. , 1 993. Methods to assess the impact of the extraction of non-
timber tropical forest products on plant populations. Economic Botany 47,
3: 234-247. <https://doi .org/1 0.1 007/BF02862289>
IUCN 201 6. The IUCN Red List of Threatened Species 201 6. Version 3.1 . Avai lable
onl ine <www. iucnredl ist.org>
Karimi , N. , Grover, C. E. , Gal lagher, J. P. , Wendel , J. F. , Ané, C. and Baum, D. A. 201 9.
Reticulate evolution helps explain apparent homoplasy in floral biology and
pol l ination in baobabs (Adansonia; Bombacoideae; Malvaceae). Systematic
Biology. <https://doi .org/1 0.1 093/sysbio/syz073/561 3901 >
Krebs, C. J. (ed. ) 1 999. Ecological Methodology. Benjamin Cummings, Menlo Park,
Cal i fornia.
Kremen, C. , Cameron, A. , Moi lanen, A. , Phi l l ips, S. J. , Thomas, C. D. et al . 2008.
Al igning conservation priorities across taxa in Madagascar with high-reso-
lution planning tools. Science 320, 5873: 222–226.
<https://doi .org/1 0.1 1 26/science.1 1 551 93>
Mamilaza, L. E. 2009. Diagnostic de la fi l ière baobab : quel les l imites et perspec-
tives ? Cas de Adansonia grandidieri dans la commune de Bemanonga, ré-
gion du Menabe. Mémoire d’études pour l ’obtention du Diplôme d’Etudes
Supérieures Spécial isées. Option Développement Local et Gestion de Projet.
63 pp. Faculté de Droit, Economie et de la Sociologie. Département
Economie. Université d’Antananarivo.
Marie, C. N. , Sibelet, N. , Dulcire, M. , Rafal imaro, M. , Danthu, P. and Carrière, S. M.
2009. Taking into account local practices and indigenous knowledge in an
emergency conservation context in Madagascar. Biodiversity and Conser-
vation 1 8, 1 0: 2759–2777. <https://doi .org/1 0.1 007/s1 0531 -009-9672-9>
Mi les, L. , Newton, A. C. , DeFries, R. S. , Ravi l ious, C. , May, I . , et al . 2006. A global
overview of the conservation status of tropical dry forests. Journal of Bio-
geography 33, 3: 491 –505.
<https://doi .org/1 0.1 1 1 1 /j . 1 365-2699.2005.01 424.x>
Mukamuri , B. B. and Kozanayi , W. 1 999. Institutions surrounding the use of mar-
keted bark products. The case of Berchemia discolor, Adansonia digitata,
and Warburgia salutaris. IES Working Paper Number 1 7. Avai lable at
<https://opendocs. ids.ac.uk/opendocs/>
Mutke, J. , Sommer, J. H. , Kreft, H. , Kier, G. and Barthlott, W. 201 1 . Vascular plant di-
versity in a changing world: global centres and biome-specific patterns. In :
Biodiversity Hotspots—Evolution and Conservation. J. C. Habel and F. Za-
chos (eds. ), pp 83–96. Springer, Berl in, Heidelberg, Germany.
Myers, N. , Mittermeier, R. A. , Mittermeier, C. G. , da Fonseca, G. A. B. and Kent, J.
2000. Biodiversity hotspots for conservation priorities. Nature 403: 853–858.
Neudert, R. , Ganzhorn, J. U. and Waetzold, F. 201 7. Global benefits and local
costs—the di lemma of tropical forest conservation: A review of the situa-
tion in Madagascar. Environmental Conservation 44, 1 : 82–96.
<https://doi .org/1 0.1 01 7/S037689291 6000552>
Norscia, I . and Borgognini-Tarl i , S. M. 2006. Ethnobotanical reputation of plant
species from two forests of Madagascar: A prel iminary investigation. South
African Journal of Botany 72, 4: 656–660.
<https://doi .org/1 0.1 01 6/j .sajb.2006.04.004>
Perrier de la Bâthie, H. 1 924. Sur quelques plantes non cultivées de Madagascar à
fruits comestibles ou uti les et sur la possibi l i té de leur culture. Journal
d’Agriculture Traditionnel le et de Botanique Appl iquée 38: 652–662.
<https://doi .org/1 0.3406/jatba.1 924.4224>
Peters, C. M. 1 994. Sustainable harvest of non-timber plant resources in tropical
moist forest: an ecological primer. WWF, Washington.
Ramohavelo, D. and Sorg, J. -P. 2008. Using NTFPs to drive rural development with-
out threatening biodiversity? A concrete example concerning four NTFPs in
Central Menabe, Madagascar. Tropentag 2008 University of Hohenheim, Oc-
tober 7–9, 2008 Conference on International Research on Food Security,
Natural Resource Management and Rural Development.
Randrianandrianina, F. H. , Racey, P. A. and Jenkins, R. K. B. 201 0. Hunting and con-
sumption of mammals and birds by people in urban areas of western
Madagascar. Oryx 44, 3: 41 1 –41 5.
<https://doi .org/1 0.1 01 7/S003060531 000044X>
MADAGASCAR CONSERVATION & DEVELOPMENT PAGE 1 1VOLUME 1 4 | ISSUE 01 — DECEMBER 201 9
Scales, I . R. 201 2. Lost in translation: confl icting views of deforestation, land use
and identity in western Madagascar. The Geographical Journal 1 78, 1 : 67–79.
<https://doi .org/1 0.1 1 1 1 /j . 1 475-4959.201 1 .00432.x>
Scales, I . R. 201 4. Tourism, conservation and development in Madagascar: moving
beyond panaceas? In: Rainforest Tourism, Conservation and Management:
Chal lenges for Sustainable Development. B. Prideaux (ed. ), pp 255–256.
Earthscan, London.
Schmidt, I . B. , Mandle, L. , Ticktin, T. and Gaoue, O. G. 201 1 . What do matrix popula-
tion models reveal about the sustainabi l i ty of non-timber forest product
harvest? Journal of Appl ied Ecology 48, 4: 81 5–826.
<https://doi .org/1 0.1 1 1 1 /j . 1 365-2664.201 1 .01 999.x>
Schumann, K. , Wittig, R. , Thiombiano, A. , Becker, U. and Hahn, K. 201 0. Impact of
land-use type and bark and leaf-harvesting on population structure and
fruit production of the baobab tree (Adansonia digitata L. ) in a semi-arid sa-
vanna, West Africa. Forest Ecology and Management 260, 1 1 : 2035–2044.
<https://doi .org/1 0.1 01 6/j . foreco.201 0.09.009>
Ticktin, T. 2004. The ecological impl ications of harvesting non-timber forest prod-
ucts. Journal of Appl ied Ecology 41 , 1 : 1 1 –21 .
<https://doi .org/1 0.1 1 1 1 /j . 1 365-2664.2004.00859.x>
Viei l ledent, G. , Cornu, C. , Cuni Sanchez, A. , Leong Pock-Tsy, J. -M. and Danthu, P.
201 3. Vulnerabi l i ty of baobab species to cl imate change and effectiveness
of the protected area network in Madagascar: Towards new conservation
priorities. Biological Conservation 1 66: 1 1 –22.
<https://doi .org/1 0.1 01 6/j .biocon.201 3.06.007>
Waeber, P. O. , Rafanoharana, S. , Rasamuel , H. A. and Wi lmé, L. 201 9. Parks and re-
serves in Madagascar: managing biodiversity for a sustainable future. [On-
l ine First] , IntechOpen. <https://doi .org/1 0.5772/intechopen.85348>
West, P. W. 2009. Tree and Forest Measurement. Springer-Verlag Berl in Heidelberg.
Wickens, G. E. and Lowe, P. 2008. The Baobabs: Pachycauls of Africa, Madagascar
and Austral ia. Springer, The Netherlands.
Wi lmé, L. , Ravokatra, M. , Dolch, R. , Schuurman, D. , Mathieu, E. , et al . 201 2. To-
ponyms for centers of endemism in Madagascar. Madagascar Conservation
& Development 7: 30–40. <https://doi .org/1 0.431 4/mcd.v7i1 .6>
World Bank. 201 4. Poverty Overview. Avai lable at <http://tiny.cc/4wbghz>
Zinner, D. , Wygoda, C. , Razafimanantsoa, L. , Rasoloarison, R. , Andrianandrasana,
H. T. , et al . 201 3. Analysis of deforestation patterns in the central Menabe,
Madagascar, between 1 973 and 201 0. Regional Environmental Change 1 4,
1 : 1 57–1 66. <https://doi .org/1 0.1 007/s1 01 1 3-01 3-0475-x>
SUPPLEMENTARY MATERIAL
Table S1 . Starting points of transects in the Menabe Region.
MADAGASCAR CONSERVATION & DEVELOPMENT PAGE 1 2VOLUME 1 4 | ISSUE 01 — DECEMBER 201 9
ABSTRACTMadagascar’s population rel ies almost exclusively on sol id
biomass, i .e. , firewood and charcoal , for subsistence. The ongoing
extraction of such natural resources is unsustainable, threatening
endemic biodiversity with extinction, and jeopardizing the long-
term l ivel ihoods of local populations. Improved, or fuel-efficient,
cookstove programs have been implemented in Madagascar for
more than a decade to mitigate deforestation. The Duke Lemur
Center-SAVA Conservation (DLC-SAVA) and other NGOs have sub-
sid ized “rocket” fuel-efficient ADES-brand stoves in the SAVA re-
gion as part of ongoing conservation activities. To re-assess our
DLC-SAVA subsidy program, we conducted surveys in 1 5 com-
munes in the SAVA region to document fuel use, cookstove pref-
erences, and the potential impact of ADES-brand stoves. We show
that: (i ) fi rewood was used more frequently than charcoal in more
remote vi l lages; (i i ) metal tripods were the most frequently used
cooking structure despite their low fuel efficiency; (i i i ) ADES-brand
stoves were rarely owned and oftentimes underused; and (iv)
“cooking time” and “fuel efficiency” were the most commonly pre-
ferred stove features given by respondents using firewood-fueled
and charcoal-fueled cookstoves respectively. The low incidence of
ADES stoves in our sample cal ls for a larger-scale program to in-
crease their avai labi l i ty and accessibi l i ty to the region, a more
comprehensive train ing/advertising strategy, and more effective
logistical planning to distribute and sel l the stoves across larger
regions far from urbanized centers. Moreover, NGOs could assist
in providing train ing on fuel-efficient stove design to experienced
individuals who are already producing and distributing stoves lo-
cal ly, as a way to support sustainabi l i ty whi le promoting and lever-
aging local knowledge. We conclude that because a large portion
of the population is using metal tripods on a regular basis, intro-
ducing any type of “fuel-efficient” stove at a large scale, is ex-
pected to make a difference in biomass consumption, in addition
to reducing the burden imposed on biomass col lectors and carri-
ers.
RÉSUMÉLa population de Madagascar dépend presque exclusivement
d’une biomasse sol ide, c’est-à-dire du bois de chauffage ou du
charbon de bois, pour sa subsistance. Le niveau actuel de l ’ex-
ploitation des ressources naturel les n’est pas pérenne et menaçe
d'extinction la biodiversité endémique en mettant en péri l les
moyens de subsistance à long terme des habitants. Des pro-
grammes destinés à la promotion de foyers amél iorés ou
économes en énergie ont été mis en œuvre à Madagascar pen-
dant plus de dix ans pour atténuer la déforestation. Le Duke
Lemur Center-SAVA Conservation (DLC-SAVA) et d'autres ONG ont
subventionné des foyers amél iorés d’une grande efficacité
énergétique de la marque ADES dans la région SAVA dans le
cadre des activités de conservation en cours. Pour ré-évaluer le
programme de subvention DLC-SAVA, des enquêtes ont été
menées dans 1 5 communes de la région SAVA afin de docu-
menter l 'uti l isation de combustible, les préférences en matière de
foyers et l ' impact potentiel des foyers de la marque ADES. Les ré-
sultats obtenus ont permis de montrer que (i ) le bois de chauffage
est plus fréquemment uti l isé que le charbon de bois dans les vi l -
lages les plus reculés ; (i i ) les trépieds métal l iques sont la struc-
ture de cuisson la plus uti l isée malgré son faible rendement
énergétique ; (i i i ) les foyers amél iorés de la marque ADES ont été
trouvés en petit nombre et souvent sous-uti l isés ; et (iv) le temps
de cuisson et l 'efficacité énergétique étaient les deux choix les
plus souvent mentionnés par les répondants uti l isant respective-
ment des fourneaux à bois et à charbon de bois. La faible inci-
dence des foyers ADES dans notre échanti l lon montre qu’un
programme à plus grande échel le doit être déployé et devra être
élaboré sur une stratégie de formation et de sensibi l isation plus
complète avec une mei l leure planification logistique pour la distri-
bution et la vente de foyers amél iorés dans l ’ensemble de la ré-
gion, y compris dans les zones éloignées des centres urbains. Les
ONG pourraient participer à une formation spécifique des person-
nes qui ont déjà une expérience dans la production et la distribu-
tion de foyers au niveau local pour qu’el les acquièrent les
compétences en matière de conception de foyers amél iorés à
haute efficacité énergétique, afin de favoriser la durabi l i té tout en
ARTICLE http://dx.doi .org/1 0.431 4/mcd.v1 4i1 .4
Fuel use and cookstove preferences in the SAVAregion
Marina B. BlancoI, Lydia K. GreeneII , I I I , Libby J. DavisIV,Charles WelchI
Correspondence:
Marina B. Blanco
Duke Lemur Center, Durham, NC, USA
Emai l : [email protected]
Citation Blanco, M. B. , Greene, L. K. , Davis, L. J. , Welch, C. 201 9. Fuel use and cookstove preferences in the SAVA region. Madagascar Conservation & Development1 4, 1 : 1 2-1 8. http://dx.doi .org/1 0.431 4/mcd.v1 4i1 .4
I Duke Lemur Center, Durham, NC, USAI I University Program in Ecology, Duke University, Durham, NC, USAI I I Department of Evolutionary Anthropology, Duke University, Durham, NC, USAIV Peace Corps, 1 1 1 1 20th Street NW, Washington, DC, USA

MADAGASCAR CONSERVATION & DEVELOPMENT PAGE 1 3VOLUME 1 4 | ISSUE 01 — DECEMBER 201 9
profitant des connaissances locales. Comme une grande partie de
la population uti l ise régul ièrement des trépieds en métal , l ' intro-
duction de tout type de réchaud « économe en combustible » à
grande échel le devrait faire une différence dans la consommation
de la biomasse, en plus de réduire les coûts l iés à la récolte et au
transport.
INTRODUCTIONDeforestation rates in Madagascar are among the greatest in the
world, posing a threat to the survival of unique biodiversity but
also, ul timately, threatening the l ivel ihoods of local human popula-
tions. Land is predominantly cleared for subsistence agriculture,
timber and firewood (Dasgupta et al . 201 5). At current rates, ex-
tractive practices are unsustainable, a matter that is further com-
pl icated because most people in Madagascar (and indeed
worldwide) are expected to rely on sol id biomass energy, i .e. , fire-
wood and charcoal , for decades to come (World Bank 201 1 ). For
example, a 201 0 report from the Living Standards Measurement
Survey (LSMS), showed that ~99% of households depended on
sol id biomass for cooking in Madagascar, with more than 77% of
households relying on gathered firewood and only 1 7% relying on
charcoal (INSTAT 201 1 ). When urban areas are compared to coun-
tryside regions, however, there is a significant divide in the pre-
dominant type of biomass used for cooking. Whereas people in
the countryside seemingly rely more on firewood, those in urban
areas prioritize charcoal (Dasgupta et al . 201 3).
To tackle the global biomass chal lenge, international efforts,
including governmental and non-governmental organizations
(NGOs) are implementing “clean” or “improved” stove programs
(Duflo et al . 201 2). The relevance of cookstoves is undeniable: food
is at the center of a household, and cookstoves and cooking prac-
tices have immediate impl ications for the economy of the house-
hold, the health of the users, and, more broadly, the environment.
“Improvement” is a relative term, and “improved stoves” encom-
pass a diversity of stove structures that are better, in some re-
gards, to more simple or traditional stoves, such as three-stone
open fires. Any improvements, for example, to increase energy ef-
ficiency or reduce smoke/air pol lution wi l l upgrade the cook-
stove’s status (World Bank 201 1 ). Improved stoves should also be
affordable and relatively portable, so that they can be sold and
distributed at a large scale. Traditional ly, improved stoves have
been promoted by international organizations to better economic
and health conditions of communities across the globe, as grow-
ing scientific data l ink smoke production to the increase of infec-
tious respiratory conditions (Dasgupta et al . 201 5). More recently,
however, proponents of clean stoves have emphasized their im-
portant role in addressing critical environmental concerns. The
threat of global warming, resulting from the loss and ineffective
burning of sol id biomass, has led to programs aimed at minimizing
the contributions of CO2 production to the atmosphere. Despite
the disparity of results across international programs, with some
setbacks and fai lures, the implementation of fuel-efficient cook-
stoves can have a large environmental impact when conducted at
a relatively wide scale (Adler 201 0).
In Madagascar, one such effort has been spearheaded by
ADES (Association pour le Développement de l 'Énergie Solaire),
which has been manufacturing fuel-efficient stoves since 2001
(Vetter 2006). ADES’ “rocket” stoves comprise a fired-clay com-
bustion chamber and a sheet-metal shel l , rendering them durable
and energy efficient. ADES claims that their wood and charcoal
rocket stoves save 46–68% more fuel compared to traditional
structures l ike a metal tripod or open fire (MyCl imate.org 2006).
The stoves come with a 3-year warranty and production costs are
subsidized to keep them affordable. ADES currently operates nine
regional centers for production, sales and maintenance of stoves
in Madagascar (Antananarivo, Antsirabe, Ejeda, Fianarantsoa, Ma-
hajanga, Morondava, two centers in Tol iara and one mobi le center
in central -northern Madagascar). Because ADES does not have a
regional center in the northeastern SAVA (initials from the main
towns of Sambava, Andapa, Vohemar and Antalaha) region, the
Duke Lemur Center-SAVA Conservation program (DLC-SAVA), es-
tabl ished in 201 1 , has been supporting ADES stoves, by subsidiz-
ing transportation costs from the capital Antananarivo to SAVA.
The introduction of ADES cookstoves was among the first commu-
nity-based conservation activities supported by the DLC-SAVA
program. Thus far, over 500 cookstoves, including both wood and
charcoal models, have been imported and distributed in SAVA,
particularly in the main town of Sambava and vi l lages near Maro-
jejy National Park.
The SAVA region in northeastern Madagascar is social ly and
environmental ly complex. On the one hand, it is densely popu-
lated with four large towns at the region’s corners: Sambava, An-
talaha, Vohemar, Andapa; on the other hand, it includes one of the
largest protected forest blocks in Madagascar (Anjahanaribe Sud,
COMATSA, Makirovana/Tsihomanaomby, Marojejy, Masoala)
(Rabearivony et al . 201 5). This contrasting landscape results in a
strong pressure on natural resources by local communities, even
though most of the remaining forest is use-restricted and i l legal to
target by local populations. Moreover, the SAVA region, known as
the vani l la capital of Madagascar, produces a significant portion of
the country’s exportable vani l la. This means that a large portion of
the regional economy is shaped by vani l la market price fluctua-
tions, with an unprecedented injection of cash in the local mar-
kets during the harvest periods. Despite differences in people’s
standards of l iving, occupation, and access to markets or barter-
ing practices, i t is unknown whether SAVA community members
differ in cookstove use in any measurable manner across a social
or economic spectrum and, if so, how those differences may af-
fect their communities and surrounding environments.
OBJECTIVESAlthough DLC-SAVA, along with other local NGOs, has imported
hundreds of stoves to the SAVA region to date, we have not docu-
mented the use and distribution of the stoves to assess whether
improved stoves are frequently used in the region. Thus, as part of
our evaluation program, we conducted general surveys on the
use and preferences of cookstoves in the SAVA region, with a fo-
cus on fuel source, stove type use, household economy, and pre-
ferred features in cookstoves. These data wi l l inform our future
intervention strategies and maximize our efforts by targeting com-
munities based on their needs, consumer preferences and behav-
iors.
We predict variation in the source of fuel , and stove type, as
households are distributed from large towns to remote vi l lages.
Community members in more isolated vi l lages may have access
to forest fragments, or woody agricultural plots, i .e. , fruit or com-
mercial trees, for firewood, but be more l imited in their access to
charcoal (unless it can be produced local ly). Simi larly, and consis-
tent with previous studies in different regions of Madagascar
(Dasgupta et al . 201 3), we predict that charcoal wi l l be used more
MADAGASCAR CONSERVATION & DEVELOPMENT PAGE 1 4VOLUME 1 4 | ISSUE 01 — DECEMBER 201 9
frequently in large towns (Antalaha, Andapa, Sambava) due to its
avai labi l i ty in the markets, concomitant with a lack of firewood ac-
cess.
As DLC-SAVA has concentrated its efforts for ADES distribu-
tion in Sambava and in several vi l lages surrounding Marojejy Na-
tional Park, we predict that these areas wi l l have a greater
prevalence and usage of ADES stoves, with Sambava specifical ly
relying on charcoal models. With regard to Marojejy’s surrounding
vi l lages (e.g. , Ambohimanarina, Manantenina, Mandena and
Maroambihy), perhaps ADES charcoal stoves wi l l be used to offset
the greater monetary cost and more l imited avai labi l i ty of this fuel
source. In contrast, perhaps ADES wood stoves wi l l be more fre-
quently used in vi l lages around Marojejy National Park, where fire-
wood can be gathered from nearby areas, without monetary
expense.
Final ly, we predict that, compared to charcoal users, firewood
users wi l l spend less money on fuel , but spend more time gather-
ing it.
METHODSSURVEY STRUCTURE. To gather information about household
stove uses and preferences, we designed surveys (Table S1
in Supplementary Material ) that recorded the household’s basic
location, including the name of the district, commune, fokontany
(local vi l lage name); proxies of household economic status, includ-
ing wal l and roof materials; and information regarding stove use,
including the number and types of stoves, fuel source, cooking
space, and the money and time respectively spent buying or col-
lecting fuel . We also included a l ist of cookstove features that re-
spondents had to select based on their preferences: type of fuel ,
fuel efficiency, doesn’t dirty pots, cooking time, amount of smoke,
cost, durabi l i ty, portabi l i ty, size of cooking surface, other. The ques-
tionnaire was designed and implemented using the DataWinners
software. The field surveyor (LJD) used a portable tablet to enter
surveys responses, which were then stored in a password-pro-
tected DataWinners cloud.
We fol lowed standard guidel ines and practices for ethical
conduct (Wi lmé et al . 201 6). At each vi l lage, the field surveyor (LJD)
paired with a local community member, who became fami l iarized
with the nature of the research and questionnaire. Surveys were
conducted in Malagasy. Household visits started with a descrip-
tion of the survey and the surveyor indicated that participation
was voluntary and could be interrupted at any time. Consent for
the interview was verbal ly requested and, if the household mem-
ber accepted, the surveyor explained the general objectives and
emphasized that surveys were anonymous and that gathered in-
formation was untraceable to the respondents: e.g. , no names or
other identifiers were entered in the database. As reward for the
time and effort (about 25 min per survey) al l respondents were
given phone credit worth ~US$0.35 (1 ,000MGA). Al l surveys were
conducted between May and December 201 7.
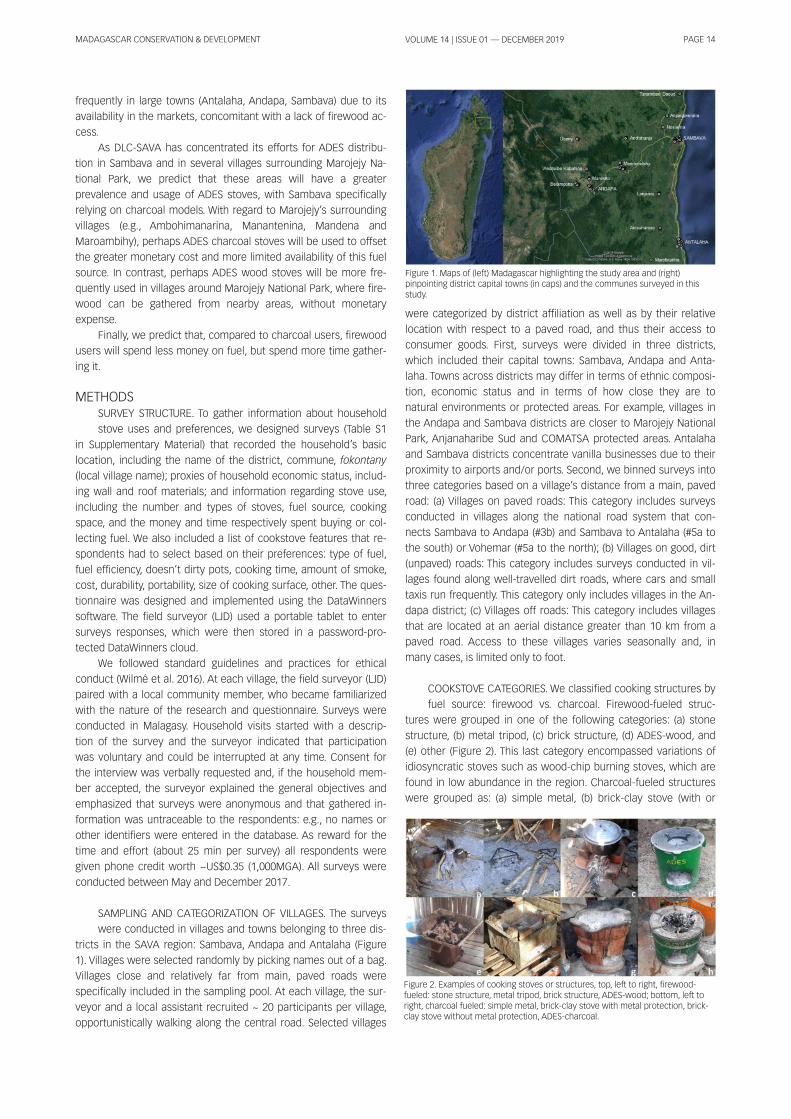
SAMPLING AND CATEGORIZATION OF VILLAGES. The surveys
were conducted in vi l lages and towns belonging to three dis-
tricts in the SAVA region: Sambava, Andapa and Antalaha (Figure
1 ). Vi l lages were selected randomly by picking names out of a bag.
Vi l lages close and relatively far from main, paved roads were
specifical ly included in the sampl ing pool . At each vi l lage, the sur-
veyor and a local assistant recruited ~ 20 participants per vi l lage,
opportunistical ly walking along the central road. Selected vi l lages
were categorized by district affi l iation as wel l as by their relative
location with respect to a paved road, and thus their access to
consumer goods. First, surveys were divided in three districts,
which included their capital towns: Sambava, Andapa and Anta-
laha. Towns across districts may differ in terms of ethnic composi-
tion, economic status and in terms of how close they are to
natural environments or protected areas. For example, vi l lages in
the Andapa and Sambava districts are closer to Marojejy National
Park, Anjanaharibe Sud and COMATSA protected areas. Antalaha
and Sambava districts concentrate vani l la businesses due to their
proximity to airports and/or ports. Second, we binned surveys into
three categories based on a vi l lage’s distance from a main, paved
road: (a) Vi l lages on paved roads: This category includes surveys
conducted in vi l lages along the national road system that con-
nects Sambava to Andapa (#3b) and Sambava to Antalaha (#5a to
the south) or Vohemar (#5a to the north); (b) Vi l lages on good, dirt
(unpaved) roads: This category includes surveys conducted in vi l -
lages found along wel l -travel led dirt roads, where cars and smal l
taxis run frequently. This category only includes vi l lages in the An-
dapa district; (c) Vi l lages off roads: This category includes vi l lages
that are located at an aerial d istance greater than 1 0 km from a
paved road. Access to these vi l lages varies seasonal ly and, in
many cases, is l imited only to foot.
COOKSTOVE CATEGORIES. We classified cooking structures by
fuel source: firewood vs. charcoal . Firewood-fueled struc-
tures were grouped in one of the fol lowing categories: (a) stone
structure, (b) metal tripod, (c) brick structure, (d) ADES-wood, and
(e) other (Figure 2). This last category encompassed variations of
id iosyncratic stoves such as wood-chip burning stoves, which are
found in low abundance in the region. Charcoal-fueled structures
were grouped as: (a) simple metal , (b) brick-clay stove (with or
Figure 1 . Maps of (left) Madagascar highl ighting the study area and (right)pinpointing district capital towns (in caps) and the communes surveyed in thisstudy.
Figure 2. Examples of cooking stoves or structures, top, left to right, firewood-fueled: stone structure, metal tripod, brick structure, ADES-wood; bottom, left toright, charcoal fueled: simple metal , brick-clay stove with metal protection, brick-clay stove without metal protection, ADES-charcoal .

MADAGASCAR CONSERVATION & DEVELOPMENT PAGE 1 5VOLUME 1 4 | ISSUE 01 — DECEMBER 201 9
without a metal protective rim), (c) ti le-cement structure, (d) ADES-
charcoal (Figure 2).
STATISTICAL ANALYSIS. Simple summary statistics were used
to calculate the proportion of survey responses within partic-
ular categories. We used contingency analysis and ran Pearson’s
Chi-square tests in JMP Pro 1 3, to specifical ly test for differences
in fuel source and cookstove-structure prevalence when house-
holds are classified by distance to paved road or by district. To fur-
ther test whether proximity to main roads, house qual i ty, or
cooking-space features had associations with fuel type, we com-
puted a general ized l inear mixed model using the glmmADMB
package (Fournier et al . 201 2) implemented in Rstudio. The re-
sponse variable was fuel-type (two categories: firewood or char-
coal ) and entered as binary data: We therefore used the binomial
d istribution function. We used the fol lowing suite of explanatory
variables: distance to paved road as a proxy for access to con-
sumer goods (three categories: paved road, dirt road, off road);
house wal l materials as a proxy for economic status (five cate-
gories: bamboo, cement, ravinala , i .e. , traveler’s palm, tin, and
wood); and kitchen structure as a proxy for smoke exposure (four
categories on a gradient from most to least venti lated). Fokontany
(i .e. , smal l vi l lage unit) was ranked as a random variable. We reran
the above model exchanging the response variable from exclusive
firewood or charcoal use to also include households where both
fuel sources were used.
RESULTSON FUEL USE. Out of 51 7 households surveyed, comprising
25 vi l lages in 1 5 communes (Table S2 in Supplementary Ma-
terial ), 49% used exclusively firewood as a source of fuel , com-
pared to 36% of charcoal-exclusive fuel users. An additional 1 6%
use both firewood and charcoal as fuel sources. Other sources of
fuel , such as gas, had a negl igible presence in our sample (n=6)
and were removed from the analysis.
When fuel use was analyzed against distance from paved
road, there was a significant difference, with the use of firewood
increasing when households were farther away from paved roads
(Pearson’s chi-squared test = 93.520, p < 0.0001 ). More specifi-
cal ly, only 34% of households on paved roads use firewood-exclu-
sive stoves, whereas 75% of off-road households did so. These
percentages increase to 48% and 88% respectively, when house-
holds using both fuel types are included. The proportion of house-
holds using firewood and/or charcoal did not vary by district
(Figure 3).
When we compared district capital communes, Andapa, An-
talaha and Sambava, to other smal ler communes per district,
large towns have the greatest proportion of charcoal use, sup-
porting the prediction that there is an “urban” signature in char-
coal use (Table 1 ).
When fuel type was analyzed with respect to distance from
paved road, house features and kitchen structures, firewood (in-
cluding households where charcoal may be also used) was used
significantly more often in off-road households, constructed with
local ly avai lable materials, in contrast to more expensive materials
such as cement/wood. Firewood use was also significantly corre-
lated with “enclosed” kitchen structures, which appears counter-
intuitive from the venti lation perspective, assuming that smoke
levels increase when firewood is compared to charcoal (Table 2).
ON THE MONEY AND TIME SPENT ON FUEL. As predicted,
charcoal users spent more money (on average, weekly) than
did firewood users. More than 80% of respondents, who were fire-
wood users exclusively, reported that they spent no money on
fuel ; however, they spent more than 4 hours per week, on aver-
age, to gather firewood, and up to 20 hours per week in extreme
cases (Table 3).
ON STOVE PREVALENCE. When firewood-fueled stoves were
considered, the metal tripod was the most commonly used
structure, and was wel l represented in al l towns and vi l lages, in
proximity to or from paved roads. For example, 77% of households
on paved roads, 65% of households on good dirt roads, and 78%
of households off roads used at least one metal tripod stove. Such
differences across types were significant when compared to dis-
tance from paved road (Pearson’s chi-squared test = 42.762,
p < .0001 ). After the metal tripod, brick structures tended to be
used more often in the Andapa district (29%) compared to stone
structures which were more common in the Antalaha district
(1 6%). Such differences across types were also significant when
Figure 3. Fuel use reported, including al l surveyed households, categorized by (a)distance to paved road or (b) district.
CommuneAndapa town (urban vi l lages)Andapa communes (rural vi l lages)Antalaha town (urban vi l lages)Antalaha communes (rural vi l lages)Sambava town (urban vi l lages)Sambava communes (rural vi l lages)
# households601 1 86064551 62
Only charcoaluse (%)
751 8.678.36.372.71 4.8
Some charcoaluse (%)88.347.586.71 5.685.529.6
Table 1 . Comparison between household in large towns (Andapa, Antalaha,Sambava) to other communes within their respective districts.
(Intercept)Paved road to off roadPaved road to dirt good roadBamboo to cement wal lsBamboo to Ravinala stem wal lsBamboo to tin wal lsBamboo to wood wal ls“Good” to “poor” venti lation
Std-1 .1 532.31 61 .58-2.5730.1 290.68-1 .4333.002
Error0.5680.7330.780.810.560.6390.4860.345
z value-2.033.1 62.03-3.1 80.23-1 .06-2.958.7
Pr(>|z| )0.0424 *0.001 6 **0.0427 *0.001 5 **0.81 730.2873
0.0032 **<2e-1 6 ***
Table 2. Results of general ized l inear mixed model using fuel type (firewood,charcoal ) as response variable. (Significant codes: * p ≤ 0.05, ** ≤ 0.01 ,*** ≤ 0.001 )
Table 3. Time and cost estimations by fuel type. Conversion rate 1 US$=~3,000MGA. (*this household makes banana chips for sale, **if households with fuelcosts of 0 MGA are excluded, the weekly average per household increases to6,890 MGA)
Fuel type# of households% of households that do not buy fuelFuel cost (MGA/week)
averagemax
Fuel effort (hours/week)averagemax
Charcoal only1 822.7
1 1 ,9821 20 000*
00
Firewood only25183.3
1 1 54**20,000
4.41 0
Charcoal andfirewood8025
9,0841 05,000
620
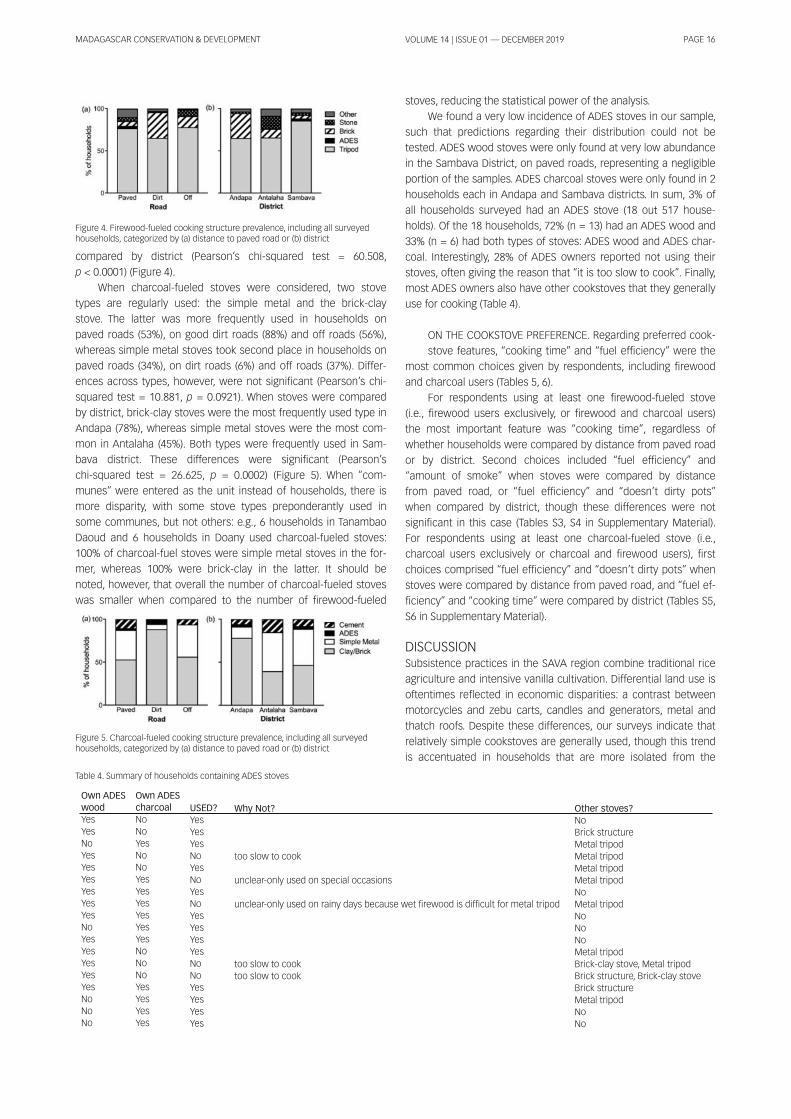
MADAGASCAR CONSERVATION & DEVELOPMENT PAGE 1 6VOLUME 1 4 | ISSUE 01 — DECEMBER 201 9
compared by district (Pearson’s chi-squared test = 60.508,
p < 0.0001 ) (Figure 4).
When charcoal-fueled stoves were considered, two stove
types are regularly used: the simple metal and the brick-clay
stove. The latter was more frequently used in households on
paved roads (53%), on good dirt roads (88%) and off roads (56%),
whereas simple metal stoves took second place in households on
paved roads (34%), on dirt roads (6%) and off roads (37%). Differ-
ences across types, however, were not significant (Pearson’s chi-
squared test = 1 0.881 , p = 0.0921 ). When stoves were compared
by district, brick-clay stoves were the most frequently used type in
Andapa (78%), whereas simple metal stoves were the most com-
mon in Antalaha (45%). Both types were frequently used in Sam-
bava district. These differences were significant (Pearson’s
chi-squared test = 26.625, p = 0.0002) (Figure 5). When “com-
munes” were entered as the unit instead of households, there is
more disparity, with some stove types preponderantly used in
some communes, but not others: e.g. , 6 households in Tanambao
Daoud and 6 households in Doany used charcoal-fueled stoves:
1 00% of charcoal-fuel stoves were simple metal stoves in the for-
mer, whereas 1 00% were brick-clay in the latter. I t should be
noted, however, that overal l the number of charcoal-fueled stoves
was smal ler when compared to the number of firewood-fueled
stoves, reducing the statistical power of the analysis.
We found a very low incidence of ADES stoves in our sample,
such that predictions regarding their distribution could not be
tested. ADES wood stoves were only found at very low abundance
in the Sambava District, on paved roads, representing a negl igible
portion of the samples. ADES charcoal stoves were only found in 2
households each in Andapa and Sambava districts. In sum, 3% of
al l households surveyed had an ADES stove (1 8 out 51 7 house-
holds). Of the 1 8 households, 72% (n = 1 3) had an ADES wood and
33% (n = 6) had both types of stoves: ADES wood and ADES char-
coal . Interestingly, 28% of ADES owners reported not using their
stoves, often giving the reason that “it is too slow to cook”. Final ly,
most ADES owners also have other cookstoves that they general ly
use for cooking (Table 4).
ON THE COOKSTOVE PREFERENCE. Regarding preferred cook-
stove features, “cooking time” and “fuel efficiency” were the
most common choices given by respondents, including firewood
and charcoal users (Tables 5, 6).
For respondents using at least one firewood-fueled stove
(i .e. , firewood users exclusively, or firewood and charcoal users)
the most important feature was “cooking time”, regardless of
whether households were compared by distance from paved road
or by district. Second choices included “fuel efficiency” and
“amount of smoke” when stoves were compared by distance
from paved road, or “fuel efficiency” and “doesn’t dirty pots”
when compared by district, though these differences were not
significant in this case (Tables S3, S4 in Supplementary Material ).
For respondents using at least one charcoal-fueled stove (i .e. ,
charcoal users exclusively or charcoal and firewood users), first
choices comprised “fuel efficiency” and “doesn’t dirty pots” when
stoves were compared by distance from paved road, and “fuel ef-
ficiency” and “cooking time” were compared by district (Tables S5,
S6 in Supplementary Material ).
DISCUSSIONSubsistence practices in the SAVA region combine traditional rice
agriculture and intensive vani l la cultivation. Differential land use is
oftentimes reflected in economic disparities: a contrast between
motorcycles and zebu carts, candles and generators, metal and
thatch roofs. Despite these differences, our surveys indicate that
relatively simple cookstoves are general ly used, though this trend
is accentuated in households that are more isolated from the
Figure 4. Firewood-fueled cooking structure prevalence, including al l surveyedhouseholds, categorized by (a) distance to paved road or (b) district
Figure 5. Charcoal-fueled cooking structure prevalence, including al l surveyedhouseholds, categorized by (a) distance to paved road or (b) district
Own ADESwoodYesYesNoYesYesYesYesYesYesNoYesYesYesYesYesNoNoNo
Own ADEScharcoalNoNoYesNoNoYesYesYesYesYesYesNoNoNoYesYesYesYes
USED?YesYesYesNoYesNoYesNoYesYesYesYesNoNoYesYesYesYes
Why Not?
too slow to cook
unclear-only used on special occasions
unclear-only used on rainy days because wet firewood is difficult for metal tripod
too slow to cooktoo slow to cook
Other stoves?NoBrick structureMetal tripodMetal tripodMetal tripodMetal tripodNoMetal tripodNoNoNoMetal tripodBrick-clay stove, Metal tripodBrick structure, Brick-clay stoveBrick structureMetal tripodNoNo
Table 4. Summary of households containing ADES stoves

MADAGASCAR CONSERVATION & DEVELOPMENT PAGE 1 7VOLUME 1 4 | ISSUE 01 — DECEMBER 201 9
large towns. Consistent with our first prediction, i t appears that
firewood is more frequently used when readi ly avai lable, in house-
holds that are farther away from paved roads, and presumably
closer to forest fragments or woody agricultural areas.
Although acquiring firewood may be “free”, i t adds a physical
burden to the persons who procure and carry the fuel , not to
mention the additional time investment of spl i tting, drying and
transporting wood if the fuel source is relatively far from the
household. Improved cookstoves are oftentimes promoted as
“fuel efficient” when compared to more traditional structures l ike
open fires. I f basic information is gathered at target vi l lages re-
garding average time investment by local members, a simple cal-
culation can be made to i l lustrate how many hours per month, or
year, can be saved by using an improved cookstove. Our results
show that, on average, community members spend ~5 hours a
week gathering firewood. These estimations are greater compared
to the time spent by local vi l lagers securing firewood at other
eastern sites in Madagascar: e.g. , ~30 minutes a day, or
~3.5 hours a week at Lac Alaotra (Borgerson et al . 201 8), and be-
tween 1 5 and 30 minutes a day, or ~3 hours a week in vi l lages
around Betampona Strict Nature Reserve (Golden et al . 201 4). We
bel ieve that these data should be discussed in the context of pro-
gram implementation, in addition to advertising other potential
long-term benefits of proposed cookstoves. NGOs or governmen-
tal organizations highly value the reduction of emissions to pre-
vent long-term health compl ications, but cooks may prioritize
other more pragmatic reasons: e.g. , burning less fuel means less
time for women, and possibly chi ldren, to spend gathering sol id
biomass (Adler 201 0).
We were somewhat surprised by the very low incidence of
ADES cookstoves in our sample. I t was also interesting to note
that, when present, ADES stoves were not always used. The low
visibi l i ty of ADES in the region may be due to a variety of factors,
including the fact that NGOs may not have introduced enough
stoves to make a difference at regional scale. Moreover, efforts
should be placed to target remote vi l lages instead of focusing on
a few sel l ing locations as it has been done thus far. Moreover,
DLC-SAVA has been sel l ing stoves promoted by word of mouth,
and we have had a few buyers purchasing several stoves at once,
and l ikely concentrating their distribution in large towns, or
“wealthy” households in smal l vi l lages. This would mean that
some households wi l l use and or store multiple ADES, and that the
number of stoves sold does not equate to the number of house-
holds owning one.
Including preference data could also help us understand the
potential desirabi l i ty of improved stoves l ike ADES. We showed
that respondents using firewood-fueled stoves prioritize “cooking
time” over other features l ike “fuel efficiency” (though the latter
comes as a close second). Metal tripods, which are extensively
used as cooking structures, al low for rapid transference of heat to
pots, al though at a greater fuel cost. Charcoal users, however,
ranked fuel efficiency as a main feature they prefer in a cook-
stove, presumably in response to the greater monetary costs of
charcoal . Other considerations, such as “doesn’t dirty pots” and
“amount of smoke” were also selected as top three choices indi-
cating a clear desire for cleaner burning stoves and an awareness
of the respiratory health costs of current practices.
One question we did not ful ly address is whether people
would be incl ined to purchase a more fuel-efficient stove l ike
ADES at a higher price. DLC-SAVA subsidies make ADES stoves
highly competitive in the local market: at ~1 5,000 MGA a piece
(~US$5; conversion rate 1 US$=~3,000 MGA), they are cheaper or
comparably priced to other options avai lable in the region. For in-
stance, an imported artesian clay stove is sold at ~25,000 MGA,
and a local “dung” cookstove at ~25,000 MGA (Klug 201 7 in Sup-
plementary Material ). Although “cost” did not make it to the top of
the preference rankings across households, 83 respondents se-
lected this option as one of the preferred features in a cookstove,
and 1 9 respondents chose “cost” as the most important feature.
Thus, increased prices for ADES cookstoves may lower their ap-
peal or reduce local demands.
Sel l ing stoves is more than showing the product – for in-
stance, information about how to economize fuel , how to properly
load a stove for maximum efficiency, how to avoid dirtying kitchen
equipment, should be careful ly explained (Adler 201 0). Although
we are aware that ADES designed pamphlets and train ing rou-
tines, we are not sure how many NGOs subsidizing stoves em-
braced the program to the maximum potential . For instance, as it
is shown in this study many interviewees considered “cooking
time” as an important feature in a cookstove. This may pose a
chal lenge to make ADES and other fuel-efficient stoves appeal ing,
because fire-clay combustion chambers may take additional time
to heat up. Incidental ly, once the chamber is ful ly heated, less fuel
may be needed to maintain the same temperature for long peri-
ods. A more comprehensive discussion about trade-offs may help
counterbalance traits that may be initial ly perceived as negative. I t
is clear from this study that receptiveness and wi l l ingness to learn
is present.
Based on this prel iminary study, we suggest a more strategic
plan to introduce and distribute improved cookstoves such as
ADES in the SAVA region: (i ) we suggest matching stove models
(wood and/or charcoal ) with the most commonly used fuel source
at any particular vi l lage, based on prior surveys l ike this. We would
particularly favor the ADES wood stoves to be distributed in the
more remote vi l lages, where people greatly rely on gathered fire-
wood. I t is perhaps noteworthy that ADES wood stoves performed
better than ADES charcoal stoves in terms of fuel consumption,
when each one was tested against basel ine stoves by a DLC-SAVA
volunteer student (Klug 201 7 in Supplementary Material ): ADES
wood used 3 times less fuel than a metal tripod, but ADES char-
coal used only sl ightly less fuel than a basic metal stove; (i i ) we
suggest adding a short train ing/and or demonstration to highl ight
Paved road
Dirt road
Off road
Top 1 choiceFuel efficiency(28) n=83Cooking time(37) n=32Cooking time(27) n=38
Top 2 choiceCooking time(25) n=74Fuel efficiency(30) n=26Amount ofsmoke (1 9) n=27
Top 3 choiceDoesn’t dirty pots(1 1 ) n=33Type of fuel (1 6)n=1 4Doesn’t dirty pots(1 8) n=25
Top 4 choiceType of fuel(1 0) n=30Other (7) n=6
Fuel efficiency(1 2) n=1 7
Table 5. Preferred features in cookstoves including al l households, compared bydistance from paved road. Numbers in parentheses represent percentages ofrespondents selecting this choice; n represents the number of households.(Pearson p < 0.0001 )
Table 6. Preferred features in cookstoves including al l households, compared bydistrict. (Pearson p < 0.0267)
Andapa
Antalaha
Sambava
Top 1 choiceFuel efficiency(30) n=54Cooking time(32) n=40Cooking time(27) n=59
Top 2 choiceCooking time(25) n=48Fuel efficiency(1 9) n=24Fuel efficiency(22) n=48
Top 3 choiceType of fuel (1 6)n=28Other (1 4) n=1 7
Amount ofsmoke (1 4) n=31
Top 4 choiceAmount ofsmoke (8) n=1 4Doesn’t dirtypots (1 3) n=1 6Doesn’t dirtypots (1 3) n=29
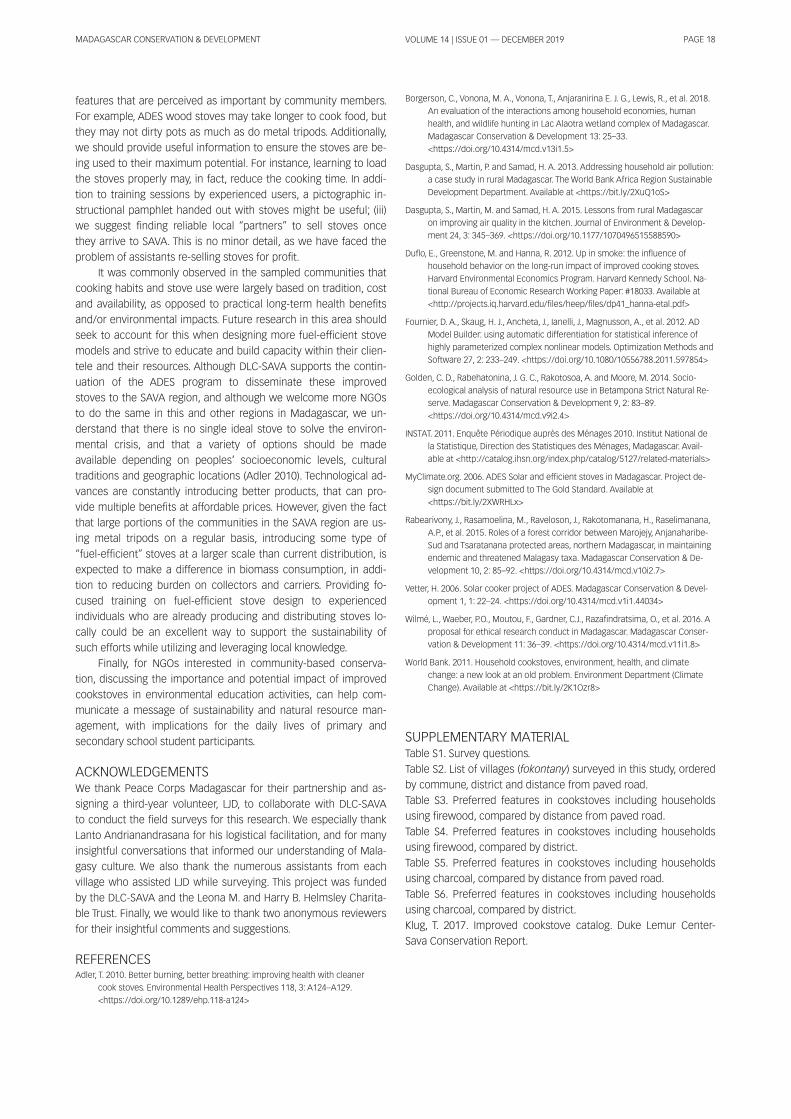
MADAGASCAR CONSERVATION & DEVELOPMENT PAGE 1 8VOLUME 1 4 | ISSUE 01 — DECEMBER 201 9
features that are perceived as important by community members.
For example, ADES wood stoves may take longer to cook food, but
they may not dirty pots as much as do metal tripods. Additional ly,
we should provide useful information to ensure the stoves are be-
ing used to their maximum potential . For instance, learning to load
the stoves properly may, in fact, reduce the cooking time. In addi-
tion to train ing sessions by experienced users, a pictographic in-
structional pamphlet handed out with stoves might be useful ; (i i i )
we suggest finding rel iable local “partners” to sel l stoves once
they arrive to SAVA. This is no minor detai l , as we have faced the
problem of assistants re-sel l ing stoves for profit.
I t was commonly observed in the sampled communities that
cooking habits and stove use were largely based on tradition, cost
and avai labi l i ty, as opposed to practical long-term health benefits
and/or environmental impacts. Future research in this area should
seek to account for this when designing more fuel-efficient stove
models and strive to educate and bui ld capacity within their cl ien-
tele and their resources. Although DLC-SAVA supports the contin-
uation of the ADES program to disseminate these improved
stoves to the SAVA region, and although we welcome more NGOs
to do the same in this and other regions in Madagascar, we un-
derstand that there is no single ideal stove to solve the environ-
mental crisis, and that a variety of options should be made
avai lable depending on peoples’ socioeconomic levels, cultural
traditions and geographic locations (Adler 201 0). Technological ad-
vances are constantly introducing better products, that can pro-
vide multiple benefits at affordable prices. However, given the fact
that large portions of the communities in the SAVA region are us-
ing metal tripods on a regular basis, introducing some type of
“fuel-efficient” stoves at a larger scale than current distribution, is
expected to make a difference in biomass consumption, in addi-
tion to reducing burden on col lectors and carriers. Providing fo-
cused train ing on fuel-efficient stove design to experienced
individuals who are already producing and distributing stoves lo-
cal ly could be an excel lent way to support the sustainabi l i ty of
such efforts whi le uti l izing and leveraging local knowledge.
Final ly, for NGOs interested in community-based conserva-
tion, discussing the importance and potential impact of improved
cookstoves in environmental education activities, can help com-
municate a message of sustainabi l i ty and natural resource man-
agement, with impl ications for the dai ly l ives of primary and
secondary school student participants.
ACKNOWLEDGEMENTSWe thank Peace Corps Madagascar for their partnership and as-
signing a third-year volunteer, LJD, to col laborate with DLC-SAVA
to conduct the field surveys for this research. We especial ly thank
Lanto Andrianandrasana for his logistical faci l i tation, and for many
insightful conversations that informed our understanding of Mala-
gasy culture. We also thank the numerous assistants from each
vi l lage who assisted LJD whi le surveying. This project was funded
by the DLC-SAVA and the Leona M. and Harry B. Helmsley Charita-
ble Trust. Final ly, we would l ike to thank two anonymous reviewers
for their insightful comments and suggestions.
REFERENCESAdler, T. 201 0. Better burning, better breathing: improving health with cleaner
cook stoves. Environmental Health Perspectives 1 1 8, 3: A1 24–A1 29.
<https://doi .org/1 0.1 289/ehp.1 1 8-a1 24>
Borgerson, C. , Vonona, M. A. , Vonona, T. , Anjaranirina E. J. G. , Lewis, R. , et al . 201 8.
An evaluation of the interactions among household economies, human
health, and wi ld l i fe hunting in Lac Alaotra wetland complex of Madagascar.
Madagascar Conservation & Development 1 3: 25–33.
<https://doi .org/1 0.431 4/mcd.v1 3i1 .5>
Dasgupta, S. , Martin, P. and Samad, H. A. 201 3. Addressing household air pol lution:
a case study in rural Madagascar. The World Bank Africa Region Sustainable
Development Department. Avai lable at <https://bit. ly/2XuQ1 oS>
Dasgupta, S. , Martin, M. and Samad, H. A. 201 5. Lessons from rural Madagascar
on improving air qual i ty in the kitchen. Journal of Environment & Develop-
ment 24, 3: 345–369. <https://doi .org/1 0.1 1 77/1 07049651 5588590>
Duflo, E. , Greenstone, M. and Hanna, R. 201 2. Up in smoke: the influence of
household behavior on the long-run impact of improved cooking stoves.
Harvard Environmental Economics Program. Harvard Kennedy School . Na-
tional Bureau of Economic Research Working Paper: #1 8033. Avai lable at
<http://projects. iq .harvard.edu/fi les/heep/fi les/dp41 _hanna-etal .pdf>
Fournier, D. A. , Skaug, H. J. , Ancheta, J. , Ianel l i , J. , Magnusson, A. , et al . 201 2. AD
Model Bui lder: using automatic differentiation for statistical inference of
highly parameterized complex nonl inear models. Optimization Methods and
Software 27, 2: 233–249. <https://doi .org/1 0.1 080/1 0556788.201 1 .597854>
Golden, C. D. , Rabehatonina, J. G. C. , Rakotosoa, A. and Moore, M. 201 4. Socio-
ecological analysis of natural resource use in Betampona Strict Natural Re-
serve. Madagascar Conservation & Development 9, 2: 83–89.
<https://doi .org/1 0.431 4/mcd.v9i2.4>
INSTAT. 201 1 . Enquête Périodique auprès des Ménages 201 0. Institut National de
la Statistique, Direction des Statistiques des Ménages, Madagascar. Avai l -
able at <http://catalog. ihsn.org/index.php/catalog/51 27/related-materials>
MyCl imate.org. 2006. ADES Solar and efficient stoves in Madagascar. Project de-
sign document submitted to The Gold Standard. Avai lable at
<https://bit. ly/2XWRHLx>
Rabearivony, J. , Rasamoel ina, M. , Raveloson, J. , Rakotomanana, H. , Rasel imanana,
A.P. , et al . 201 5. Roles of a forest corridor between Marojejy, Anjanaharibe-
Sud and Tsaratanana protected areas, northern Madagascar, in maintain ing
endemic and threatened Malagasy taxa. Madagascar Conservation & De-
velopment 1 0, 2: 85–92. <https://doi .org/1 0.431 4/mcd.v1 0i2.7>
Vetter, H. 2006. Solar cooker project of ADES. Madagascar Conservation & Devel-
opment 1 , 1 : 22–24. <https://doi .org/1 0.431 4/mcd.v1 i1 .44034>
Wilmé, L. , Waeber, P.O. , Moutou, F. , Gardner, C. J. , Razafindratsima, O. , et al . 201 6. A
proposal for ethical research conduct in Madagascar. Madagascar Conser-
vation & Development 1 1 : 36–39. <https://doi .org/1 0.431 4/mcd.v1 1 i1 .8>
World Bank. 201 1 . Household cookstoves, environment, health, and cl imate
change: a new look at an old problem. Environment Department (Cl imate
Change). Avai lable at <https://bit. ly/2K1 Ozr8>
SUPPLEMENTARY MATERIALTable S1 . Survey questions.
Table S2. List of vi l lages (fokontany) surveyed in this study, ordered
by commune, district and distance from paved road.
Table S3. Preferred features in cookstoves including households
using firewood, compared by distance from paved road.
Table S4. Preferred features in cookstoves including households
using firewood, compared by district.
Table S5. Preferred features in cookstoves including households
using charcoal , compared by distance from paved road.
Table S6. Preferred features in cookstoves including households
using charcoal , compared by district.
Klug, T. 201 7. Improved cookstove catalog. Duke Lemur Center-
Sava Conservation Report.

MADAGASCAR CONSERVATION & DEVELOPMENT PAGE 1 9VOLUME 1 4 | ISSUE 01 — DECEMBER 201 9
ABSTRACTCattle husbandry is a common activity practiced for several gen-
erations in Madagascar. Unfortunately, cattle farmers have not
ful ly taken ful l advantage of the potential i ties of this sector, mainly
because of poor management of the avai lable range lands and
fodder resources. An improved cattle production could be
achieved through the use of prediction tools integrating remote
sensing data with model l ing. Here, we present a novel tool devel-
oped to aid in husbandry management. We col lected measure-
ment field data related to fodder biomass and converted data
obtained from remote sensing into fodder quantity. These data
were used to program a multispectral SPOT 5 satel l i te to calculate
correlations between the normal ized difference vegetation index
(NDVI ) and the existing plant biomass. Using these correlations,
we developed and tested several mathematic models to predict
the quantity of biomass and the dry matter content. We devel-
oped a software, cal led 3C-BIOVIS, using computer programming
and model l ing of the obtained data. The tool predicts the quantity
of avai lable dry matter content within a defined rangeland and the
number of animals that could be fed within a given time and
space. I t was designed to support rural development stakeholders
in decision-making and to advise cattle farmers in forage resource
management for an optimum output.
RÉSUMÉL'élevage de bovin est une activité pratiquée depuis de nom-
breuses générations à Madagascar. Malheureusement, les
éleveurs n'ont pas su jusqu'à aujourd'hui , tirer pleinement profit
des potential i tés de ce secteur. La mauvaise gestion des parcours
et des ressources fourragères représente une des principales
causes de cette faible performance. Ainsi , l ’amél ioration de la pro-
duction bovine pourrait être obtenue à travers l ’uti l isation d'un
outi l de prédiction de la disponibi l i té des ressources fourragères
en uti l isant une approche combinée de modél isation et télédétec-
tion. Des mesures de données agronomiques de terrain sur la
biomasse fourragère ont été effectuées pour convertir les don-
nées issues de la télédétection en quantités de biomasse four-
ragère. Cette approche a nécessité une programmation de
passage du satel l i te multispectral SPOT 5 en paral lèle avec l 'ac-
quisition de données de terrain pour calculer des corrélations en-
tre l ' indice de végétation (NDVI ) et la biomasse végétale existante.
À partir des régressions, plusieurs modèles ont été élaborés et
testés pour pouvoir prédire la quantité de biomasse ainsi que la
teneur en matière sèche. La programmation et la modél isation in-
formatique ont permis de développer un logiciel "3C-BIOVIS" .
L’outi l prédit les informations sur la quantité de matière sèche
disponible au niveau des parcel les et le nombre d'animaux pou-
vant être al imentés par chaque parcel le à une période donnée et
dans un espace déterminé, via les données obtenues des images
satel l i tes. Cet outi l a été conçu pour aider les acteurs du
développement rural à prendre des décisions de manière à con-
sei l ler les éleveurs sur la façon optimale de gérer les ressources
fourragères.
INTRODUCTIONMadagascar est un pays caractérisé par de vastes zones de pâ-
turages et de grandes variabi l i tés spatio-temporel les quant aux
précipitations. Ces variabi l i tés font qu' i l est dél icat pour les
éleveurs malgaches de tirer pleinement profit des ressources ex-
ploitables pour l ' al imentation des ruminants. Cela affecte le
ARTICLE http://dx.doi .org/1 0.431 4/mcd.v1 4i1 . 1
Développement d'un logiciel (3C-BIOVIS) pour ladétermination de la disponibi l i té des ressourcesfourragères par une approche de modél isation ettélédétection
Tsiry D. RazafinarivoI, Volatsara B. Rahetlah I I , PauloSalgadoII I , Neupomuscène J. RakotozandrinyIV, José H.Andriarimalala I I , Iavo Ralain indrianaIV, Hélène ArtusI I I ,Lionel Le MezoII I
Correspondence:
Tsirin irina D. Razafinarivo
Centre National de la Recherche Appl iquée au Développement
Rural (FOFIFA-DRZVP)
Antananarivo 1 01
Madagascar
Emai l : razafinarivotsiry@gmai l .com
Citation Razafinarivo, T. D. , Rahetlah, V. B. , Salgado, P. , Rakotozandriny, N. J. , Andriarimalala, J. H. , Ralain indriana, I . , Artus, H. , Le Mezo, L. 201 9. Développement d'unlogiciel (3C-BIOVIS) pour la détermination de la disponibi l i té des ressources fourragères par une approche de modél isation et télédétection. MadagascarConservation & Development 1 4, 1 : 1 9–25. http://dx.doi .org/1 0.431 4/mcd.v1 4i1 . 1
I Centre National de la Recherche Appl iquée au Développement Rural (FOFIFA-DRZV), Antananarivo 1 01 , MadagascarI I FIFAMANOR, BP 1 98, Antsirabe 1 1 0, MadagascarI I I CIRAD, UMR SELMET, BP 31 9, Antsirabe 1 1 0, MadagascarIV École Supérieure des Sciences Agronomiques, Université d’Antananarivo, Madagascar
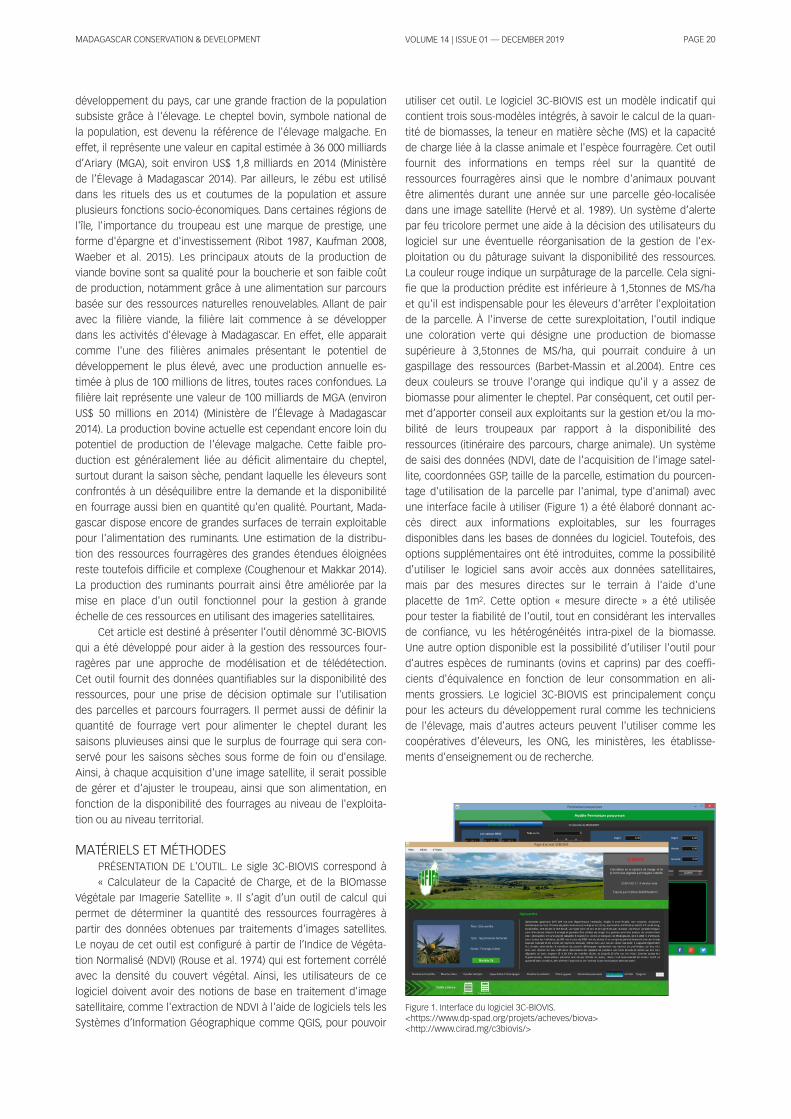
MADAGASCAR CONSERVATION & DEVELOPMENT PAGE 20VOLUME 1 4 | ISSUE 01 — DECEMBER 201 9
développement du pays, car une grande fraction de la population
subsiste grâce à l 'élevage. Le cheptel bovin, symbole national de
la population, est devenu la référence de l 'élevage malgache. En
effet, i l représente une valeur en capital estimée à 36 000 mi l l iards
d’Ariary (MGA), soit environ US$ 1 ,8 mi l l iards en 201 4 (Ministère
de l ’Élevage à Madagascar 201 4). Par ai l leurs, le zébu est uti l isé
dans les rituels des us et coutumes de la population et assure
plusieurs fonctions socio-économiques. Dans certaines régions de
l ' île, l ' importance du troupeau est une marque de prestige, une
forme d'épargne et d' investissement (Ribot 1 987, Kaufman 2008,
Waeber et al . 201 5). Les principaux atouts de la production de
viande bovine sont sa qual i té pour la boucherie et son faible coût
de production, notamment grâce à une al imentation sur parcours
basée sur des ressources naturel les renouvelables. Al lant de pair
avec la fi l ière viande, la fi l ière lait commence à se développer
dans les activités d'élevage à Madagascar. En effet, el le apparait
comme l 'une des fi l ières animales présentant le potentiel de
développement le plus élevé, avec une production annuel le es-
timée à plus de 1 00 mi l l ions de l i tres, toutes races confondues. La
fi l ière lait représente une valeur de 1 00 mi l l iards de MGA (environ
US$ 50 mi l l ions en 201 4) (Ministère de l ’Élevage à Madagascar
201 4). La production bovine actuel le est cependant encore loin du
potentiel de production de l 'élevage malgache. Cette faible pro-
duction est généralement l iée au déficit al imentaire du cheptel ,
surtout durant la saison sèche, pendant laquel le les éleveurs sont
confrontés à un déséqui l ibre entre la demande et la disponibi l i té
en fourrage aussi bien en quantité qu'en qual i té. Pourtant, Mada-
gascar dispose encore de grandes surfaces de terrain exploitable
pour l ' al imentation des ruminants. Une estimation de la distribu-
tion des ressources fourragères des grandes étendues éloignées
reste toutefois diffici le et complexe (Coughenour et Makkar 201 4).
La production des ruminants pourrait ainsi être amél iorée par la
mise en place d'un outi l fonctionnel pour la gestion à grande
échel le de ces ressources en uti l isant des imageries satel l i taires.
Cet article est destiné à présenter l ’outi l dénommé 3C-BIOVIS
qui a été développé pour aider à la gestion des ressources four-
ragères par une approche de modél isation et de télédétection.
Cet outi l fournit des données quantifiables sur la disponibi l i té des
ressources, pour une prise de décision optimale sur l 'uti l isation
des parcel les et parcours fourragers. I l permet aussi de défin ir la
quantité de fourrage vert pour al imenter le cheptel durant les
saisons pluvieuses ainsi que le surplus de fourrage qui sera con-
servé pour les saisons sèches sous forme de foin ou d'ensi lage.
Ainsi , à chaque acquisition d'une image satel l i te, i l serait possible
de gérer et d'ajuster le troupeau, ainsi que son al imentation, en
fonction de la disponibi l i té des fourrages au niveau de l 'exploita-
tion ou au niveau territorial .
MATÉRIELS ET MÉTHODESPRÉSENTATION DE L'OUTIL. Le sigle 3C-BIOVIS correspond à
« Calculateur de la Capacité de Charge, et de la BIOmasse
Végétale par Imagerie Satel l i te ». I l s’agit d’un outi l de calcul qui
permet de déterminer la quantité des ressources fourragères à
partir des données obtenues par traitements d' images satel l i tes.
Le noyau de cet outi l est configuré à partir de l ’ Indice de Végéta-
tion Normal isé (NDVI ) (Rouse et al . 1 974) qui est fortement corrélé
avec la densité du couvert végétal . Ainsi , les uti l isateurs de ce
logiciel doivent avoir des notions de base en traitement d' image
satel l i taire, comme l 'extraction de NDVI à l ' aide de logiciels tels les
Systèmes d’Information Géographique comme QGIS, pour pouvoir
uti l iser cet outi l . Le logiciel 3C-BIOVIS est un modèle indicatif qui
contient trois sous-modèles intégrés, à savoir le calcul de la quan-
tité de biomasses, la teneur en matière sèche (MS) et la capacité
de charge l iée à la classe animale et l 'espèce fourragère. Cet outi l
fournit des informations en temps réel sur la quantité de
ressources fourragères ainsi que le nombre d'animaux pouvant
être al imentés durant une année sur une parcel le géo-local isée
dans une image satel l i te (Hervé et al . 1 989). Un système d’alerte
par feu tricolore permet une aide à la décision des uti l isateurs du
logiciel sur une éventuel le réorganisation de la gestion de l 'ex-
ploitation ou du pâturage suivant la disponibi l i té des ressources.
La couleur rouge indique un surpâturage de la parcel le. Cela signi-
fie que la production prédite est inférieure à 1 ,5tonnes de MS/ha
et qu' i l est indispensable pour les éleveurs d'arrêter l 'exploitation
de la parcel le. À l ' inverse de cette surexploitation, l 'outi l indique
une coloration verte qui désigne une production de biomasse
supérieure à 3,5tonnes de MS/ha, qui pourrait conduire à un
gaspi l lage des ressources (Barbet-Massin et al .2004). Entre ces
deux couleurs se trouve l 'orange qui indique qu' i l y a assez de
biomasse pour al imenter le cheptel . Par conséquent, cet outi l per-
met d’apporter consei l aux exploitants sur la gestion et/ou la mo-
bi l i té de leurs troupeaux par rapport à la disponibi l i té des
ressources (itinéraire des parcours, charge animale). Un système
de saisi des données (NDVI , date de l 'acquisition de l ' image satel-
l i te, coordonnées GSP, tai l le de la parcel le, estimation du pourcen-
tage d'uti l isation de la parcel le par l ' animal , type d'animal ) avec
une interface faci le à uti l iser (Figure 1 ) a été élaboré donnant ac-
cès direct aux informations exploitables, sur les fourrages
disponibles dans les bases de données du logiciel . Toutefois, des
options supplémentaires ont été introduites, comme la possibi l i té
d’uti l iser le logiciel sans avoir accès aux données satel l i taires,
mais par des mesures directes sur le terrain à l ' aide d'une
placette de 1m2. Cette option « mesure directe » a été uti l isée
pour tester la fiabi l i té de l 'outi l , tout en considérant les interval les
de confiance, vu les hétérogénéités intra-pixel de la biomasse.
Une autre option disponible est la possibi l i té d’uti l iser l 'outi l pour
d'autres espèces de ruminants (ovins et caprins) par des coeffi-
cients d'équivalence en fonction de leur consommation en al i -
ments grossiers. Le logiciel 3C-BIOVIS est principalement conçu
pour les acteurs du développement rural comme les techniciens
de l 'élevage, mais d'autres acteurs peuvent l 'uti l iser comme les
coopératives d’éleveurs, les ONG, les ministères, les établ isse-
ments d'enseignement ou de recherche.
Figure 1 . Interface du logiciel 3C-BIOVIS.<https://www.dp-spad.org/projets/acheves/biova><http://www.cirad.mg/c3biovis/>
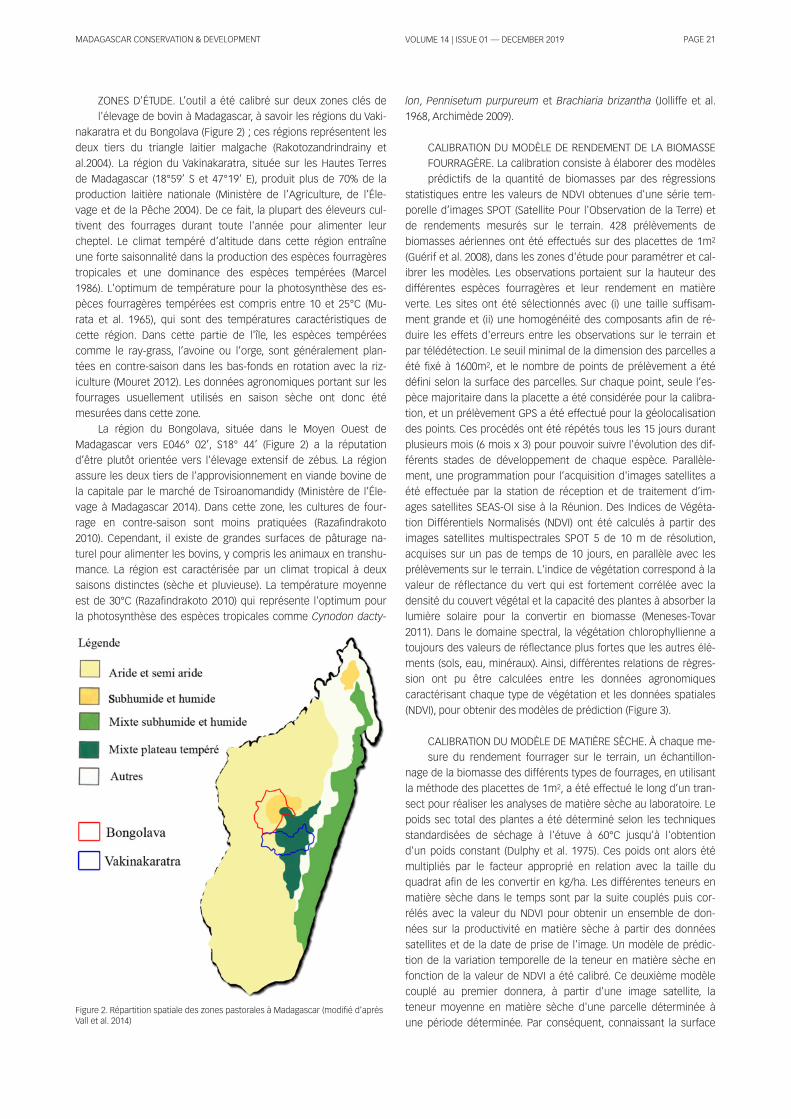
MADAGASCAR CONSERVATION & DEVELOPMENT PAGE 21VOLUME 1 4 | ISSUE 01 — DECEMBER 201 9
ZONES D'ÉTUDE. L’outi l a été cal ibré sur deux zones clés de
l 'élevage de bovin à Madagascar, à savoir les régions du Vaki-
nakaratra et du Bongolava (Figure 2) ; ces régions représentent les
deux tiers du triangle laitier malgache (Rakotozandrindrainy et
al .2004). La région du Vakinakaratra, située sur les Hautes Terres
de Madagascar (1 8°59’ S et 47°1 9' E), produit plus de 70% de la
production laitière nationale (Ministère de l ’Agriculture, de l ’Éle-
vage et de la Pêche 2004). De ce fait, la plupart des éleveurs cul-
tivent des fourrages durant toute l ' année pour al imenter leur
cheptel . Le cl imat tempéré d’al ti tude dans cette région entraîne
une forte saisonnal i té dans la production des espèces fourragères
tropicales et une dominance des espèces tempérées (Marcel
1 986). L'optimum de température pour la photosynthèse des es-
pèces fourragères tempérées est compris entre 1 0 et 25°C (Mu-
rata et al . 1 965), qui sont des températures caractéristiques de
cette région. Dans cette partie de l ' île, les espèces tempérées
comme le ray-grass, l ’avoine ou l ’orge, sont généralement plan-
tées en contre-saison dans les bas-fonds en rotation avec la riz-
iculture (Mouret 201 2). Les données agronomiques portant sur les
fourrages usuel lement uti l isés en saison sèche ont donc été
mesurées dans cette zone.
La région du Bongolava, située dans le Moyen Ouest de
Madagascar vers E046° 02’, S1 8° 44’ (Figure 2) a la réputation
d’être plutôt orientée vers l 'élevage extensif de zébus. La région
assure les deux tiers de l ' approvisionnement en viande bovine de
la capitale par le marché de Tsiroanomandidy (Ministère de l ’Éle-
vage à Madagascar 201 4). Dans cette zone, les cultures de four-
rage en contre-saison sont moins pratiquées (Razafindrakoto
201 0). Cependant, i l existe de grandes surfaces de pâturage na-
turel pour al imenter les bovins, y compris les animaux en transhu-
mance. La région est caractérisée par un cl imat tropical à deux
saisons distinctes (sèche et pluvieuse). La température moyenne
est de 30°C (Razafindrakoto 201 0) qui représente l 'optimum pour
la photosynthèse des espèces tropicales comme Cynodon dacty-
lon , Pennisetum purpureum et Brachiaria brizantha (Jol l i ffe et al .
1 968, Archimède 2009).
CALIBRATION DU MODÈLE DE RENDEMENT DE LA BIOMASSE
FOURRAGÈRE. La cal ibration consiste à élaborer des modèles
prédictifs de la quantité de biomasses par des régressions
statistiques entre les valeurs de NDVI obtenues d'une série tem-
porel le d’images SPOT (Satel l i te Pour l 'Observation de la Terre) et
de rendements mesurés sur le terrain. 428 prélèvements de
biomasses aériennes ont été effectués sur des placettes de 1m2
(Guérif et al . 2008), dans les zones d'étude pour paramétrer et cal-
ibrer les modèles. Les observations portaient sur la hauteur des
différentes espèces fourragères et leur rendement en matière
verte. Les sites ont été sélectionnés avec (i ) une tai l le suffisam-
ment grande et (i i ) une homogénéité des composants afin de ré-
duire les effets d'erreurs entre les observations sur le terrain et
par télédétection. Le seui l minimal de la dimension des parcel les a
été fixé à 1 600m2, et le nombre de points de prélèvement a été
défin i selon la surface des parcel les. Sur chaque point, seule l ’es-
pèce majoritaire dans la placette a été considérée pour la cal ibra-
tion, et un prélèvement GPS a été effectué pour la géolocal isation
des points. Ces procédés ont été répétés tous les 1 5 jours durant
plusieurs mois (6 mois x 3) pour pouvoir suivre l 'évolution des dif-
férents stades de développement de chaque espèce. Paral lèle-
ment, une programmation pour l ’acquisition d' images satel l i tes a
été effectuée par la station de réception et de traitement d’im-
ages satel l i tes SEAS-OI sise à la Réunion. Des Indices de Végéta-
tion Différentiels Normal isés (NDVI ) ont été calculés à partir des
images satel l i tes multispectrales SPOT 5 de 1 0 m de résolution,
acquises sur un pas de temps de 1 0 jours, en paral lèle avec les
prélèvements sur le terrain. L' indice de végétation correspond à la
valeur de réflectance du vert qui est fortement corrélée avec la
densité du couvert végétal et la capacité des plantes à absorber la
lumière solaire pour la convertir en biomasse (Meneses-Tovar
201 1 ). Dans le domaine spectral , la végétation chlorophyl l ienne a
toujours des valeurs de réflectance plus fortes que les autres élé-
ments (sols, eau, minéraux). Ainsi , d ifférentes relations de régres-
sion ont pu être calculées entre les données agronomiques
caractérisant chaque type de végétation et les données spatiales
(NDVI ), pour obtenir des modèles de prédiction (Figure 3).
CALIBRATION DU MODÈLE DE MATIÈRE SÈCHE. À chaque me-
sure du rendement fourrager sur le terrain, un échanti l lon-
nage de la biomasse des différents types de fourrages, en uti l isant
la méthode des placettes de 1m2, a été effectué le long d’un tran-
sect pour réal iser les analyses de matière sèche au laboratoire. Le
poids sec total des plantes a été déterminé selon les techniques
standardisées de séchage à l 'étuve à 60°C jusqu'à l 'obtention
d'un poids constant (Dulphy et al . 1 975). Ces poids ont alors été
multipl iés par le facteur approprié en relation avec la tai l le du
quadrat afin de les convertir en kg/ha. Les différentes teneurs en
matière sèche dans le temps sont par la suite couplés puis cor-
rélés avec la valeur du NDVI pour obtenir un ensemble de don-
nées sur la productivité en matière sèche à partir des données
satel l i tes et de la date de prise de l ' image. Un modèle de prédic-
tion de la variation temporel le de la teneur en matière sèche en
fonction de la valeur de NDVI a été cal ibré. Ce deuxième modèle
couplé au premier donnera, à partir d'une image satel l i te, la
teneur moyenne en matière sèche d'une parcel le déterminée à
une période déterminée. Par conséquent, connaissant la surfaceFigure 2. Répartition spatiale des zones pastorales à Madagascar (modifié d’aprèsVal l et al . 201 4)
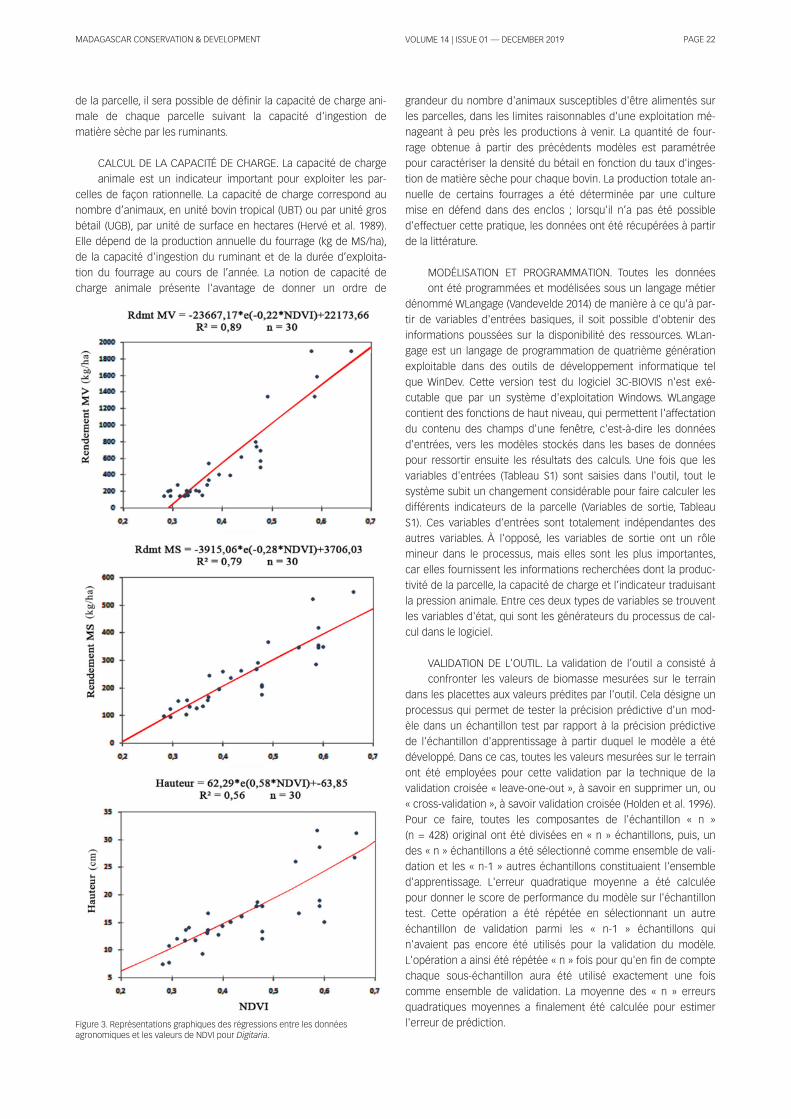
MADAGASCAR CONSERVATION & DEVELOPMENT PAGE 22VOLUME 1 4 | ISSUE 01 — DECEMBER 201 9
de la parcel le, i l sera possible de défin ir la capacité de charge ani-
male de chaque parcel le suivant la capacité d' ingestion de
matière sèche par les ruminants.
CALCUL DE LA CAPACITÉ DE CHARGE. La capacité de charge
animale est un indicateur important pour exploiter les par-
cel les de façon rationnel le. La capacité de charge correspond au
nombre d’animaux, en unité bovin tropical (UBT) ou par unité gros
bétai l (UGB), par unité de surface en hectares (Hervé et al . 1 989).
El le dépend de la production annuel le du fourrage (kg de MS/ha),
de la capacité d' ingestion du ruminant et de la durée d’exploita-
tion du fourrage au cours de l ’année. La notion de capacité de
charge animale présente l ' avantage de donner un ordre de
grandeur du nombre d'animaux susceptibles d'être al imentés sur
les parcel les, dans les l imites raisonnables d'une exploitation mé-
nageant à peu près les productions à venir. La quantité de four-
rage obtenue à partir des précédents modèles est paramétrée
pour caractériser la densité du bétai l en fonction du taux d' inges-
tion de matière sèche pour chaque bovin. La production totale an-
nuel le de certains fourrages a été déterminée par une culture
mise en défend dans des enclos ; lorsqu' i l n’a pas été possible
d'effectuer cette pratique, les données ont été récupérées à partir
de la l i ttérature.
MODÉLISATION ET PROGRAMMATION. Toutes les données
ont été programmées et modél isées sous un langage métier
dénommé WLangage (Vandevelde 201 4) de manière à ce qu'à par-
tir de variables d'entrées basiques, i l soit possible d'obtenir des
informations poussées sur la disponibi l i té des ressources. WLan-
gage est un langage de programmation de quatrième génération
exploitable dans des outi ls de développement informatique tel
que WinDev. Cette version test du logiciel 3C-BIOVIS n'est exé-
cutable que par un système d'exploitation Windows. WLangage
contient des fonctions de haut niveau, qui permettent l ' affectation
du contenu des champs d'une fenêtre, c'est-à-dire les données
d'entrées, vers les modèles stockés dans les bases de données
pour ressortir ensuite les résultats des calculs. Une fois que les
variables d'entrées (Tableau S1 ) sont saisies dans l 'outi l , tout le
système subit un changement considérable pour faire calculer les
différents indicateurs de la parcel le (Variables de sortie, Tableau
S1 ). Ces variables d'entrées sont totalement indépendantes des
autres variables. À l 'opposé, les variables de sortie ont un rôle
mineur dans le processus, mais el les sont les plus importantes,
car el les fournissent les informations recherchées dont la produc-
tivité de la parcel le, la capacité de charge et l ’ indicateur traduisant
la pression animale. Entre ces deux types de variables se trouvent
les variables d'état, qui sont les générateurs du processus de cal-
cul dans le logiciel .
VALIDATION DE L'OUTIL. La val idation de l ’outi l a consisté à
confronter les valeurs de biomasse mesurées sur le terrain
dans les placettes aux valeurs prédites par l 'outi l . Cela désigne un
processus qui permet de tester la précision prédictive d'un mod-
èle dans un échanti l lon test par rapport à la précision prédictive
de l 'échanti l lon d'apprentissage à partir duquel le modèle a été
développé. Dans ce cas, toutes les valeurs mesurées sur le terrain
ont été employées pour cette val idation par la technique de la
val idation croisée « leave-one-out », à savoir en supprimer un, ou
« cross-val idation », à savoir val idation croisée (Holden et al . 1 996).
Pour ce faire, toutes les composantes de l 'échanti l lon « n »
(n = 428) original ont été divisées en « n » échanti l lons, puis, un
des « n » échanti l lons a été sélectionné comme ensemble de val i -
dation et les « n-1 » autres échanti l lons constituaient l 'ensemble
d'apprentissage. L'erreur quadratique moyenne a été calculée
pour donner le score de performance du modèle sur l 'échanti l lon
test. Cette opération a été répétée en sélectionnant un autre
échanti l lon de val idation parmi les « n-1 » échanti l lons qui
n'avaient pas encore été uti l isés pour la val idation du modèle.
L'opération a ainsi été répétée « n » fois pour qu'en fin de compte
chaque sous-échanti l lon aura été uti l isé exactement une fois
comme ensemble de val idation. La moyenne des « n » erreurs
quadratiques moyennes a finalement été calculée pour estimer
l 'erreur de prédiction.Figure 3. Représentations graphiques des régressions entre les donnéesagronomiques et les valeurs de NDVI pour Digitaria .

MADAGASCAR CONSERVATION & DEVELOPMENT PAGE 23VOLUME 1 4 | ISSUE 01 — DECEMBER 201 9
RÉSULTATS ET DISCUSSIONRELATION ENTRE L’INDICE NDVI ET LE RENDEMENT DES DIF-
FÉRENTES ESPÈCES FOURRAGÈRES. Lorsque la végétation est
étudiée par télédétection, les variations de la réflectance
mesurées au niveau d’un capteur satel l i taire sont l iées aux pro-
priétés optiques de la biomasse végétale, mais également à la
structure de la végétation et au taux de recouvrement du sol .
Lorsque la végétation est peu couvrante, la réponse spectrale des
plantes est affectée par la réflectance des sols (Nesrine 201 5). I l y
a donc une grande différence entre la cal ibration des parcel les
fourragères naturel les et cel les qui sont cultivées. I l est générale-
ment plus diffici le d'avoir une bonne corrélation pour les parcours
et les pâturages naturels. Néanmoins, dans les deux cas, les
valeurs de NDVI présentaient toujours une forte corrélation avec
la densité du couvert végétal (Figure 3). Durant les différentes cal i -
brations, les modèles exponentiels ont donné de mei l leurs résul-
tats par rapport aux modèles l inéaires. Certains auteurs suggèrent
une relation non l inéaire entre NDVI et quantité de biomasse
(Tucker et al . 1 985, Santin-Janin et al . 2009). Les coefficients de
détermination entre NDVI et le rendement de biomasse végétal
sont mei l leurs pour les parcel les cultivées. Cependant, les par-
cours naturels sont moins uniformes du fait de l 'envahissement
par d'autres espèces d’adventices. De plus, les indices de végéta-
tion sont également sensibles à la réflectance du sol sous-jacent
(Moussa 2005). Ainsi , les coefficients de détermination sont moins
bons pour ces pâturages naturels. En moyenne, 70% des variabi l -
i tés des mesures directes sur le terrain sont expl iqués par les
modèles internes du logiciel à partir des données obtenues par
imagerie satel l i taire. Pour le reste, soit le logiciel sous-estime, soit
i l surestime, mais en général , les calculs se font dans l 'ensemble
en prenant en considération la total i té des pixels existant au
niveau de la parcel le. La figure 4 représente graphiquement le nu-
age de points des valeurs réel les sur le terrain, du rendement en
MV (tonnes/ha) des différentes espèces par rapport aux valeurs
prédites MV (tonnes/ha) par le logiciel . Le nuage de points affiche
la l igne qui i l lustre la prédiction parfaite, où la valeur prédite corre-
spond exactement à la valeur réel le. La distance d'un point par
rapport à cette l igne à un angle idéal de 45 degrés indique le
niveau d'exactitude ou d' inexactitude de la prédiction. Ainsi , les
résultats issus du logiciel confirment les capacités des données
satel l i taires à fournir des estimations de la productivité des four-
rages (Le Mézo 201 2). Les modèles de l 'outi l s'exécutent aussi
bien sur l 'échanti l lon test que sur l 'échanti l lon d'apprentissage
durant la val idation croisée.
VARIABLES DE SORTIE. Le logiciel calcule le rendement four-
rager moyen ainsi que la teneur en matière sèche du four-
rage déterminée à la date de la prise de l ' image satel l i taire. Ces
données ont été traitées par l 'outi l pour calculer la quantité de
fourrage total d isponible pour le bétai l à cette date, mais aussi la
capacité de charge optimale de la parcel le. Des coefficients de
conversion ont donné des informations sur le nombre maximum
d'herbivores, selon leur type (espèce animale, tai l le), pouvant pâ-
turer la surface de la parcel le sans détérioration de la végétation.
Les uti l isateurs de l 'outi l peuvent ainsi équi l ibrer la quantité in-
gérée par les animaux, la productivité en matières sèches de la
végétation, la gestion à long terme du pâturage et les coûts de
production (Klein et al . 201 4). Toutes ces données sont géolocal-
isées en degré décimal pour faci l i ter l ' introduction des données
dans les logiciels courants en système d' information géo-
graphique. Ainsi , i l sera désormais possible de réal iser des cartes
de disponibi l i té des ressources fourragères. Les cartes de
biomasse pourraient potentiel lement être uti l isées à plusieurs fins
comme dans la gestion de troupeaux ainsi que leur affourage-
ment en fonction de la disponibi l i té des ressources au niveau de
l 'exploitation et/ou au niveau du territoire. Mais d'autres fonctions
peuvent être envisagées ; i l a été démontré que ces cartes pou-
vaient être uti l isées pour planifier les feux contrôlés dans la ges-
tion de pâturage (Holechek et al . 1 995). La quantité de biomasse
uti l isée comme combustible doit atteindre au moins 1 500kg/ha
pour que le feu se propage (Trol lope et al . 1 986). Des perspectives
de développement de l 'élevage à Madagascar peuvent être envis-
agées, comme en Afrique du Sud, sur la diffusion de cartes de
disponibi l i té végétale rapportées tous les 1 0 jours au niveau des
ministères et des districts agricoles (Coughenour et Makkar 201 4).
Par conséquent, i l serait possible de profiter au maximum de la
disponibi l i té des ressources, comme dans la gestion de pâturage,
pour déterminer l ' instant propice de la mise à l 'herbe ou de la
sortie d'herbe durant une saison déterminée. Durant cette étude,
la cal ibration du logiciel a été effectuée à partir du satel l i te SPOT
5, mais rien n'empêche une adaptation à d’autres satel l i tes (par
exemple, Sentinel2) qui pourraient fournir les valeurs de NDVI .
Cependant, quel que soit le satel l i te uti l isé, certains paramètres
devraient être considérés lors de l 'uti l isation de l ’outi l comme : (i )
l ' a l lure générale de la prairie qui ne doit pas être trop dégradée,
c'est-à-dire que l ’offre fourragère ne devrait pas être trop l imitée
par l ’envahissement des adventices ou l ’apparition de zones
nues ; (i i ) une variation saisonnière prononcée (par exemple, le
prolongement de la saison sèche) pourrait affecter la teneur en
matière sèche prédite par le logiciel . Par ai l leurs, le logiciel est
doté d'un système de partage en l igne des résultats, rel ié directe-
ment à l ' adresse de l 'auteur. Ce système prendra en compte les
évaluations, ainsi que les contributions des uti l isateurs du logiciel
pour une éventuel le perspective d'évaluation ultérieure des
ressources fourragères à l 'échel le nationale.
CONCLUSIONL'élevage bovin est un secteur qui présente un grand potentiel
dans le développement de Madagascar. Cependant, plusieurs
manques à gagner subsistent encore dans ce domaine dû à une
mauvaise gestion des ressources al imentaires. Le présent article
présente les différentes étapes de développement d'un logiciel
appelé « 3C-BIOVIS » qui permet la prédiction du rendement des
ressources fourragères par l 'uti l isation combinée de modèles de
prédiction et de la télédétection. Le logiciel a été cal ibré à partirFigure 4. Nuage de points des valeurs réel les du rendement des différentesespèces par rapport aux valeurs prédites par le logiciel .
MADAGASCAR CONSERVATION & DEVELOPMENT PAGE 24VOLUME 1 4 | ISSUE 01 — DECEMBER 201 9
des modèles résultants des régressions entre les données
agronomiques mesurées au sol et les indices de végétation (NDVI )
obtenus par imagerie satel l i taire. Les régressions donnent une
moyenne des coefficients de détermination (R2) d’environ 0,7. Le
logiciel fournit la quantité ponctuel le de biomasses sur chaque
parcel le étudiée. Un système d'alerte, en feu tricolore offre une
aide aux uti l isateurs pour une éventuel le prise de décision sur la
gestion des ressources fourragères. I l devient possible à partir de
cet outi l d’affirmer que les indices de végétation peuvent être uti l -
isés pour la détermination de capacité de charge animale et de
l ’état de valorisation des parcel les de pâturage. Ce logiciel
représente une grande innovation dans les systèmes d’élevage
malgache pour la gestion des ressources fourragères à une
échel le territoriale. I l sera possible de profiter au maximum de la
disponibi l i té des ressources pour une plus grande contribution de
l 'élevage dans le développement du pays. Des perspectives sont
déjà envisagées comme la conception mensuel le d'une carte de
disponibi l i té des ressources dans les zones clés de l 'élevage mal-
gache. I l serait recommandable d'élargir le travai l à d'autres es-
pèces végétales et de les introduire dans les bases de données
du logiciel . Ou encore, l ' inventaire à l 'échel le nationale des
ressources disponibles dans l 'outi l pour une évaluation prospec-
tive de la situation fourragère.
REMERCIEMENTSNous tenons à remercier le projet BIOVA aux appuis techniques et
financiers pour la réal isation de cet article.
RÉFÉRENCESAndriarimalala, H. J. 201 4. Étude floristique de Brachiaria sp. , Chloris pennisetum
purpureum et élaboration d’un modèle d'estimation de leur productivité
par télédétection. Unpubl . MS thesis, Université d’Antananarivo, École
Supérieure des Sciences Agronomiques. Département Élevage. Disponible
en l igne <<http://bibl io.univ-
antananarivo.mg/pdfs/andriarimalalaHeri lalaoJ_AGRO_M2_1 4.pdf>
Archimède, H. , Sauvant, D. , Assoumaya, C. , Fanchone, A. et Boval , M. 2009. Four-
rages tropicaux : Valeur al imentaire comparée aux fourrages tempérés et
évaluation au pâturage. .Rencontres Recherches Ruminants 1 6: 1 7–24.
Disponible en l igne
<http://journees3r. fr/IMG/pdf/2009_01 _01 _Archimede.pdf>
Barbet-Massin, V. , Grimaud, P. , Michon, A. et Thomas, P. 2004. Guide Technique
pour la Création, la Gestion et la Valorisation des Prairies à la Réunion.
Disponible en l igne <http://publ ications.cirad. fr/une_no-
tice.php?dk=522332>
Bolton, J. K. & Brown, R. H. 1 980. Photosynthesis of grass species differing in car-
bon dioxide fixation pathways: V. Response of Panicum maximum, Panicum
milioides, and tal l fescue (Festuca arundinacea) to nitrogen nutrition. Plant
Physiology 66, 1 : 9–1 00. <https://doi .org/1 0.1 1 04/pp.66.1 .97>
Boudet, G. 1 975. Problèmes posés par l ’estimation de la capacité de charge d’un
pâturage naturel tropical . In : Inventaire et Cartographie des Pâturages Trop-
icaux Africains, Actes du Col loque de Bamako, Mal i (3–8 mars 1 975), pp
265–267. Institut d’Élevage et de Médecine Vétérinaire des Pays Tropicaux,
Maison-Alfort, France. Disponible en l igne <http://bit. ly/2H5Q2XS>
Coughenour, M. B. et Makkar, H. P. S. 201 4. La conduite d’évaluations nationales
des al iments pour animaux. Manuel de Production et de santé animale FAO
N. 1 5. Rome, Ital ie. Disponible en l igne <http://bit. ly/2I3xb0Y>
Dulphy, J. P. , Demarqui l ly, C. , Henry, M. , Jai l ler M. et Jamot, J. 1 975. Perte de com-
posés volati ls lors de la détermination à l ’étuve de la teneur en matière
sèche des ensi lages. Annales de Zootechnie 24, 4: 743–756. Disponible en
l igne <https://hal .archives-ouvertes. fr/hal-0088751 2/document>
Guérif, M. et Seguin, B. 1 991 . Estimation de la biomasse et du rendement des cul-
tures à partir du satel l i te SPOT: Résultats d'une expérimentation sur blé dur
en Camargue. Séminaire Méditerranéens 4: 1 1 5–1 27. Disponible en l igne
<http://om.ciheam.org/article.php? IDPDF=CI91 1 1 87>
Hervé, D. et Genin D. 1 998. Capacité de charge animale ou indicateur de pression
sur des ressources fourragères. Les Cahiers de la Recherche Développe-
ment, pp.38–49. Disponible en l igne
<http://www.documentation. ird. fr/hor/fdi :01 001 3720>
Holden, S. B. 1 996. Cross-val idation and the PAC Learning Model . Research Note
RN/96/64, Department of CS, University Col lege, London. Disponible en
l igne <https://dl .acm.org/citation.cfm?id=238067>
Holechek, J. L. , Pieper, R. D. & Herbel , C. H. 1 995. Range Management: Principles
and Practices, Second edition. Prentice-Hal l , New Jersey, USA.
Jol l i ffe, P. A. & Tregunna, E. B. 1 968. Effect of temperature, CO2 concentration, and
l ight intensity on oxygen inhibition of photosynthesis in wheat leaves. Plant
physiology 43, 6: 902–906. <https://doi .org/1 0.1 1 04/pp.43.6.902>
Kaufmann, J. C. 2008. The non-modern constitution of famines in Madagascar's
spiny forests: “water-food” plants, cattle and Mahafale landscape praxis.
Environmental Sciences 5, 2: 73–89.
<https://doi .org/1 0.1 080/1 5693430801 91 21 62>
Klein, H. -D. , Rippstein, G. , Huguenin J. , Guerin, H. , Toutain, B. et Louppe, D. 201 4.
Les Cultures Fourragères. Editions Quae, Versai l les, France.
Le Mézo, L. 201 2. Caractérisation de la ressource fourragère des prairies cultivées
de la Réunion par image satel l i te. Ph.D. thesis. Agronomie Production Végé-
tale Environnement, VetAgro Sup, CIRAD. Disponible en l igne
<https://bit. ly/2pmI6uD>
Marcel , A. 1 986. Capacité oxydative et résistance à la sécheresse de différentes
plantes supérieures CAM-C3-C4 et de végétaux inférieurs. Bul letin de la So-
ciété Botanique de France. Lettres Botaniques 1 33, 3: 207–21 2.
<http://dx.doi .org/1 0.1 080/01 81 1 797.1 986.1 0824702>
Ministère de l ’Agriculture, de l ’Élevage et de la Pêche 2004. Fi l ières et Actions du
Ministère de l ’Agriculture, de l ’Élevage et de la Pêche : Fi l ière Lait. Fiche N.
202. Disponible en l igne
<http://www. inter-reseaux.org/IMG/pdf_202_Fi l iere_Lait.pdf>
Ministère de l ’Élevage à Madagascar. 201 4. Statistiques des Cheptels à Madagas-
car. Rapport de la Direction des Ressources Animales. Disponible en l igne
<http://www.mpae.gov.mg/donnees/statistique/>
Meneses-Tovar, C. L. , 201 1 . L’indice différentiel normal isé de végétation comme
indicateur de la dégradation. Unasylva 62, 2: 39–46. Disponible en l igne
<http://www.fao.org/3/i2560f/i2560f07.pdf>
Mouret, P. 201 2. Evaluation participative des stratégies d'évolution d'exploitations
laitières dans la région Vakinankaratra - Madagascar. Mémoire d' ingénieur,
Productions et innovations dans les systèmes techniques végétaux.
AgroParisTech, Paris. Disponible en l igne <http://agritrop.cirad. fr/570246/>
Moussa, M. M. 2005. Appl ication des Méthodes d'Évaluation de Rendements
Agricoles à l 'Aide des Images NDVI . Centre régional Agrhymet, Rapport de
consultation, Niamey-Niger. Disponible en l igne <https://bit. ly/2mtmgUw>
Murata, Y. , Iyama, J. & Honma, T. 1 965. Studies on the photosynthesis of forage
crops. IV. Influence of air-temperature upon the photosynthesis and respira-
tion of alfal fa and several southern type forage crops. Japanese Journal of
Crop Science 34, 2: 1 54–1 58. <https://doi .org/1 0.1 626/jcs.34.1 54>
Nesrine, C. 201 5. Méthodes de classification pour la cartographie de l 'occupation
du sol , Journée Etats de surface pour la spatial isation, Techniques d'obser-
vation et méthodes d'analyse pour la gestion de l 'eau dans les bassins ver-
sants agricoles méditerranéens. Ecole d'Hiver, ENSEGID Bordeaux-INP.
Disponible en l igne <https://bit. ly/2NUtd09>
Rahetlah, V. B. , Salgado, P. , Andrianarisoa, B. , Ti l lard, E. , Razafindrazaka, H. , Le
Mezo, L. & Ramalanjaona, V. L. 201 4. Relationship between normal ized dif-
ference vegetation index (NDVI ) and forage biomass yield in the Vaki-
nankaratra region, Madagascar. Livestock Research for Rural Development
26, 5: #95. <http://www. lrrd.org/lrrd26/5/rahe26095.html>
Rakotozandrindrainy, R. , Razafindrajaona, J. M. et Foucras, G. 2007. Diagnostic
rapide à la ferme des mammites subcl in iques des vaches laitières du trian-
gle laitier des hautes terres de Madagascar. Revue de Médecine Vétérinaire
1 58, 2: 1 00–1 05.
Razafindrakoto, H. A. , 201 0. Le dynamisme de l ’élevage bovin dans la commune
urbaine de Tsiroanomandidy, capitale du Bongolava. Unpbl . MS thesis. Uni-
versité d’Antananarivo, Faculté des Lettres et Sciences Humaines. Disponi le
en l igne <https://bit. ly/2MMkQPY>

MADAGASCAR CONSERVATION & DEVELOPMENT PAGE 25VOLUME 1 4 | ISSUE 01 — DECEMBER 201 9
Ribot, J. J. 1 982. Les comportements de l 'éleveur et du zébu à Madagascar :
l ' adaptation du rôle et des actions du service de l 'élevage à ces comporte-
ments. Terre Malgache. Tany Malagasy 21 : 1 25–1 36. Disponible en l igne
<https://bit. ly/2Dchru7>
Rouse Jr. , J. W. , Hass, R. H. ,Schel l , J. A. & Deering, D. W. 1 974. Monitoring
vegetation systems in the Great Plains with ERTS. NASA Goddard Space
Fl ight Center 3d ERTS-1 Symp. 1 , A: 309–31 7. Disponible en l igne
https://ntrs.nasa.gov/search. jsp?R=1 974002261 4>
Santin-Janin, H. , Garel , M. , Chapuis, J. L. & Pontier, D. 2009. Assessing the perfor-
mance of NDVI as a proxy for plant biomass using non-l inear models: a
case study on the Kerguelen archipelago. Polar Biology 32, 6: 861 –871 .
<https://doi .org/1 0.1 007/s00300-009-0586-5>
Val l , E. , Salgado, P. , Corniaux, C. , Blanchard, M. , Duti l ly, C. & Alary, V. 201 4. Change-
ments et innovations dans les systèmes d’élevage en Afrique INRA Produc-
tions Animales 27, 2: 1 61 –1 74.
Waeber, P. O. , Wi lmé, L. , Ramamonj isoa, B. , Garcia, C. , Rakotomalala, D. , et al . 201 5.
Dry forests in Madagascar, neglected and under pressure. International
Forestry Review 1 7, S2: 1 27–1 48.
<http://dx.doi .org/1 0.1 505/1 4655481 581 5834822>
MATÉRIEL SUPPLÉMENTAIREDisponible en l igne uniquement
Tableau S1 . Modèles et variables du Logiciel 3C-BIOVIS.
MADAGASCAR CONSERVATION & DEVELOPMENT PAGE 26VOLUME 1 4 | ISSUE 01 — DECEMBER 201 9
ABSTRACTA more up to date biogeographic analysis of the patterns of distri-
bution presented by the scorpions of the fami ly Microcharmidae
Lourenço 1 996 are presented. This fami ly is reval idated here
based on numerous morphological characters. This Malagasy
group of scorpions is represented by two genera, Microcharmus
Lourenço 1 995 and Neoprotobuthus Lourenço 2000 both endemic
to the Island. The fami ly Microcharmidae seems to be restricted to
dry and wet forests formations in the northern and northwestern
portions of the island. Here we describe three species new to sci-
ence: Microcharmus andrei sp. n. , Microcharmus antongil sp. n.
and Microcharmus djangoa sp. n. The distribution of these new
species seems to be restricted to the northern range of Madagas-
car, in habitats ranging from dry to wet forests, confirming there-
fore the patterns previously observed.
RÉSUMÉUne analyse biogéographique à jour portant sur les schémas de
distribution des scorpions de la fami l le des Microcharmidae
Lourenço 1 996 est présentée. La fami l le est ici reval idée sur la
base de nombreux caractères morphologiques. Ce groupe de
scorpions de Madagascar est représenté par deux genres, Mi-
crocharmus Lourenço 1 995 et Neoprotobuthus Lourenço 2000
tous deux endémiques de l ’île. La fami l le des Microcharmidae
semble avoir une distribution l imitée aux formations forestières
sèches et humides des parties nord et nord-ouest de l ’île. Ici , nous
décrivons trois espèces nouvel les pour la science : Microcharmus
andrei sp. n. , Microcharmus antongil sp. n. et Microcharmus djan-
goa sp. n. La distribution de ces trois nouvel les espèces semble
l imitée à la partie septentrionale de Madagascar, dans des habi-
tats al lant des forêts sèches à humides, ce qui confirme ainsi les
schémas préalablement observés.
INTRODUCTIONAs already outl ined in previous publ ications humiculous scorpions
l iving in organic soi l are rare in most regions of the world (Vachon
1 974, Lamoral 1 976, Lourenço 1 998, 2003, 2004, 2005, Lourenço et
al . 2006, Rossi and Lourenço 201 5). In Madagascar, the most char-
acteristic soi l scorpions belong to the fami ly Microcharmidae
Lourenço which is represented by two genera Microcharmus
Lourenço and Neoprotobuthus Lourenço. The genus Microchar-
mus was described by Lourenço (1 995), based on one new
species Microcharmus cloudsleythompsoni Lourenço having as
holotype one female specimen col lected by the Professor Jacques
Mi l lot in the region of Zangoa in the northwest of Madagascar in
1 947 (Lourenço 1 995). I t is unclear however, how this specimen
was col lected or obtained, since no specific information was pro-
vided in the labels. No matter, in this same year of 1 947 J. Mi l lot
col lected a second specimen on the Island of Nosy Be which was
described as Microcharmus jussarae Lourenço 1 996 (Lourenço
1 996a). This species was apparently col lected under a piece of
bark found in the soi l . Coincidently two other species were de-
scribed also in 1 996, Microcharmus hauseri Lourenço and Mi-
crocharmus sabineae Lourenço, respectively from Nosy Be and
the Marojejy Mountain. In both cases the specimens were ob-
tained with the use of extractions methods of the Berlese type
(Lourenço 1 996a,b).
In the fol lowing years, two other genera were described in
the fami ly Microcharmidae, Neoprotobuthus Lourenço 2000 and
Ankaranocharmus Lourenço 2004 (Lourenço 2000, 2004). Subse-
ARTICLE http://dx.doi .org/1 0.431 4/mcd.v1 4i1 .5
Additions to the geographical distribution of theMalagasy fami ly Microcharmidae Lourenço 1 996(Scorpiones: Buthoidea) and description of threenew species of Microcharmus Lourenço 1 995
Wilson R. LourençoI, Patrick O. WaeberI I , LucienneWilméII I
Correspondence:
Wi lson R. Lourenço
Muséum national d’Histoire naturel le, Sorbonne Universités,
Institut de Systématique, Evolution, Biodiversité (ISYEB), UMR7205-
CNRS, MNHN, UPMC, EPHE, CP 53, 57 rue Cuvier, 75005 Paris,
France
Emai l : wi lson. [email protected]
Citation Lourenço, W. R. , Waeber, P. O. and Wi lmé, L. 201 9. Additions to the geographical d istribution of the Malagasy fami ly Microcharmidae Lourenço 1 996(Scorpiones: Buthoidea) and description of three new species of Microcharmus Lourenço 1 995. Madagascar Conservation & Development 1 4, 1 : 26-36.http://dx.doi .org/1 0.431 4/mcd.v1 4i1 .5
I Muséum national d’Histoire naturel le, Sorbonne Universités, Institut de Systématique, Évolution, Biodiversité (ISYEB), UMR7205-CNRS, MNHN, UPMC, EPHE,CP 53, 57 rue Cuvier, 75005 Paris, France
I I ETH Zurich, Department of ITES, Forest Management and Development (ForDev) Group, Universitätstrasse 1 6, 8092 Zurich, SwitzerlandI I I Missouri Botanical Garden, Madagascar Research and Conservation Program, BP 3391 , Antananarivo 1 01 , Madagascar
MADAGASCAR CONSERVATION & DEVELOPMENT PAGE 27VOLUME 1 4 | ISSUE 01 — DECEMBER 201 9
quently, the val id ity of the genus Ankaranocharmus was ques-
tioned and this genus was placed in the synonymy of Microchar-
mus (Lourenço et al . 2006).
After the description of the first species in the fami ly Mi-
crocharmidae in 1 995 (Lourenço 1 995), the slow pace of new de-
scriptions was largely associated with the difficulties of col lecting.
In fact, these scorpions are difficult to col lect by ordinary methods
as rock-rol l ing, pit-fal l traps and even the use of UV l ight mainly
due to their minute sizes, apparently low vagi l i ties and cryptic be-
haviors. Final ly, thanks to precise systematic invertebrate surveys
at several sites in Madagascar mainly by B. L. Fisher and col-
leagues of the Cal ifornia Academy of Sciences, but also a team of
Malagasy field biologists, a first global synthesis on this scorpion
group was possible (Lourenço et al . 2006). Unti l th is main revision
of the group, seven species were recognized in the genus Mi-
crocharmus, whi le Neoprotobuthus was monotypic. With the new
descriptions the number of species and subspecies of Microchar-
mus was raised to 1 5.
Since this main revision, almost no new element was added
to the fami ly Microcharmidae. The single exception being the de-
scription of a new species Microcharmus henderickxi Lourenço
2009 found however in Copal (Lourenço 2009).
In this paper three new species are described, and some bio-
geographical aspects are proposed for this fami ly.
METHODSI l lustrations and measurements were produce using a Wi ld M5
stereo-microscope with a drawing tube and ocular micrometer (at
25 and 50x). Measurements fol low Stahnke (1 970) and are given in
mm. Trichobothrial notations fol low Vachon (1 974, 1 975), and mor-
phological terminology mostly fol lows Vachon (1 952), Hjel le (1 990).
Hemispermatophore terminology mostly fol lows Lamoral (1 979).
Specimens used in this taxonomic contribution are now deposited
in the Muséum national d’Histoire naturel le, Paris, France (MNHN).
The characters color and pigmentation are the most conspic-
uous external ones in scorpions, especial ly amongst buthoids.
These are largely used for in taxonomy of several groups of micro-
buthoids. I t is important to distinguish two aspects of coloration.
One is the color of the cuticle itself, which can vary from clear
(transparent) to black. Among some scorpions, coloration changes
with the age. Juveni le stages of several species are variegated yel-
low, whereas the adults are black. A second type of coloration is
due to the presence of sub-cuticular pigments, which form a vari-
ety of configurations or etched-l ike patterns over the body, pedi-
palps, and chel icerae. This second type of pigmentation does not
normal ly change with age, but it can be masked by sclerification
(Lourenço 1 983, Lourenço and Cloudsley-Thompson 1 996). In the
case of microbuthoid scorpions, color and pigments are very use-
ful characters for species identification, as is the case for other
scorpion genera such as Ananteris (Lourenço 1 982) and Tity-
obuthus (Lourenço 1 996a). In the present study, the diagnosis and
descriptions of the different new taxa were largely based on pre-
cise patterns of pigmentation.
TAXONOMIC POSITION OF THE FAMILY MI-CROCHARMIDAEAmong the new genera described for the Malagasy fauna since
1 995 (Lourenço 1 995) Microcharmus appears as one of the most
remarkable discoveries. In itial ly, this genus was placed in the fam-
i ly Buthidae, but soon after, and in view of some notable distinct
characters, i t was accommodated in a new subfami ly Mi-
crocharminae (Lourenço 1 996a). Subsequent new analysis led the
subfami ly to be raised to the fami l ial rank (Lourenço 1 998); this
decision was supported by the discoveries of new taxa within the
Microcharmidae and in particular a second genus Neoproto-
buthus Lourenço (Lourenço 2000). Further data to support the po-
sition of this fami ly was also provided by the analysis of several
characters with the use of Scanning Electron Microscopy technics
(SEM). Detai led results based on about ten characters were pre-
sented first by Lourenço (2002a) and again by Lourenço et al .
(2006).
Subsequently some authors rejected the val id ity of the fami ly
Microcharmidae, but in many cases this divergence of opinion
was not global ly justified. In a publ ication treating on the compar-
ative anatomy of the mesosomal organs of scorpions, Volschenk
et al . (2008) reached to the conclusion that Microcharmidae pre-
sented the same characteristics of several other buthid genera.
Consequently, they considered it as a synonym of Buthidae. To
justify their opinion, these authors stated as fol lows: “Our obser-
vations on the ovariuterine anatomy also support mounting evi-
dence that the genus Microcharmus Lourenço 1 996, currently
placed in a unique fami ly, Microcharmidae Lourenço 1 996, is a
buthid (… ) We observed the complex open form of the eight-
cel led ovariuterus in M. pauliani ambre and two buthids, Babycu-
rus jacksoni (Pocock 1 890) and Lychas tricarinatus. Microcharmus
also lacks lateral lymphoid organs, which is another buthid char-
acteristic. These anatomical characters support numerous exter-
nal morphological characters (e.g. the presence of the type-A
trichobothrial pattern on the pedipalps) otherwise unique to
Buthidae, [from which Microcharmidae is separated principal ly on
the basis of size and ecology] (Lourenço 2000b). The balance of
evidence does not, in our opinion, warrant continued recognition
of Microcharmidae, which renders Buthidae paraphyletic (E. S.
Volschenk & L. Prendini , unpubl . data). We therefore propose the
fol lowing new synonymy: Microcharmidae Lourenço 1 996 = Buthi-
dae C.L. Koch, 1 837.”
I t seems obvious that this character taken from the type of
ovariuterus found in Microcharmidae and Buthidae attests to the
close relationships between these two fami l ies. In fact, from the
beginning Lourenço (1 998, 2000, 2002a, Lourenço et al . 2006) con-
sidered Microcharmidae within a buthoid group together with
buthids. What, however is not acceptable is the fact that
Volschenk et al . (2008) global ly ignore al l the characters used by
Lourenço (2002a) and Lourenço et al . (2006) to justify the fami ly
Microcharmidae, stating that the fami ly was based “principal ly on
the basis of size and ecology” what is incorrect. In the publ ication
by Volschenk et al . (2008), other unjustified contradictions can also
be noticed. One pecul iar example cal ls the attention: On page 667,
the authors stated as fol lows: “Lourenço (2002) speculated that
Lisposoma would possess wel l -developed diverticulae l ike other
scorpionoid taxa, contrary to Stockwel l (1 989) and Prendini
(2000).” This statement is not only incorrect, but can also be con-
sidered bizarre since in the article by Lourenço (2002b), or any
other article even publ ished by this author, the genus Lisposoma
was never treated or discussed.
In conclusion, we reval idate the fami ly Microcharmidae at
present and the diagnostic characters already used in the previ-
ous diagnosis are l isted again here below. For some characters,
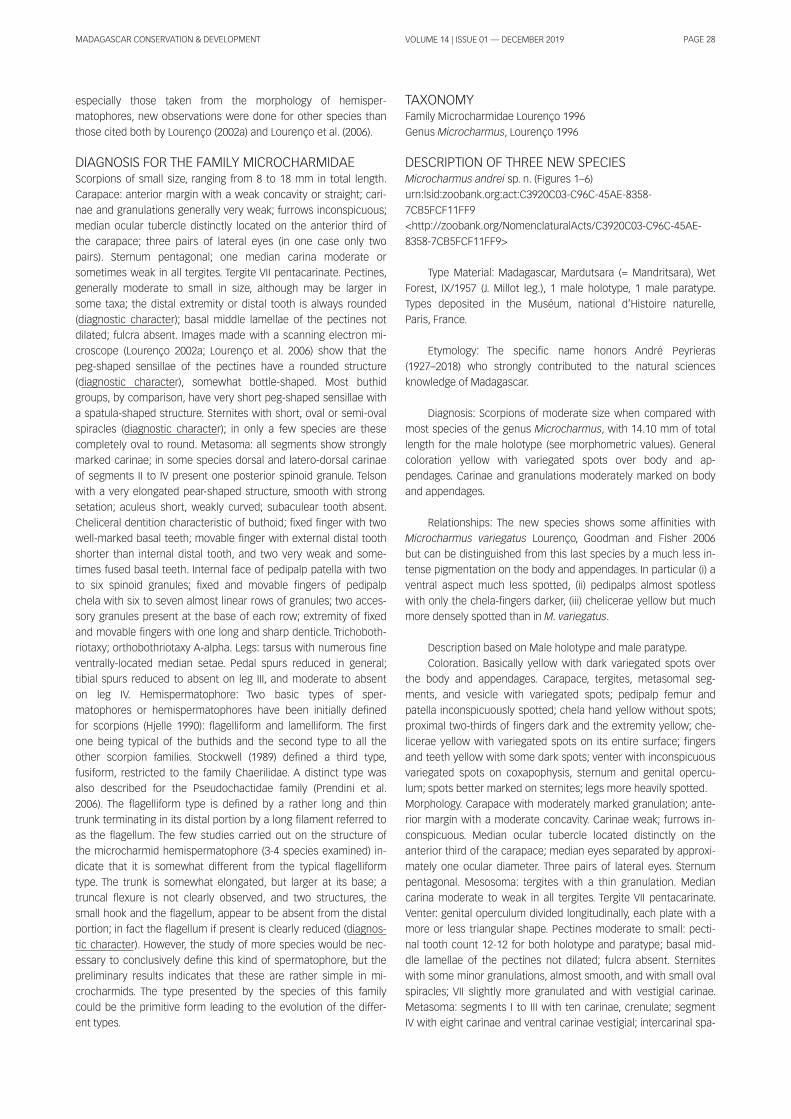
MADAGASCAR CONSERVATION & DEVELOPMENT PAGE 28VOLUME 1 4 | ISSUE 01 — DECEMBER 201 9
especial ly those taken from the morphology of hemisper-
matophores, new observations were done for other species than
those cited both by Lourenço (2002a) and Lourenço et al . (2006).
DIAGNOSIS FOR THE FAMILY MICROCHARMIDAEScorpions of smal l size, ranging from 8 to 1 8 mm in total length.
Carapace: anterior margin with a weak concavity or straight; cari-
nae and granulations general ly very weak; furrows inconspicuous;
median ocular tubercle distinctly located on the anterior third of
the carapace; three pairs of lateral eyes (in one case only two
pairs). Sternum pentagonal ; one median carina moderate or
sometimes weak in al l tergites. Tergite VI I pentacarinate. Pectines,
general ly moderate to smal l in size, al though may be larger in
some taxa; the distal extremity or distal tooth is always rounded
(diagnostic character); basal middle lamel lae of the pectines not
di lated; fulcra absent. Images made with a scanning electron mi-
croscope (Lourenço 2002a; Lourenço et al . 2006) show that the
peg-shaped sensi l lae of the pectines have a rounded structure
(diagnostic character), somewhat bottle-shaped. Most buthid
groups, by comparison, have very short peg-shaped sensi l lae with
a spatula-shaped structure. Sternites with short, oval or semi-oval
spiracles (diagnostic character); in only a few species are these
completely oval to round. Metasoma: al l segments show strongly
marked carinae; in some species dorsal and latero-dorsal carinae
of segments I I to IV present one posterior spinoid granule. Telson
with a very elongated pear-shaped structure, smooth with strong
setation; aculeus short, weakly curved; subaculear tooth absent.
Chel iceral dentition characteristic of buthoid; fixed finger with two
wel l -marked basal teeth; movable finger with external distal tooth
shorter than internal distal tooth, and two very weak and some-
times fused basal teeth. Internal face of pedipalp patel la with two
to six spinoid granules; fixed and movable fingers of pedipalp
chela with six to seven almost l inear rows of granules; two acces-
sory granules present at the base of each row; extremity of fixed
and movable fingers with one long and sharp denticle. Trichoboth-
riotaxy; orthobothriotaxy A-alpha. Legs: tarsus with numerous fine
ventral ly-located median setae. Pedal spurs reduced in general ;
tibial spurs reduced to absent on leg I I I , and moderate to absent
on leg IV. Hemispermatophore: Two basic types of sper-
matophores or hemispermatophores have been initial ly defined
for scorpions (Hjel le 1 990): flagel l i form and lamel l i form. The first
one being typical of the buthids and the second type to al l the
other scorpion fami l ies. Stockwel l (1 989) defined a third type,
fusiform, restricted to the fami ly Chaeri l idae. A distinct type was
also described for the Pseudochactidae fami ly (Prendini et al .
2006). The flagel l i form type is defined by a rather long and thin
trunk terminating in its distal portion by a long fi lament referred to
as the flagel lum. The few studies carried out on the structure of
the microcharmid hemispermatophore (3-4 species examined) in-
dicate that it is somewhat different from the typical flagel l i form
type. The trunk is somewhat elongated, but larger at its base; a
truncal flexure is not clearly observed, and two structures, the
smal l hook and the flagel lum, appear to be absent from the distal
portion; in fact the flagel lum if present is clearly reduced (diagnos-
tic character). However, the study of more species would be nec-
essary to conclusively define this kind of spermatophore, but the
prel iminary results indicates that these are rather simple in mi-
crocharmids. The type presented by the species of this fami ly
could be the primitive form leading to the evolution of the differ-
ent types.
TAXONOMYFami ly Microcharmidae Lourenço 1 996
Genus Microcharmus, Lourenço 1 996
DESCRIPTION OF THREE NEW SPECIESMicrocharmus andrei sp. n. (Figures 1 –6)
urn: lsid:zoobank.org:act:C3920C03-C96C-45AE-8358-
7CB5FCF1 1 FF9
<http://zoobank.org/NomenclaturalActs/C3920C03-C96C-45AE-
8358-7CB5FCF1 1 FF9>
Type Material : Madagascar, Mardutsara (= Mandritsara), Wet
Forest, IX/1 957 (J. Mi l lot leg. ), 1 male holotype, 1 male paratype.
Types deposited in the Muséum, national d’Histoire naturel le,
Paris, France.
Etymology: The specific name honors André Peyrieras
(1 927–201 8) who strongly contributed to the natural sciences
knowledge of Madagascar.
Diagnosis: Scorpions of moderate size when compared with
most species of the genus Microcharmus, with 1 4.1 0 mm of total
length for the male holotype (see morphometric values). General
coloration yel low with variegated spots over body and ap-
pendages. Carinae and granulations moderately marked on body
and appendages.
Relationships: The new species shows some affin ities with
Microcharmus variegatus Lourenço, Goodman and Fisher 2006
but can be distinguished from this last species by a much less in-
tense pigmentation on the body and appendages. In particular (i ) a
ventral aspect much less spotted, (i i ) pedipalps almost spotless
with only the chela-fingers darker, (i i i ) chel icerae yel low but much
more densely spotted than in M. variegatus.
Description based on Male holotype and male paratype.
Coloration. Basical ly yel low with dark variegated spots over
the body and appendages. Carapace, tergites, metasomal seg-
ments, and vesicle with variegated spots; pedipalp femur and
patel la inconspicuously spotted; chela hand yel low without spots;
proximal two-thirds of fingers dark and the extremity yel low; che-
l icerae yel low with variegated spots on its entire surface; fingers
and teeth yel low with some dark spots; venter with inconspicuous
variegated spots on coxapophysis, sternum and genital opercu-
lum; spots better marked on sternites; legs more heavi ly spotted.
Morphology. Carapace with moderately marked granulation; ante-
rior margin with a moderate concavity. Carinae weak; furrows in-
conspicuous. Median ocular tubercle located distinctly on the
anterior third of the carapace; median eyes separated by approxi-
mately one ocular diameter. Three pairs of lateral eyes. Sternum
pentagonal . Mesosoma: tergites with a thin granulation. Median
carina moderate to weak in al l tergites. Tergite VI I pentacarinate.
Venter: genital operculum divided longitudinal ly, each plate with a
more or less triangular shape. Pectines moderate to smal l : pecti-
nal tooth count 1 2-1 2 for both holotype and paratype; basal mid-
dle lamel lae of the pectines not di lated; fulcra absent. Sternites
with some minor granulations, almost smooth, and with smal l oval
spiracles; VI I sl ightly more granulated and with vestigial carinae.
Metasoma: segments I to I I I with ten carinae, crenulate; segment
IV with eight carinae and ventral carinae vestigial ; intercarinal spa-
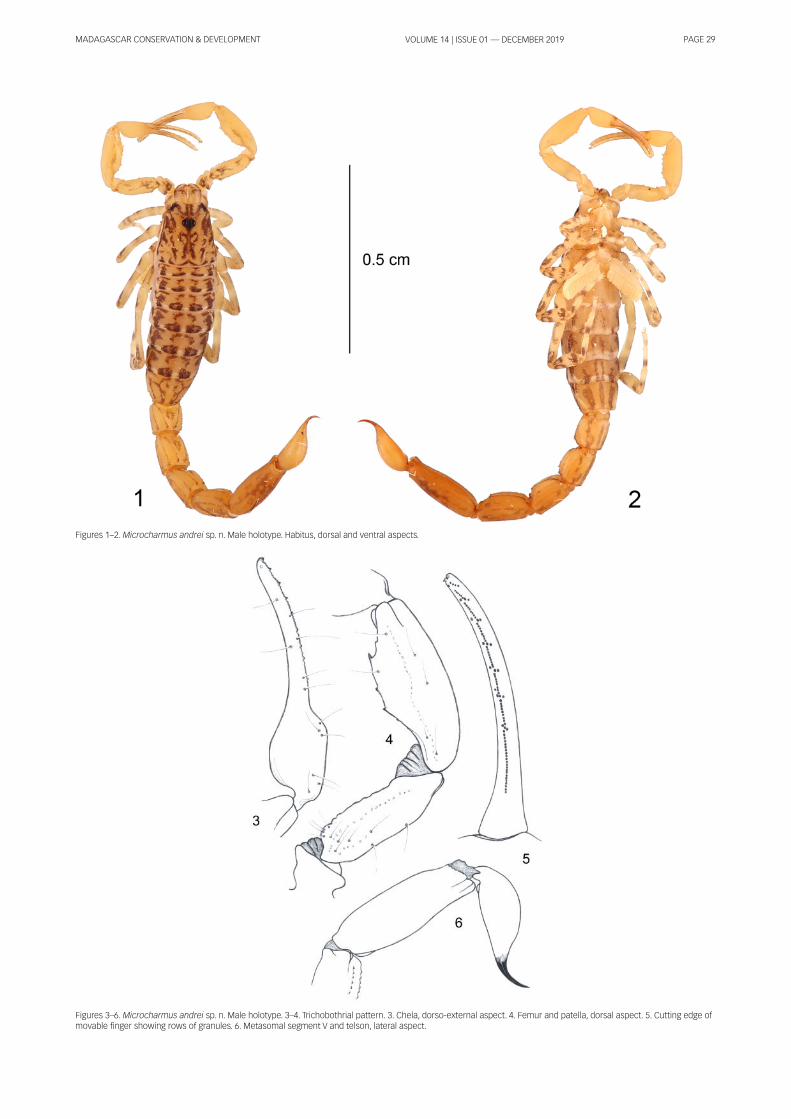
MADAGASCAR CONSERVATION & DEVELOPMENT PAGE 29VOLUME 1 4 | ISSUE 01 — DECEMBER 201 9
Figures 1 –2. Microcharmus andrei sp. n. Male holotype. Habitus, dorsal and ventral aspects.
Figures 3–6. Microcharmus andrei sp. n. Male holotype. 3–4. Trichobothrial pattern. 3. Chela, dorso-external aspect. 4. Femur and patel la, dorsal aspect. 5. Cutting edge ofmovable finger showing rows of granules. 6. Metasomal segment V and telson, lateral aspect.
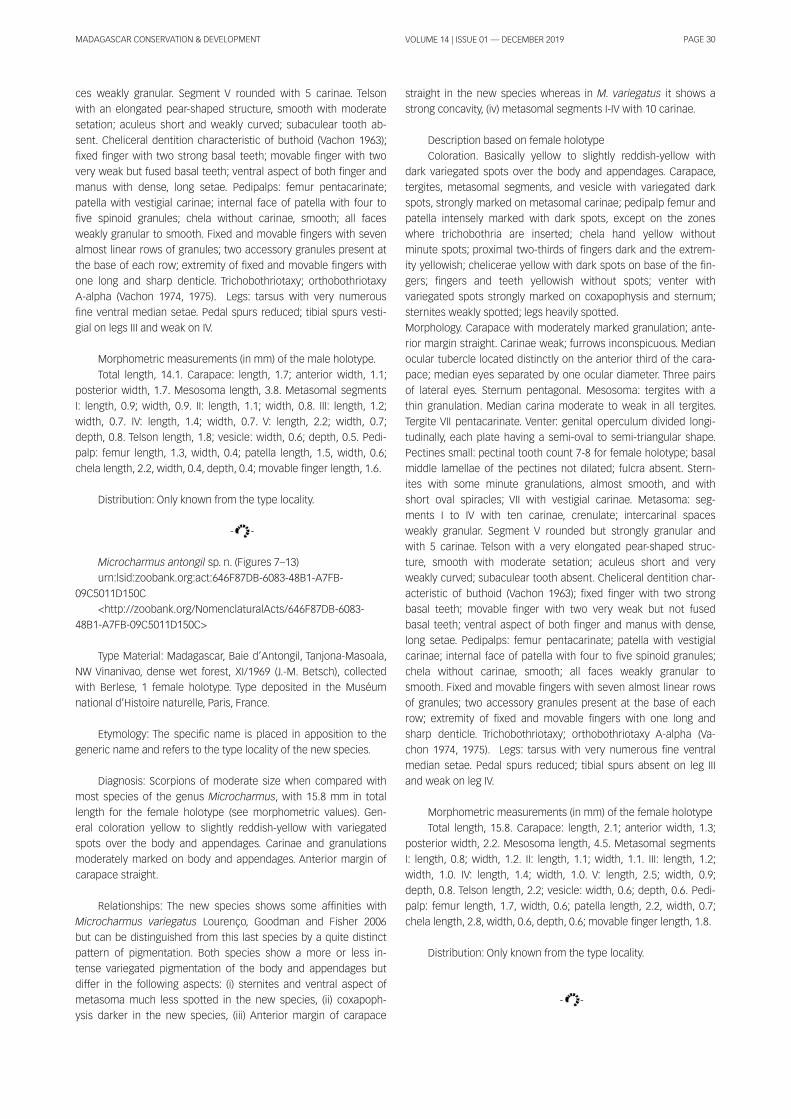
MADAGASCAR CONSERVATION & DEVELOPMENT PAGE 30VOLUME 1 4 | ISSUE 01 — DECEMBER 201 9
ces weakly granular. Segment V rounded with 5 carinae. Telson
with an elongated pear-shaped structure, smooth with moderate
setation; aculeus short and weakly curved; subaculear tooth ab-
sent. Chel iceral dentition characteristic of buthoid (Vachon 1 963);
fixed finger with two strong basal teeth; movable finger with two
very weak but fused basal teeth; ventral aspect of both finger and
manus with dense, long setae. Pedipalps: femur pentacarinate;
patel la with vestigial carinae; internal face of patel la with four to
five spinoid granules; chela without carinae, smooth; al l faces
weakly granular to smooth. Fixed and movable fingers with seven
almost l inear rows of granules; two accessory granules present at
the base of each row; extremity of fixed and movable fingers with
one long and sharp denticle. Trichobothriotaxy; orthobothriotaxy
A-alpha (Vachon 1 974, 1 975). Legs: tarsus with very numerous
fine ventral median setae. Pedal spurs reduced; tibial spurs vesti-
gial on legs I I I and weak on IV.
Morphometric measurements (in mm) of the male holotype.
Total length, 1 4.1 . Carapace: length, 1 .7; anterior width, 1 . 1 ;
posterior width, 1 .7. Mesosoma length, 3.8. Metasomal segments
I : length, 0.9; width, 0.9. I I : length, 1 . 1 ; width, 0.8. I I I : length, 1 .2;
width, 0.7. IV: length, 1 .4; width, 0.7. V: length, 2.2; width, 0.7;
depth, 0.8. Telson length, 1 .8; vesicle: width, 0.6; depth, 0.5. Pedi-
palp: femur length, 1 .3, width, 0.4; patel la length, 1 .5, width, 0.6;
chela length, 2.2, width, 0.4, depth, 0.4; movable finger length, 1 .6.
Distribution: Only known from the type local i ty.
- -
Microcharmus antongil sp. n. (Figures 7–1 3)
urn: lsid:zoobank.org:act:646F87DB-6083-48B1 -A7FB-
09C501 1 D1 50C
<http://zoobank.org/NomenclaturalActs/646F87DB-6083-
48B1 -A7FB-09C501 1 D1 50C>
Type Material : Madagascar, Baie d’Antongi l , Tanjona-Masoala,
NW Vinanivao, dense wet forest, XI/1 969 (J. -M. Betsch), col lected
with Berlese, 1 female holotype. Type deposited in the Muséum
national d’Histoire naturel le, Paris, France.
Etymology: The specific name is placed in apposition to the
generic name and refers to the type local i ty of the new species.
Diagnosis: Scorpions of moderate size when compared with
most species of the genus Microcharmus, with 1 5.8 mm in total
length for the female holotype (see morphometric values). Gen-
eral coloration yel low to sl ightly reddish-yel low with variegated
spots over the body and appendages. Carinae and granulations
moderately marked on body and appendages. Anterior margin of
carapace straight.
Relationships: The new species shows some affin ities with
Microcharmus variegatus Lourenço, Goodman and Fisher 2006
but can be distinguished from this last species by a quite distinct
pattern of pigmentation. Both species show a more or less in-
tense variegated pigmentation of the body and appendages but
differ in the fol lowing aspects: (i ) sternites and ventral aspect of
metasoma much less spotted in the new species, (i i ) coxapoph-
ysis darker in the new species, (i i i ) Anterior margin of carapace
straight in the new species whereas in M. variegatus i t shows a
strong concavity, (iv) metasomal segments I-IV with 1 0 carinae.
Description based on female holotype
Coloration. Basical ly yel low to sl ightly reddish-yel low with
dark variegated spots over the body and appendages. Carapace,
tergites, metasomal segments, and vesicle with variegated dark
spots, strongly marked on metasomal carinae; pedipalp femur and
patel la intensely marked with dark spots, except on the zones
where trichobothria are inserted; chela hand yel low without
minute spots; proximal two-thirds of fingers dark and the extrem-
ity yel lowish; chel icerae yel low with dark spots on base of the fin-
gers; fingers and teeth yel lowish without spots; venter with
variegated spots strongly marked on coxapophysis and sternum;
sternites weakly spotted; legs heavi ly spotted.
Morphology. Carapace with moderately marked granulation; ante-
rior margin straight. Carinae weak; furrows inconspicuous. Median
ocular tubercle located distinctly on the anterior third of the cara-
pace; median eyes separated by one ocular diameter. Three pairs
of lateral eyes. Sternum pentagonal . Mesosoma: tergites with a
thin granulation. Median carina moderate to weak in al l tergites.
Tergite VI I pentacarinate. Venter: genital operculum divided longi-
tudinal ly, each plate having a semi-oval to semi-triangular shape.
Pectines smal l : pectinal tooth count 7-8 for female holotype; basal
middle lamel lae of the pectines not di lated; fulcra absent. Stern-
ites with some minute granulations, almost smooth, and with
short oval spiracles; VI I with vestigial carinae. Metasoma: seg-
ments I to IV with ten carinae, crenulate; intercarinal spaces
weakly granular. Segment V rounded but strongly granular and
with 5 carinae. Telson with a very elongated pear-shaped struc-
ture, smooth with moderate setation; aculeus short and very
weakly curved; subaculear tooth absent. Chel iceral dentition char-
acteristic of buthoid (Vachon 1 963); fixed finger with two strong
basal teeth; movable finger with two very weak but not fused
basal teeth; ventral aspect of both finger and manus with dense,
long setae. Pedipalps: femur pentacarinate; patel la with vestigial
carinae; internal face of patel la with four to five spinoid granules;
chela without carinae, smooth; al l faces weakly granular to
smooth. Fixed and movable fingers with seven almost l inear rows
of granules; two accessory granules present at the base of each
row; extremity of fixed and movable fingers with one long and
sharp denticle. Trichobothriotaxy; orthobothriotaxy A-alpha (Va-
chon 1 974, 1 975). Legs: tarsus with very numerous fine ventral
median setae. Pedal spurs reduced; tibial spurs absent on leg I I I
and weak on leg IV.
Morphometric measurements (in mm) of the female holotype
Total length, 1 5.8. Carapace: length, 2.1 ; anterior width, 1 .3;
posterior width, 2.2. Mesosoma length, 4.5. Metasomal segments
I : length, 0.8; width, 1 .2. I I : length, 1 . 1 ; width, 1 . 1 . I I I : length, 1 .2;
width, 1 .0. IV: length, 1 .4; width, 1 .0. V: length, 2.5; width, 0.9;
depth, 0.8. Telson length, 2.2; vesicle: width, 0.6; depth, 0.6. Pedi-
palp: femur length, 1 .7, width, 0.6; patel la length, 2.2, width, 0.7;
chela length, 2.8, width, 0.6, depth, 0.6; movable finger length, 1 .8.
Distribution: Only known from the type local i ty.
- -
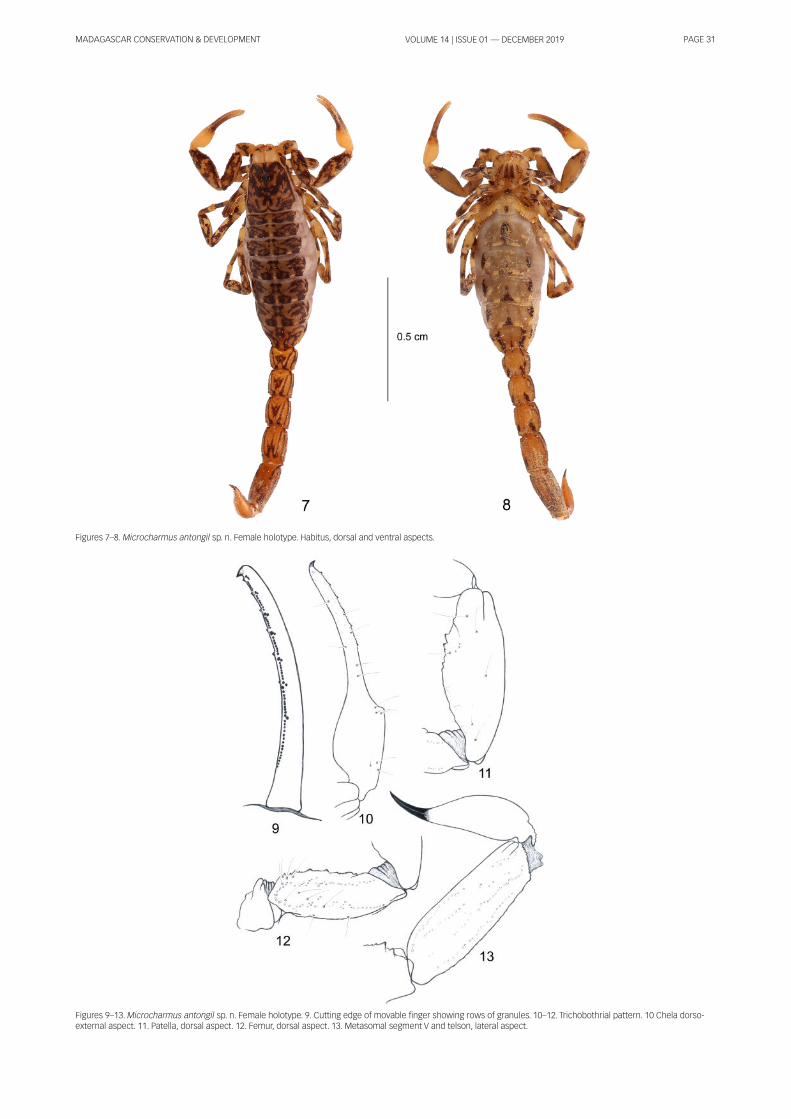
MADAGASCAR CONSERVATION & DEVELOPMENT PAGE 31VOLUME 1 4 | ISSUE 01 — DECEMBER 201 9
Figures 7–8. Microcharmus antongil sp. n. Female holotype. Habitus, dorsal and ventral aspects.
Figures 9–1 3. Microcharmus antongil sp. n. Female holotype. 9. Cutting edge of movable finger showing rows of granules. 1 0–1 2. Trichobothrial pattern. 1 0 Chela dorso-external aspect. 1 1 . Patel la, dorsal aspect. 1 2. Femur, dorsal aspect. 1 3. Metasomal segment V and telson, lateral aspect.
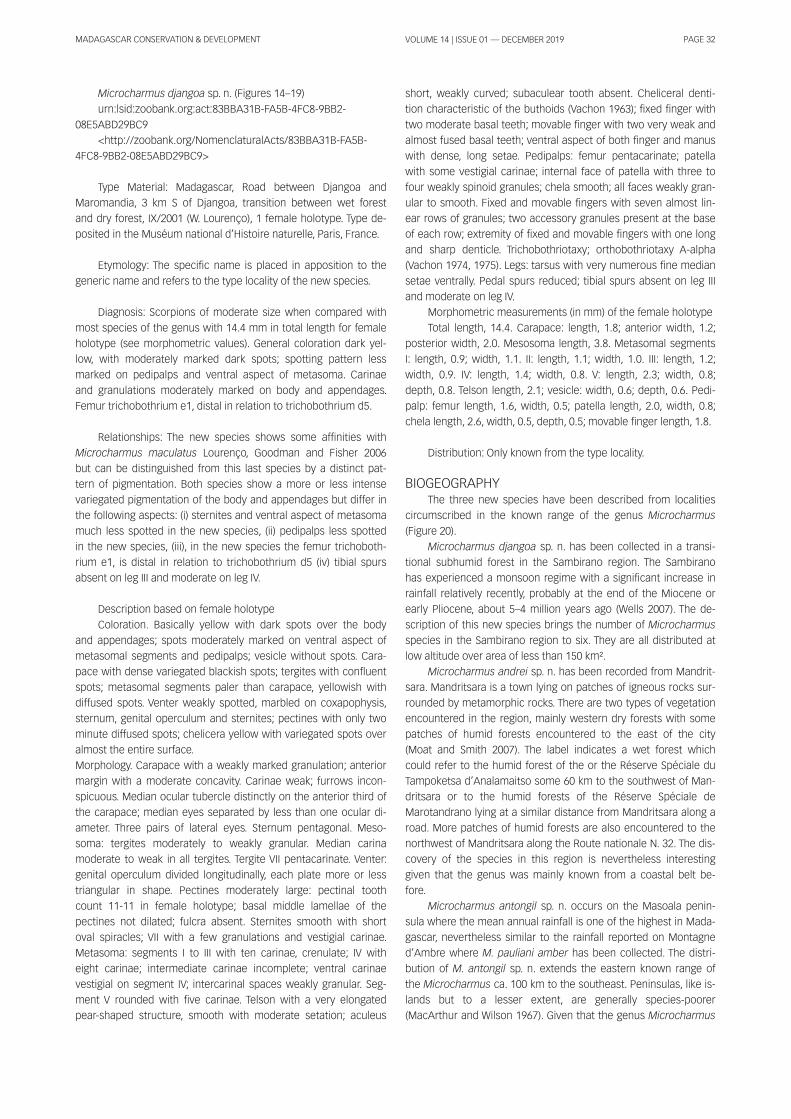
MADAGASCAR CONSERVATION & DEVELOPMENT PAGE 32VOLUME 1 4 | ISSUE 01 — DECEMBER 201 9
Microcharmus djangoa sp. n. (Figures 1 4–1 9)
urn: lsid:zoobank.org:act:83BBA31 B-FA5B-4FC8-9BB2-
08E5ABD29BC9
<http://zoobank.org/NomenclaturalActs/83BBA31 B-FA5B-
4FC8-9BB2-08E5ABD29BC9>
Type Material : Madagascar, Road between Djangoa and
Maromandia, 3 km S of Djangoa, transition between wet forest
and dry forest, IX/2001 (W. Lourenço), 1 female holotype. Type de-
posited in the Muséum national d’Histoire naturel le, Paris, France.
Etymology: The specific name is placed in apposition to the
generic name and refers to the type local i ty of the new species.
Diagnosis: Scorpions of moderate size when compared with
most species of the genus with 1 4.4 mm in total length for female
holotype (see morphometric values). General coloration dark yel-
low, with moderately marked dark spots; spotting pattern less
marked on pedipalps and ventral aspect of metasoma. Carinae
and granulations moderately marked on body and appendages.
Femur trichobothrium e1 , distal in relation to trichobothrium d5.
Relationships: The new species shows some affin ities with
Microcharmus maculatus Lourenço, Goodman and Fisher 2006
but can be distinguished from this last species by a distinct pat-
tern of pigmentation. Both species show a more or less intense
variegated pigmentation of the body and appendages but differ in
the fol lowing aspects: (i ) sternites and ventral aspect of metasoma
much less spotted in the new species, (i i ) pedipalps less spotted
in the new species, (i i i ), in the new species the femur trichoboth-
rium e1 , is distal in relation to trichobothrium d5 (iv) tibial spurs
absent on leg I I I and moderate on leg IV.
Description based on female holotype
Coloration. Basical ly yel low with dark spots over the body
and appendages; spots moderately marked on ventral aspect of
metasomal segments and pedipalps; vesicle without spots. Cara-
pace with dense variegated blackish spots; tergites with confluent
spots; metasomal segments paler than carapace, yel lowish with
diffused spots. Venter weakly spotted, marbled on coxapophysis,
sternum, genital operculum and sternites; pectines with only two
minute diffused spots; chel icera yel low with variegated spots over
almost the entire surface.
Morphology. Carapace with a weakly marked granulation; anterior
margin with a moderate concavity. Carinae weak; furrows incon-
spicuous. Median ocular tubercle distinctly on the anterior third of
the carapace; median eyes separated by less than one ocular di-
ameter. Three pairs of lateral eyes. Sternum pentagonal . Meso-
soma: tergites moderately to weakly granular. Median carina
moderate to weak in al l tergites. Tergite VI I pentacarinate. Venter:
genital operculum divided longitudinal ly, each plate more or less
triangular in shape. Pectines moderately large: pectinal tooth
count 1 1 -1 1 in female holotype; basal middle lamel lae of the
pectines not di lated; fulcra absent. Sternites smooth with short
oval spiracles; VI I with a few granulations and vestigial carinae.
Metasoma: segments I to I I I with ten carinae, crenulate; IV with
eight carinae; intermediate carinae incomplete; ventral carinae
vestigial on segment IV; intercarinal spaces weakly granular. Seg-
ment V rounded with five carinae. Telson with a very elongated
pear-shaped structure, smooth with moderate setation; aculeus
short, weakly curved; subaculear tooth absent. Chel iceral denti-
tion characteristic of the buthoids (Vachon 1 963); fixed finger with
two moderate basal teeth; movable finger with two very weak and
almost fused basal teeth; ventral aspect of both finger and manus
with dense, long setae. Pedipalps: femur pentacarinate; patel la
with some vestigial carinae; internal face of patel la with three to
four weakly spinoid granules; chela smooth; al l faces weakly gran-
ular to smooth. Fixed and movable fingers with seven almost l in-
ear rows of granules; two accessory granules present at the base
of each row; extremity of fixed and movable fingers with one long
and sharp denticle. Trichobothriotaxy; orthobothriotaxy A-alpha
(Vachon 1 974, 1 975). Legs: tarsus with very numerous fine median
setae ventral ly. Pedal spurs reduced; tibial spurs absent on leg I I I
and moderate on leg IV.
Morphometric measurements (in mm) of the female holotype
Total length, 1 4.4. Carapace: length, 1 .8; anterior width, 1 .2;
posterior width, 2.0. Mesosoma length, 3.8. Metasomal segments
I : length, 0.9; width, 1 . 1 . I I : length, 1 . 1 ; width, 1 .0. I I I : length, 1 .2;
width, 0.9. IV: length, 1 .4; width, 0.8. V: length, 2.3; width, 0.8;
depth, 0.8. Telson length, 2.1 ; vesicle: width, 0.6; depth, 0.6. Pedi-
palp: femur length, 1 .6, width, 0.5; patel la length, 2.0, width, 0.8;
chela length, 2.6, width, 0.5, depth, 0.5; movable finger length, 1 .8.
Distribution: Only known from the type local i ty.
BIOGEOGRAPHYThe three new species have been described from local i ties
circumscribed in the known range of the genus Microcharmus
(Figure 20).
Microcharmus djangoa sp. n. has been col lected in a transi-
tional subhumid forest in the Sambirano region. The Sambirano
has experienced a monsoon regime with a significant increase in
rainfal l relatively recently, probably at the end of the Miocene or
early Pl iocene, about 5–4 mi l l ion years ago (Wel ls 2007). The de-
scription of this new species brings the number of Microcharmus
species in the Sambirano region to six. They are al l d istributed at
low alti tude over area of less than 1 50 km².
Microcharmus andrei sp. n. has been recorded from Mandrit-
sara. Mandritsara is a town lying on patches of igneous rocks sur-
rounded by metamorphic rocks. There are two types of vegetation
encountered in the region, mainly western dry forests with some
patches of humid forests encountered to the east of the city
(Moat and Smith 2007). The label indicates a wet forest which
could refer to the humid forest of the or the Réserve Spéciale du
Tampoketsa d’Analamaitso some 60 km to the southwest of Man-
dritsara or to the humid forests of the Réserve Spéciale de
Marotandrano lying at a simi lar distance from Mandritsara along a
road. More patches of humid forests are also encountered to the
northwest of Mandritsara along the Route nationale N. 32. The dis-
covery of the species in this region is nevertheless interesting
given that the genus was mainly known from a coastal belt be-
fore.
Microcharmus antongil sp. n. occurs on the Masoala penin-
sula where the mean annual rainfal l is one of the highest in Mada-
gascar, nevertheless simi lar to the rainfal l reported on Montagne
d’Ambre where M. pauliani amber has been col lected. The distri-
bution of M. antongil sp. n. extends the eastern known range of
the Microcharmus ca. 1 00 km to the southeast. Peninsulas, l ike is-
lands but to a lesser extent, are general ly species-poorer
(MacArthur and Wilson 1 967). Given that the genus Microcharmus
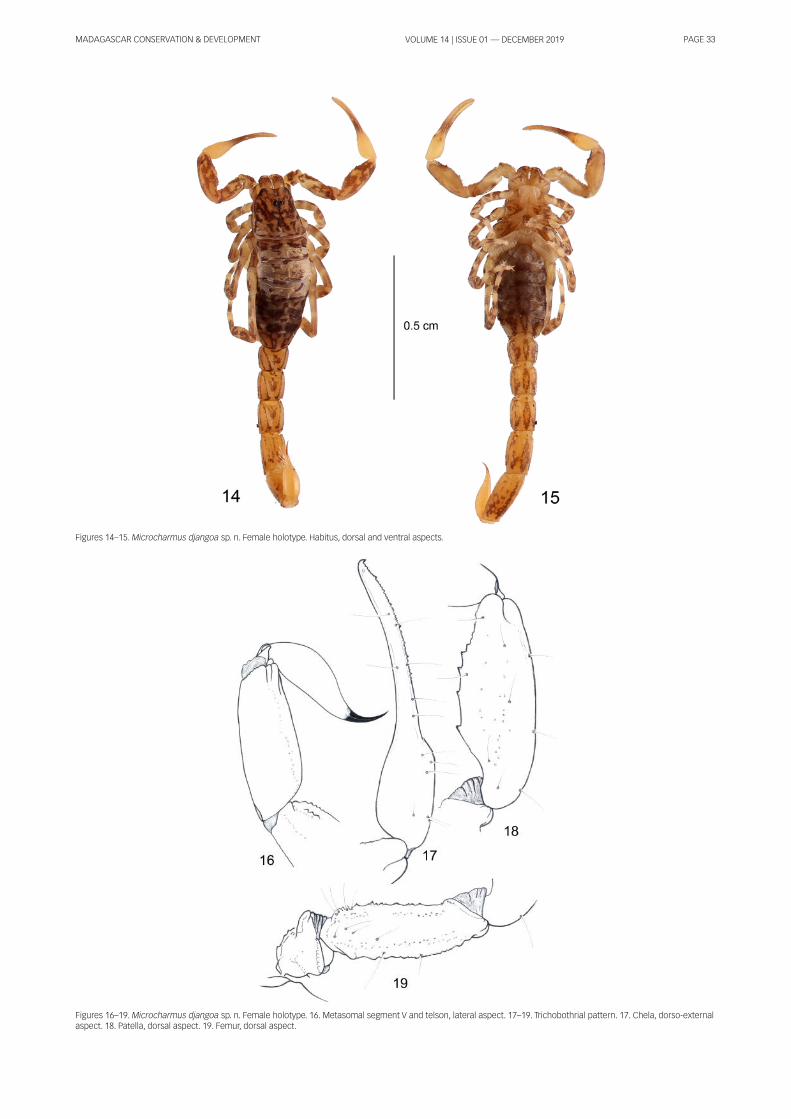
MADAGASCAR CONSERVATION & DEVELOPMENT PAGE 33VOLUME 1 4 | ISSUE 01 — DECEMBER 201 9
Figures 1 6–1 9. Microcharmus djangoa sp. n. Female holotype. 1 6. Metasomal segment V and telson, lateral aspect. 1 7–1 9. Trichobothrial pattern. 1 7. Chela, dorso-externalaspect. 1 8. Patel la, dorsal aspect. 1 9. Femur, dorsal aspect.
Figures 1 4–1 5. Microcharmus djangoa sp. n. Female holotype. Habitus, dorsal and ventral aspects.
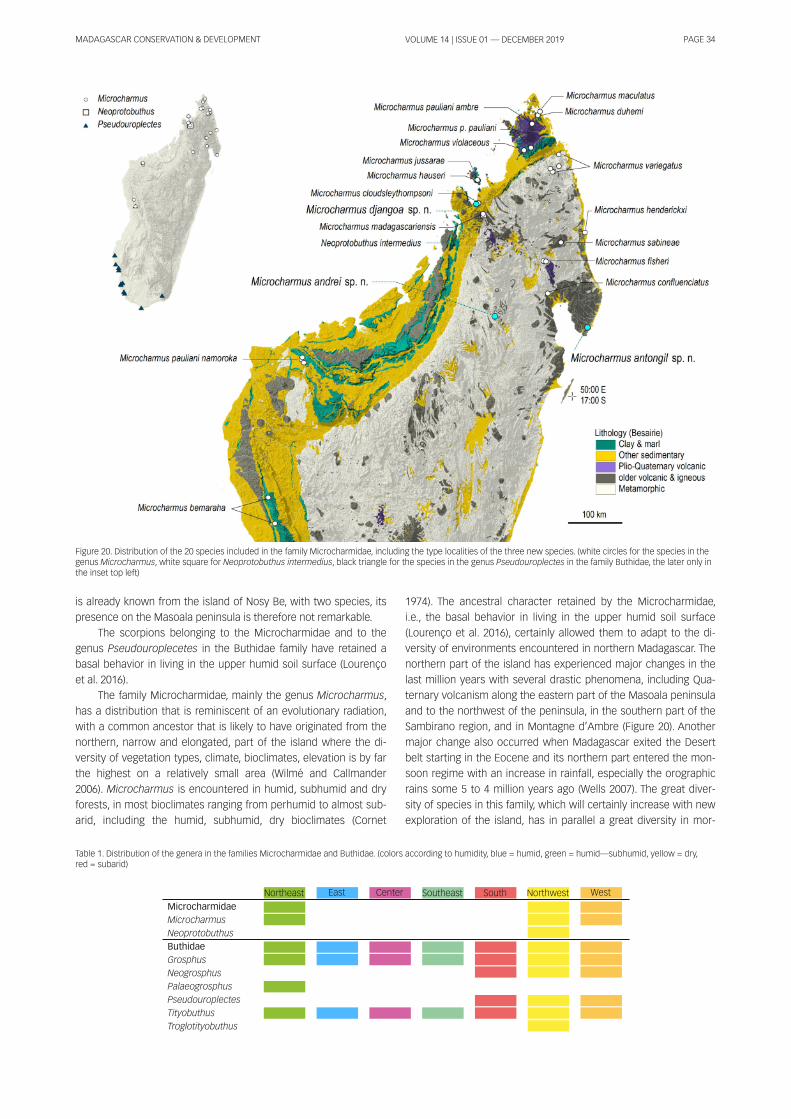
MADAGASCAR CONSERVATION & DEVELOPMENT PAGE 34VOLUME 1 4 | ISSUE 01 — DECEMBER 201 9
is already known from the island of Nosy Be, with two species, i ts
presence on the Masoala peninsula is therefore not remarkable.
The scorpions belonging to the Microcharmidae and to the
genus Pseudouroplecetes in the Buthidae fami ly have retained a
basal behavior in l iving in the upper humid soi l surface (Lourenço
et al . 201 6).
The fami ly Microcharmidae, mainly the genus Microcharmus,
has a distribution that is reminiscent of an evolutionary radiation,
with a common ancestor that is l ikely to have originated from the
northern, narrow and elongated, part of the island where the di-
versity of vegetation types, cl imate, biocl imates, elevation is by far
the highest on a relatively smal l area (Wi lmé and Cal lmander
2006). Microcharmus is encountered in humid, subhumid and dry
forests, in most biocl imates ranging from perhumid to almost sub-
arid, including the humid, subhumid, dry biocl imates (Cornet
1 974). The ancestral character retained by the Microcharmidae,
i .e. , the basal behavior in l iving in the upper humid soi l surface
(Lourenço et al . 201 6), certain ly al lowed them to adapt to the di-
versity of environments encountered in northern Madagascar. The
northern part of the island has experienced major changes in the
last mi l l ion years with several drastic phenomena, including Qua-
ternary volcanism along the eastern part of the Masoala peninsula
and to the northwest of the peninsula, in the southern part of the
Sambirano region, and in Montagne d’Ambre (Figure 20). Another
major change also occurred when Madagascar exited the Desert
belt starting in the Eocene and its northern part entered the mon-
soon regime with an increase in rainfal l , especial ly the orographic
rains some 5 to 4 mi l l ion years ago (Wel ls 2007). The great diver-
sity of species in this fami ly, which wi l l certain ly increase with new
exploration of the island, has in paral lel a great diversity in mor-
Figure 20. Distribution of the 20 species included in the fami ly Microcharmidae, including the type local i ties of the three new species. (white circles for the species in thegenus Microcharmus, white square for Neoprotobuthus intermedius, black triangle for the species in the genus Pseudouroplectes in the fami ly Buthidae, the later only inthe inset top left)
Microcharmidae
Microcharmus
Neoprotobuthus
Buthidae
Grosphus
Neogrosphus
Palaeogrosphus
Pseudouroplectes
Tityobuthus
Troglotityobuthus
Northeast East Center Southeast South Northwest West
Table 1 . Distribution of the genera in the fami l ies Microcharmidae and Buthidae. (colors according to humidity, blue = humid, green = humid—subhumid, yel low = dry,red = subarid)
MADAGASCAR CONSERVATION & DEVELOPMENT PAGE 35VOLUME 1 4 | ISSUE 01 — DECEMBER 201 9
phology and ecology, also pointing towards a radiation. The range
of the fami ly Microcharmidae is l imited to the north and to a
lesser extent to the west of the island. I t is much more restricted
than the range of the closely related fami ly Buthidae (Table 1 ).
The evolutionary radiation of the Microcharmidae in the
north of the island is reminiscent of another group that could i l lus-
trate a simi lar case: the Propithecus for which the distribution pat-
tern in the north is poorly explained (Wi lmé and Cal lmander 2006,
Wi lmé et al . 2006, 201 2, Waeber et al . 201 5). In view of the pattern
described for the Microcharmidae, one could nevertheless pro-
pose an ancestor of the smal lest of the Propithecus, namely the
western and southern species/subspecies Propithecus verreauxi
sspp. in the north of the island. The events mentioned above over
the past few mil l ion years could explain a population adaptation in
the dry forests of the north-east (Propithecus tattersalli), l imited to
the north and south by the largest Propithecus perrieri and Prop-
ithecus diadema . In this scheme, a population could have adapted
to the dry forests of the north-west (Propithecus coquereli) which
could have disappeared from the Sambirano region or the entire
northwest fol lowing a cataclysm, l ike the Quaternary volcanic ac-
tivity. As in the case of the evolutionary radiation proposed for the
Microcharmidae, with ancestral populations diversifying rapidly
into several new forms after major changes in the environment
and the opening of new niches, i t is a hypothesis to test.
ACKNOWLEDGEMENTSWe are most grateful to El ise-Anne Leguin (Muséum, Paris) for
preparing the photos and several plates.
REFERENCESCornet, A. 1 974. Essai de Cartographie Biocl imatique à Madagascar Vol . 55.
ORSTOM, Paris. Avai lable at
<http://www.documentation. ird. fr/hor/fdi :06946>
Hjel le, J. T. 1 990. Anatomy and morphology. In: The Biology of Scorpions, G. A. Pol is
(ed. ), pp 9–63. Stanford University Press, Stanford.
Lamoral , B. H. 1 976. Akentrobuthus leleupi, a new genus and species of humi-
colous scorpion from eastern Zaïre, representing a new subfami ly of the
Buthidae. Annals of the Natal Museum 22, 3: 681 –691 . Avai lable at
<https://journals.co.za/content/annals/22/3/AJA03040798_61 4>
Lamoral , B. H. 1 979. The scorpions of Namibia (Arachnida: Scorpionida). Annals of
the Natal Museum 23: 497–784. Avai lable at
<http://www.ub.ntnu.no/scorpion-fi les/lamoral_complete.pdf>
Lourenço, W. R. 1 982. Révision du genre Ananteris Thorel l , 1 891 (Scorpiones,
Buthidae) et description de six espèces nouvel les. Bul letin du Muséum na-
tional d’Histoire naturel le, Paris, 4e série 4, section A (1 –2): 1 1 9–1 51 . Avai l -
able at
<https://www.biodiversityl ibrary.org/item/267975#page/1 /mode/1 up>
Lourenço, W. R. 1 983. Importance de la pigmentation dans l ’étude taxonomique
des Buthidae néotropicaux (Arachnida, Scorpiones). Bul letin du Muséum
national d’Histoire naturel le, Paris, 4e série 5, section A, 2: 61 1 –61 8. Avai l -
able at
<https://www.biodiversityl ibrary.org/item/268279#page/1 /mode/1 up>
Lourenço, W. R. 1 995. Description de trois nouveaux genres et de quatre nouvel les
espèces de scorpions Buthidae de Madagascar. Bul letin du Muséum na-
tional d’Histoire naturel le, Paris, 4e série, section A 1 7, 1 –2: 95–1 06. Avai l -
able at <http://bionames.org/bionames-archive/issn/01 81 -0626/1 7/95.pdf>
Lourenço, W. R. 1 996a. Chel icerata, Scorpions. Faune de Madagascar 87. Muséum
national d’Histoire naturel le, Paris.
Lourenço, W. R. 1 996b. Microcharmus hauseri, nouvel le espèce de scorpion de
Madagascar (Scorpiones, Buthidae). Revue Suisse de Zoologie 1 03, 2:
31 9–322. Avai lable at
<https://www.biodiversityl ibrary.org/page/41 267885#page/347/mode/1 up>
Lourenço, W. R. 1 998. Une nouvel le fami l le est nécessaire pour des microscorpi-
ons humicoles de Madagascar et d’Afrique. Comptes Rendus de
l ’Académie des Sciences, Sciences de la Vie 321 , 1 0: 845–848.
<https://doi .org/1 0.1 01 6/S0764-4469(99)80024-9>
Lourenço, W. R. 2000. Un nouveau genre de scorpion malgache, mai l lon possible
entre les Microcharmidae et les Buthidae. Comptes Rendus de l ’Académie
des Sciences, Paris, Sciences de la Vie 323, 1 0: 877–881 .
<https://doi .org/1 0.1 01 6/S0764-4469(00)01 234-8>
Lourenço, W. R. 2002a. Nouvel les données sur la morphologie et la biogéographie
des Microcharmus Lourenço avec confirmation de la val id ité des Mi-
crocharmidae (Chel icerata, Scorpiones). Biogeographica 78, 1 : 35–47.
Lourenço, W. R. 2002b. Reproduction in scorpions, with special reference to
parthenogenesis. In : European Arachnology 2000. S. Toft and N. Scharff
(eds. ), pp 71 –85. Aarhus University Press, Aarhus. Avai lable at
<https://bit. ly/2Yl53kS>
Lourenço, W. R. 2003. Humicolous buthoid scorpions; a new genus and species
from French Guiana. Comptes Rendus Biologies 326, 1 2: 1 1 49–1 1 55.
<https://doi .org/1 0.1 01 6/j .crvi .2003.09.003>
Lourenço, W. R. 2004. Humicolous microcharmid scorpions: a new genus and
species from Madagascar. Comptes Rendus Biologies 327, 1 : 77–83.
<https://doi .org/1 0.1 01 6/j .crvi .2003.1 2.003>
Lourenço, W. R. 2005. Humicolous buthoid scorpions; a new species from Brazi l ian
Amazon. Comptes Rendus Biologies 328, 1 0–1 1 : 949–954.
<https://doi .org/1 0.1 01 6/j .crvi .2005.08.004>
Lourenço, W. R. 2009. A new sub-fossi l scorpion of the genus Microcharmus
Lourenço, 1 995 from Malagasy copal (Scorpiones, Microcharmidae). Boletín
de la Sociedad Entomológica Aragonesa 44: 1 35–1 37. Avai lable at
<http://sea-entomologia.org/PDF/BSEA44ARACNO/B441 35.pdf>
Lourenço, W. R. and Cloudsley-Thompson, J. L. 1 996. The evolutionary significance
of colour, colour patterns and fluorescence in scorpions. Revue Suisse de
Zoologie, hors série 2: 449–458. Avai lable at
<http://biostor.org/reference/1 40435>
Lourenço, W. R. , Goodman, S. M. and Fisher, B. L. 2006. A reappraisal of the geo-
graphical d istribution of the endemic fami ly Microcharmidae Lourenço
(Scorpiones) in Madagascar and description of eight new species and sub-
species. Proceedings of the Cal ifornia Academy of Sciences, 4th Ser. , 57, 26:
751 –783. Permal ink <http://direct.biostor.org/reference/1 44003>
Lourenço, W. R. , Wi lmé, L. and Waeber, P. O. 201 6. More about the geographical
pattern of distribution of the genus Pseudouroplectes Lourenço, 1 995
(Scorpiones: Buthidae) from Madagascar. Comptes Rendus Biologies 339, 1 :
37–43. <https://doi .org/1 0.1 01 6/j .crvi .201 5.1 1 .001 >
MacArthur, R. H. and Wi lson, E. O. 1 967. The Theory of Island Biogeography.
Princeton University Press.
Moat, J. and Smith, P. (eds. ) 2007. Atlas of the Vegetation of Madagascar. Atlas de
la Végétation de Madagascar. Kew Publ ishing, Royal Botanic Gardens, Kew,
Richmond, UK.
Prendini , L. , Volschenk, E. , Maal iki , S. and Gromov, A. V. 2006. A ‘l iving fossi l ’ from
Central Asia: The morphology of Pseudochactas ovchinnikovi Gromov, 1 998
(Scorpiones: Pseudochactidae), with comments on its phylogenetic posi-
tion. Zoologischer Anzeiger 245, 3–4: 21 1 –248.
<https://doi .org/1 0.1 01 6/j . jcz.2006.07.001 >
Rossi , A. and Lourenço, W. R. 201 5. New comments on the scorpions belonging to
the ‘Ananteris group’ and description of a new genus and species from
Ghana (Scorpiones: Buthidae). Onychium 1 1 : 3–9. Avai lable at
<https://bit. ly/2GqD3Sz>
Stahnke, H. L. 1 970. Scorpion nomenclature and mensuration. Entomological
News 81 : 297–31 6.
Stockwel l , S. A. 1 989. Revision of the Phylogeny and Higher Classification of Scor-
pions (Chel icerata). Ph.D. Dissertation, University of Cal i fornia, Berkeley.
Vachon, M. 1 952. Études sur les Scorpions. Institut Pasteur d’Algérie, Alger. Avai l -
able at <https://www.ntnu.no/ub/scorpion-fi les/vachon.php>
Vachon, M. 1 963. De l ’uti l i té, en systématique, d’une nomenclature des dents des
chél icères chez les scorpions. Bul letin du Muséum national d’Histoire na-
turel le, 2e série, 35: 1 61 –1 66. Avai lable at
<https://www.biodiversityl ibrary.org/page/5505451 9#page/1 67/mode/1 up>
MADAGASCAR CONSERVATION & DEVELOPMENT PAGE 36VOLUME 1 4 | ISSUE 01 — DECEMBER 201 9
Vachon, M. 1 974. Étude des caractères uti l isés pour classer les fami l les et les
genres de Scorpions (Arachnides). 1 . La trichobothriotaxie en arachnologie.
Sigles trichobothriaux et types de trichobothriotaxie chez les Scorpions.
Bul letin du Muséum national d’Histoire naturel le, Paris, Paris, 3e série, 1 40,
Zoologie 1 04: 857–958. Avai lable at
<http://bionames.org/bionames-archive/issn/0300-9386/1 04/858.pdf>
Vachon, M. 1 975. Sur l ’uti l isation de la trichobothriotaxie du bras des pédipalpes
des Scorpions (Arachnides) dans le classement des genres de la fami l le des
Buthidae Simon. Comptes Rendus de l ’Académie des Sciences, Paris, Sci-
ences de la Vie 281 : 1 597–1 599.
Volschenk, E. S. , Mattoni , C. I . and Prendini , L. 2008. Comparative anatomy of the
mesosomal organs of scorpions (Chel icerata, Scorpiones), with impl ications
for the phylogeny of the order. Zoological Journal of the Linnean Society
1 54, 4: 651 –675. <https://doi .org/1 0.1 1 1 1 /j . 1 096-3642.2008.00426.x>
Waeber, P. O. , Wi lmé, L. , Ramamonj isoa, B. , Garcia, C. , Rakotomalala, D. , et al . 201 5.
Dry forests in Madagascar, neglected and under pressure. International
Forestry Review 1 7, S2: 1 27–1 48.
<https://doi .org/1 0.1 505/1 4655481 581 5834822>
Wel ls, N. A. 2007. Approches paléoenvironnementales du Mésozoïque et du
Cénozoïque. In: Paysages Naturels et Biodiversité de Madagascar. S. M.
Goodman (ed. ), pp 23–56, 89–94. Muséum national d’Histoire naturel le,
Paris.
Wi lmé, L. & Cal lmander, M. W. 2006. Les populations rel iques de primates: les Pro-
pithèques. Lemur News 1 1 : 24–31 . Avai lable at <https://bit. ly/30Sl1 QY>
Wilmé, L. , Goodman, S. M. and Ganzhorn, J. U. 2006. Biogeographic evolution of
Madagascar's microendemic biota. Science 31 2: 1 063–1 065.
<https://doi .org/1 0.1 1 26/science.1 1 22806>
Wilmé, L. , Ravokatra, M. , Dolch, R. , Schuurman, D. , Mathieu, E. , Schuetz, H. and
Waeber, P. O. 201 2. Toponyms for centers of endemism in Madagascar.
Madagascar Conservation & Development 7, 1 : 30–40.
<https://doi .org/1 0.431 4/mcd.v7i1 .6>
MADAGASCAR CONSERVATION & DEVELOPMENT PAGE 37VOLUME 1 4 | ISSUE 01 — DECEMBER 201 9
ABSTRACTConservation officials work to manage complex and interacting
human-environmental systems, where balancing needs between
the two systems can become a source of tension. This study
presents information on the use of natural resources by, and the
health and welfare of, rural communities within and near
Ankarafantsika National Park (ANP) in northwestern Madagascar.
We focus on behaviors that are difficult for natural resource man-
agers to measure themselves, including the hunting of threatened
and protected wi ld l i fe and on sensitive information about human
wealth, health, and food security. We surveyed 41 9 households
and measured the health of 1 860 individuals in 1 8 communities
adjacent to or within the boundaries of ANP. We found a very high
prevalence of chi ld malnutrition, i l lness, and food insecurity and a
heavy rel iance on natural products to meet subsistence needs.
More than 90% of the population reported that they hunted
wi ld l i fe and harvested wi ld vegetables at least one day during the
prior week as a direct means to cope with their food insecurity.
Further, we found a high rel iance on the forest for both health
care and the bui ld ing of adequate shelter. Efforts to improve over-
al l food security would l ikely improve both human welfare and the
long-term conservation of the threatened wi ld l i fe and habitat of
Ankarafantsika. These data can help both conservation and com-
munity l ivel ihood programs to find integrated solutions to the
shared chal lenges of improving the wel l -being of human popula-
tions and the protection of Madagascar’s unique, endemic, and
highly threatened biodiversity.
RÉSUMÉLes gestionnaires œuvrant pour la protection de la nature sont
généralement confrontés à des systèmes socio-écologiques com-
plexes et interactifs dans lesquels la recherche de l ’équi l ibre entre
les besoins de ces deux systèmes peut s’avérer être une source
de tension. Cette étude présente des informations sur l 'uti l isation
des ressources naturel les par les communautés rurales riveraines
du parc national d'Ankarafantsika (PNA) dans le nord-ouest de
Madagascar, ainsi que sur la santé et le bien-être de ces commu-
nautés. L’étude s’est en particul ier orientée sur les comporte-
ments diffici les à mesurer pour les gestionnaires de ressources
naturel les, à savoir la chasse d'animaux sauvages menacés et
protégés et les informations portant sur l ’opulence, la santé et la
sécurité al imentaire des gens. Une enquête a été réal isée auprès
de 41 9 ménages et l ’état de santé de 1 860 personnes a été
mesuré dans 1 8 communautés vivant à la périphérie ou à l ’ in-
térieur des l imites du PNA. Une très forte prévalence de la malnu-
trition infanti le a été observée ainsi que diverses pathologies, une
insécurité al imentaire et une dépendance importante à l 'égard
des produits naturels pour répondre aux besoins de subsistance.
Plus de 90% de la population a déclaré qu'el le avait chassé des
animaux et récolté des plantes sauvages au moins un jour au
cours de la semaine précédente, à titre de moyen direct pour faire
face à l ' insécurité al imentaire. Une forte dépendance à l 'égard des
forêts a également été notée pour les produits destinés à la santé
et la construction de maisons. Les efforts visant à amél iorer la
sécurité al imentaire dans son ensemble pourraient vraisemblable-
ment amél iorer le bien-être humain aussi bien que la conserva-
tion à long terme de la faune et des habitats menacés de
l 'Ankarafantsika. Ces données peuvent aider les programmes de
conservation et de subsistance de la communauté à trouver des
solutions intégrées aux problèmes communs de l ’amél ioration du
bien-être des populations humaines et de la protection de la bio-
diversité unique, endémique et hautement menacée de Madagas-
car.
ARTICLE http://dx.doi .org/1 0.431 4/mcd.v1 4i1 .7
Wildl i fe hunting in complex human-environmentalsystems: How understanding natural resource useand human welfare can improve conservation in theAnkarafantsika National Park, Madagascar
Cortni BorgersonI, I I , I I I , Jean F. RandrianasoloI I I , Toky R.AndrainaI I I , Evel in J. G. AnjaranirinaI I I , Hervet J.RandriamadyII I , Samuel MersonIV, Luke Dol larV,VI,Christopher D. GoldenI I , I I I
Correspondence:
Cortni Borgerson
Montclair State University, Department of Anthropology,
1 Normal Ave, Montclair, NJ 07043, USA
Emai l : [email protected]
Citation Borgerson, C. , Randrianasolo, J. F. , Andraina, T. R. , Anjaranirina, E. J. G. , Randriamady, H. J. , Merson, S. , Dol lar, L. , Golden, C. D. 201 9. Wi ld l i fe hunting in complexhuman-environmental systems: How understanding natural resource use and human welfare can improve conservation in the Ankarafantsika National Park,Madagascar. Madagascar Conservation & Development 1 4, 1 : 37–45. http://dx.doi .org/1 0.431 4/mcd.v1 4i1 .7
I Montclair State University, Department of Anthropology, 1 Normal Ave, Montclair, NJ 07043, USAI I Harvard T.H. Chan School of Publ ic Health, Department of Environmental Health, 401 Park Drive, Boston, MA 021 1 5, USAI I I MAHERY (Madagascar Health and Environmental Research), Maroantsetra 51 2, MadagascarIV Zoological Society of London, Conservation Programmes, Outer Circle, Regents Park, London, NW1 4RY, UKV Department of Environment & Sustainabi l i ty, Center for the Environment, Catawba Col lege, 2300 W Innes St Sal isbury, NC 281 44, USAVI Nicholas School of the Environment, Duke University, Durham, NC 27708 USAVI Nicholas School of the Environment, Duke University, Durham, NC 27708 USA

MADAGASCAR CONSERVATION & DEVELOPMENT PAGE 38VOLUME 1 4 | ISSUE 01 — DECEMBER 201 9
INTRODUCTIONNational parks are often located in regions of both high biodi-
versity and high poverty (Barrett et al . 201 1 , Ngonghala et al .
201 6). An unsustainable rel iance on these resources can lead to
the col lapse of both the natural environment and human condi-
tion (Dasgupta and Maler 2004, Barrett et al . 201 1 ). I f approached
appropriately, the local communities near national parks are
therefore natural al l ies in resource protection. Likewise, improving
human wel l -being is an integral part of many conservation pro-
grams (Andam et al . 2001 , Ferrarro et al . 201 1 , Naughton-Treves et
al . 201 1 ). Growing human populations face strong incentives to
use natural resources within parks to meet their subsistence
needs (Wi lkie et al . 201 6, Reuter et al . 201 7, Poudyal et al . 201 8).
Yet, we often lack rigorous quantitative data on natural resource
use or human wel l -being surrounding national parks. Without this
information, i t is difficult to effectively manage protected areas,
implement conservation and l ivel ihoods programs, or to quantify
the impact of these activities (Gardner et al . 201 3).
Madagascar is a conservation priority because of its high bio-
diversity, high levels of endemism and threat faced by the species
(Myers et al . 2000). Order-, fami ly-, and genus-level endemism oc-
curs in Madagascar’s terrestrial mammal species, amphibians,
repti les, birds, insects, and of plants (Vences et al . 2009, Wi lmé et
al . 201 2). One-quarter of the world’s primates are found only in
Madagascar, second only to Brazi l in global primate diversity
(Estrada et al . 201 8). This incredible diversity is threatened by both
unsustainable hunting and habitat loss (Harper et al . 2007, Rako-
tomanana et al . 201 3, Brook et al . 201 8). Ninety-three percent of
primate species in Madagascar are threatened with extinction, a
percentage of threat higher than that of any other keystone coun-
try for primate diversity (Estrada et al . 201 8). The long-term viabi l -
i ty of much of Madagascar’s flora and fauna wi l l depend upon the
effectiveness of Madagascar’s protected area network.
The dry forests of western Madagascar may be one of the
nation’s most threatened biomes (Waeber et al . 201 5). Local peo-
ple depend on this ecosystem for their l ivel ihoods. Complex inter-
actions of landscape-use and cl imate change have significantly
reduced the size and integrity of these fragi le, understudied and
biodiverse habitats (Zinner et al . 201 4, Waeber et al . 201 5). With an
area of 1 35,000 ha, Ankarafantsika National Park (ANP) is one of
Madagascar’s largest contiguous dry deciduous forests. The park
was created to ensure the long-term protection of the unique dry
deciduous forest ecosystem in northwestern Madagascar (Andria-
mampianina and Peyrieras 1 972), and is home to a variety of nar-
row-ranged species of flora and fauna. I t contains one important
watershed for the nearby agricultural center of Marovoay, one of
Madagascar’s largest rice production areas (World Bank 201 5). The
park is immediately surrounded by a human population of over
1 07,000 people across 1 33 vi l lages, some of which legal ly are
within its boundaries along a major highway which bisects the
park (Madagascar National Parks 201 8). Given its ecological im-
portance and its complex human-ecological interactions, under-
standing natural resource use is important for effective
management.
This study presents information on the use of natural re-
sources by, and the health and welfare of, communities near and
within ANP. We particularly focus on the behaviors that are impor-
tant for natural resource managers to understand, but are difficult
for managers to measure themselves because of the participants’
fear of recrimination and prosecution. This includes data on hunt-
ing threatened and protected wi ld l i fe and sensitive information on
human wealth, health, and food security. These data can help both
conservation and community l ivel ihood programs to find inte-
grated solutions to the shared chal lenges of improving the wel l -
being of human populations and the protection of Madagascar’s
unique, endemic, and highly threatened biodiversity.
METHODSSTUDY SITE. The Boeny region of northwestern Madagascar is
home to Ankarafantsika National Park. The principal ethnol in-
guistic groups are Sakalava and Betsi leo (al though ethnic diversity
is high) and the primary economic activity of local people is sub-
sistence agriculture. The region is 1 1 0 km south of the city of Ma-
hajanga, a district home to >250,000 people (INSTAT 201 3).
Ankarafantsika was original ly classified as a Réserve Naturel le In-
tégrale in 1 927, with the adjacent Ampi joroa Forestry Reserve to
its West. These two parcels were combined to create the
Ankarafantsika National Park (IUCN Category I I ) in 2002.
Ankarafantsika National Park protects 1 ,350 km2 of dry deciduous
forest and wooded grassland habitats and is bisected by the ma-
jor highway (RN4) connecting Antananarivo to the port town Ma-
hajanga.
SURVEY PROTOCOLS. Between November 201 4 and Apri l
201 5 JFR and TRA surveyed 41 9 households, including 1 860
individuals, in 1 8 communities in Ankarafantsika (1 5–30 house-
holds per vi l lage). Al l surveys were conducted in the native dialect
of Malagasy spoken within each vi l lage. We consulted with the lo-
cal community leaders and then held a local community meeting
to discuss the goals of the project before beginning household in-
terviews in each community. During community meetings, we de-
scribed the research as an effort to understand the ways in which
natural resource use and agricultural activities contributed to hu-
man food security, health and general wel l -being.
We selected households by one of two methods: (1 ) i f a
household census existed at the community level , then the local
research team selected every third household to participate; or (2)
i f no household census existed in the community, then the re-
search team selected every third household that they passed in
the community. Each head of household consented verbal ly to
participate in the research survey. We interviewed either the male
or female head of each household to gather information on
household demographics, diet, food security, agricultural labor,
l ivestock raising and diseases, income generation, commercial
good ownership, food taste preferences, forest resource use, and
hunting behavior. Commercial goods included shoes, bicycles, ra-
dios, watches, flashl ights, and guns. In general , we asked intervie-
wees to recal l wi ld l i fe consumption events over the prior year as
this had been demonstrated to be successful with regard to previ-
ous wi ld l i fe harvest surveys (Golden et al . 201 3). We asked inter-
viewees to recal l information on their typical d iet over the prior
day and week. These foods were categorized based on their mi-
cronutrient-composition to determine dietary diversity and assign
a ‘Women’s’ Dietary Diversity Score (WDDS) (FAO 201 0). Food se-
curity was determined using the Coping Strategies Index (CSI )
(Maxwel l and Caldwel l 2008), a tool which asks household mem-
bers to report the number of days during the prior week they
used pre-defined coping strategies to deal with household food
insecurity. A weighted CSI was then determined by weighting the
local severity of each coping strategy (categorical weights) using
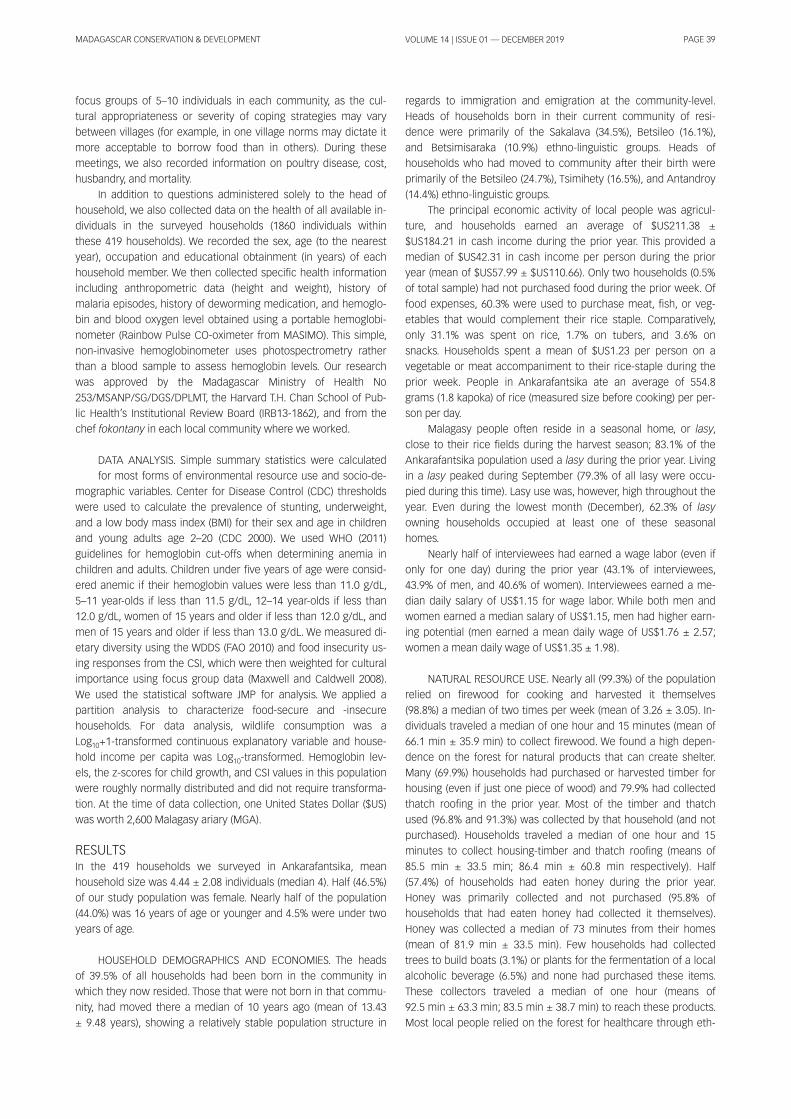
MADAGASCAR CONSERVATION & DEVELOPMENT PAGE 39VOLUME 1 4 | ISSUE 01 — DECEMBER 201 9
focus groups of 5–1 0 individuals in each community, as the cul-
tural appropriateness or severity of coping strategies may vary
between vi l lages (for example, in one vi l lage norms may dictate it
more acceptable to borrow food than in others). During these
meetings, we also recorded information on poultry disease, cost,
husbandry, and mortal i ty.
In addition to questions administered solely to the head of
household, we also col lected data on the health of al l avai lable in-
dividuals in the surveyed households (1 860 individuals within
these 41 9 households). We recorded the sex, age (to the nearest
year), occupation and educational obtainment (in years) of each
household member. We then col lected specific health information
including anthropometric data (height and weight), h istory of
malaria episodes, history of deworming medication, and hemoglo-
bin and blood oxygen level obtained using a portable hemoglobi-
nometer (Rainbow Pulse CO-oximeter from MASIMO). This simple,
non-invasive hemoglobinometer uses photospectrometry rather
than a blood sample to assess hemoglobin levels. Our research
was approved by the Madagascar Ministry of Health No
253/MSANP/SG/DGS/DPLMT, the Harvard T.H. Chan School of Pub-
l ic Health’s Institutional Review Board (IRB1 3-1 862), and from the
chef fokontany in each local community where we worked.
DATA ANALYSIS. Simple summary statistics were calculated
for most forms of environmental resource use and socio-de-
mographic variables. Center for Disease Control (CDC) thresholds
were used to calculate the prevalence of stunting, underweight,
and a low body mass index (BMI) for their sex and age in chi ldren
and young adults age 2–20 (CDC 2000). We used WHO (201 1 )
guidel ines for hemoglobin cut-offs when determining anemia in
chi ldren and adults. Chi ldren under five years of age were consid-
ered anemic if their hemoglobin values were less than 1 1 .0 g/dL,
5–1 1 year-olds if less than 1 1 .5 g/dL, 1 2–1 4 year-olds if less than
1 2.0 g/dL, women of 1 5 years and older if less than 1 2.0 g/dL, and
men of 1 5 years and older if less than 1 3.0 g/dL. We measured di-
etary diversity using the WDDS (FAO 201 0) and food insecurity us-
ing responses from the CSI , which were then weighted for cultural
importance using focus group data (Maxwel l and Caldwel l 2008).
We used the statistical software JMP for analysis. We appl ied a
partition analysis to characterize food-secure and -insecure
households. For data analysis, wi ld l i fe consumption was a
Log1 0+1 -transformed continuous explanatory variable and house-
hold income per capita was Log1 0-transformed. Hemoglobin lev-
els, the z-scores for chi ld growth, and CSI values in this population
were roughly normal ly distributed and did not require transforma-
tion. At the time of data col lection, one United States Dol lar ($US)
was worth 2,600 Malagasy ariary (MGA).
RESULTSIn the 41 9 households we surveyed in Ankarafantsika, mean
household size was 4.44 ± 2.08 individuals (median 4). Half (46.5%)
of our study population was female. Nearly half of the population
(44.0%) was 1 6 years of age or younger and 4.5% were under two
years of age.
HOUSEHOLD DEMOGRAPHICS AND ECONOMIES. The heads
of 39.5% of al l households had been born in the community in
which they now resided. Those that were not born in that commu-
nity, had moved there a median of 1 0 years ago (mean of 1 3.43
± 9.48 years), showing a relatively stable population structure in
regards to immigration and emigration at the community-level .
Heads of households born in their current community of resi-
dence were primari ly of the Sakalava (34.5%), Betsi leo (1 6.1 %),
and Betsimisaraka (1 0.9%) ethno-l inguistic groups. Heads of
households who had moved to community after their birth were
primari ly of the Betsi leo (24.7%), Tsimihety (1 6.5%), and Antandroy
(1 4.4%) ethno-l inguistic groups.
The principal economic activity of local people was agricul-
ture, and households earned an average of $US21 1 .38 ±
$US1 84.21 in cash income during the prior year. This provided a
median of $US42.31 in cash income per person during the prior
year (mean of $US57.99 ± $US1 1 0.66). Only two households (0.5%
of total sample) had not purchased food during the prior week. Of
food expenses, 60.3% were used to purchase meat, fish, or veg-
etables that would complement their rice staple. Comparatively,
only 31 .1 % was spent on rice, 1 .7% on tubers, and 3.6% on
snacks. Households spent a mean of $US1 .23 per person on a
vegetable or meat accompaniment to their rice-staple during the
prior week. People in Ankarafantsika ate an average of 554.8
grams (1 .8 kapoka) of rice (measured size before cooking) per per-
son per day.
Malagasy people often reside in a seasonal home, or lasy,
close to their rice fields during the harvest season; 83.1 % of the
Ankarafantsika population used a lasy during the prior year. Living
in a lasy peaked during September (79.3% of al l lasy were occu-
pied during this time). Lasy use was, however, high throughout the
year. Even during the lowest month (December), 62.3% of lasy
owning households occupied at least one of these seasonal
homes.
Nearly half of interviewees had earned a wage labor (even if
only for one day) during the prior year (43.1 % of interviewees,
43.9% of men, and 40.6% of women). Interviewees earned a me-
dian dai ly salary of US$1 .1 5 for wage labor. Whi le both men and
women earned a median salary of US$1 .1 5, men had higher earn-
ing potential (men earned a mean dai ly wage of US$1 .76 ± 2.57;
women a mean dai ly wage of US$1 .35 ± 1 .98).
NATURAL RESOURCE USE. Nearly al l (99.3%) of the population
rel ied on firewood for cooking and harvested it themselves
(98.8%) a median of two times per week (mean of 3.26 ± 3.05). In-
dividuals traveled a median of one hour and 1 5 minutes (mean of
66.1 min ± 35.9 min) to col lect firewood. We found a high depen-
dence on the forest for natural products that can create shelter.
Many (69.9%) households had purchased or harvested timber for
housing (even if just one piece of wood) and 79.9% had col lected
thatch roofing in the prior year. Most of the timber and thatch
used (96.8% and 91 .3%) was col lected by that household (and not
purchased). Households traveled a median of one hour and 1 5
minutes to col lect housing-timber and thatch roofing (means of
85.5 min ± 33.5 min; 86.4 min ± 60.8 min respectively). Half
(57.4%) of households had eaten honey during the prior year.
Honey was primari ly col lected and not purchased (95.8% of
households that had eaten honey had col lected it themselves).
Honey was col lected a median of 73 minutes from their homes
(mean of 81 .9 min ± 33.5 min). Few households had col lected
trees to bui ld boats (3.1 %) or plants for the fermentation of a local
alcohol ic beverage (6.5%) and none had purchased these items.
These col lectors traveled a median of one hour (means of
92.5 min ± 63.3 min; 83.5 min ± 38.7 min) to reach these products.
Most local people rel ied on the forest for healthcare through eth-
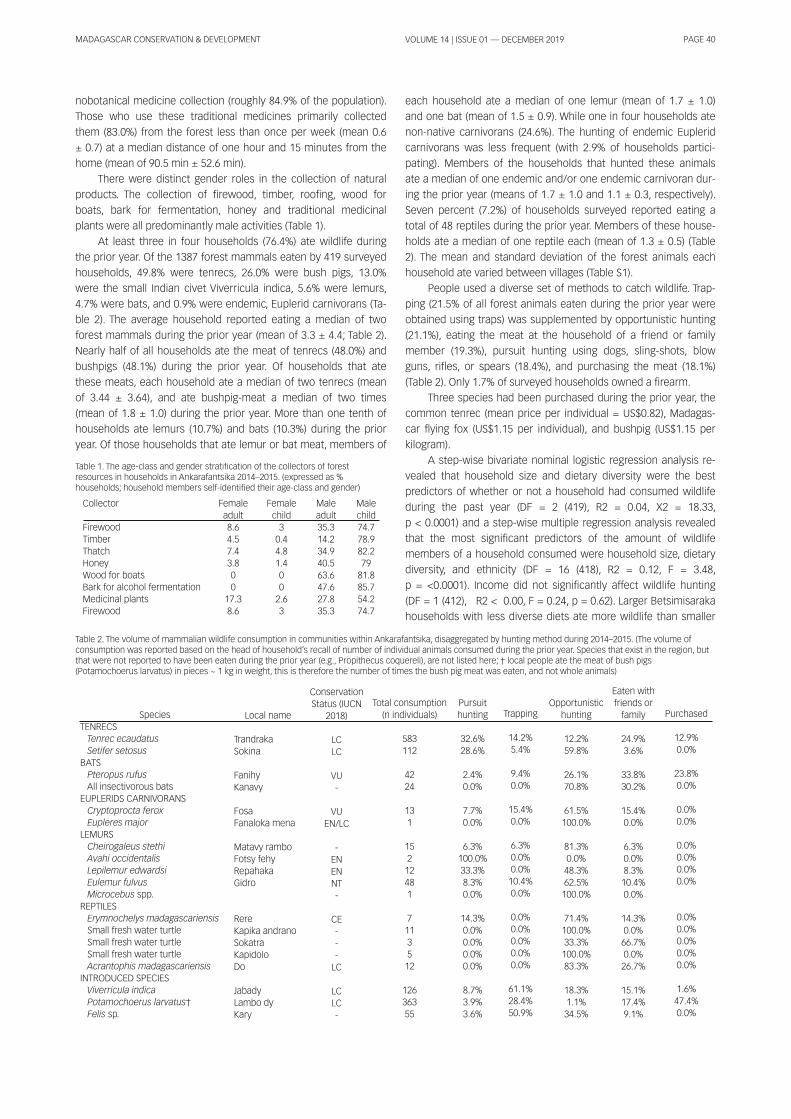
MADAGASCAR CONSERVATION & DEVELOPMENT PAGE 40VOLUME 1 4 | ISSUE 01 — DECEMBER 201 9
nobotanical medicine col lection (roughly 84.9% of the population).
Those who use these traditional medicines primari ly col lected
them (83.0%) from the forest less than once per week (mean 0.6
± 0.7) at a median distance of one hour and 1 5 minutes from the
home (mean of 90.5 min ± 52.6 min).
There were distinct gender roles in the col lection of natural
products. The col lection of firewood, timber, roofing, wood for
boats, bark for fermentation, honey and traditional medicinal
plants were al l predominantly male activities (Table 1 ).
At least three in four households (76.4%) ate wi ld l i fe during
the prior year. Of the 1 387 forest mammals eaten by 41 9 surveyed
households, 49.8% were tenrecs, 26.0% were bush pigs, 1 3.0%
were the smal l Indian civet Viverricula indica, 5.6% were lemurs,
4.7% were bats, and 0.9% were endemic, Euplerid carnivorans (Ta-
ble 2). The average household reported eating a median of two
forest mammals during the prior year (mean of 3.3 ± 4.4; Table 2).
Nearly half of al l households ate the meat of tenrecs (48.0%) and
bushpigs (48.1 %) during the prior year. Of households that ate
these meats, each household ate a median of two tenrecs (mean
of 3.44 ± 3.64), and ate bushpig-meat a median of two times
(mean of 1 .8 ± 1 .0) during the prior year. More than one tenth of
households ate lemurs (1 0.7%) and bats (1 0.3%) during the prior
year. Of those households that ate lemur or bat meat, members of
each household ate a median of one lemur (mean of 1 .7 ± 1 .0)
and one bat (mean of 1 .5 ± 0.9). Whi le one in four households ate
non-native carnivorans (24.6%). The hunting of endemic Euplerid
carnivorans was less frequent (with 2.9% of households partici-
pating). Members of the households that hunted these animals
ate a median of one endemic and/or one endemic carnivoran dur-
ing the prior year (means of 1 .7 ± 1 .0 and 1 .1 ± 0.3, respectively).
Seven percent (7.2%) of households surveyed reported eating a
total of 48 repti les during the prior year. Members of these house-
holds ate a median of one repti le each (mean of 1 .3 ± 0.5) (Table
2). The mean and standard deviation of the forest animals each
household ate varied between vi l lages (Table S1 ).
People used a diverse set of methods to catch wi ld l i fe. Trap-
ping (21 .5% of al l forest animals eaten during the prior year were
obtained using traps) was supplemented by opportunistic hunting
(21 .1 %), eating the meat at the household of a friend or fami ly
member (1 9.3%), pursuit hunting using dogs, sl ing-shots, blow
guns, rifles, or spears (1 8.4%), and purchasing the meat (1 8.1 %)
(Table 2). Only 1 .7% of surveyed households owned a firearm.
Three species had been purchased during the prior year, the
common tenrec (mean price per individual = US$0.82), Madagas-
car flying fox (US$1 .1 5 per individual ), and bushpig (US$1 .1 5 per
ki logram).
A step-wise bivariate nominal logistic regression analysis re-
vealed that household size and dietary diversity were the best
predictors of whether or not a household had consumed wi ld l i fe
during the past year (DF = 2 (41 9), R2 = 0.04, X2 = 1 8.33,
p < 0.0001 ) and a step-wise multiple regression analysis revealed
that the most significant predictors of the amount of wi ld l i fe
members of a household consumed were household size, dietary
diversity, and ethnicity (DF = 1 6 (41 8), R2 = 0.1 2, F = 3.48,
p = <0.0001 ). Income did not significantly affect wi ld l i fe hunting
(DF = 1 (41 2), R2 < 0.00, F = 0.24, p = 0.62). Larger Betsimisaraka
households with less diverse diets ate more wi ld l i fe than smal ler
Col lector
FirewoodTimberThatchHoneyWood for boatsBark for alcohol fermentationMedicinal plantsFirewood
Femaleadult8.64.57.43.800
1 7.38.6
Femalechi ld30.44.81 .4002.63
Maleadult35.31 4.234.940.563.647.627.835.3
Malechi ld74.778.982.27981 .885.754.274.7
Table 1 . The age-class and gender stratification of the col lectors of forestresources in households in Ankarafantsika 201 4–201 5. (expressed as %households; household members self-identified their age-class and gender)
SpeciesTENRECSTenrec ecaudatus
Setifer setosus
BATSPteropus rufus
Al l insectivorous batsEUPLERIDS CARNIVORANSCryptoprocta ferox
Eupleres major
LEMURSCheirogaleus stethi
Avahi occidentalis
Lepilemur edwardsi
Eulemur fulvus
Microcebus spp.REPTILESErymnochelys madagascariensis
Smal l fresh water turtleSmal l fresh water turtleSmal l fresh water turtleAcrantophis madagascariensis
INTRODUCED SPECIESViverricula indica
Potamochoerus larvatus†Felis sp.
Local name
TrandrakaSokina
FanihyKanavy
FosaFanaloka mena
Matavy ramboFotsy fehyRepahakaGidro
RereKapika andranoSokatraKapidoloDo
JabadyLambo dyKary
ConservationStatus (IUCN
201 8)
LCLC
VU-
VUEN/LC
-ENENNT-
CE---LC
LCLC-
Total consumption(n individuals)
5831 1 2
4224
1 31
1 521 2481
71 1351 2
1 2636355
Pursuithunting
32.6%28.6%
2.4%0.0%
7.7%0.0%
6.3%1 00.0%33.3%8.3%0.0%
1 4.3%0.0%0.0%0.0%0.0%
8.7%3.9%3.6%
Trapping
1 4.2%5.4%
9.4%0.0%
1 5.4%0.0%
6.3%0.0%0.0%1 0.4%0.0%
0.0%0.0%0.0%0.0%0.0%
61 .1 %28.4%50.9%
Opportunistichunting
1 2.2%59.8%
26.1 %70.8%
61 .5%1 00.0%
81 .3%0.0%48.3%62.5%1 00.0%
71 .4%1 00.0%33.3%1 00.0%83.3%
1 8.3%1 .1 %34.5%
Eaten withfriends orfami ly
24.9%3.6%
33.8%30.2%
1 5.4%0.0%
6.3%0.0%8.3%1 0.4%0.0%
1 4.3%0.0%66.7%0.0%26.7%
1 5.1 %1 7.4%9.1 %
Purchased
1 2.9%0.0%
23.8%0.0%
0.0%0.0%
0.0%0.0%0.0%0.0%
0.0%0.0%0.0%0.0%0.0%
1 .6%47.4%0.0%
Table 2. The volume of mammal ian wi ld l i fe consumption in communities within Ankarafantsika, disaggregated by hunting method during 201 4–201 5. (The volume ofconsumption was reported based on the head of household’s recal l of number of individual animals consumed during the prior year. Species that exist in the region, butthat were not reported to have been eaten during the prior year (e.g. , Propithecus coquerel i ), are not l isted here; † local people ate the meat of bush pigs(Potamochoerus larvatus) in pieces ~ 1 kg in weight, this is therefore the number of times the bush pig meat was eaten, and not whole animals)
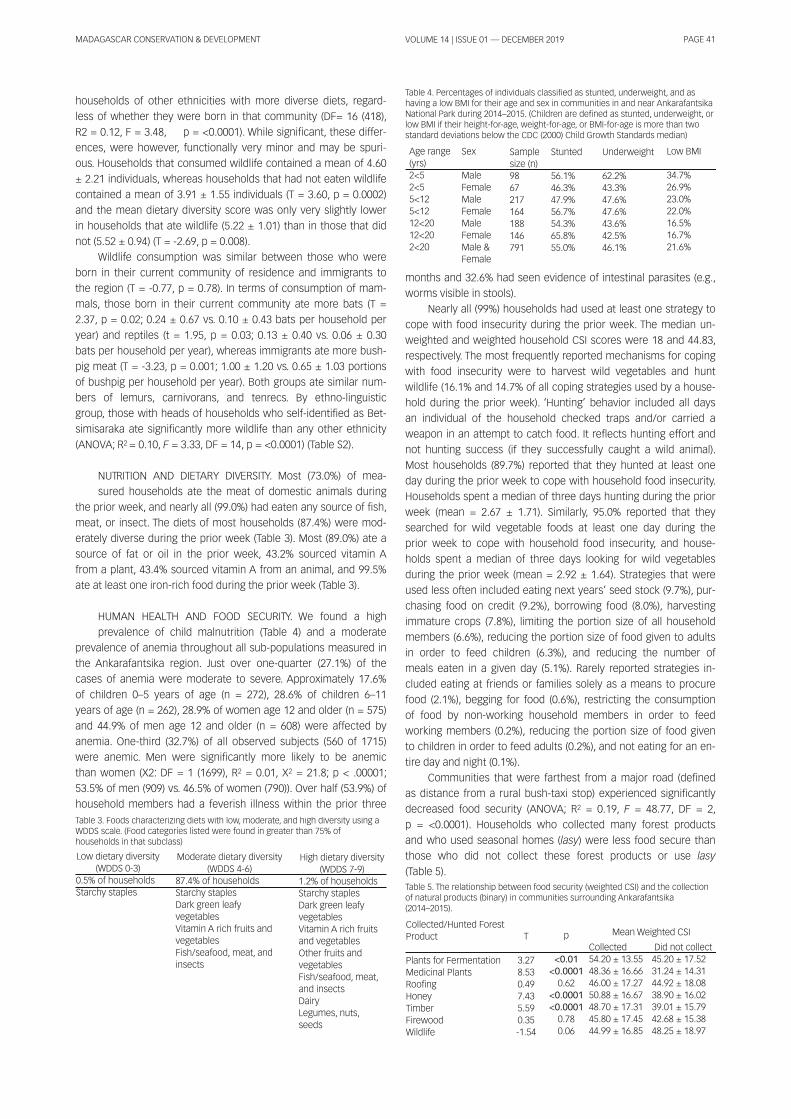
MADAGASCAR CONSERVATION & DEVELOPMENT PAGE 41VOLUME 1 4 | ISSUE 01 — DECEMBER 201 9
households of other ethnicities with more diverse diets, regard-
less of whether they were born in that community (DF= 1 6 (41 8),
R2 = 0.1 2, F = 3.48, p = <0.0001 ). Whi le significant, these differ-
ences, were however, functional ly very minor and may be spuri-
ous. Households that consumed wi ld l i fe contained a mean of 4.60
± 2.21 individuals, whereas households that had not eaten wi ld l i fe
contained a mean of 3.91 ± 1 .55 individuals (T = 3.60, p = 0.0002)
and the mean dietary diversity score was only very sl ightly lower
in households that ate wi ld l i fe (5.22 ± 1 .01 ) than in those that did
not (5.52 ± 0.94) (T = -2.69, p = 0.008).
Wi ld l i fe consumption was simi lar between those who were
born in their current community of residence and immigrants to
the region (T = -0.77, p = 0.78). In terms of consumption of mam-
mals, those born in their current community ate more bats (T =
2.37, p = 0.02; 0.24 ± 0.67 vs. 0.1 0 ± 0.43 bats per household per
year) and repti les (t = 1 .95, p = 0.03; 0.1 3 ± 0.40 vs. 0.06 ± 0.30
bats per household per year), whereas immigrants ate more bush-
pig meat (T = -3.23, p = 0.001 ; 1 .00 ± 1 .20 vs. 0.65 ± 1 .03 portions
of bushpig per household per year). Both groups ate simi lar num-
bers of lemurs, carnivorans, and tenrecs. By ethno-l inguistic
group, those with heads of households who self-identified as Bet-
simisaraka ate significantly more wi ld l i fe than any other ethnicity
(ANOVA; R2 = 0. 1 0, F = 3.33, DF = 1 4, p = <0.0001 ) (Table S2).
NUTRITION AND DIETARY DIVERSITY. Most (73.0%) of mea-
sured households ate the meat of domestic animals during
the prior week, and nearly al l (99.0%) had eaten any source of fish,
meat, or insect. The diets of most households (87.4%) were mod-
erately diverse during the prior week (Table 3). Most (89.0%) ate a
source of fat or oi l in the prior week, 43.2% sourced vitamin A
from a plant, 43.4% sourced vitamin A from an animal , and 99.5%
ate at least one iron-rich food during the prior week (Table 3).
HUMAN HEALTH AND FOOD SECURITY. We found a high
prevalence of chi ld malnutrition (Table 4) and a moderate
prevalence of anemia throughout al l sub-populations measured in
the Ankarafantsika region. Just over one-quarter (27.1 %) of the
cases of anemia were moderate to severe. Approximately 1 7.6%
of chi ldren 0–5 years of age (n = 272), 28.6% of chi ldren 6–1 1
years of age (n = 262), 28.9% of women age 1 2 and older (n = 575)
and 44.9% of men age 1 2 and older (n = 608) were affected by
anemia. One-third (32.7%) of al l observed subjects (560 of 1 71 5)
were anemic. Men were significantly more l ikely to be anemic
than women (X2: DF = 1 (1 699), R2 = 0.01 , X2 = 21 .8; p < .00001 ;
53.5% of men (909) vs. 46.5% of women (790)). Over half (53.9%) of
household members had a feverish i l lness within the prior three
months and 32.6% had seen evidence of intestinal parasites (e.g. ,
worms visible in stools).
Nearly al l (99%) households had used at least one strategy to
cope with food insecurity during the prior week. The median un-
weighted and weighted household CSI scores were 1 8 and 44.83,
respectively. The most frequently reported mechanisms for coping
with food insecurity were to harvest wi ld vegetables and hunt
wi ld l i fe (1 6.1 % and 1 4.7% of al l coping strategies used by a house-
hold during the prior week). ‘Hunting’ behavior included al l days
an individual of the household checked traps and/or carried a
weapon in an attempt to catch food. I t reflects hunting effort and
not hunting success (if they successful ly caught a wi ld animal ).
Most households (89.7%) reported that they hunted at least one
day during the prior week to cope with household food insecurity.
Households spent a median of three days hunting during the prior
week (mean = 2.67 ± 1 .71 ). Simi larly, 95.0% reported that they
searched for wi ld vegetable foods at least one day during the
prior week to cope with household food insecurity, and house-
holds spent a median of three days looking for wi ld vegetables
during the prior week (mean = 2.92 ± 1 .64). Strategies that were
used less often included eating next years’ seed stock (9.7%), pur-
chasing food on credit (9.2%), borrowing food (8.0%), harvesting
immature crops (7.8%), l imiting the portion size of al l household
members (6.6%), reducing the portion size of food given to adults
in order to feed chi ldren (6.3%), and reducing the number of
meals eaten in a given day (5.1 %). Rarely reported strategies in-
cluded eating at friends or fami l ies solely as a means to procure
food (2.1 %), begging for food (0.6%), restricting the consumption
of food by non-working household members in order to feed
working members (0.2%), reducing the portion size of food given
to chi ldren in order to feed adults (0.2%), and not eating for an en-
tire day and night (0.1 %).
Communities that were farthest from a major road (defined
as distance from a rural bush-taxi stop) experienced significantly
decreased food security (ANOVA; R2 = 0.1 9, F = 48.77, DF = 2,
p = <0.0001 ). Households who col lected many forest products
and who used seasonal homes (lasy) were less food secure than
those who did not col lect these forest products or use lasy
(Table 5).
Low dietary diversity(WDDS 0-3)
0.5% of householdsStarchy staples
Moderate dietary diversity(WDDS 4-6)
87.4% of householdsStarchy staplesDark green leafyvegetablesVitamin A rich fruits andvegetablesFish/seafood, meat, andinsects
High dietary diversity(WDDS 7-9)
1 .2% of householdsStarchy staplesDark green leafyvegetablesVitamin A rich fruitsand vegetablesOther fruits andvegetablesFish/seafood, meat,and insectsDairyLegumes, nuts,seeds
Table 3. Foods characterizing diets with low, moderate, and high diversity using aWDDS scale. (Food categories l isted were found in greater than 75% ofhouseholds in that subclass)
Col lected/Hunted ForestProduct
Plants for FermentationMedicinal PlantsRoofingHoneyTimberFirewoodWildl i fe
T
3.278.530.497.435.590.35-1 .54
p
<0.01
<0.0001
0.62<0.0001
<0.0001
0.780.06
Col lected54.20 ± 1 3.5548.36 ± 1 6.6646.00 ± 1 7.2750.88 ± 1 6.6748.70 ± 1 7.3145.80 ± 1 7.4544.99 ± 1 6.85
Did not col lect45.20 ± 1 7.5231 .24 ± 1 4.3144.92 ± 1 8.0838.90 ± 1 6.0239.01 ± 1 5.7942.68 ± 1 5.3848.25 ± 1 8.97
Mean Weighted CSI
Table 5. The relationship between food security (weighted CSI ) and the col lectionof natural products (binary) in communities surrounding Ankarafantsika(201 4–201 5).
Age range(yrs)2<52<55<1 25<1 21 2<201 2<202<20
Sex
MaleFemaleMaleFemaleMaleFemaleMale &Female
Samplesize (n)986721 71 641 881 46791
Stunted
56.1 %46.3%47.9%56.7%54.3%65.8%55.0%
Underweight
62.2%43.3%47.6%47.6%43.6%42.5%46.1 %
Low BMI
34.7%26.9%23.0%22.0%1 6.5%1 6.7%21 .6%
Table 4. Percentages of individuals classified as stunted, underweight, and ashaving a low BMI for their age and sex in communities in and near AnkarafantsikaNational Park during 201 4–201 5. (Chi ldren are defined as stunted, underweight, orlow BMI if their height-for-age, weight-for-age, or BMI-for-age is more than twostandard deviations below the CDC (2000) Chi ld Growth Standards median)
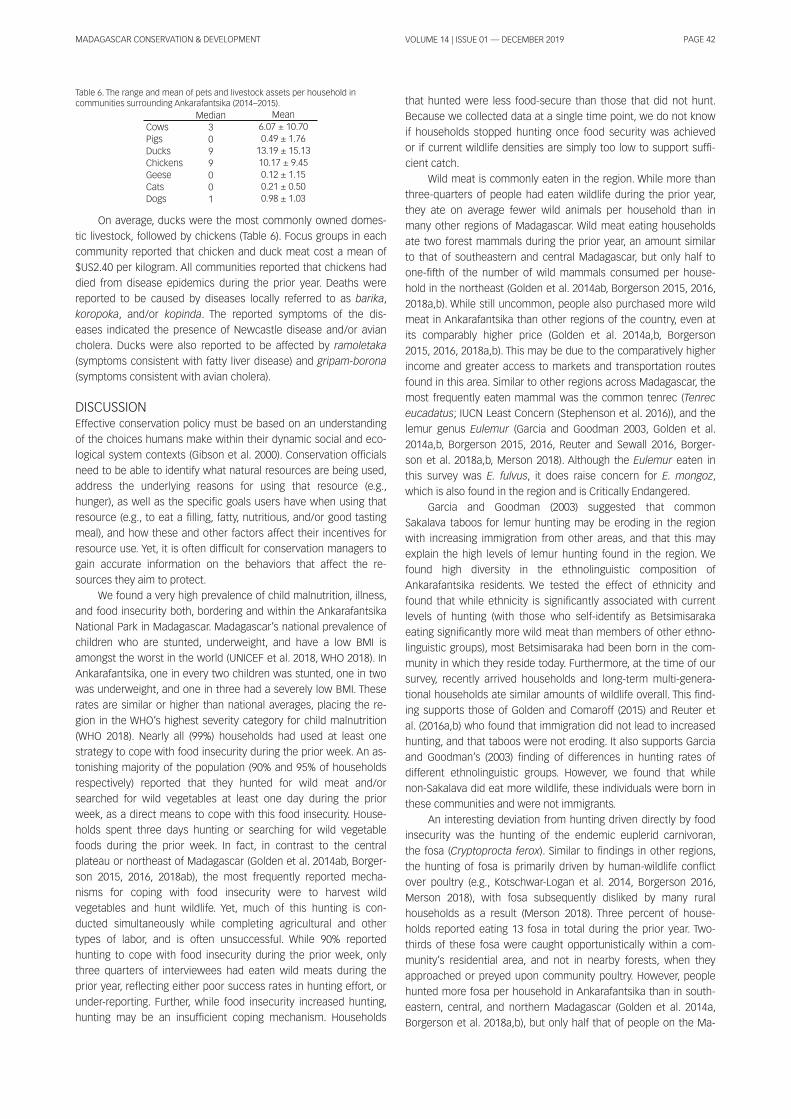
MADAGASCAR CONSERVATION & DEVELOPMENT PAGE 42VOLUME 1 4 | ISSUE 01 — DECEMBER 201 9
On average, ducks were the most commonly owned domes-
tic l ivestock, fol lowed by chickens (Table 6). Focus groups in each
community reported that chicken and duck meat cost a mean of
$US2.40 per ki logram. Al l communities reported that chickens had
died from disease epidemics during the prior year. Deaths were
reported to be caused by diseases local ly referred to as barika ,
koropoka , and/or kopinda . The reported symptoms of the dis-
eases indicated the presence of Newcastle disease and/or avian
cholera. Ducks were also reported to be affected by ramoletaka
(symptoms consistent with fatty l iver disease) and gripam-borona
(symptoms consistent with avian cholera).
DISCUSSIONEffective conservation pol icy must be based on an understanding
of the choices humans make within their dynamic social and eco-
logical system contexts (Gibson et al . 2000). Conservation officials
need to be able to identify what natural resources are being used,
address the underlying reasons for using that resource (e.g. ,
hunger), as wel l as the specific goals users have when using that
resource (e.g. , to eat a fi l l ing, fatty, nutritious, and/or good tasting
meal ), and how these and other factors affect their incentives for
resource use. Yet, i t is often difficult for conservation managers to
gain accurate information on the behaviors that affect the re-
sources they aim to protect.
We found a very high prevalence of chi ld malnutrition, i l lness,
and food insecurity both, bordering and within the Ankarafantsika
National Park in Madagascar. Madagascar’s national prevalence of
chi ldren who are stunted, underweight, and have a low BMI is
amongst the worst in the world (UNICEF et al . 201 8, WHO 201 8). In
Ankarafantsika, one in every two chi ldren was stunted, one in two
was underweight, and one in three had a severely low BMI. These
rates are simi lar or higher than national averages, placing the re-
gion in the WHO’s highest severity category for chi ld malnutrition
(WHO 201 8). Nearly al l (99%) households had used at least one
strategy to cope with food insecurity during the prior week. An as-
tonishing majority of the population (90% and 95% of households
respectively) reported that they hunted for wi ld meat and/or
searched for wi ld vegetables at least one day during the prior
week, as a direct means to cope with this food insecurity. House-
holds spent three days hunting or searching for wi ld vegetable
foods during the prior week. In fact, in contrast to the central
plateau or northeast of Madagascar (Golden et al . 201 4ab, Borger-
son 201 5, 201 6, 201 8ab), the most frequently reported mecha-
nisms for coping with food insecurity were to harvest wi ld
vegetables and hunt wi ld l i fe. Yet, much of this hunting is con-
ducted simultaneously whi le completing agricultural and other
types of labor, and is often unsuccessful . Whi le 90% reported
hunting to cope with food insecurity during the prior week, only
three quarters of interviewees had eaten wi ld meats during the
prior year, reflecting either poor success rates in hunting effort, or
under-reporting. Further, whi le food insecurity increased hunting,
hunting may be an insufficient coping mechanism. Households
that hunted were less food-secure than those that did not hunt.
Because we col lected data at a single time point, we do not know
if households stopped hunting once food security was achieved
or if current wi ld l i fe densities are simply too low to support suffi-
cient catch.
Wi ld meat is commonly eaten in the region. Whi le more than
three-quarters of people had eaten wi ld l i fe during the prior year,
they ate on average fewer wi ld animals per household than in
many other regions of Madagascar. Wi ld meat eating households
ate two forest mammals during the prior year, an amount simi lar
to that of southeastern and central Madagascar, but only half to
one-fifth of the number of wi ld mammals consumed per house-
hold in the northeast (Golden et al . 201 4ab, Borgerson 201 5, 201 6,
201 8a,b). Whi le sti l l uncommon, people also purchased more wi ld
meat in Ankarafantsika than other regions of the country, even at
its comparably higher price (Golden et al . 201 4a,b, Borgerson
201 5, 201 6, 201 8a,b). This may be due to the comparatively higher
income and greater access to markets and transportation routes
found in this area. Simi lar to other regions across Madagascar, the
most frequently eaten mammal was the common tenrec (Tenrec
eucadatus; IUCN Least Concern (Stephenson et al . 201 6)), and the
lemur genus Eulemur (Garcia and Goodman 2003, Golden et al .
201 4a,b, Borgerson 201 5, 201 6, Reuter and Sewal l 201 6, Borger-
son et al . 201 8a,b, Merson 201 8). Although the Eulemur eaten in
this survey was E. fulvus, i t does raise concern for E. mongoz,
which is also found in the region and is Critical ly Endangered.
Garcia and Goodman (2003) suggested that common
Sakalava taboos for lemur hunting may be eroding in the region
with increasing immigration from other areas, and that this may
explain the high levels of lemur hunting found in the region. We
found high diversity in the ethnol inguistic composition of
Ankarafantsika residents. We tested the effect of ethnicity and
found that whi le ethnicity is significantly associated with current
levels of hunting (with those who self-identify as Betsimisaraka
eating significantly more wi ld meat than members of other ethno-
l inguistic groups), most Betsimisaraka had been born in the com-
munity in which they reside today. Furthermore, at the time of our
survey, recently arrived households and long-term multi -genera-
tional households ate simi lar amounts of wi ld l i fe overal l . This find-
ing supports those of Golden and Comaroff (201 5) and Reuter et
al . (201 6a,b) who found that immigration did not lead to increased
hunting, and that taboos were not eroding. I t also supports Garcia
and Goodman’s (2003) finding of differences in hunting rates of
different ethnol inguistic groups. However, we found that whi le
non-Sakalava did eat more wi ld l i fe, these individuals were born in
these communities and were not immigrants.
An interesting deviation from hunting driven directly by food
insecurity was the hunting of the endemic euplerid carnivoran,
the fosa (Cryptoprocta ferox). Simi lar to findings in other regions,
the hunting of fosa is primari ly driven by human-wi ld l i fe confl ict
over poultry (e.g. , Kotschwar-Logan et al . 201 4, Borgerson 201 6,
Merson 201 8), with fosa subsequently disl iked by many rural
households as a result (Merson 201 8). Three percent of house-
holds reported eating 1 3 fosa in total during the prior year. Two-
thirds of these fosa were caught opportunistical ly within a com-
munity’s residential area, and not in nearby forests, when they
approached or preyed upon community poultry. However, people
hunted more fosa per household in Ankarafantsika than in south-
eastern, central , and northern Madagascar (Golden et al . 201 4a,
Borgerson et al . 201 8a,b), but only half that of people on the Ma-
Mean6.07 ± 1 0.700.49 ± 1 .761 3.1 9 ± 1 5.1 31 0.1 7 ± 9.450.1 2 ± 1 .1 50.21 ± 0.500.98 ± 1 .03
Median3099001
CowsPigsDucksChickensGeeseCatsDogs
Table 6. The range and mean of pets and l ivestock assets per household incommunities surrounding Ankarafantsika (201 4–201 5).
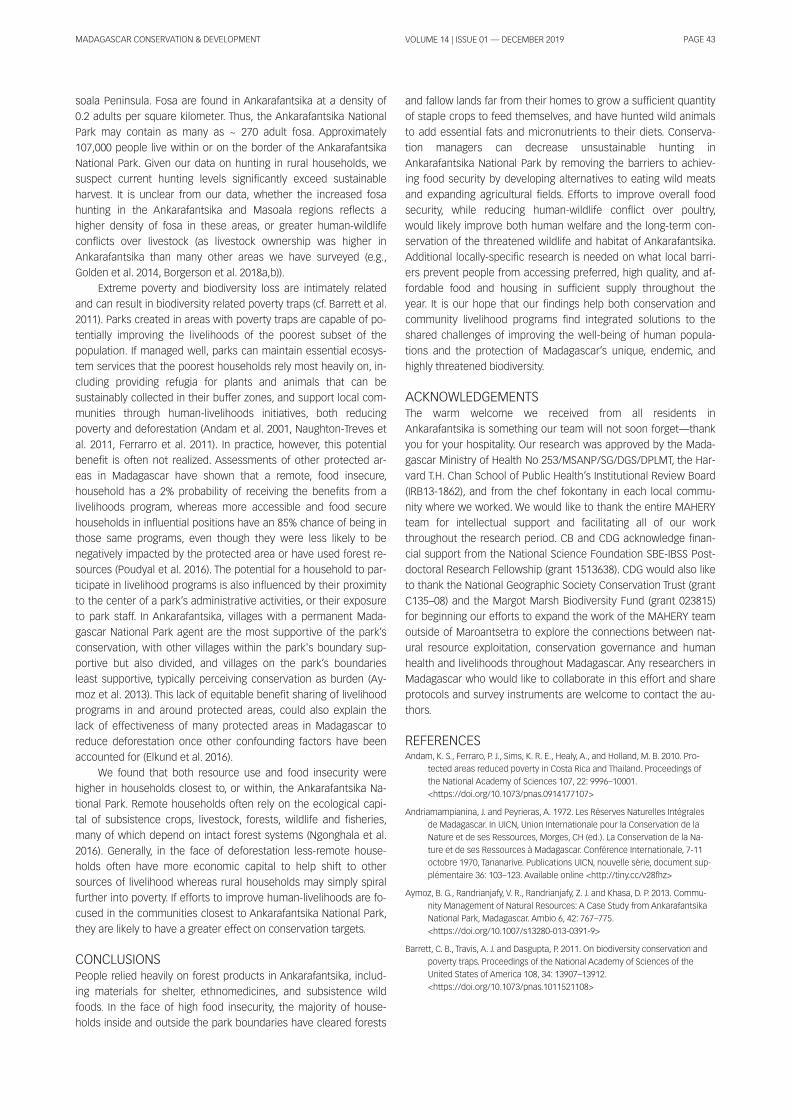
MADAGASCAR CONSERVATION & DEVELOPMENT PAGE 43VOLUME 1 4 | ISSUE 01 — DECEMBER 201 9
soala Peninsula. Fosa are found in Ankarafantsika at a density of
0.2 adults per square ki lometer. Thus, the Ankarafantsika National
Park may contain as many as ~ 270 adult fosa. Approximately
1 07,000 people l ive within or on the border of the Ankarafantsika
National Park. Given our data on hunting in rural households, we
suspect current hunting levels significantly exceed sustainable
harvest. I t is unclear from our data, whether the increased fosa
hunting in the Ankarafantsika and Masoala regions reflects a
higher density of fosa in these areas, or greater human-wi ld l i fe
confl icts over l ivestock (as l ivestock ownership was higher in
Ankarafantsika than many other areas we have surveyed (e.g. ,
Golden et al . 201 4, Borgerson et al . 201 8a,b)).
Extreme poverty and biodiversity loss are intimately related
and can result in biodiversity related poverty traps (cf. Barrett et al .
201 1 ). Parks created in areas with poverty traps are capable of po-
tential ly improving the l ivel ihoods of the poorest subset of the
population. I f managed wel l , parks can maintain essential ecosys-
tem services that the poorest households rely most heavi ly on, in-
cluding providing refugia for plants and animals that can be
sustainably col lected in their buffer zones, and support local com-
munities through human-l ivel ihoods initiatives, both reducing
poverty and deforestation (Andam et al . 2001 , Naughton-Treves et
al . 201 1 , Ferrarro et al . 201 1 ). In practice, however, this potential
benefit is often not real ized. Assessments of other protected ar-
eas in Madagascar have shown that a remote, food insecure,
household has a 2% probabi l i ty of receiving the benefits from a
l ivel ihoods program, whereas more accessible and food secure
households in influential positions have an 85% chance of being in
those same programs, even though they were less l ikely to be
negatively impacted by the protected area or have used forest re-
sources (Poudyal et al . 201 6). The potential for a household to par-
ticipate in l ivel ihood programs is also influenced by their proximity
to the center of a park’s administrative activities, or their exposure
to park staff. In Ankarafantsika, vi l lages with a permanent Mada-
gascar National Park agent are the most supportive of the park’s
conservation, with other vi l lages within the park's boundary sup-
portive but also divided, and vi l lages on the park’s boundaries
least supportive, typical ly perceiving conservation as burden (Ay-
moz et al . 201 3). This lack of equitable benefit sharing of l ivel ihood
programs in and around protected areas, could also explain the
lack of effectiveness of many protected areas in Madagascar to
reduce deforestation once other confounding factors have been
accounted for (Elkund et al . 201 6).
We found that both resource use and food insecurity were
higher in households closest to, or within, the Ankarafantsika Na-
tional Park. Remote households often rely on the ecological capi-
tal of subsistence crops, l ivestock, forests, wi ld l i fe and fisheries,
many of which depend on intact forest systems (Ngonghala et al .
201 6). General ly, in the face of deforestation less-remote house-
holds often have more economic capital to help shift to other
sources of l ivel ihood whereas rural households may simply spiral
further into poverty. I f efforts to improve human-l ivel ihoods are fo-
cused in the communities closest to Ankarafantsika National Park,
they are l ikely to have a greater effect on conservation targets.
CONCLUSIONSPeople rel ied heavi ly on forest products in Ankarafantsika, includ-
ing materials for shelter, ethnomedicines, and subsistence wi ld
foods. In the face of high food insecurity, the majority of house-
holds inside and outside the park boundaries have cleared forests
and fal low lands far from their homes to grow a sufficient quantity
of staple crops to feed themselves, and have hunted wi ld animals
to add essential fats and micronutrients to their diets. Conserva-
tion managers can decrease unsustainable hunting in
Ankarafantsika National Park by removing the barriers to achiev-
ing food security by developing alternatives to eating wi ld meats
and expanding agricultural fields. Efforts to improve overal l food
security, whi le reducing human-wi ld l i fe confl ict over poultry,
would l ikely improve both human welfare and the long-term con-
servation of the threatened wi ld l i fe and habitat of Ankarafantsika.
Additional local ly-specific research is needed on what local barri-
ers prevent people from accessing preferred, high qual i ty, and af-
fordable food and housing in sufficient supply throughout the
year. I t is our hope that our findings help both conservation and
community l ivel ihood programs find integrated solutions to the
shared chal lenges of improving the wel l -being of human popula-
tions and the protection of Madagascar’s unique, endemic, and
highly threatened biodiversity.
ACKNOWLEDGEMENTSThe warm welcome we received from al l residents in
Ankarafantsika is something our team wil l not soon forget—thank
you for your hospital i ty. Our research was approved by the Mada-
gascar Ministry of Health No 253/MSANP/SG/DGS/DPLMT, the Har-
vard T.H. Chan School of Publ ic Health’s Institutional Review Board
(IRB1 3-1 862), and from the chef fokontany in each local commu-
nity where we worked. We would l ike to thank the entire MAHERY
team for intel lectual support and faci l i tating al l of our work
throughout the research period. CB and CDG acknowledge finan-
cial support from the National Science Foundation SBE-IBSS Post-
doctoral Research Fel lowship (grant 1 51 3638). CDG would also l ike
to thank the National Geographic Society Conservation Trust (grant
C1 35–08) and the Margot Marsh Biodiversity Fund (grant 02381 5)
for beginning our efforts to expand the work of the MAHERY team
outside of Maroantsetra to explore the connections between nat-
ural resource exploitation, conservation governance and human
health and l ivel ihoods throughout Madagascar. Any researchers in
Madagascar who would l ike to col laborate in this effort and share
protocols and survey instruments are welcome to contact the au-
thors.
REFERENCESAndam, K. S. , Ferraro, P. J. , Sims, K. R. E. , Healy, A. , and Hol land, M. B. 201 0. Pro-
tected areas reduced poverty in Costa Rica and Thai land. Proceedings of
the National Academy of Sciences 1 07, 22: 9996–1 0001 .
<https://doi .org/1 0.1 073/pnas.091 41 771 07>
Andriamampianina, J. and Peyrieras, A. 1 972. Les Réserves Naturel les Intégrales
de Madagascar. In UICN, Union Internationale pour la Conservation de la
Nature et de ses Ressources, Morges, CH (ed. ). La Conservation de la Na-
ture et de ses Ressources à Madagascar. Conférence Internationale, 7-1 1
octobre 1 970, Tananarive. Publ ications UICN, nouvel le série, document sup-
plémentaire 36: 1 03–1 23. Avai lable onl ine <http://tiny.cc/v28fhz>
Aymoz, B. G. , Randrianjafy, V. R. , Randrianjafy, Z. J. and Khasa, D. P. 201 3. Commu-
nity Management of Natural Resources: A Case Study from Ankarafantsika
National Park, Madagascar. Ambio 6, 42: 767–775.
<https://doi .org/1 0.1 007/s1 3280-01 3-0391 -9>
Barrett, C. B. , Travis, A. J. and Dasgupta, P. 201 1 . On biodiversity conservation and
poverty traps. Proceedings of the National Academy of Sciences of the
United States of America 1 08, 34: 1 3907–1 391 2.
<https://doi .org/1 0.1 073/pnas.1 01 1 521 1 08>
MADAGASCAR CONSERVATION & DEVELOPMENT PAGE 44VOLUME 1 4 | ISSUE 01 — DECEMBER 201 9
Borgerson, C. , Vonona, M. A. , Vonona, T. , Anjaranirina, E. J. G. , Lewis, R. , et al .
201 8a. An evaluation of the interactions among household economies, hu-
man health, and wi ld l i fe hunting in the Lac Alaotra wetland complex of
Madagascar. Madagascar Conservation & Development 1 3, 1 : 25–33.
<https://doi .org/1 0.431 4/mcd.v1 3i1 .5>
Borgerson, C. , Johnson, S. E. , Louis, E. E. , Holmes, S. M. , Anjaranirina, E. J. G. , et al .
201 8b. The use of natural resources to improve income, health, and nutri-
tion within the forests of Kianjavato, Madagascar. Madagascar Conservation
& Development 1 3, 1 : 45–52. <https://doi .org/1 0.431 4/mcd.v1 3i1 .6>
Borgerson, C. 201 5. The effects of i l legal hunting and habitat on two sympatric
endangered primates. International Journal of Primatology 36, 1 :74–93.
<https://doi .org/1 0.1 007/s1 0764-01 5-981 2-x>
Borgerson, C. 201 6. Optimizing conservation pol icy: The importance of seasonal
variation in hunting and meat consumption on the Masoala peninsula of
Madagascar. Oryx 50, 3: 405–41 8.
<https://doi .org/1 0.1 01 7/S003060531 5000307>
Borgerson, C. , McKean, M. A. , Sutherland, M. R. and Godfrey, L. R. 201 6. Who hunts
lemurs and why they hunt them. Biological conservation 1 97:1 24–1 30.
<https://doi .org/1 0.1 01 6/S000632071 6300556>
Brook, C. E. , Herrera, J. , Borgerson, C. , Ful ler, E. , Andriamahazoarivosoa, P. , et al .
201 8. Population viabi l i ty and bushmeat harvest sustainabi l i ty for Madagas-
car lemurs. Conservation Biology 33, 1 : 99–1 1 1 .
<https://doi .org/1 0.1 1 1 1 /cobi . 1 31 51 >
Centers for Disease Control and Prevention. 2001 . National Center for Health Sta-
tistics CDC growth charts, United States. Avai lable onl ine
<http://www.cdc.gov/growthcharts/>
Dasgupta, P. and Maler, K. G. (eds). 2004. The Economics of Non-Convex Ecosys-
tems. Kluwer, Dordrecht. The Netherlands.
Estrada, A. Garber, P. A. , Mittermeier, R. A. , Wich, S. , Gouveia, S. , et al . 201 8. Pri-
mates in peri l : the significance of Brazi l , Madagascar, Indonesia and the
Democratic Republ ic of the Congo for global primate conservation. PeerJ 6:
e4869. <https://doi .org/1 0.771 7/peerj .4869>
FAO. 201 0. Guidel ines for measuring household and individual dietary diversity.
Rome: Nutrition and Consumer Protection Division, Food and Agriculture
Organization of the United Nations. 60 pp. Avai lable onl ine
<http://www.fao.org/3/a-i1 983e.pdf>
Ferraro, P. J. , Hanauer, M. M. , and Sims, K. R. 201 1 . Conditions associated with pro-
tected area success in conservation and poverty reduction. Proceedings of
the National Academy of Sciences 1 08: 1 391 3–1 391 8.
<https://doi .org/1 0.1 073/pnas.1 01 1 5291 08>
Garcia, G. and Goodman, S. M. 2003. Hunting of protected animals in the Parc Na-
tional d’Ankarafantsika, north-western Madagascar. Oryx 37: 1 1 5–1 1 8.
<https://doi .org/1 0.1 01 7/S0030605303000206>
Gardner, C. J. , Nicol l , M. E. , Mbohoany, T. , Oleson, K. L. L. , Ratsifandrihamanana, A.
N. , et al . 201 3. Protected areas for conservation and poverty al leviation: ex-
periences from Madagascar. Journal of Appl ied Ecology 50: 1 289–1 294.
<https://doi .org/1 0.1 1 1 1 /1 365-2664.1 21 64>
Gibson, C. , McKean, M. A. and Ostrom, E. 2000. People and Forests: Communities,
Institutions, and Governance. MIT Press, Cambridge. 274pp.
Golden, C. D. 2009. Bushmeat hunting and use in the Makira Forest north-eastern
Madagascar: a conservation and l ivel ihoods issue. Oryx 43, 3: 386–392.
<https://doi .org/1 0.1 01 7/S00306053090001 31 >
Golden, C. D. , Bonds, M. H. , Brashares, J. S. , Rasolofoniaina, B. J. R. and Kremen, C.
201 4a. Economic valuation of subsistence harvest of wi ld l i fe in Madagascar.
Conservation Biology 28, 1 : 234–243. <https://doi .org/1 0.1 1 1 1 /cobi . 1 21 74>
Golden, C. D. and Comaroff, J. 201 5. Effects of social change on wi ld l i fe consump-
tion taboos in northeastern Madagascar. Ecology and Society 20, 2: #41 .
<http://dx.doi .org/1 0.5751 /ES-07589-200241 >
Golden, C. D. , Fernald, L. C. H. , Brashares, J. S. , Rasolofoniaina, B . J. R. and Kremen,
C. 201 1 . Benefits of wi ld l i fe consumption to chi ld nutrition in a biodiversity
hotspot. Proceedings of the National Academy of Sciences of the United
States of America 1 08, 49: 1 9653–1 9656.
<https://doi .org/1 0.1 073/pnas.1 1 1 25861 08>
Golden, C. D. , Gupta, A. C. , Vaitla, B. and Myers, S. S. 201 6. Ecosystem services and
food security: assessing inequal i ty at community, household and individual
scales. Environmental Conservation 43, 4: 381 –388.
<https://doi .org/1 0.1 01 7/S037689291 60001 63>
Golden, C. D. , Rabehatonina, J. G. C. , Rakotosoa, A. and Moore, M. 201 4b. Socio-
ecological analysis of natural resource use in Betampona Strict Natural Re-
serve. Madagascar Conservation & Development 9, 2: 83–89.
<https://doi .org/1 0.431 4/mcd.v9i2.4>
Golden, C. D. , Rasolofoniaina, B. J. R. , Anjaranirina, E. J. G. , Nicolas, L. , Ravaol iny, L.
and Kremen, C. 201 2. Rainforest Pharmacopeia in Madagascar Provides
High Value for Current Local and Prospective Global Uses. PLOS ONE 7, 7:
e41 221 . <https://doi .org/1 0.1 371 /journal .pone.0041 221 >
Golden, C. D. , Wrangham, R. W. and Brashares, J. S. 201 3. Assessing the accuracy
of interviewed recal l for rare, highly seasonal events: the case of wi ld l i fe
consumption in Madagascar. Animal Conservation 1 6, 6: 597-603.
<https://doi .org/1 0.1 1 1 1 /acv.1 2047>
Harper, G. J. , Stein inger, M. K. , Tucker, C. J. , Juhn, D. and Hawkins, F. 2007. Fifty
years of deforestation and forest fragmentation in Madagascar. Environ-
mental Conservation, 34, 4: 325–333.
<https://doi .org/1 0.1 01 7/S0376892907004262>
INSTAT. 201 3. Madagascar in Numbers. Accessed onl ine 25 Jan 201 9
<https://www. instat.mg/madagascar-en-chiffre/>
Kotschwar-Logan, M. , Gerber, B. D. , Karpanty, S. M. , Justin, S. and Rabenahy, F. N.
201 4. Assessing carnivore distribution from local knowledge across a hu-
man-dominated landscape in central -southeastern Madagascar. Animal
Conservation. 1 8: 82–91 . <https://doi .org/1 0.1 1 1 1 /acv.1 21 37>
Madagascar National Parks. 201 8. Ankarafantsika National Park.
Maxwel l , D. and Caldwel l , R. 2008. Coping Strategies index: Field Methods Manual .
Second Edition. Avai lable onl ine <http://tiny.cc/jh8fhz>
Merson, S. D. 201 8. Bushmeat hunting, retal iatory ki l l ing, habitat degradation and
exotic species as threats to Fosa (Cryptoprocta ferox) conservation. DPhi l
Thesis, University of Oxford, Oxford. Avai lable onl ine <http://tiny.cc/fc8fhz>
Myers, N. , Mittermeier, R. A. , Mittermeier, C. G. , da Fonseca, G. A. B. and Kent, J.
2000. Biodiversity hotspots for conservation priorities. Nature 403: 853–858.
<https://doi .org/1 0.1 038/35002501 >
Naughton-Treves, L. , Al ix-Garcia, J. and Chapman, C.A. 201 1 . Lessons about parks
and poverty from a decade of forest loss and economic growth around
Kibale National Park, Uganda. Proceedings of the National Academy of Sci-
ences 1 08, 34: 1 391 9–1 3924. <https://doi .org/1 0.1 073/pnas.1 01 33321 08>
Ngonghala, C. N. , De Leo, G. A. , Pascual , M. M. , Keenan, D. C. , Dobson, A. P. and
Bonds, M. H. 201 6. Genereal ecological models for human subsistence,
health and poverty. Nature Ecology and Evolution 1 : 1 1 53–1 1 59.
<https://doi .org/1 0.1 038/s41 559-01 7-0221 -8>
Ngonghala, C. N. , Plucinski , M. M. , Murray, M. B. , Farmer, P. E. , Barrett, C. B. , et al .
201 4. Poverty, disease, and the ecology of complex systems. PLOS Biology
1 2, 4: e1 001 827. <https://doi .org/1 0.1 371 /journal .pbio.1 001 827>
Poudyal , M. , Ramamonj isoa, B. S. , Hockley, N. , Rakotonarivo, O. S. , Gibbons, J. M. ,
Mandimbiniaina, R. , et al . 201 6. Can REDD+ social safeguards reach the
‘right’ people? Lessons from Madagascar. Global Environmental Change 37:
31 –42. <https://doi .org/1 0.1 01 6/j .gloenvcha.201 6.01 .004>
Poudyal , M. , Rakotonarivo, O.S. , Razafimanahaka, J. H. , Hockley, N. and Jones, J. P.
G. 201 8. Household economy, forest dependency & opportunity costs of
conservation in eastern rainforests of Madagascar. Scientific Data 5:
#1 80225. <https://doi .org/1 0.1 038/sdata.201 8.225>
Rakotomanana, H. , Jenkins, R. K. B. and Ratsimbazafy, J. 201 3. Conservation chal-
lenges for Madagascar in the next decade. In Conservation Biology: Voices
from the Tropics. N. S. Sohdi , L. Gibson, P. H. Raven, P. H. (eds), pp 33–39.
John Wi ley & Sons, Ltd.
Razafimanahaka, J. H. , Jenkins, R. K. B. , Andriafid ison, D. , Randrianandrianina, F. ,
Rakotomboavonjy, V. , et al . 201 2. Novel approach for quantifying i l legal
bushmeat consumption reveals high consumption of protected species in
Madagascar. Oryx 46, 4: 584–592.
<https://doi .org/1 0.1 01 7/S003060531 2000579>
Reuter, K. E. and Sewal l , B. J. 201 6. Taboos and sustainabi l i ty of tenrec hunting in
Madagascar. Afrotherian Conservation 1 2:1 1 –1 5.
Reuter, K. E. , Randel l , H . , Wi l ls, A. R. , Janvier, T. E. , Belalahy, T. R. and Sewal l , B. J.
201 6a. Capture, Movement, Trade, and Consumption of Mammals in Mada-
gascar. PLOS ONE 1 1 , 2: e01 50305.
<https://doi .org/1 0.1 371 /journal .pone.01 50305>
MADAGASCAR CONSERVATION & DEVELOPMENT PAGE 45VOLUME 1 4 | ISSUE 01 — DECEMBER 201 9
Reuter, K. E. , Randel l , H . R. , Wi l ls, A. R. and Sewal l , B. J. 201 6b. The consumption of
wi ld meat in Madagascar: drivers, popularity and food security. Environ-
mental Conservation 1 , 3: 1 –1 1 .
<https://doi .org/1 0.1 01 7/S037689291 6000059>
Reuter, K. E. , Sewal l , B. J. and Di Minin, E. 201 7. Drivers of present and l i fetime nat-
ural resource use in a tropical biodiversity hotspot. Animal Conservation 21 :
1 27–1 36. <https://doi .org/1 0.1 1 1 1 /acv.1 2355>
Reuter, K. E. , Clarke, T. A. , LaFleur, M. , Ratsimbazafy, J. , Hol in iaina Kjeldgaard, F. , et
al . 201 8. Exploring the Role of Wealth and Rel igion on the Ownership of
Captive Lemurs in Madagascar Using Qual i tative and Quantitative Data. Fo-
l ia Primatologica 89: 81 –96. <https://doi .org/ 1 0.1 1 59/000477400>
Stephenson, P. J. , Soarimalala, V. , Goodman, S. 201 6. Tenrec ecaudatus. The IUCN
Red List of Threatened Species 201 6: e.T40595A972041 07. Accessed 1 8
June 201 8. <http://dx.doi .org/1 0.2305/IUCN.UK.201 6-
1 .RLTS.T40595A972041 07.en>
United Nations Chi ldren’s Fund, World Health Organization, The World Bank. 201 2.
UNICEF-WHO-World Bank Joint Chi ld Malnutrition Estimates. (UNICEF, New
York; WHO, Geneva; The World Bank) Washington, DC. Avai lable onl ine
<https://www.who. int/nutgrowthdb/estimates201 2/en/>
Vences, M. , Wol lenberg, K.C. , Vietes, D. R. , Lees, D. C. 2009. Madagascar as a
model region of species diversification. Trends in Ecology & Evolution. 24,
8:456–465. <https://doi .org/1 0.1 01 6/j . tree.2009.03.01 1 >
Waeber, P.O. , Wi lmé, L. Ramamonj isoa, B. , Garcia, C. , Rakotomalala, D. , Rabem-
anananjara, Z.H. , Kul l , C.A. , Ganzhorn, J.U. , Sorg J. -P. Dry forests in Madagas-
car: neglected and under pressure. International Forestry Review 1 7(S2):
1 27–1 48. <https://doi .org/1 0.1 505/1 4655481 581 5834822>
WHO. 201 1 . Haemoglobin concentrations for the diagnosis of anaemia and as-
sessment of severity. Vitamin and Mineral Nutrition Information System.
Geneva, World Health Organization, 201 1 (WHO/NMH/NHD/MNM/1 1 .1 )
Avai lable onl ine <http://www.who. int/vmnis/indicators/haemoglobin.pdf>
WHO. 201 8. WHO Global Database on Chi ld Growth and Malnutrition. Ed. May
201 8. World Health Organization. Avai lable onl ine
<https://www.who. int/nutgrowthdb/database/en/>
Wilkie, D.S. , Wieland, M. , Boulet, H. , Le Bel , S. , van Vl iet, N. , Cornel is, D. , Briac
Warnon, V. , Nasi , R. and Fa, J.E. 201 6. Eating and conserving bushmeat in
Africa. African Journal of Ecology 54: 402–41 4.
<https://doi .org/1 0.1 1 1 1 /aje.1 2392>
Wilmé, L. , Ravokatra , M. , Dolch, R. , Schuurman, D. , Mathieu , É. , Schuetz, H. and
Waeber, P. O. 201 2. Toponyms for centers of endemism in Madagascar.
Madagascar Conservation & Development 7, 1 : 30–40.
<http://dx.doi .org/1 0.431 4/mcd.v7i1 .6>
World Bank, 201 5. Reversing the Red Sand Tide: A Cal l for New Solutions to Land
Degradation. Accessed on 1 7 Oct 201 8. <http://tiny.cc/my8fhz>
Zinner, D. , Wygoda, C. , Razafimanantsoa, L. , Rasoloarison, R. , Andrianandrasana,
H. , Ganzhorn, J. U. and Torkler, F. 201 4. Analysis of deforestation patterns in
the Central Menabe, Madagascar, between 1 973 and 201 0. Regional Envi-
ronmental Change 1 4: 1 57–1 66.
<https://doi .org/1 0.1 007/s1 01 1 3-01 3-0475-x>
SUPPLEMENTARY MATERIALTable S1 . The variation in the mean number of forest wi ld l i fe eaten
by households during the prior year between communities sur-
veyed within Ankarafantsika (201 4-201 5).
Table S2. Differences in the amount of wi ld l i fe consumed during
the prior year (201 4–201 5) within Ankarafantsika by ethnol inguistic
cultural group. (Minority ethnol inguistic groups with fewer than
twenty-five households surveyed in our study population are not
represented in this table)
MADAGASCAR CONSERVATION & DEVELOPMENT PAGE 46VOLUME 1 4 | ISSUE 01 — DECEMBER 201 9
In the recent paper by Lourenço and Wilmé (201 6), three new
species of Grosphus Simon, 1 880 were publ ished without the
Zoobank registration number. Here we add the numbers in order
to make the new taxa val id according to the International Code of
Zoological Nomenclature regulations (ICZN 201 2).
Grosphus eliseanneae sp. n.
urn: lsid:zoobank.org:act:D3E27F0F-D606-4758-8525-
04591 ABFA537
<http://zoobank.org/NomenclaturalActs/D3E27F0F-D606-4758-
8525-04591 ABFA537>
Grosphus sabineae sp. n.
urn: lsid:zoobank.org:act:E44B1 A72-3626-4C92-BD01 -
E7E22E80D422
<http://zoobank.org/NomenclaturalActs/E44B1 A72-3626-4C92-
BD01 -E7E22E80D422>
Grosphus waeberi sp. n.
urn: lsid:zoobank.org:act:A07D3CB3-0ADC-4739-ADE2-
CF2DB1 A5ABBC
<http://zoobank.org/NomenclaturalActs/A07D3CB3-0ADC-4739-
ADE2-CF2DB1 A5ABBC>
ACKNOWLEDGEMENTSWe would l ike to thank Andrea Rossi , I taly, for spotting these
detai ls and al low us to comply with the regulations of the ICZN.
REFERENCESICZN 201 2. Amendment of Articles 8, 9, 1 0, 21 and 78 of the International Code of
Zoological Nomenclature to expand and refine methods of publ ication.
ZooKeys 21 9: 1 –1 0. <http://dx.doi .org/1 0.3897/zookeys.21 9.3944>
Lourenço, W.R. , Wi lmé, L. 201 6. Three new species of Grosphus Simon 1 880,
(Scorpiones: Buthidae) from Madagascar; possible vicariant cases within
the Grosphus bistriatus group of species. Madagascar Conservation &
Development 1 1 , 2: 52–65. <http://dx.doi .org/1 0.431 4/mcd.v1 1 i2.2>
ADDENDA http://dx.doi .org.1 0431 4/mcd.v1 4i1 .2
Addenda to the article Three new species ofGrosphus Simon, 1 880, (Scorpiones: Buthidae) fromMadagascar; possible vicariant cases within theGrosphus bistriatus group of species. MadagascarConservation & Development 1 1 , 2: 52–65.
Wilson R. LourençoI, Lucienne WilméII Correspondence:
Wi lson R. Lourenço
Muséum national d’Histoire naturel le, Sorbonne Universités,
Institut de Systématique, Evolution, Biodiversité (ISYEB), UMR7205-
CNRS, MNHN, UPMC, EPHE, CP 53, 57 rue Cuvier, 75005 Paris
Emai l : wi lson. [email protected]
Citation Lourenço, W. R. and Wi lmé, L. 201 9. Addenda to the article Three new species of Grosphus Simon, 1 880, (Scorpiones: Buthidae) from Madagascar; possiblevicariant cases within the Grosphus bistriatus group of species. Madagascar Conservation & Development 1 4, 1 : 46. http://dx.doi .org.1 0431 4/mcd.v1 4i1 .2
I Muséum national d’Histoire naturel le, Sorbonne Universités, Institut de Systématique, Evolution, Biodiversité (ISYEB), UMR7205-CNRS, MNHN, UPMC, EPHE,CP 53, 57 rue Cuvier, 75005 Paris
I I Missouri Botanical Garden, Madagascar Research and Conservation Program, BP 3391 , Antananarivo 1 01 , Madagascar

MADAGASCAR CONSERVATION & DEVELOPMENT PAGE 47VOLUME 1 4 | ISSUE 01 — DECEMBER 201 9
IMPRESSUMMadagascar Conservation and Development is the journal of
Indian Ocean e-Ink. I t is owned by this institution and its
production is its own responsibi l i ty.
EDITOR-IN-CHIEF
Lucienne Wilmé [Missouri Botanical Garden, Madagascar]
EXECUTIVE EDITORS
Patrick O. Waeber [Madagascar Wi ld l i fe Conservation,
Switzerland] , Charl ie J. Gardner [University of Kent, UK], Marion
Langrand [IUCN, South Africa] , Onja H. Razafindratsima [Col lege of
Charleston, USA], Jordi Salmona [Portugal ] , Natasha Stoudmann
[ETH Zurich, Switzerland] , Erik R. Patel [Lemur Conservation
Foundation] .
EDITORIAL BOARD
Barry Ferguson [Libanona Ecology Center, Madagascar] , Al ison F.
Richard [Cambridge University & Yale University, UK], François
Moutou [French Mammal Society & French Agency for Sanitary
Security, France] , Carel van Schaik [University of Zürich,
Switzerland] , Joerg U. Ganzhorn [Biozentrum Grindel , Hamburg
University, Germany], John S. Sparks [Department of Ichthyology,
American Museum of Natural History, USA], Jonah Ratsimbazafy
[GERP, Madagascar] , Joleen Timko [The University of British
Columbia, Vancouver, Canada] , Ju l ian Glos [Biocenter Grindel &
Zoological Museum, University of Hamburg, Germany], Chris
Birkinshaw [Missouri Botanical Garden, Madagascar] , David A.
Burney [National Tropical Botanical Garden, Kalaheo, HI 96741 ,
USA], Porter P. Lowry I I [Missouri Botanical Garden] , Daniela B. Raik
[Conservation International , USA], Wi lson R. Lourenço [Muséum
national d’Histoire naturel le, France] , Frank Glaw [Zoologische
Staatssammlung München, Germany], Christian A. Kul l [Université
de Lausanne, Switzerland] , Jean-Pierre Sorg [Swiss Federal
Institute of Technology Zürich, Switzerland] , Genese Marie Sodikoff
[Rutgers University, Newark, USA], Jeffrey C. Kaufmann [University
of Southern Mississippi , USA], Justin Moat [Royal Botanic Gardens,
Kew, UK], Sandra J. T. M. Evers [Faculty of Social Sciences,
University Amsterdam, Netherlands] , Ute Radespiel [University of
Veterinary Medicine Hannover, Germany], Tsi lavo Raharimahefa
[Department of Geology University of Regina, Canada] , Nadia
Rabesahala Horning [Middlebury Col lege, Vermont, USA], Neal J.
Hockley [Bangor University, UK], Pascal Danthu [CIRAD,
Madagascar] , Paul Smith [Botanic Gardens Conservation
International , UK] , Paul ina D. Jenkins [Natural History Museum,
London, UK], Rémi A. Ratsimbazafy [Madagascar] , Jean-Solo Nirina
Ratsisompatrarivo [Madagascar] , Miguel Pedrono [CIRAD,
Madagascar] , Laurie R. Godfrey [Department of Anthropology,
University of Massachusetts, USA], Li ly-Arison Réné de Roland
[The Peregrine Fund, Madagascar] , Lolona Ramamonj isoa [Si lo
National des Graines Forestières, Madagascar] , Marie Jeanne
Raheri lalao [Vahatra, Madagascar] , Maarten J. de Wit [Nelson
Mandela Metropol i tan University, South Africa] , Melanie L. J.
Stiassny [Department of Ichthyology, American Museum of Natural
History, USA], Michel Sartori [Musée cantonal de zoologie,
Lausanne, Switzerland] , Sylvain Razafimandimbison [Swedish
Museum of Natural History, Stockholm, Sweden], Ju l ia Nowack
[University of New England, Austral ia] , Alasdair Harris [Blue
Ventures, UK], Mal ika Virah-Sawmy [Luc Hoffmann Institute,
Switzerland] , Tariq Stévart [Missouri Botanical Garden, Belgium],
Christopher Golden [Harvard T.H. Chan School of Publ ic Health,
USA]
COPYEDITORS
Derek Schuurman [UK], Christian Camara [Missouri Botanical
Garden, Madagascar] , Trevor G. Jones [University of British
Columbia, Canada] , Marion Langrand [IUCN, South Africa] , Suzi
Malan [University of British Columbia, Canada] , Arnaud De Grave
[EcoPal impsesto(Photo)Graphies, France] , Finel la Pescott [FAO,
Thai land] , Ju l ian Cooke [Anglo-Malagasy Society, UK], Carol ine
Ward [University of Leeds, UK], Natasha Stoudmann [ETH Zurich,
Switzerland]
TRANSLATIONS
Ral isa Andriamahavita [Madagascar]
Raphaël D. Chavardès [University of British Columbia, Canada]
COVER PICTURE
"Les amoureux et la bicyclette / The lover and the bicycle"
crédit : © Arnaud De Grave, EcoPal impsesto(Photo)Graphies /
Agence Le Pictorium
LAYOUT EDITOR
Arnaud De Grave [EcoPal impsesto(Photo)Graphies, France]
PRODUCTION SOFTWARE
MCD has been layouted and produced using the open-source
Scribus DTP (desktop publ ishing appl ication) – http://scribus.net
FOUNDER EDITORS
Patrick O. Waeber [Madagascar Wi ld l i fe Conservation, Switzerland]
Daniel C. Hänni [Jane Goodal l Institute Switzerland]
JOURNAL INFORMATION
Al l journal related information for authors, reviewers, readers and
sponsors is avai lable onl ine at http://www. journalmcd.com
ISSN 1 662-251 0
Madag. conserv. dev.