mact implementation at an organic chemical manufacturing facility
TRANSCRIPT

University of New OrleansScholarWorks@UNO
University of New Orleans Theses and Dissertations Dissertations and Theses
8-5-2010
MACT Implementation at an Organic ChemicalManufacturing Facility: Human Health RiskReductionKeith GordonUniversity of New Orleans
Follow this and additional works at: https://scholarworks.uno.edu/td
This Thesis is brought to you for free and open access by the Dissertations and Theses at ScholarWorks@UNO. It has been accepted for inclusion inUniversity of New Orleans Theses and Dissertations by an authorized administrator of ScholarWorks@UNO. The author is solely responsible forensuring compliance with copyright. For more information, please contact [email protected].
Recommended CitationGordon, Keith, "MACT Implementation at an Organic Chemical Manufacturing Facility: Human Health Risk Reduction" (2010).University of New Orleans Theses and Dissertations. 1222.https://scholarworks.uno.edu/td/1222

MACT Implementation at an Organic Chemical Manufacturing Facility: Human Health Risk Reduction
A Thesis
Submitted to the Graduate Faculty of the University of New Orleans in partial fulfillment of the
requirements for the degree of
Master of Science In
Engineering
Civil and Environmental Engineering
by
Keith E. Gordon
B.S. Louisiana State University, 1996
August 2010

ii
Acknowledgments
This research was performed under the employment of Lion Copolymer Geismar,
LLC. I would like to thank company management and my coworkers for their daily
support of the environmental program at the Geismar facility. I would also like to thank
Chemtura Corporation for partially funding my tuition through their Employee Tuition
Reimbursement Program.
I want to express my gratitude to Dr. Bhaskar Kura, my major professor at the
University of New Orleans, for his guidance and assistance in completing this thesis and
the ultimate goal of graduation. It has been a very rewarding journey, as my course of
studies have helped me to become a more knowledgable and valuable environmental
professional. Additional thanks to Dr. Enrique LaMotta and Dr. Patricia Williams for
serving on my thesis review committee, and providing constructive feedback in their
examination.
Lastly, I want to thank my wife, Stephanie, and my three children, Sarah, Patrick,
and Caroline. Their patience and encouragement to complete my studies, while
accepting the sacrifice of my time, demonstrate what family values truly are.

iii
Table of Contents
List of Figures ........................................................................................................ v
List of Tables ........................................................................................................ vi
Abstract ............................................................................................................... vii
Introduction .......................................................................................................... 1
Purpose of Research ........................................................................................ 1
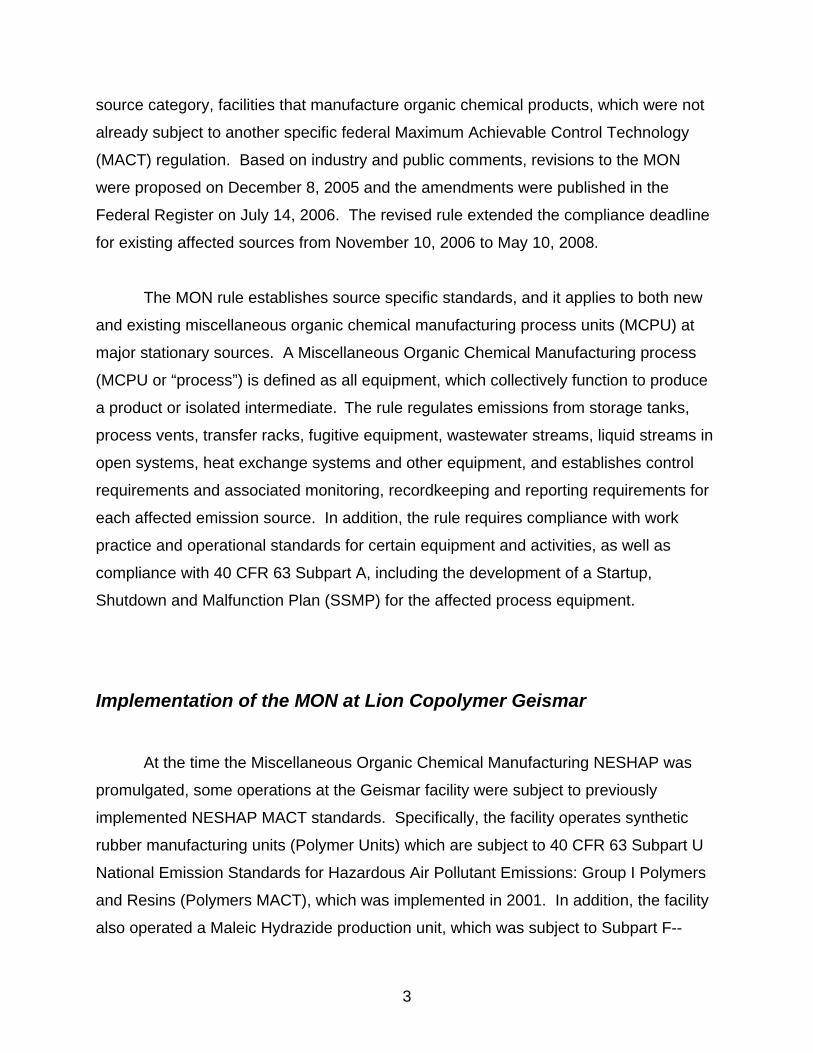
The Miscellaneous Organic Chemical NESHAP ............................................... 2
Implementation of the MON at Lion Copolymer Geismar ................................. 3
The MON Regulation ............................................................................................ 6
Applicability ....................................................................................................... 6
Control Requirements ....................................................................................... 6
MACT Implementation at the Geismar Facility ............................................... 12
Risk Assessment Methodology .......................................................................... 18
Purpose of Risk Assessments ........................................................................ 18
The Human Exposure Model (HEM-3) ........................................................... 20
Hazardous Air Pollutants ................................................................................ 24
Human Exposure Model (HEM-3) Assessments ................................................ 31
Study Methodology ......................................................................................... 31
Pre-MON Emissions 2006 .............................................................................. 35
Post-MON Emissions 2009 ............................................................................. 39
Comparison of Results ................................................................................... 42
Conclusion ......................................................................................................... 49

iv
References ......................................................................................................... 51
Appendix A MON Applicability Threshold Criteria and Control Requirements .... 53
Appendix B 2006 Emissions Data ...................................................................... 58
Appendix C 2009 Emissions Data ...................................................................... 93
Vita ................................................................................................................... 106

v
List of Figures
Figure 1 - Centrifuge Vent MON Emission Control ........................................................ 15
Figure 2 – Dual Canister Carbon Absorber System ...................................................... 17
Figure 3 - Project Scope & Objectives Flow Chart ........................................................ 32
Figure 4 - Area of Study ................................................................................................ 33
Figure 5 - 2006 HAP Emissions by Percentage ............................................................ 37
Figure 6 - 2009 HAP Emissions by Percentage ............................................................ 40
Figure 7 - Cancer Histogram ......................................................................................... 44
Figure 8 - Cancer Histogram (log scale) ........................................................................ 45
Figure 9 - Cumulative Population Cancer Histogram .................................................... 46

vi
List of Tables
Table 1: NESHAP Affected Processes ........................................................................... 5
Table 2 - Key Geismar Facility Carcinogens ................................................................. 26
Table 3 - Key Non-Cancer HAPs .................................................................................. 29
Table 4 - HEM-3 Inputs ................................................................................................. 35
Table 5 - 2006 Annual HAP Emissions ......................................................................... 36
Table 6 - 2006 Cancer Risk by Population .................................................................... 38
Table 7 - Potential Cancer Impact (per Year) by Pollutant (2006) ................................. 38
Table 8 - 2009 Annual HAP Emissions ......................................................................... 39
Table 9 - Potential Cancer Impact (per Year) by Pollutant (2009) ................................. 41
Table 10 - Cancer Risk Comparison ............................................................................. 43
Table 11 - Maximum Offsite Hazard Indices ................................................................. 47
Table 12 - 2006 Non-cancer Risk Exposure (Hazard Index) ......................................... 48
Table 13 - 2009 Non-cancer Risk Exposure (Hazard Index) ......................................... 48

vii
Abstract
Human health risk assessments are used by environmental regulatory agencies to
determine risk from Hazardous Air Pollutants (HAPs). In this study, the Human
Exposure Model (HEM-3) was used to compare the cancer and non-cancer inhalation
health effects of a single organic chemical manufacturing facility in Geismar, Louisiana
prior to and after Maximum Achievable Control Technologies (MACT) were
implemented. The results indicate significant reductions in both cancer risk and non-
cancer hazards. The analysis also indicated that the equivalent cancer risk reduction
could have been achieved by addressing MACT in only one production process and one
single pollutant (ethylene dichloride) within that process. This demonstrates the value
that these risk assessments have at evaluating emissions at the facility level, and how
they could be used in the control strategy decision making process.
KEYWORDS: Risk Assessment, Maximum Achievable Control Technology, MACT,
NESHAP, Cancer Risk, Organic Chemical Manufacturing, Inhalation, Human Exposure
Model, HEM-3

1
Introduction
Purpose of Research
The purpose of this research was to determine the inhalation health impacts of
implementation of National Emission Standards for Hazardous Air Pollutants (NESHAP)
regulations at an organic chemical manufacturing facility in Geismar, Louisiana. The
facility is regulated by the Environmental Protection Agency (EPA) and Louisiana
Department of Environmental Quality (LDEQ) under the Clean Air Act (CAA). The
Clean Air Act was originally established in 1963, giving the federal government
responsibility for air pollution control. The most dramatic change in the CAA came in
the form of the 1970 Clean Air Act Amendments. These amendments formed the
Environmental Protection Agency (EPA) and several programs for air quality standards,
most notably, the National Ambient Air Quality Standards (NAAQS), New Source
Performance Standards (NSPS), and National Emission Standards for Hazardous Air
Pollutants (NESHAP).
The original NESHAP regulations required setting pollutant specific, health based
standards for each Hazardous Air Pollutant (HAP). HAPs are those pollutants that are
hazardous to public health or the environment, but are not regulated under other
portions of the Clean Air Act. The implementation of these standards proved to be
cumbersome, and NESHAP standards were only established for nine pollutants. Title III
of the 1990 Clean Air Act Amendments brought sweeping changes to this program.
According to the CAA Amendments, HAPs “present, or may present, through inhalation
or other routes of exposure, a threat of adverse human health effects (including, but not
limited to, substances which are known to be, or may reasonably be anticipated to be,
carcinogenic, mutagenic, teratogenic, neurotoxic, which cause reproductive dysfunction,
or which are acutely or chronically toxic) or adverse environmental effects whether
through ambient concentrations, bioaccumulation, deposition, …”. The Hazardous Air
Pollutant list was then expanded to the current 188 listed chemicals. The 1990 CAA
amendments required establishment of technology based standards for source

2
categories of these listed HAPs. If a facility has a potential to emit of 10 tons per year of
an individual HAP, or an aggregate total of 25 tones per year of all listed HAPs, the site
is considered a major source of Hazardous Air Pollutants. These major sources must
determine which source category applies to their operations, and therefore which
NESHAP regulation it is subject to.
Within each NESHAP source category, the EPA has established Maximum
Achievable Control Technology (MACT) standards for major sources of HAPs. These
technology based standards are established by collecting information from regulated
facilities, including the type of emissions, emission controls, and cost of these controls.
The EPA performs a cost-health benefit analysis of these controls at the best
performing facilities (top 12%), and establishes the MACT standards by promulgating
rules applicable to these source categories.
Within 8-years after promulgation of a new MACT standard, the EPA is required
to review the residual risk associated with the regulated HAPs. If after the
implementation of the technology based standard, emissions still pose a significant
health risk to the public, further emission reductions may be required. In 2008, the
Geismar facility implemented the Miscellaneous Organic Chemical Manufacturing
NESHAP, thus reducing HAP emissions from the location. The purpose of this study is
to determine the inhalation health risk reduction that occurred from this single facility as
a result of the applicable MACT requirements. This was accomplished by utilizing EPA
approved human health risk models to determine the risk associated with Hazardous Air
Pollutant Emissions prior to and after MACT implementation.
The Miscellaneous Organic Chemical NESHAP
The Miscellaneous Organic Chemical Manufacturing NESHAP (or MON as it is
commonly termed) is codified in the US Code of Federal Regulations (CFR) under 40
CFR Part 63 Subpart FFFF. The federal regulation, which was promulgated as a final
rule in the Federal Register on November 10, 2003, was intended to capture, as a
3
source category, facilities that manufacture organic chemical products, which were not
already subject to another specific federal Maximum Achievable Control Technology
(MACT) regulation. Based on industry and public comments, revisions to the MON
were proposed on December 8, 2005 and the amendments were published in the
Federal Register on July 14, 2006. The revised rule extended the compliance deadline
for existing affected sources from November 10, 2006 to May 10, 2008.
The MON rule establishes source specific standards, and it applies to both new
and existing miscellaneous organic chemical manufacturing process units (MCPU) at
major stationary sources. A Miscellaneous Organic Chemical Manufacturing process
(MCPU or “process”) is defined as all equipment, which collectively function to produce
a product or isolated intermediate. The rule regulates emissions from storage tanks,
process vents, transfer racks, fugitive equipment, wastewater streams, liquid streams in
open systems, heat exchange systems and other equipment, and establishes control
requirements and associated monitoring, recordkeeping and reporting requirements for
each affected emission source. In addition, the rule requires compliance with work
practice and operational standards for certain equipment and activities, as well as
compliance with 40 CFR 63 Subpart A, including the development of a Startup,
Shutdown and Malfunction Plan (SSMP) for the affected process equipment.
Implementation of the MON at Lion Copolymer Geismar
At the time the Miscellaneous Organic Chemical Manufacturing NESHAP was
promulgated, some operations at the Geismar facility were subject to previously
implemented NESHAP MACT standards. Specifically, the facility operates synthetic
rubber manufacturing units (Polymer Units) which are subject to 40 CFR 63 Subpart U
National Emission Standards for Hazardous Air Pollutant Emissions: Group I Polymers
and Resins (Polymers MACT), which was implemented in 2001. In addition, the facility
also operated a Maleic Hydrazide production unit, which was subject to Subpart F--

4
National Emission Standards for Organic Hazardous Air Pollutants from the Synthetic
Organic Chemical Manufacturing Industry (HON MACT). As stated previously, the
purpose of the MON was to capture those sources which produce organic chemicals
that were not previously regulated under another NESHAP. Therefore, the production
units which were not previously covered, were required to be assessed for applicability
under the MON. Any process that meet the following general applicability criteria are
considered to be an MCPU subject to the MON (EPA 2005b):
(1) Produces an organic chemical or chemicals classified using the 1987 version of
SIC code 282, 283, 284, 285, 286, 287, 289, or 386; an organic chemical or
chemicals classified using the 1997 version of NAICS code 325; quaternary
ammonium compounds and ammonium sulfate produced with caprolactam;
hydrazine; or organic solvents classified in any of the above mentioned SIC or
NAICS codes that are recovered using non-dedicated solvent recovery
operations;
(2) Processes, uses, or produces an organic HAP; and
(3) Is not an affected source or part of an affected source under another 40 CFR part
63 subpart.
The table below lists the affected units at the Geismar facility and which NESHAP was
ultimately applicable.

5
Table 1: NESHAP Affected Processes
Affected Process Applicable NESHAP Regulation
Year of Implementation
Maleic Hydrazide Production Unit Subpart F (HON) 1995
Polymer Units Subpart U (Polymers MACT) 2001
Polymers Wastewater Treatment Subpart U (Polymers MACT) 2001
BHT Production Unit Subpart FFFF (MON) 2008
Celogen AZ Production Unit Subpart FFFF (MON) 2008
Celogen OT Production Unit Subpart FFFF (MON) 2008
Deepwell Unit Subpart FFFF (MON) 2008
Flexzone Production Unit Subpart FFFF (MON) 2008
Services & Lab areas Subpart FFFF (MON) 2008
Sulfur Recovery Unit Subpart FFFF (MON) 2008
Thiazoles Production Unit Subpart FFFF (MON) 2008
UBOB Production Unit Subpart FFFF (MON) 2008
Additionally, for those processes that met the applicability criteria of this rule, the
MON contains provisions for designating processes as either existing or new based on
the construction date of the unit. Under the MON, new processes may have control
requirements that differ from existing sources, and new processes may also be subject
to additional requirements. All processes at the Geismar site met the criteria to be
considered existing sources. Therefore, the facility proceeded with the required studies
to assess the emission points associated with MON applicable process to determine the
control requirements, if necessary, for each.

6
The MON Regulation
Applicability
Under the Miscellaneous Organic Chemical Manufacturing NESHAP (MON), an
affected source is comprised of all storage tanks, surge control vessels, bottoms
receivers, continuous process vents, batch process vents, hydrogen halide/halogen
HAP process vents, Particulate Matter (PM) HAP process vents, transfer racks, fugitive
equipment, wastewater streams, liquid streams in open systems, and heat exchange
systems that are associated with a MCPU located at a major source.
Control Requirements
The Maximum Achievable Control Technology (MACT) standards of the MON are
divided into standards for:
(1) Process vents
(2) Storage tanks
(3) Transfer operations
(4) Wastewater
(5) Equipment leaks
(6) Heat exchange systems
In each case, there are requirements for calculating emissions from these sources to
determine the emission rates, concentrations, and uncontrolled emissions if control
devices are utilized. The rule provides equations to guide the facility on how to estimate
organic HAP emissions from certain common chemical manufacturing operations.
Based on the emission rates and/or concentrations, controls may be required to reduce
HAP emissions. If an emission point also contains halogenated HAPs, and a
combustion device is selected as the control device, then the additional halogen control
requirements also apply.

7
Batch Process Vents
Batch process vents are vents from a process unit operation, through which a
HAP-containing gas stream is, or has the potential to be, released to the atmosphere.
This also includes vents from multiple unit operations within a process that are
manifolded together into a common header. Examples of batch process vents include,
but are not limited to, vents on condensers used for product recovery, reactors, filters,
centrifuges, and process tanks. For the purpose of requiring controls, batch vents are
divided into two groups.
Group 1 batch process vent means each of the batch process vents in a process
for which the collective uncontrolled organic HAP emissions from all of the batch
process vents are greater than or equal to 10,000 lb/yr at an existing source or greater
than or equal to 3,000 lb/yr at a new source. Emission points that undiluted and
uncontrolled either contain less than 50 ppm by volume HAP or that emit less than 200
pounds per year are exempted. The emission control requirements for Group 1 Batch
process vents are 98% if using a Control Device or 95% efficient Recovery Device.
Group 2 batch process vent are those batch process vents that do not meet the
definition of Group 1 batch process vent. These emission sources do not require
controls.
Continuous Process Vents
Continuous Process Vents are defined by the MON as the point of discharge to the
atmosphere (or control device, if any) of a gas stream, if it has the following
characteristics:
• Some, or all, of the gas stream originates as a continuous flow from an air
oxidation reactor, distillation unit, or reactor.
• Does not pass through any other unit operation for a process purpose
• Contains greater than 0.005 weight percent organic HAP

8
• Is discharged in the gas phase
Continuous process vents are divided into two groups. The first, Group 1 continuous
process vents, are continuous process vents for which the flow rate is greater than or
equal to 0.005 standard cubic meter per minute, and the Total Resource Effectiveness
(TRE) index value, that is less than 1.9 at an existing source and less than 5.0 at a new
source. The TRE Index is a measure of the BTU content of the stream, that is, the
capability of the stream to support combustion without an excessive quantity of
supplemental fuel. TRE is calculated using the following equations:
Equation 1 Net Heating Value
∑ −= )1)((1 WSjj BHCKHT
HT Net heating value of the sample, megaJoule per standard cubic meter,
Kl Constant, 1.74×10⁻⁷ (parts per million)-1 (gram-mole per standard cubic meter)
(megaJoule per kilocalorie)
Bws Water vapor content of the vent stream, proportion by volume
Cj Concentration on a dry basis of compound j in parts per million
Hj Net heat of combustion of compound j, kilocalorie per gram-mole, based on
combustion at 25°C and 760 millimeters mercury

9
Equation 2 Emission Rate of Total Organic Carbon (ETOC) or Hazardous Air Pollutant (EHAP)
∑= Sii QMCKE )(2
E Emission rate of TOC (minus methane and ethane) or emission rate of total
organic HAP in the sample, kilograms per hour
K2 Constant, 2.494×10⁻⁶ (parts per million)-1 (gram-mole per standard cubic meter)
(kilogram/gram) (minutes/hour)
Cj Concentration on a dry basis of organic compound j in parts per million
Mj Molecular weight or organic compound j, gram/gram-mole.
Qs Vent stream flow rate, dry standard cubic meter per minute, at a temperature of
20°C.
Equation 3 Emission Rate of Halogen Atoms
∑ ∑= ))(( ,,2 ijijij LCjMQKE
E mass of halogen atoms, dry basis, kilogram per hour.
K2 Constant, 2.494×10⁻⁶ (parts per million)-1 (kilogram-mole per standard cubic
meter) (minute/hour), where standard temperature is 20°C.
Cj Concentration of halogenated compound j in the gas stream, dry basis, parts per
million by volume.
Mji Molecular weight of halogen atom i in compound j of the gas stream, kilogram
per kilogram-mole.
Lji Number of atoms of halogen i in compound j of the gas stream.
Q Flow rate of gas stream, dry standard cubic meters per minute, determined
according to paragraph (d)(1) or (d)(2)(i) of this section.
j Halogenated compound j in the gas stream.
i Halogen atom i in compound j of the gas stream.
n Number of halogenated compounds j in the gas stream.
m Number of different halogens i in each compound j of the gas stream.

10
Equation 4 Total Resource Effectiveness (TRE)
HAP
TOCTS
EEdHcQba
TRE)()()( +++
=
TRE TRE index value.
EHAP Hourly emission rate of total organic HAP, kilograms per hour
Qs Vent stream flow rate, standard cubic meters per minute, at a standard
temperature of 20°C
HT Vent stream net heating value, megaJoules per standard cubic meter
ETOC Emission rate of TOC (minus methane and ethane), kilograms per hour
a,b,c,d Coefficients presented in table 1 of the regulation
For existing continuous process vents, the MON standard requires 98 percent
control of HAPs from vents determined to have a Total Resource Effectiveness (TRE)
Index of <1.9. As an alternative, a facility may reduce the exhaust concentration of total
organic compounds (TOCs) to 20 ppmv or less. For new continuous process vents, the
final standards require 98 percent control from vents with a TRE Index of <5.0. Group 2
continuous process vent are continuous process vent that do not meet the definition of a
Group 1 continuous process vent. These emission sources do not require controls.
Storage Tanks
The MON regulation defines a storage tank as a tank or other vessel used to
store organic liquids that contain one or more HAP as raw material feed stocks.
Storage tank also means a tank or other vessel in a tank farm that receives and
accumulates used solvent from multiple batches of a process or processes for purposes
of solvent recovery. Group 1 storage tanks are those storage tanks with a capacity
greater than or equal to 10,000 gal storing material that has a maximum true vapor
pressure of total HAP greater than or equal to 6.9 kilopascals at an existing source or
greater than or equal to 0.69 kilopascals at a new source. Subject tanks must either
operate a floating roof or control HAP emissions by at least 95 percent. A Group 2

11
storage tank is a storage tank that does not meet the definition of a Group 1 storage
tank, which does not require controls.
Transfer Operations
The MON defines a transfer rack as the collection of loading arms and loading
hoses, at a single loading rack, that are assigned to an MCPU, and are used to fill tank
trucks or rail cars with organic liquids that contain one or more organic HAP. The
transfer rack also includes all associated pumps, meters, shutoff valves, relief valves,
and other piping and valves. Group 1 transfer racks are those that load more than 0.65
million liters/year of liquids that contain organic HAP with a rack-weighted average
partial pressure greater than or equal to 1.5 pound per square inch absolute. Group 1
transfer operations must utilize a vapor balance line or a 98% efficient control device.
Group 2 transfer rack means those that not meet the definition of a Group 1 transfer
rack, which do not require controls.
Wastewater
Any wastewater streams meeting the Group 1 criteria listed in the MON regulations
is classified as an “affected wastewater stream” and must utilize vapor suppression and
closed conveyance system through final treatment or disposal. There are 3 allowable
treatment standards under the MON regulation.
1. Reduce the maximum concentration to less than 50 ppm.
2. Treat the wastewater to reduce the concentration by the required percent
reduction values listed in the MON regulation.
3. Install a “design steam stripper” that meets the MON design requirements.
All other wastewaters from an affected MCPU are considered Group 2 wastewater
streams and do not require controls.
12
Equipment Leaks
Potential fugitive sources of HAPs, such as pumps, valves, connectors, and
open-ended lines, are subject to the MON rule if it is in >5 percent HAP service for more
than 300 hours per year. All affected components must be monitored on a regular
prescribed schedule and leaks repaired within the required time frame. A leak is
defined as 2,000 ppm of THC from pumps and 10,000 ppm from agitators.
Heat Exchange Systems
For heat exchange systems, a monitoring program must be implemented to
detect and repair leaks into the cooling water.
MACT Implementation at the Geismar Facility
In early 2005, the Geismar Facility commenced intensive efforts to determine the
impacts that the new MON rule would have on the facility. The obvious concern was
the capital expenditures required to meet the Maximum Achievable Technology (MACT)
requirements that would be required to be implemented for existing emission sources.
All equipment associated with the affected MON processes, which are BHT
Production Unit, Celogen AZ Production Unit, Celogen OT Production Unit, Deepwell
Unit, Flexzone Production Unit, Services & Lab areas, Sulfur Recovery Unit, Thiazoles
Production Unit, UBOB Production Unit, and certain MH batch process vents, were
reviewed during the affected equipment identification step of the MON evaluation. The
type of equipment reviewed included continuous process vents, batch process vents,
hydrogen halide/halogen HAP process vents, storage tanks, surge control vessels,
bottoms receivers, transfer racks, sampling connection systems, process and
maintenance wastewater, liquid streams in open systems, and heat exchange systems.
Overall, the facility took the steps detailed below to determine MON applicability.

13
1. Determine the Group status for each process vent, batch vent, storage tank and
transfer rack
• Vents where sufficient information was not available were designated as
Group 1
• If calculations did not meet the requirements of the MON rule, new
calculations were developed based on the equations described in the rule
2. Evaluated Group 1 emissions vented to air pollution control device (APCD)
• Performance test, design evaluation, or calculate controlled emissions
• Establish operating limits for parameter monitoring
3. Wastewater treatment units
• Performance test or design evaluation
• Collected data on wastewater to determine the Group status
4. Initial inspections
• Floating roofs, closed-vent systems
The Geismar facility completed a preliminary review of the MON affected
processes in 2006, determining that significant emission control upgrades would be
required primarily in the Flexzone Production Unit, UBOB Production Unit, Thiazoles
Unit, and Celogen OT Production Unit. Capital cost estimates were made based on
various options to meet the MACT requirements. Initial capital expenditure estimations
indicated that the upgrades would total 9 to 10 million dollars for all affected processes.
At the time, many of these production units were antiquated and profitability for the
products was below expectations. Ultimately, the decision was made to cease
operations in certain production units and sell the facility to a new owner.
Over the next few years, the Geismar facility ceased process operations in the
Celogen AZ, B9, BHT, Maleic Hydrazide, Flexzone, Thiazoles, and UBOB Units. Under
the new owner, the Celogen OT, Celogen AZ, and Deepwell Units continued operations
and MACT controls implemented where applicable.

14
The Celogen OT Unit was affected most significantly, requiring emissions
controls for a few sources in the process, as well as implementation of a Leak Detection
and Repair program to monitor and repair fugitive emission leaks, in compliance with
MON requirements. The HAPs associated with this production unit include ethylene
dichloride, hydrazine (as hydrazine hydrate), and hydrogen chloride. The centrifuge
vent for this process was determined to be a continuous batch process vent requiring
MACT controls for the hazardous air pollutant ethylene dichloride. Under the MON rule,
the facility had the option to implement controls that would render the emission source
exempt from the requirement by limiting the HAP concentration to 50 ppmv or 200 lbs
per year of HAPs. Otherwise, the facility would be required to implement a 99 percent
efficient control device or 95 percent efficient recovery device. The facility opted to
control the emissions to below 50 ppmv by use of a control scheme involving a steam
eductor, condenser, and absorption system. The schematic of the system is shown in
the figure below.

15
Centrifuge
Carbon CanistersEductor
To Atmospher
Condenser
To Filter Tank
Refrigerate water supply
Ref Water Return
Steam Eductor
Figure 1 - Centrifuge Vent MON Emission Control
The purpose of the steam eductor is to pull a vacuum on the centrifuge vent,
aiding in the volatilization of the organic HAP contained in the product being centrifuged.
After passing through the steam eductor, pressure is increased, and the stream vents
through a heat exchanger, which condenses water vapor and organic HAPs.
Condensers are typical devices used to control volatile organic compounds (VOCs) in
chemical manufacturing facilities. Condensers are best applied for control of VOCs and
HAPs when concentration or above 5000 ppmv (Schnelle 2002). At these
concentrations, typical efficiencies can run between 50 to 90 percent. The emission
stream from the centrifuge vent contained lower concentrations of ethylene dichloride

16
and studies indicated that the condenser alone would not meet the control requirements
under the MON.
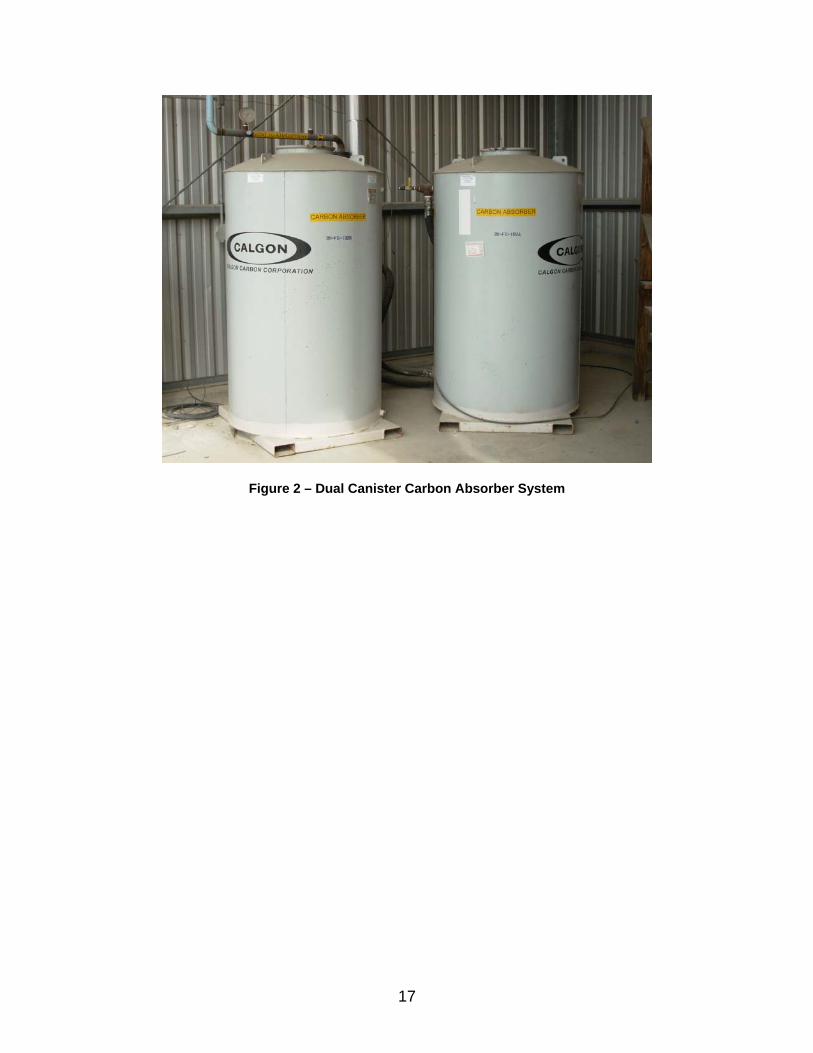
To meet the 50 ppmv exiting concentration requirement, the organic HAP laden
stream was routed to two activated carbon absorption canisters arranged in series.
Carbon absorption involves to the use of granular or pelletized activated carbon which is
brought into contact with the gaseous hydrocarbon vent stream. The activated carbon
is manufactured by carbonization of an organic material, typically coconut shell, wood,
or coal, then “activated” by oxidation using hot air or steam. The principle behind
carbon absorption is that attractive forces between the atoms, molecules, and ions in
the activated carbon are unsatisfied at the surface and therefore attract the hydrocarbon
molecules in the vent gas. As stated previously, there were two canisters, which were
installed in series. This orientation reduces the potential for break-through of ethylene
dichloride. The system is monitored using a Flame Ionization Detector (FID) weekly to
measure the concentration of VOCs prior to, between, and after the carbon canisters.
By performing these tests, the canisters can be replaced before break-though of the
second canister occurs. The activated carbon is then sent off-site for regeneration. The
figure below is a photograph of the activated carbon canisters in use.
17
Figure 2 – Dual Canister Carbon Absorber System

18
Risk Assessment Methodology
Purpose of Risk Assessments
Humans are exposed every day to various concentrations of natural and artificial
chemical substances. Although many of these substances can be toxic at high
concentrations, typical public exposures are below the concentrations where acute
deleterious effects are obvious. However, the potential for long-term cumulative effects,
and the identification of these adverse effects has driven environmental regulatory
agencies to perform health risk assessments of hazardous air pollutants.
For the purposes of this study, risk assessment is defined as the qualitative or
quantitative evaluation of the inhalation health risk resulting from exposure to hazardous
air pollutants. Risk assessments are used by environmental regulatory agencies to
estimate the probability that exposure to these pollutants will produce an adverse health
effect on the surrounding population. These assessments can be use to drive the
development of regulations, for which the purpose is to protect the public, or evaluate
the effectiveness of current policies. Risk assessment typically includes one or more of
the following components:
• Chemical Hazard Identification The hazards of each chemical to be assessed must be identified as the first step
in the risk assessment. This process may include identifying and describing
carcinogen and non-carcinogen health effects.
• Dose Response Assessment Dose response assessment is a central component of the quantitative risk
assessment procedure. This process comprises estimating the environmental
concentration of a contaminant, and accounting for human characteristics such

19
as body weight and behavior (e.g., the amount of time spent in a specific
location, which affects exposure duration) (Rajkumar, 2000).
• Exposure Assessment In this process, the ground level concentrations of each hazardous pollutant must
be estimated to determine the exposure to the affected local area. There are
over 70 tools that can be used to gather the information and to perform risk
assessments (Barzyk 2009). These include online databases, web-based
geographic information systems (GIS), and human exposure computer models.
• Risk Characterization
In this step, the relevant information developed as part of the previous steps is
integrated and the risks are quantified.
For criteria pollutants, available ambient monitoring data from a central outdoor
monitoring station has been historically used in air pollution epidemiology studies. For
example, the LDEQ operates four ambient air quality monitoring stations in the Geismar
area. These stations measure ozone, volatile organic compounds (VOCs), nitrogen
oxides (NOx), and particulate matter, but do not measure HAPs. Although monitoring is
generally recognized as providing a more reliable estimate of exposure, it carries its
own limitations, such as cost for implementing on a large population scale over long
periods of time to estimate long-term exposures (Payne-Sturgis, 2004). This is
exceeding true for the monitoring of individual hazardous air pollutants, therefore most
regulating agencies only have limited monitoring data on HAP compounds. In most
cases, air modeling is utilized to predict ground level concentration of these chemical to
use in the risk assessment methodology.
There is a degree of uncertainty, specifically when utilizing modeling data or the
purposes of risk assessment. The U.S. Environmental Protection Agency (EPA 1992)
has classified uncertainty in exposure assessment into three broad categories:
20
(1) Uncertainty regarding missing or incomplete information needed to fully define
exposure and dose (scenario uncertainty);
(2) Uncertainty regarding some factor influencing the exposure (parameter
uncertainty); and
(3) Uncertainty regarding gaps in scientific theory required in making predictions on
the basis of causal inferences (model uncertainty).
As stated earlier, air modeling is utilized to determine ambient concentrations of
hazardous air pollutants, because it would simply be impractical to perform wide scale
sampling of personnel exposure for affected communities. Plume dispersion models
are designed to capture local pollutant concentration gradients (e.g., within a few
kilometers from the source) and can provide detailed resolution of the spatial variations
in hourly average concentrations. These models have their limitations, using many
assumptions to derive data. In some studies, direct exposure monitoring studies were
performed and compared with modeling results obtained using EPA approved methods.
Payne-Sturgis et al demonstrated that the EPA’s ASPEN model sufficiently estimated
exposures for certain VOCs in an urban community, but substantially underestimated
exposures or other chemicals (Payne-Sturgis, 2004). When combining risks associated
with multiple contaminants, this uncertainty could result in an overall underestimation of
the health risks posed to the public.
The Human Exposure Model (HEM-3)
Human Exposure Model-3 is a Windows based software program distributed by the
EPA to perform streamlined, but rigorous, health risk assessments for air pollution
emissions. It was originally developed in 1986 and was updated in 2002 to the current
version in use. The model is generally used for a complex industrial facility or a
localized cluster of facilities. The three main functions of HEM-3, which will be
discussed further, are:

21
• Dispersion Modeling
• Estimation of Population Exposure
• Estimation of Human Health Risks
Dispersion Modeling
HEM-3 has the ability to utilize two common dispersion modeling software, AERMOD
and the Industrial Source Complex – Short Term (ISCST3), to determine the fate and
transport of modeled pollutants. The user is given the option to select either of these
dispersion models during the input phase of the program. ISCST utilizes a steady state
Gaussian plume dispersion, which assumes a normal distribution in the vertical and
horizontal directions. AERMOD utilizes advanced algorithms for calculation of
dispersion, plume rise, buoyancy , and the effects of complex terrain. In 2005, the EPA
deemed AERMOD as the replacement to the ISC model. Typical inputs for these
models include:
• Location of sources
• Source Type
• Dimensions of Source (Area and Volume sources)
• Stack Characteristics (diameter, velocity, temperature)
• Release height
• Receptor locations
• Meteorological parameters
• Topography
In a study performed by Silverman et al, the two models were compared in respect to
human health risk assessments. They determined in that study that ISC3 tended to
predict higher air concentrations nearer the modeled site than AERMOD (Silverman,
2007). In addition, the maximum ground level concentration was higher using the ISC
model. The magnitude of differences differed depending on the types of sources and
site specific conditions.

22
Estimation of Population Exposure
Upon completing the appropriate modeling, the HEM-3 program identifies the Census
block locations within the selected modeling area. The most current Census data
(2000) is used to estimate the population affected by the model.
Estimation of Human Health Risks
The final step in the model is the calculation of human health risk. The HEM-3
software estimates the cancer and non-cancer health effects due to inhalation exposure
to hazardous air pollutants. Risk assessors commonly refer to potential harm from
exposure to carcinogens as “risk” and non-carcinogens as “hazards” (Silverman, 2007).
Cancer risks are estimated using the EPA established unit risk estimate (URE) for
that particular HAP. URE is an upper-bound estimate of the probability of contracting
cancer over a 70-year period for continuous exposure to an agent at a concentration of
1 μg/m3 in air, neglecting other factors. The interpretation of inhalation unit risk would
be as follows: if unit risk = 2 × 10⁻⁶ per µg/m3, 2 excess cancer cases (upper bound
estimate) are expected to develop per 1,000,000 people if exposed daily for a lifetime to
1 µg of the chemical per m3 of air (EPA 2010). The following equations are used by
HEM-3 to calculate the cancer risk for receptors.
Equation 5 - Total Cancer Risk
∑= jijiT CRCR ,,
Equation 6 - Cancer Risk for Source & Pollutant
[ ]∑ ×××= kkikjiji UREECFDFCR ,,,

23
CRT total cancer risk at a given receptor (probability for one person)
Σi, j the sum over all sources i and pollutant types j (particulate or gas)
CRi, j cancer risk at the given receptor for source i and pollutant type j
DFi, j dilution factor [(μg/m ) / (g/sec)] at the given receptor for source i and
pollutant type j
CF conversion factor, 0.02877 [(g/sec) / (ton/year)]
Σk sum over all pollutants k within pollutant group j (particulate or gas)
Ei, k emissions of pollutant k from source i
UREk cancer unit risk factor for pollutant k
The estimates provided reflect the risk of developing cancer for an individual
breathing the ambient air at a given receptor site 24-hours per day for 70-years. The
standard factors used in determining a URE are a 70 kilogram male with an air intake of
20 cubic meters per day. The probability of developing cancer of one chance in 10,000
is written as 1 x 10⁻⁴. EPA cites an acceptable risk range of 1 x 10⁻⁴ to 1 x 10⁻⁶ for
potential cancer risk (NRC, 1994).
Non-cancer health effects are quantified in HEM-3 using hazard quotients and
hazard indices for the various human target organs. The hazard quotient for a given
chemical and receptor site is the ratio of the ambient concentration of the chemical to
the level at which no adverse effects are expected. The hazard index for a given organ
is the sum of hazard quotients for the substances that affect that organ. Reference
Concentrations (RfC) are the basis for these calculations shown below. The RfC is
defined as an estimate of daily or continuous exposure to the human population
(including sensitive subgroups) that is likely to be without an appreciable risk of
deleterious effects during a lifetime (U.S. EPA 1999a). The value of the RfC is derived
by determining a point of departure divided by uncertainty factors (UFs), which are used
to account for uncertainties in the available studies, such as limitations in the database,
variability within humans, and differences in species response (i.e., animal-to-human
extrapolation) (Castorina, 2003). Therefore the uncertainty may increase the RfC by an
order of magnitude.

24
Equation 7 - Total Organ Specific Hazard Index
∑= jijiT HIHI ,,
Equation 8 - Organ Specific Hazard Index for Source & Pollutant
∑
××=
k
kikjiji RfC
ECFDFHI ,
,,
HIT total organ-specific hazard index at a given receptor and for a given organ
Σi, j the sum over all sources i and pollutant types j (particulate or gas)
DFi, j dilution factor [(μg/m ) / (g/sec)] at the given receptor for source i and
pollutant type j
CF conversion factor, 0.02877 [(g/sec) / (ton/year)]
Σk sum over all pollutants k within pollutant group j (particulate or gas)
Ei, k emissions of pollutant k from source i
HIi, j organ-specific hazard index at the given receptor for source i and pollutant
type j
RfCk noncancer health effect reference concentration for pollutant k
Hazardous Air Pollutants
Carcinogen HAPs
Cancer describes a group of related diseases that affect a variety of organs and
tissues in the human body. Cancer results from a combination of genetic damage and
non-genetic factors that favor the growth of damaged cells. The U.S. EPA’s 2005
Guidelines for Carcinogen Risk Assessment (U.S. EPA, 2005a) provides guidance on
hazard identification for carcinogens. The approach recognizes three broad categories
of data: (1) human data (primarily epidemiological); (2) results of long-term experimental
animal bioassays; and (3) supporting data, including a variety of short-term tests for
genotoxicity and other relevant properties. In hazard identification of carcinogens under

25
the 2005 guidelines, the human data, animal data, and "other" evidence are combined
to characterize the weight of evidence regarding the agent’s potential as a human
carcinogen into one of several hierarchic categories (U.S. EPA, 2005a):
Group A (human carcinogen): These are HAPs compounds for which human data are
sufficient to demonstrate a cause and effect relationship between exposure and cancer
incidence (rate of occurrence) in humans.
Group B (probable human carcinogen):
• Group B1: These are HAPs compounds for which limited human data suggest
a cause and effect relationship between exposure and cancer incidence (rate of
occurrence) in humans.
• Group B2: These are HAPs compounds for which animal data are sufficient to
demonstrate a cause-and-effect relationship between exposure and cancer
incidence (rate of occurrence) in animals, and human data are inadequate or
absent.
Group C (possible human carcinogen): These are HAPs compounds for which
animal data are suggestive to demonstrate a cause-and-effect relationship between
exposure and cancer incidence (rate of occurrence) in animals.
Group D (not classifiable as to human carcinogenicity): These are HAPs
compounds for which human and animal data are inadequate to either suggest or refute
a cause-and effect relationship for human carcinogenicity.
Group E (evidence of non-carcinogenicity): These are HAPs compounds for which
animal data are sufficient to demonstrate the absence of a cause-and-effect relationship
between exposure and cancer incidence (rate of occurrence) in animals.

26
Table 2 - Key Geismar Facility Carcinogens
Pollutant CAS No. Carcinogen
Classification URE RFC
(mg/m3)
1,3-Butadiene 106-99-0 B2 0.00003 0.002
Acetaldehyde 75-07-0 B2 2.2E-06 0.009
Aniline 62-53-3 B2 1.6E-06 0.001
Benzene 71-43-2 A 7.8E-06 0.03
Ethylene dichloride 107-06-2 B2 0.000026 2.4
Formaldehyde 50-00-0 B1 5.5E-09 0.0098
Naphthalene 91-20-3 C 0.000034 0.003
Ethylene Dichloride Ethylene Dichloride, also known commonly as 1,2-dichlorothane, is a chlorinated
hydrocarbon liquid used in industry as an industrial solvent in cleaning and extraction
processes. At the Geismar facility is used as a solvent in the Celogen OT production
process. Emissions occur from the volatilization of the chemical in process vessels,
storage tank, equipment and fugitive leaks. This is the primary HAP that was
addressed as part of the MON rule emission control improvements. Exposure to
ethylene dichloride may result in irritation to the eyes, throat and nose. The symptoms
of exposure include central nervous system depression and gastrointestinal upset.
Chronic exposures may result in damage to the kidney, liver, and adrenals. This
chemical is listed as a probable human carcinogen.

27
Aniline Aniline is a liquid that was utilized in the facility’s Thiazoles process. It is toxic by
ingestion, inhalation, or by skin contact. Aniline damages hemoglobin in the blood,
which in turn reduces the body’s ability to transport oxygen in the blood stream
(ATSDR, 2010).
Benzene Benzene is a contaminant of Toluene, which was used in several production
units at the facility. It is an aromatic hydrocarbon, which is a liquid at room temperature.
Benzene is rapidly absorbed through the lungs; approximately 50% of the benzene in
air is absorbed (ATSDR, 2010). At low exposure levels, benzene is rapidly
metabolized and excreted predominantly as conjugated urinary metabolites.
Napthalene Naphthalene is a white hydrocarbon solid that evaporates easily. Fuels such as
petroleum and coal contain naphthalene. Exposure to large amounts of naphthalene
may damage or destroy red blood cells (ATSDR, 2010)
Acetaldehyde Acetaldehyde is an aldehyde compound, which was a byproduct in production
processes at the Geismar Facility. It has been listed as a probable human carcinogen
due to inhalation carcinogenicity in animal studies.
1,3-Butadiene 1,3-Butadiene is a highly volatile hydrocarbon used at the facility. Effects on the
nervous system and irritations of the eyes, nose, and throat have been seen in people
who breathed contaminated air. Breathing lower levels may cause irritation of the eyes,
nose, and throat (ATSDR, 2010).

28
Formaldehyde Formaldehyde is a common contaminant in many products and raw materials. At room
temperature, formaldehyde is a colorless, hydrocarbon gas with a distinct pungent odor.
Low levels of formaldehyde can cause irritation of the eyes, nose, throat, and skin. It is
possible that people with asthma may be more sensitive to the effects of inhaled
formaldehyde (ATSDR, 2010)
Non-Carcinogenic HAPs
Cancer is commonly used in risk assessment modeling and allows comparisons
of risk estimates among compounds, however non-cancer risks also are used in
modeling and include reproductive, neurotoxic, cardio, respiratory, and numerous other
deleterious effects. The calculation for non-cancer hazards is driven primarily by the
reference concentration (RfC). The table blow lists the major non-cancer HAPs at the
Geismar facility and their respective RfCs.

29
Table 3 - Key Non-Cancer HAPs
Pollutant CAS Number RFC (mg/m3) Target Organs 1,3-Butadiene* 106-99-0 0.002 Reproductive
Acetaldehyde* 75-07-0 0.009 Respiratory
Aniline* 62-53-3 0.001 Spleen
Benzene* 71-43-2 0.03 Immunological
Ethyl Chloride 75-00-3 10 Developmental
Ethylene dichloride* 107-06-2 2.4 Kidney
Formaldehyde* 50-00-0 0.0098 Respiratory
Hydrochloric acid 7647-01-0 0.02 Respiratory
Methanol 67-56-1 4.0 Developmental
Methyl Chloride 74-87-3 0.09 Neurological
Methyl Isobutyl Ketone 108-10-1 3.0 Developmental
Naphthalene* 91-20-3 0.003 Respiratory
n-Hexane 110-54-3 0.7 Neurological, Respiratory
Toluene 108-88-3 5.0 Respiratory, Neurological
* indicates pollutants with carcinogenic effects as well
n-Hexane n-Hexane is an aliphatic hydrocarbon that is a liquid at room temperature. The Geismar
facility uses large amounts of hexane isomer as a solvent, which n-hexane is a
component.
Toluene Toluene is an aromatic hydrocarbon used as a solvent in many processes at the
Geismar facility. Toluene will typically affect the nervous system if over-exposed. Low
to moderate exposure levels can cause tiredness, confusion, weakness, drunken-type
actions, memory loss, nausea, loss of appetite, and hearing, and color vision loss
(ATSDR, 2010).
30
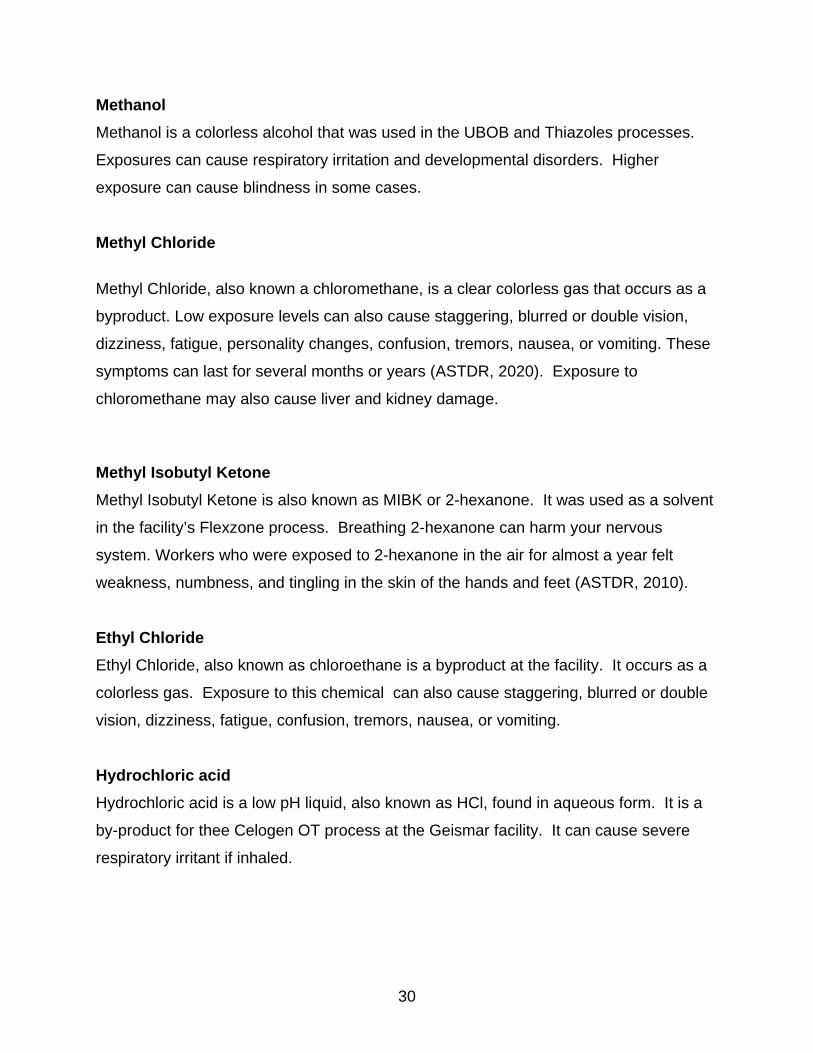
Methanol Methanol is a colorless alcohol that was used in the UBOB and Thiazoles processes.
Exposures can cause respiratory irritation and developmental disorders. Higher
exposure can cause blindness in some cases.
Methyl Chloride
Methyl Chloride, also known a chloromethane, is a clear colorless gas that occurs as a
byproduct. Low exposure levels can also cause staggering, blurred or double vision,
dizziness, fatigue, personality changes, confusion, tremors, nausea, or vomiting. These
symptoms can last for several months or years (ASTDR, 2020). Exposure to
chloromethane may also cause liver and kidney damage.
Methyl Isobutyl Ketone Methyl Isobutyl Ketone is also known as MIBK or 2-hexanone. It was used as a solvent
in the facility’s Flexzone process. Breathing 2-hexanone can harm your nervous
system. Workers who were exposed to 2-hexanone in the air for almost a year felt
weakness, numbness, and tingling in the skin of the hands and feet (ASTDR, 2010).
Ethyl Chloride Ethyl Chloride, also known as chloroethane is a byproduct at the facility. It occurs as a
colorless gas. Exposure to this chemical can also cause staggering, blurred or double
vision, dizziness, fatigue, confusion, tremors, nausea, or vomiting.
Hydrochloric acid Hydrochloric acid is a low pH liquid, also known as HCl, found in aqueous form. It is a
by-product for thee Celogen OT process at the Geismar facility. It can cause severe
respiratory irritant if inhaled.

31
Human Exposure Model (HEM-3) Assessments
Study Methodology
As stated in early, the purpose of this research was to determine the inhalation
health impacts of implementation of MON NESHAP regulations at an organic chemical
manufacturing facility in Geismar, Louisiana. This was accomplished by:
• Identifying the applicable regulatory requirements of the MON rule and the
steps taken to implant the control requirements at the facility.
• Compiling the hazardous air pollutant (HAP) emissions data a representative
year prior to MON implementation and the year following completion of the
MON implementation.
• Assess the human health exposure risks for both years utilizing the Human
Exposure Model (HEM-3) software provided by the EPA.
• Evaluate the change in risk and hazard between the two years to determine
the residual risk and subsequent reduction.
As with any assessment it is critical to define the steps and milestones that must be
achieved to meet the overall purpose of the study. Each of the steps followed in this
study are described in the following paragraphs.
1. Define Scope and Objectives: The critical first step in a health risk assessment
should be defining the scope and objective required to meet the goal of the
study. The purpose is to narrowly define the scope so that it is not overly broad
and each objective is attainable. The following figure demonstrates the
organization and objectives of the study.

32
Point SourcesArea Sources Volume Sources
Consolidate Releases to Air
Conduct Air Modeling
Direct Inhalation Exposure
Toxicity Data (RfC, URE)
Risk calculated for individual
chemicals
Census Data
Meteorological Data
Risk calculated across all chemicals
Identify Sources
Identify Exposure Pathway
Determine Concentration
Calculate Exposures
Individual Chemical Risk
Cumulative Risk
Figure 3 - Project Scope & Objectives Flow Chart
2. Select Assessment Facility/Sources: The purpose of this study is to determine
the impacts of the MON rule on the inhalation risk associated with emissions
from the Geismar Facility. Therefore, the scope of this project was limited to the
individual facility, and does not include other site in the vicinity. As the Geismar
facility is in an industrial complex in an industrial area, expanding the coverage to
other facilities would also expand the study beyond the original scope. The
sources that are involved in this study are limited to those emitting hazardous air
pollutants. All 188 regulated HAPs may be affected by the MON regulation,
therefore the decision was made to include all HAP emission sources from the

33
facility. In addition, by including all HAPS, the study can gain perspective on the
total cumulative residual risk associated with the facility.
3. Define Assessment Area: The area within a 50 kilometer (approximately 31
mile) radius surrounding the Geismar facility was the area selected for the study.
Figure 4 - Area of Study
4. Emission/Source Characterization: Collecting the emission source data for
each source is one of the most important and intensive steps in the risk
assessment process. The characteristics of each source must be input and
verified to ensure accuracy in the plume dispersion model. In this study, existing
information on the facility emission sources was manipulated into an Excel file to
match the format required by the HEM-3 software. All of the information was
verified and additional information collected and input into the file.

34
5. Compiling Emission Data: Emissions data must be compiled in a spreadsheet
to input into HEM-3. Annually, major sources of criteria pollutants and hazardous
air pollutant are required by the LDEQ to submit emissions estimates for the
previous calendar year. This information is compiled in a database, which can
be used to perform modeling associated with air quality permitting. The
submitted information was used to populate the spreadsheet for use in the
model. As with the source information, much of the data required manipulation to
meet the required criteria for the model, such as metric unit, formats, etc. To
determine the overall change in risk from Pre-MON conditions to Post-MON
conditions, the pre-MON year was established as 2006 and the post-MON year
was established as 2009.
6. Verify & Correct Source Locations: Although much care is taken to establish
the location of each emission source, inevitably there are errors in data entry.
The latitude and longitudes are input into the HEM-3 software within the emission
source data file. Within the software, the user can preview the source locations
on a map to determine if there are source location errors in the file. After review
of the maps, numerous latitude/longitude entries required correction.
7. Execute HEM-3 Model: After all of the input files have been verified, the HEM-3
model can be run. The user selects the options based on the type of
assessment desired. The parameters selected for each model run are described
in the table below.

35
Table 4 - HEM-3 Inputs
Parameter Input Reasoning
Dispersion
Model
AERMOD AERMOD is considered “state of the art” and is the
current EPA accepted model
Dispersion
Environment
Rural The facility is located in a rural area and did not meet
the criteria for “urban”.
Acute
Calculations
No The facility does not have measured lb/hr emission
rates, only calculated maximum, which may not be
representative of actual operations.
PM Deposition No There were no particulate matter (PM) HAP assessed
during this study
Plume Depletion No There was insufficient information available to
determine this parameter.
Max Radius 50 KM This distance proved sufficient to capture adverse
health affects within the population.
MET Data Baton Rouge, LA - surface
Slidell, LA – upper air
This meteorological data represented the closest
stations to the facility (38 mi, 113, mi respectively)
Census Data 2000 Census The 2000 Census represents the most current data
8. Evaluate Outputs: After the model is run, HEM-3 delivers output files and
screens quantifying the results of the risk assessment. Much of this data is
presented in the tables and figures in the following sections. The output data
from the individual years was evaluated for cumulative and individual chemical
risks and hazards. The cumulative data was compared between the two
representative years to determine the residual risk associated with the facility
HAP emissions and the subsequent risk reduction.
Pre-MON Emissions 2006
The calendar year 2006 was selected to represent the Pre-MON rule emissions
at the Geismar facility because none of the MON control improvements, nor any major
production unit shut-downs, had occurred. The following table details the major

36
hazardous air pollutant emissions from the facility during this year. “Others” includes
numerous additional HAPs whose annual emissions were below .5 tons per year.
Table 5 - 2006 Annual HAP Emissions
Pollutant Emissions (tons/year)
n-Hexane 217.55
Toluene 59.80
Methanol 21.37
Ethylene Dichloride 13.81
Methyl Chloride 8.31
Methyl Isobutyl Ketone 7.65
Aniline 5.68
Ethyl Chloride 3.26
Hydrochloric acid 2.59
Others 7.94
As illustrated in the chart below, the majority of HAPs, approximately 62.5
percent are comprised of n-hexane. Although these emissions were not associated with
Mon applicable production units, the emissions were included in this study to ensure
that the non-cancer hazard assessment was representative of the total HAP emissions
from the facility.

37
2006 HAP Emissions
n-Hexane62.5%
Toluene17.2%
Aniline1.6%
Methyl Isobutyl Ketone2.2%
Methyl Chloride2.4%
Ethylene Dichloride4.0%
Methanol6.1%
Ethyl Chloride0.9%
Hydrochloric acid0.7%
Others2.3%
Figure 5 - 2006 HAP Emissions by Percentage
The outputs of the HEM-3 software were evaluated for cancer and non-cancer
risks. The following table details the cancer risk associated with carcinogen HAP
emissions in the area of the study. The model indicates that a total 72, 651 people in
the area have some degree of cancer risk. Because there are numerous sources in the
area that may contribute to these effects, the actual risk may be significantly higher than
indicated.

38
Table 6 - 2006 Cancer Risk by Population
Cancer Risk (2006) Population Greater than or equal to 1 in 1,000 -
Greater than or equal to 1 in 10,000 -
Greater than or equal to 1 in 20,000 -
Greater than or equal to 1 in 100,000 -
Greater than or equal to 1 in 1,000,000 228
Greater than or equal to 1 in 10,000,000 72,423
To determine which hazardous air pollutants were contributing to the cancer risk,
the following table was extracted from the HEM-3 outputs. As can be seen, Ethylene
Dichloride is the major contributor, over 98 percent, of the total cancer risk.
Coincidentally, this is the HAP that was most affected by the MON and required
installation of additional emission controls to meet the MACT standards.
Table 7 - Potential Cancer Impact (per Year) by Pollutant (2006)
Pollutant Number of Cases Per Year All modeled pollutants 5.40E-04
Ethylene Dichloride 5.30E-04
Aniline 1.30E-05
Benzene 3.80E-06
Naphthalene 9.60E-10
Acetaldehyde 5.60E-10
1,3-Butadiene 3.70E-10
Formaldehyde 2.10E-12
Additionally, a cancer histogram was generated to demonstrate the population
affected and their respective cancer risk. As can be seen in the following figure, the
bulk of the population falls into the 4.0 x 10⁻⁸ to 1.0 x 10⁻⁸ range.

39
2006 Cancer Risk Histogram
0
20,000
40,000
60,000
80,000
100,000
120,000
140,000
160,000
1.0E-06 7.0E-07 4.0E-07 1.0E-07 7.0E-08 4.0E-08 1.0E-08 7.0E-09 4.0E-09 1.0E-09
Cancer Risk
Popu
latio
n
Post-MON Emissions 2009
The 2009 calendar year was selected to represent post-MON conditions at the
Geismar facility. As required in the MON rule, all MACT controls were in place and
operation in May 2008. Because only approximately half of the year were MON
affected controls in place, 2009 was most representative. In addition, the numerous
production unit shut-downs had been completed at that time. The table below details
the annual emissions from the facility during this year.
Table 8 - 2009 Annual HAP Emissions
Pollutant Emissions(tons/year)
n-Hexane 263.50
Ethylene Dichloride 3.82
Ethyl Chloride 3.18
Toluene 0.44
Others 0.06

40
As can be seen in the following figure, n-hexane again represents the majority of
the HAPs emitted. Compared with the chart from the 2006 emissions, it is obvious that
with the numerous process unit shut-downs, many of the HAPs previously listed are no
longer shown on the emissions inventory. The emissions from n-hexane, which
previously accounted for 62.5 percent of the total HAP emissions, now account for over
97 percent. While ethylene dichloride emissions now account for 14 percent, versus 4
percent, of HAP emissions, the facility actually effected a 72% total annual emission
reduction of this pollutant from 2006 to 2009. This is largely due to MON MACT controls
implemented in 2008.
2009 HAP Emissions
n-Hexane97.2%
Ethylene Dichloride1.4%
Ethyl Chloride1.2%
Toluene0.2%
Others0.0%
Figure 6 - 2009 HAP Emissions by Percentage

41
Again, for the 2009 calendar year, the outputs of the HEM-3 software were
evaluated for cancer and non-cancer risks. The following table details the cancer risk
associated with carcinogen HAP emissions in the area of the study. The model
indicates that a total 3,897 people in the area have some degree of cancer risk.
Cancer Risk (2009) Population Greater than or equal to 1 in 1,000 -
Greater than or equal to 1 in 10,000 -
Greater than or equal to 1 in 20,000 -
Greater than or equal to 1 in 100,000 -
Greater than or equal to 1 in 1,000,000 -
Greater than or equal to 1 in 10,000,000 3,897
To determine which hazardous air pollutants were contributing to the cancer risk,
the following table was extracted from the HEM-3 outputs. As can be seen, Ethylene
Dichloride again is the major contributor, over 99.7 percent, of the total cancer risk.
Therefore the cancer risk is driven almost entirely from ethylene dichloride emissions.
Table 9 - Potential Cancer Impact (per Year) by Pollutant (2009)
Pollutant Number of Cases Per Year All modeled pollutants 1.40E-04
Ethylene Dichloride 1.40E-04
p-Dichlorobenzene 4.60E-09
Benzene 4.70E-07
Naphthalene 9.20E-10
Acetaldehyde 5.30E-10
1,3-Butadiene 3.70E-10
Formaldehyde 2.10E-12

42
The cancer histogram was generated again for 2009 to demonstrate the
population affected and their respective cancer risk. As can be seen in the following
figure, the bulk of the population falls primarily in the 1.0 x 10⁻⁸ range.
2009 Cancer Risk Histogram
0
50,000
100,000
150,000
200,000
250,000
300,000
1.0E-06 7.0E-07 4.0E-07 1.0E-07 7.0E-08 4.0E-08 1.0E-08 7.0E-09 4.0E-09 1.0E-09
Cancer Risk
Popu
latio
n
Comparison of Results
As stated in previous sections, the purpose of this study was to evaluate the
change in risk and hazard between the two years to determine the residual risk and
subsequent reduction. The two key elements that were compared are the cancer risk for
cancer effects and the hazard indices for non-cancer effects.
As indicated in the following table, when comparing the total population with
cancer risk, the models indicate a 94.6 percent reduction in at-risk population. This can
be attributed to the significant reduction in ethylene dichloride, which was the main
driver for cancer risk in the models.

43
Table 10 - Cancer Risk Comparison
Cancer Risk
Population
Percent Reduction
2006 Pre-MON
2009 Post-MON
Greater than or equal to 1 in 1,000 - - 0%
Greater than or equal to 1 in 10,000 - - 0%
Greater than or equal to 1 in 20,000 - - 0%
Greater than or equal to 1 in 100,000 - - 0%
Greater than or equal to 1 in 1,000,000 228 - 100%
Greater than or equal to 1 in 10,000,000 72,423 3,897 94.6%
Total 72,651 3,897 94.6%
The histograms for each year were combined in the following figure to illustrate
the shift in cancer risk to a lower probability. As indicated, the mean shifts from the 4.0
x 10-8 to 1.0 x 10⁻⁸ range down to most of the population at or below 1.0 x 10⁻⁸ in 2009.

44
Cancer Risk Histogram
0
50,000
100,000
150,000
200,000
250,000
300,000
1.0E-06 7.0E-07 4.0E-07 1.0E-07 7.0E-08 4.0E-08 1.0E-08 7.0E-09 4.0E-09 1.0E-09
Cancer Risk
Popu
latio
n
2006
2009
Figure 7 - Cancer Histogram

45
Cancer Risk Histogram (log scale)
1
10
100
1,000
10,000
100,000
1,000,000
10,000,000
1.0E-06 7.0E-07 4.0E-07 1.0E-07 7.0E-08 4.0E-08 1.0E-08 7.0E-09 4.0E-09 1.0E-09
Cancer Risk
Popu
latio
n
2006
2009
Figure 8 - Cancer Histogram (log scale)

46
Cumulative Cancer Risk Histogram
0
100,000
200,000
300,000
400,000
500,000
600,000
700,000
800,000
1.0E-06 7.0E-07 4.0E-07 1.0E-07 7.0E-08 4.0E-08 1.0E-08 7.0E-09 4.0E-09 1.0E-09
Cancer Risk
Popu
latio
n
2006
2009
Figure 9 - Cumulative Population Cancer Histogram

47
Non-cancer risks were evaluated using the Hazard Index. Hazard indexes are
collated in HEM-3 for various toxicological effects, such as respiratory, liver,
neurological, developmental, reproductive, kidney, immunological, and spleen. As
indicated in the table below, the emission reductions resulted in significant reduction in
the maxim hazard indices that the model calculated.
Table 11 - Maximum Offsite Hazard Indices
Parameter
2006 Hazard Index
2009 Hazard Index
Percent Reduction
Total hazard index - chronic 68 0.39 99%
Respiratory HI 63 0.39 99%
Liver HI 0.032 0.0042 87%
Neurological HI 0.4 0.39 3%
Developmental HI 0.064 0.0049 92%
Reproductive HI 0.0021 0.000082 96%
Kidney HI 0.0021 0.000081 96%
Immunological HI 0.11 0.09 18%
Spleen HI 27 0 100%
Whole body HI 0.043 0 100%
The table above lists the maximum calculated Hazard Indices by toxicological
effect. The cumulative total index for each is listed in the table below. As can be seen,
the emissions were not significant enough to place any value on these risks.

48
Table 12 - 2006 Non-cancer Risk Exposure (Hazard Index)
level
Greater than or equal to 100
Greater than or equal to 50
Greater than or equal to 10
Greater than or equal to 1.0
Greater than or equal to 0.5
Greater than or equal to 0.2
Chronic HI 0 0 0 0 0 0 Respiratory HI 0 0 0 0 0 0 Liver HI 0 0 0 0 0 0 Neurotoxicity HI 0 0 0 0 0 0 Developmental HI 0 0 0 0 0 0 Reproductive HI 0 0 0 0 0 0 Kidney HI 0 0 0 0 0 0 Ocular HI 0 0 0 0 0 0 Endocrine HI 0 0 0 0 0 0 Hematological HI 0 0 0 0 0 0 Immunological HI 0 0 0 0 0 0 Skeletal HI 0 0 0 0 0 0 Spleen HI 0 0 0 0 0 0 Thyroid HI 0 0 0 0 0 0 Whole Body HI 0 0 0 0 0 0
Table 13 - 2009 Non-cancer Risk Exposure (Hazard Index)
level
Greater than or equal to 100
Greater than or equal to 50
Greater than or equal to 10
Greater than or equal to 1.0
Greater than or equal to 0.5
Greater than or equal to 0.2
Chronic HI 0 0 0 0 0 0 Respiratory HI 0 0 0 0 0 0 Liver HI 0 0 0 0 0 0 Neurotoxicity HI 0 0 0 0 0 0 Developmental HI 0 0 0 0 0 0 Reproductive HI 0 0 0 0 0 0 Kidney HI 0 0 0 0 0 0 Ocular HI 0 0 0 0 0 0 Endocrine HI 0 0 0 0 0 0 Hematological HI 0 0 0 0 0 0 Immunological HI 0 0 0 0 0 0 Skeletal HI 0 0 0 0 0 0 Spleen HI 0 0 0 0 0 0 Thyroid HI 0 0 0 0 0 0 Whole Body HI 0 0 0 0 0 0

49
Conclusion The National Emission Standards for Hazardous Air Pollutants (NESHAP) is the
guiding regulation by which the EPA reduces public health risks associated with
hazardous air pollutants (HAPs). This is accomplished by regulating various different
industries, thus requiring the installation of Maximum Achievable Control Technologies
(MACT). As can be seen by the review of the MON rule, these NESHAP are often very
rigorous and prescriptive. In the case of the MON, applicability is over numerous
industry sectors, and the requirements cover nearly all of the 188 HAPs listed in the
Clean Air Act.
In the case of the Geismar facility, the MON rule was one of several contributing
factors in the ultimate decision to cease operations in affected production units. In the
Celogen OT unit, the implemented controls resulted in a 72 % decrease in ethylene
dichloride emissions. This in turn correlated to a 73.5 % decrease in cancer risk (by
population affected). As shown in the HEM-3 outputs, ethylene dichloride also
accounted for over 98% of the cancer risk in both comparison years. Therefore, it can
be surmised that if MON controls had been implemented in the other units that eased
operations, it would have had negligible effects on the facility’s cancer risk.
For non-cancer hazards, the cumulative chronic hazard indices were negligible in
both comparison years, therefore it is difficult to determine the overall non-cancer
hazard reduction that may have resulted from the emission changes. However, thee
maximum offsite impacts indicate several probability reductions near or above 90%, so
it can be postulated that there is likely a significant reduction in toxicity hazards overall.
Unfortunately, there is still a great deal of uncertainty associated with the
process. This includes uncertainty in the exposure / dose relationship, air modeling,
data validity, and the myriad of assumptions that are made throughout the process.
However, the these assessments have demonstrated their worth in aiding in the

50
planning of environmental regulations and policies. Through this study, the following
recommendation can be made:
• The authority having jurisdiction (EPA or LDEQ, should continue its efforts
to model inhalation exposure to hazardous air pollutant for heavily
industrialized areas.
• The results of this modeling can determine the risks that can be accepted
and those that must be reduced. For example, a modeled area may be
high in cancer risk and respiratory Hazard Index. Therefore, the agency
would address the chemical associated with these toxicological effects in
that local area.
• Facilities can then be classed as major or minor sources based on their
contribution to these effects. Facility level studies could be performed to
determine the need to implement MACT controls for specific HAPs.
• Work must continue on comparison analysis of modeling versus ambient
air quality monitoring. Efforts should continue to ensure that the
dispersion modeling programs are as accurate as possible.
Overall, the Human Health Risk Assessment is a valuable tool that can continue to be
developed and utilized by policy makers to ensure that the appropriate health concerns
are addressed and funds are allocated to value-added emission reduction projects.

51
References
1. Agency for Toxic Substances and Disease Registry: Toxic Substance Portal,
http://www.atsdr.cdc.gov/substances/index.asp (June 2010)
2. Barzyk, T. M., K.C. Conlon, T. Chahine, D.M. Hammond, V.G. Zartarain, B.D.
Schultz, Tools Available to Communities for Conducting Cumulative Exposure
and Risk Assessments, Journal of Exposure Science and Environmental
Epidemiology, 0:1-14, (2009)
3. Castorina, R., T.J. Woodruff, Assessment of Potential Risk Levels Associated
with U.S. Environmental Protection Agency Reference Values, Environmental
Health Perspectives, Volume 111:1318-1325, (2003)
4. Cooper, C.D., F.C. Alley, Air Pollution Control, (2002)
5. Integrated Risk Information System (IRIS): IRIS Glossary
http://www.epa.gov/iris/help_gloss.htm, (March 2010)
6. Lioy, P.J. “Assessing total human exposure to contaminants,” Environ. Sci. &
Technol. 24, 938-945, (1990),
7. Mohan, R., G.S. Leonardi, A. Robbins, S. Jefferis, J. Coy, J. Wright, V. Murray,
Evaluation of Methodologies for Exposure Assessment to Atmospheric Pollutants
from a Landfill Site, Journal of Air & Waste Management Association, Volume 59
(April 2009)
8. National Research Council, Science and Judgement in Risk Assessment;
National Academies: Washington, DC, (1994)
9. Payne-Sturges, D.C., T.A. Burke, P. Breysse, M. Diener-West, T. J. Buckley,
Personal Exposure Meets Risk Assessment: A Comparison of Measured and
Modeled Exposures and Risks in an Urban Community, Environmental Health
Perspectives, Volume 112:589-598, (2003)
10. Rajkumar, T., H.W. Guesgen, S. Robinson, G.W. Fisher, A New Dose Model for
Assessment of Health Risk Due to Contaminants in Air, Journal of Air & Waste
Management Association, Volume 50, (January 2000)

52
11. Schnelle, K.B and Charles A. Brown, Air Pollution Control Technology Handbook,
CRC Press, (2002)
12. Silverman, K.C., J.G. Tell, E.V. Sargent, Z. Qiu, Comparison of the Industrial
Source Complex and AERMOD Dispersion Models: Case Study for Human
Health Risk Assessment, Journal of Air & Waste Management Association,
Volume 57 (December 2007)
13. U.S. Environmental Protection Agency, Guidelines for Carcinogen Risk
Assessment (2005). U.S. Environmental Protection Agency, Washington, DC,
EPA/630/P-03/001F, (2005a)
14. U.S. Environmental Protection Agency, Guidelines for Exposure Assessment.
Federal Register 57(104):22888-22938, (1992)
15. U.S. Environmental Protection Agency. 40 Code of Federal Regulations (CFR)
63 Subpart FFFF (2005b)
16. U.S. Environmental Protection Agency. Risk Assessment Guidelines; (1986).

53
Appendix A MON Applicability Threshold Criteria
and Control Requirements

54
Affected Source
Type Applicability
Thresholds/Requirements Control Requirements
Group 1 Storage Tank and Surge Control Vessel/Bottoms Receiver meeting Group 1 Storage Tank definition
The maximum true vapor pressure of total HAP at the storage temperature is >76.6 kilopascals (11.1 psi) and the capacity of the vessel is > 10,000 gallons.
Reduce total HAP emissions by >95 percent by weight or to < 20 ppmv of TOC or organic HAP and < 20 ppmv of hydrogen halide and halogen HAP by venting emissions through a closed vent system to any combination of control devices (excluding a flare); or Reduce total organic HAP emissions by venting emissions through a closed vent system to a flare; or
Reduce total HAP emissions by venting to a fuel gas system or process in accordance with 40 CFR 63.982(d).
Group 1 Storage Tank and Surge Control Vessel/Bottoms Receiver meeting Group 1 Storage Tank definition (cont.)
The maximum true vapor pressure of total HAP at storage temperature is <76.6 kilopascals (11.11 psi) and the capacity of the vessel is > 10,000 gallons.
Comply with the requirements of 40 CFR 63, Subpart WW, except as specified in 40 CFR 63.2470; or Reduce total HAP emissions by > 95 percent by weight or to <20 ppmv of TOC or organic HAP and <20 ppmv of hydrogen halide and halogen HAP by venting emissions through a closed vent system to any combination of control devices (excluding a flare); or Reduce total organic HAP emissions by venting emissions through a closed vent system to a flare; or Reduce total HAP emissions by venting emissions to a fuel gas system or process in accordance with 40 CFR 63.982(d).
Group 1Continuous Process Vent
NA Reduce emissions of organic HAP by > 98 weight-percent or to an outlet process concentration < 20 ppmv as organic HAP or TOC by venting emissions through a closed-vent system to any combination of control devices (except a flare); or
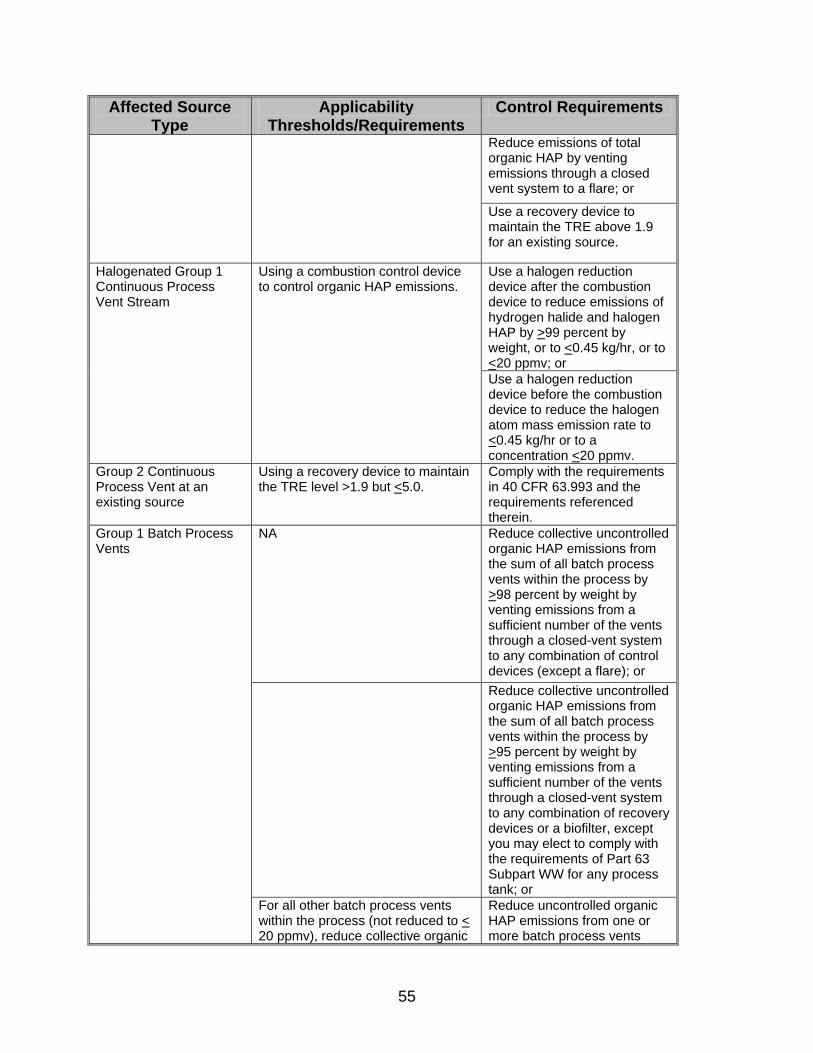
55
Affected Source Type
Applicability Thresholds/Requirements
Control Requirements
Reduce emissions of total organic HAP by venting emissions through a closed vent system to a flare; or
Use a recovery device to maintain the TRE above 1.9 for an existing source.
Halogenated Group 1 Continuous Process Vent Stream
Using a combustion control device to control organic HAP emissions.
Use a halogen reduction device after the combustion device to reduce emissions of hydrogen halide and halogen HAP by >99 percent by weight, or to <0.45 kg/hr, or to <20 ppmv; or Use a halogen reduction device before the combustion device to reduce the halogen atom mass emission rate to <0.45 kg/hr or to a concentration <20 ppmv.
Group 2 Continuous Process Vent at an existing source
Using a recovery device to maintain the TRE level >1.9 but <5.0.
Comply with the requirements in 40 CFR 63.993 and the requirements referenced therein.
Group 1 Batch Process Vents
NA Reduce collective uncontrolled organic HAP emissions from the sum of all batch process vents within the process by >98 percent by weight by venting emissions from a sufficient number of the vents through a closed-vent system to any combination of control devices (except a flare); or
Reduce collective uncontrolled organic HAP emissions from the sum of all batch process vents within the process by >95 percent by weight by venting emissions from a sufficient number of the vents through a closed-vent system to any combination of recovery devices or a biofilter, except you may elect to comply with the requirements of Part 63 Subpart WW for any process tank; or
For all other batch process vents within the process (not reduced to < 20 ppmv), reduce collective organic
Reduce uncontrolled organic HAP emissions from one or more batch process vents

56
Affected Source Type
Applicability Thresholds/Requirements
Control Requirements
HAP emissions by > 98 percent by weight using a control device or by > 95 percent by weight using a recovery device.
within the process by venting through a closed-vent system to a flare or by venting through a closed-vent system to any combination of control devices (excluding a flare) that reduce organic HAP to an outlet concentration < 20 ppmv as TOC or total organic HAP.
Halogenated Group 1 Batch Process Vent
Using a halogen reduction device after the combustion control device; or
Reduce overall emissions of hydrogen halide and halogen HAP by >99 percent; or Reduce overall emissions of hydrogen halide and halogen HAP to <0.45 kg/hr; or Reduce overall emissions of hydrogen halide and halogen HAP to a concentration <20 ppmv.
Using a halogen reduction device before the combustion control device.
Reduce the halogen atom mass emission rate to <0.45 kg/hr or to a concentration <20 ppmv.
Hydrogen Halide and Halogen Halide Process Vents – uncontrolled emissions >1,000 lb/yr.
NA Reduce collective hydrogen halide and halogen HAP emissions by >99 percent by weight or to an outlet concentration <20 ppmv by venting through a closed-vent system to any combination of control devices; or. Reduce the halogen atom mass emission rate emission rate from the sum of all batch process vents and each individual continuous process vent to < 0.45 kg/hr by venting through one or more closed-vent system to a halogen reduction device.
Group 1 Transfer Rack NA Reduce emissions of total organic HAP by >98 percent by weight or to an outlet concentration <20 ppmv as organic HAP or TOC by venting emissions through a closed-vent system to any combination of control devices (except a flare); or Reduce emissions of total organic HAP by venting emissions through a closed-vent system to a flare; or

57
Affected Source Type
Applicability Thresholds/Requirements
Control Requirements
Reduce emissions of total organic HAP by venting emissions to a fuel gas system or process in accordance with 40 CFR 63.982(d); or Use a vapor balancing system designed and operated to collect organic HAP vapors displaced from tank trucks and railcars during loading and route the collected HAP vapors to the storage tank from which the liquid being loaded originated or to another storage tank connected by a common header.
Equipment in organic HAP service
NA Comply with the requirements of 40 CFR Subpart UU; or Comply with the requirements of 40 CFR Subpart H; or Comply with the requirements of 40 CFR 65 Subpart F.
Process Wastewater Stream
NA Comply with the requirements in 40 CFR 63.132 through 63.148 and the requirements referenced therein, except as specified in 40 CFR 63.2485.
Maintenance Wastewater Stream
NA Comply with the requirements in 40 CFR 63.105 and the requirements referenced therein, except as specified in 40 CFR 63.2485.
Liquid Streams in an Open System within an MCPU.
NA Comply with the requirements in 40 CFR 63.149 and the requirements referenced therein, except as specified in 40 CFR 63.2485.
Heat Exchange Systems NA Comply with the requirements of 40 CFR 63.104 and the requirements reference therein, except as specified in 40 CFR 63.2490.

58
Appendix B 2006 Emissions Data

59
Source ID
Source type (P=point, A=area, V=volume) Source name Pollutant
Emissions (tons/year)
R0003 A 2053 Inventory Tank Ethyl Chloride 0.179003 n-Hexane 0.0468745
R0004 A 2054 Equalization Tank n-Hexane 0.0468745 Ethyl Chloride 0.179003
R0006 A 2056 Flocculation Tank n-Hexane 0.00091 Ethyl Chloride 0.0037925
R0007 A 2057 Dissolved Air Floatation Unit n-Hexane 5.8520255 Ethyl Chloride 2.540929
R0012 A 2063 Sludge Holding Tank Ethyl Chloride 0.0098605
R0014 A 2066 Effluent Lift Station Sump Ethyl Chloride 0.001517
R0015 A 2067 Influent Lift Station Sump n-Hexane 0.0018205 Ethyl Chloride 0.006068
R0069 P "B" Dryer Baghouse Collector Vent Hydrochloric acid 0.003415
R0070 P "A" Dryer Baghouse Collector Vent Hydrochloric acid 0.003415
R0075 P Hydrogen Chloride Scrubber Hydrochloric acid 0.0012545 Hydrochloric acid 0.0001395

60
Source ID
Source type (P=point, A=area, V=volume) Source name Pollutant
Emissions (tons/year)
R0077 P Solid Recovery Tank Hydrochloric acid 0.001365
R0087 P 400 -EDC Storage Tank Ethylene Dichloride 0.22946
R0090 P 408 -Celogen OT/BHT Cooling Tower Cresols (mixed) 0.0179915 Toluene 0.007881
Methyl isobutyl ketone 0.110339
Acetonitrile 0.066726 Ethylene Dichloride 0.0192385
R0091 P 7003 -CSA Storage Tank Hydrochloric acid 0.0025445
R0092 P 25-Maleic Anhydride Storage Tank Maleic anhydride 0.02344
R0110 P 2905-Cummins Diesel Fire Pump Acrolein 0.0000095 Benzene 0.0000955 Xylenes (mixed) 0.000029 Toluene 0.000042 1,3-Butadiene 0.000004 Naphthalene 0.0000085 Formaldehyde 0.000121 Acetaldehyde 0.0000785
R0111 P 2906-Detroit Diesel Fire Pump Xylenes (mixed) 0.0000045 Benzene 0.000015 Acetaldehyde 0.000012
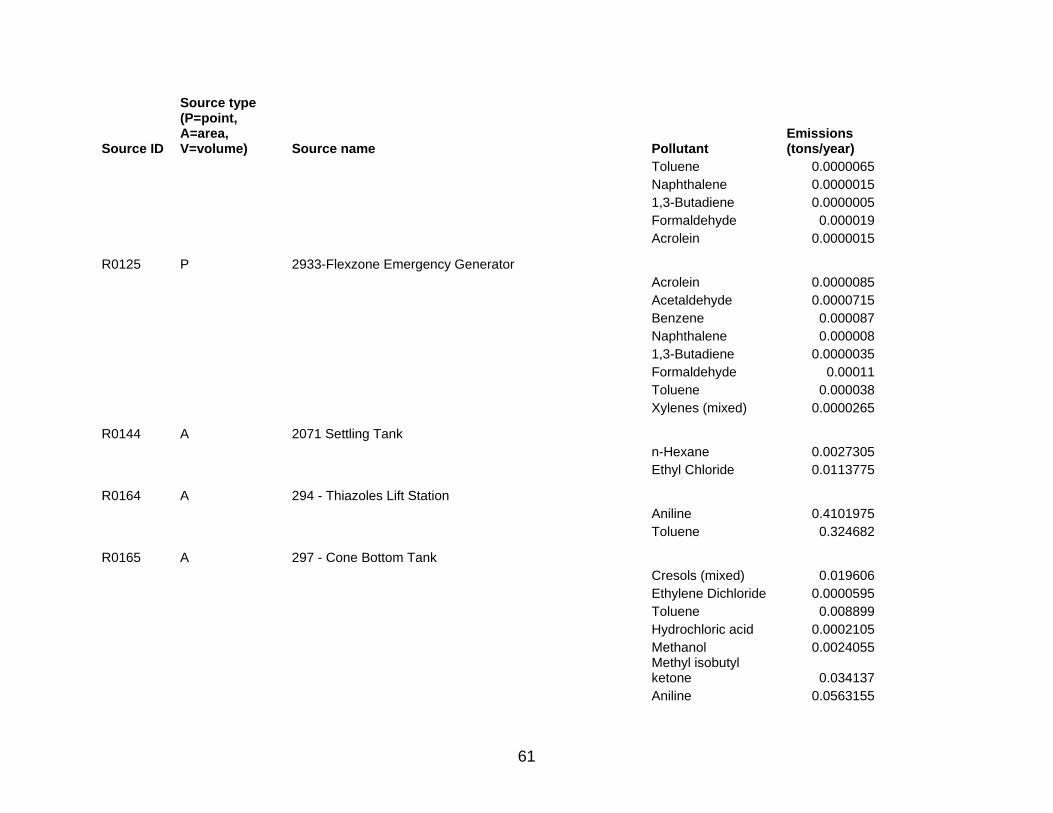
61
Source ID
Source type (P=point, A=area, V=volume) Source name Pollutant
Emissions (tons/year)
Toluene 0.0000065 Naphthalene 0.0000015 1,3-Butadiene 0.0000005 Formaldehyde 0.000019 Acrolein 0.0000015
R0125 P 2933-Flexzone Emergency Generator Acrolein 0.0000085 Acetaldehyde 0.0000715 Benzene 0.000087 Naphthalene 0.000008 1,3-Butadiene 0.0000035 Formaldehyde 0.00011 Toluene 0.000038 Xylenes (mixed) 0.0000265
R0144 A 2071 Settling Tank n-Hexane 0.0027305 Ethyl Chloride 0.0113775
R0164 A 294 - Thiazoles Lift Station Aniline 0.4101975 Toluene 0.324682
R0165 A 297 - Cone Bottom Tank Cresols (mixed) 0.019606 Ethylene Dichloride 0.0000595 Toluene 0.008899 Hydrochloric acid 0.0002105 Methanol 0.0024055
Methyl isobutyl ketone 0.034137
Aniline 0.0563155

62
Source ID
Source type (P=point, A=area, V=volume) Source name Pollutant
Emissions (tons/year)
Acetonitrile 0.0040325
R0166 A 298 - Emergency Surge Tank Methanol 0.020023 Toluene 0.0643105 Ethylene Dichloride 0.0004 Aniline 0.9038255 Acetonitrile 0.0269755 Hydrochloric acid 0.0053185 Cresols (mixed) 0.350163
Methyl isobutyl ketone 0.260719
R0167 A 299 - Hold Tank Hydrochloric acid 0.0029895 Acetonitrile 0.056663
Methyl isobutyl ketone 0.5005805
Methanol 0.033928 Ethylene Dichloride 0.000862 Cresols (mixed) 0.2792125 Aniline 0.8064905 Toluene 0.1303595
R0168 A 300 - Hold Tank
Methyl isobutyl ketone 0.5005805
Hydrochloric acid 0.0029895 Toluene 0.1303595 Acetonitrile 0.056663 Cresols (mixed) 0.2792125 Ethylene Dichloride 0.000862 Methanol 0.033928

63
Source ID
Source type (P=point, A=area, V=volume) Source name Pollutant
Emissions (tons/year)
Aniline 0.8064905
R0169 A 301 - Decanter Acetonitrile 0.0044495 Cresols (mixed) 0.028731 Toluene 0.010116 Methanol 0.0028645 Hydrochloric acid 0.000335 Ethylene Dichloride 0.000066
Methyl isobutyl ketone 0.0396295
Aniline 0.0803015
R0170 A 305 - Clear Water Tank Ethylene Dichloride 0.000086 Hydrochloric acid 0.0003755 Aniline 0.0949015 Toluene 0.0131055 Cresols (mixed) 0.033518
Methyl isobutyl ketone 0.0507535
Methanol 0.00365 Acetonitrile 0.00584
R0171 A 306 - Lift Station Aniline 0.1765935
Methyl isobutyl ketone 0.994208
Methanol 0.012167 Toluene 1.2479745 Acetonitrile 0.0306955 Ethylene Dichloride 0.0023745 Hydrochloric acid 0.0005005

64
Source ID
Source type (P=point, A=area, V=volume) Source name Pollutant
Emissions (tons/year)
Cresols (mixed) 0.053743
R0181 P 05 - Aniline Storage Tank Vent Aniline 0.006421
R0183 P 103 - Thiazoles Flare Carbon disulfide 0.000122 Hydrogen sulfide 0.001025 Carbon disulfide 0.0078705 Aniline 0.0001005 Methanol 0.0005165
R0184 P 164 - Hydrocarbon Scrubber Toluene 0.2822
R0191 P 9002 - Cooling Tower Hydrogen sulfide 0.26 Carbon disulfide 0.04 Toluene 0.044
R0192 P 9004 - Filter Vacuum Pump Toluene 0.390468
R0193 A 9005 - Hypochlorite Tanks Chlorine 0.1322185 Hydrochloric acid 0.002282
R0196 P 9009 - Sodium Hypochlorite Weigh Tank Hydrochloric acid 0.001141
R0197 P 9010 - Sodium Hypochlorite Weigh Tank Hydrochloric acid 0.001141
R0198 P 9011 - NaMBT Storage Tank Toluene 0.1849525

65
Source ID
Source type (P=point, A=area, V=volume) Source name Pollutant
Emissions (tons/year)
R0199 P 9012 - Crude NaMBT Storage Tank Toluene 0.218926
R0200 P 9014 - NaMBT Storage Tank Toluene 0.2355715
R0201 P 9015 - NaMBT Storage Tank Toluene 0.1743055
R0202 P 9016 - MOM Slurry Tank Toluene 0.489412
R0203 P 9017 - NaMBT Intermediate Storage Tank Toluene 0.0922995
R0204 P 9018 - NaMBT Storage Tank Toluene 0.0850465
R0205 P 9019 - NaMBT Storage Tank Toluene 0.0850465
R0206 P 9020 - MOM Reactors Toluene 0.290527
R0207 P 9021 - NaMBT Storage Tank Toluene 0.111616
R0208 P 9023 - NaMBT Treatment Mixer Toluene 0.014813
R0210 P 9025 - MOM Effluent Filter Tank Toluene 0.0279725
R0215 P 9030 - 25% NaMBT Storage Toluene 0.0415745
R0216 P 9031 - NaMBT Storage

66
Source ID
Source type (P=point, A=area, V=volume) Source name Pollutant
Emissions (tons/year)
Toluene 0.07293
R0223 P 21 - Paracresol Storage Tank Cresols (mixed) 0.010313
R0225 P 23 - Acetonitrile Storage Tank Acetonitrile 0.0550455
R0226 P 72 - Recovered Organics Receiver Cresols (mixed) 0.001778
R0231 P 127A - Absorption Column Acetonitrile 0.154715
R0232 P 216 - Organic Still Vacuum Vent Cresols (mixed) 0.00277
R0235 A 219 - Sump Acetonitrile 0.004
R0237 P 3001 - UDMH Storage Condenser/Scrubber
1,1-Dimethylhydrazine 0.003273
R0239 P 9032-Vent Scrubber/condenser Toluene 0.091761 Hydrogen sulfide 0.001357 Toluene 0.2787755 Hydrogen sulfide 0.002855 Toluene 0.091761 Toluene 0.091761 Toluene 0.091761 Hydrogen sulfide 0.002855 Hydrogen sulfide 0.005445 Hydrogen sulfide 0.002855 Hydrogen sulfide 0.002855

67
Source ID
Source type (P=point, A=area, V=volume) Source name Pollutant
Emissions (tons/year)
R0241 P 46 - Poly II Sample Collection Vent Stack n-Hexane 15.889066
R0242 A 48 - Poly I Wash Tank Sump 1 Ethyl Chloride 0.048543 n-Hexane 0.005006
R0243 P 50 -Poly I Sample Collection Vent Stack n-Hexane 14.4658995
R0244 A 52 - Poly II Wash Tank Sump 1 n-Hexane 0.0068265 Ethyl Chloride 0.0629545
R0245 P 53 - Finishing II Dewatering Screen/Press Combined Vent n-Hexane 3.924306
R0246 A 54 - Finishing I Recycle Water Sump n-Hexane 0.00084
R0247 P 55 - Finishing II Dryer A Zone 1 Vent n-Hexane 4.0183635
R0248 P 58 - Finishing II Dewatering Screen/Press Combined Vent n-Hexane 3.924306
R0249 A 59 - Finishing II Recycle Water Drum n-Hexane 0.00072
R0250 P 60 - Finishing II Dryer B Zone 1 Vent n-Hexane 4.0183635
R0251 P 61 - Finishing II Dryer B Zone 2 Vent n-Hexane 0.9326935
R0252 P 65 - Additive Storage Tank

68
Source ID
Source type (P=point, A=area, V=volume) Source name Pollutant
Emissions (tons/year)
n-Hexane 0.40733
R0253 P 66 - Additive Storage Tank n-Hexane 0.203665
R0254 P 67 - Dry Hexane Storage Tank Condenser n-Hexane 0.209545
R0255 A 68 - Poly I Gel Floc Dewatering Screen Sump 2 n-Hexane 0.023935
R0256 A 69 - Poly II Filter Box Screen for PV-114 n-Hexane 0.088185
R0257 P 102 - Royalene Flare n-Hexane 1.715
R0258 P 157 - Finishing I Dryer C Zone 2 Vent n-Hexane 0.925307
R0259 P 159 - Finishing I A Dewatering Screen/Press Combined Vent
n-Hexane 4.209925
R0260 P 160 - Finishing I Dryer C Zone 1 Vent n-Hexane 3.9799525
R0261 P 169 - Finishing I Dewatering Screen/Press Combined Vent n-Hexane 4.209925
R0262 P 170 - Finishing I Dryer D Zone 2 Vent n-Hexane 0.925307
R0263 P 172 - Finishing I Dryer D Zone 1 Vent n-Hexane 3.9799525
R0264 P 211 - Dry Hexane Storage Tank n-Hexane 0.522385

69
Source ID
Source type (P=point, A=area, V=volume) Source name Pollutant
Emissions (tons/year)
R0265 P 212 - Dry Hexane Storage Tank n-Hexane 0.50643
R0266 P 245 - Finishing III A Dewatering Screen Vent n-Hexane 0.1713715
R0267 P 246 - Finishing III B Dewatering Screen Vent n-Hexane 0.1713715
R0268 P 247 - Finishing III Dryer A Feed Conveyor and Cyclone Vent
n-Hexane 12.6322375
R0269 P 248 - Finishing III Dryer B Feed Conveyor and Cyclone Vent
n-Hexane 12.6322375
R0270 P 249 - Finishing III Dryer A Zone 1 Vent n-Hexane 3.173325
R0271 P 250 - Finishing III Dryer A Zone 3 Vent n-Hexane 1.1385365
R0272 P 251 - Finishing III Dryer B Zone 1 Vent n-Hexane 3.173325
R0273 P 252 - Finishing III Dryer B Zone 3 Vent n-Hexane 1.1385365
R0274 P 254 - Poly III Sample Collection Vent Stack n-Hexane 14.4658995
R0275 A 257 - Finishing III Water Drum n-Hexane 0.00073
R0278 P 277 - Diene-Free Hexane Storage Tank n-Hexane 0.409425

70
Source ID
Source type (P=point, A=area, V=volume) Source name Pollutant
Emissions (tons/year)
R0279 P 278 - Poly II Hexane Recovery Pot A n-Hexane 0.529105
R0280 P 279 - Poly II Hexane Recovery Pot B n-Hexane 0.529105
R0281 P 280 - Poly I Hexane Recovery Pot n-Hexane 0.33174
R0282 P 285 - Poly III Cooling Tower n-Hexane 2.649
R0283 P 290 - Poly III Hexane Recovery Pots n-Hexane 0.529105
R0284 P 291 - Finishing 1 C Dryer Penthouse Vent n-Hexane 14.3700815
R0285 P 292 - Finishing 1 D Dryer Penthouse Vent n-Hexane 14.3700815
R0286 P 293 - Dry Hexane Storage Tank n-Hexane 0.50979
R0287 A 302 - Royalene Lift Station n-Hexane 0.00588 Ethyl Chloride 0.0119
R0288 P 307 - Recovery Cooling Tower n-Hexane 0.2316
R0289 A 2002 - Trilene I Wash Tank Sampling/Disposal n-Hexane 0.008423
R0290 P 2003 - Trilene I Lab Hoods n-Hexane 0.076083

71
Source ID
Source type (P=point, A=area, V=volume) Source name Pollutant
Emissions (tons/year)
R0291 P 2004 - Trilene I Copolymer Storage Vent n-Hexane 0.14181
R0292 P 2007 - Trilene I A Off Spec Charge Tank n-Hexane 0.0008285
R0293 P 2008 - Trilene I B Off Spec Charge Tank n-Hexane 0.0008285
R0294 P 2009 - Trilene I A Copolymer Blend Storage Vent n-Hexane 0.0752545
R0295 P 2010 - Trilene I B Copolymer Blend Storage Vent n-Hexane 0.0752545
R0296 P 2011 - Trilene I C Copolymer Blend Storage Vent n-Hexane 0.0752545
R0299 A 2014 - Trilene I Product Truck Loading n-Hexane 0.0057995
R0300 A 2015 - Product Packing/Drum Loading n-Hexane 0.289972
R0302 A 2017 - Trilene I Surface Water Sump 1 n-Hexane 0.0005525
R0303 A 2018 - Trilene I Process Sump 2 n-Hexane 0.0005525
R0304 A 2019 - Trilene I Surface Water Sump 3 Ethyl Chloride 0.00023 n-Hexane 0.000276
R0306 P 2021 - Trilene I Drum Storage Area n-Hexane 0.0044185

72
Source ID
Source type (P=point, A=area, V=volume) Source name Pollutant
Emissions (tons/year)
R0311 A 2108 - Trilene Semi-Works Product Packaging n-Hexane 0.126
R0314 A 2201 - Poly I Monomer Compressor Oil Reservoir n-Hexane 0.0018205
R0315 A 2202 - Poly I Filter Box for Slurry Tank PV-14 n-Hexane 0.087345
R0318 A 2205 - Poly I Floc Water Hydrosieve Vent n-Hexane 0.10078
R0320 P 2207 - Poly I Recycle Water Drum Vent n-Hexane 0.00042
R0321 A 2208 - Poly I Gel Floc Dewatering Screen Vent n-Hexane 0.04997
R0323 P 2210 - Poly I Lab Hood Vent n-Hexane 0.000455
R0324 P 2215 - Poly I/II Lab Vent n-Hexane 0.0096
R0340 P 2301 - Finishing I Rework Tank n-Hexane 0.00049
R0341 A 2302 - Finishing I Conveyors, delumpers, balers, wrappers n-Hexane 0.307779
R0342 P 2401 - Poly II Monomer Compressor Oil Reservoir n-Hexane 0.0018205
R0345 P 2406 - Poly II Hydrosieve Vent n-Hexane 0.06551
R0346 P 2407 - Poly II Hydrosieve Vent

73
Source ID
Source type (P=point, A=area, V=volume) Source name Pollutant
Emissions (tons/year)
n-Hexane 0.06551
R0347 P 2408 - Poly II Floc Tank Water Drum Vents n-Hexane 0.027715
R0348 P 2410 - Poly II Recycle Water Drum Vent n-Hexane 0.00042
R0351 A 2416 - Poly II Filter Box for PV-214 n-Hexane 0.088185
R0352 A 2501 - Finishing II Sump n-Hexane 0.073905
R0353 P 2502 - Finishing II Dryer A Cyclone Vent n-Hexane 14.503042
R0354 P 2503 - Finishing II Dryer B Cyclone Vent n-Hexane 14.503042
R0355 P 2504 - Finishing II Dryer A Zone 2 Vent n-Hexane 0.9326935
R0356 P 2505 - Finishing II Rework Tank n-Hexane 0.000505
R0357 A 2506 - Finishing II Conveyors, delumpers, balers, wrappers
n-Hexane 0.3107335
R0358 A 2507 - Finishing II Crumb Separator n-Hexane 0.015115
R0359 P 2603 - Poly III Monomer Compressor n-Hexane 0.0018205
R0361 P 2607 - Poly III Skimmer Tank Vent n-Hexane 0.130595

74
Source ID
Source type (P=point, A=area, V=volume) Source name Pollutant
Emissions (tons/year)
R0362 P 2608 - Poly III Recycle Water Tank n-Hexane 0.028135
R0363 A 2610 - Poly III Gel Floc Dewatering Screen n-Hexane 0.021835
R0364 A 2611 - Poly III Gel Floc Tank Dewatering Screen Sump 1 Ethyl Chloride 0.054611
R0366 P 2613 - Poly III Lab Hood n-Hexane 0.00042
R0369 A 2618 - Poly III Gel Floc Sump n-Hexane 0.0105
R0370 P 2619 - Poly III Lab Mill Vent n-Hexane 0.00336
R0371 P 2704 - Finishing III Line A Dewatering Press Vent n-Hexane 3.2476845
R0372 P 2705 - Finishing III Line B Dewatering Press Vent n-Hexane 3.2476845
R0373 P 2714 - Finishing III Rework Tank n-Hexane 0.00051
R0374 A 2715 - Finishing III Conveyors, delumpers, balers, wrappers
n-Hexane 0.2698605
R0375 A 2716 - Finishing III Sump I n-Hexane 0.023935
R0376 A 2802T - Recovery Trench n-Hexane 0.000044
R0378 A 2804T - Recovery Scrubber Trench

75
Source ID
Source type (P=point, A=area, V=volume) Source name Pollutant
Emissions (tons/year)
n-Hexane 0.00876
R0379 A 2804 - Recovery "Cat K" Scrubber Sump n-Hexane 0.00378
R0381 P 2807 - 91-CG-119 A/B Bag Filters n-Hexane 0.0006
R0382 P 2808 - 91-RG-119 A/B Bag Filters n-Hexane 0.0006
R0383 A 2809 - Poly III Sump n-Hexane 0.0018205 Ethyl Chloride 0.017445
R0384 A 2811 - Trilene Sump n-Hexane 0.0006
R0385 A 2812 - Flexzone Sump n-Hexane 0.0168385 Ethyl Chloride 0.129701
R0388 P 37 - Crude Ketone Storage SV-08
Methyl isobutyl ketone 0.2541375
R0389 P 38 - Ketone Storage Tank SV-15
Methyl isobutyl ketone 0.2315475
R0390 P 39 - Ketone Separator
Methyl isobutyl ketone 0.0056475
R0391 P 43 - Water Storage Tank SV-06
Methyl isobutyl ketone 0.0001825

76
Source ID
Source type (P=point, A=area, V=volume) Source name Pollutant
Emissions (tons/year)
R0393 P 78 - Ketone Overflow Tank SV-013
Methyl isobutyl ketone 0.0056475
R0396 P 81 - Ketone Storage Tank SV-17
Methyl isobutyl ketone 0.2993175
R0397 P 82 - Product Storage PV-35
Methyl isobutyl ketone 0.0056475
R0399 P 84 - Product Storage PV-37
Methyl isobutyl ketone 0.0056475
R0402 P 149 - Vent Condenser PV-209 & PV-213
Methyl isobutyl ketone 0.2259
R0403 P 156 - BHT Flare Methanol 0.035447
1,1-Dimethylhydrazine 0.001115
Methyl isobutyl ketone 0.13554
Toluene 0.7798485 Methanol 0.035447 Aniline 0.0000325 Acetonitrile 0.016158 Methanol 0.035447 Methanol 0.035447 Methanol 0.035447 Methanol 0.035447 Methanol 0.035447

77
Source ID
Source type (P=point, A=area, V=volume) Source name Pollutant
Emissions (tons/year)
Cresols (mixed) 0.0071125
R0405 P 259 - Flexzone Feed Tank FV-04
Methyl isobutyl ketone 0.001295
R0406 P 260 - UBOB/DPA Catch Tank FV-01
Methyl isobutyl ketone 0.000053
R0409 P 267 - Ketone Separator SV-202
Methyl isobutyl ketone 0.001265
R0410 P 269 - Product Storage PV-39
Methyl isobutyl ketone 0.0056475
R0412 P 273 - New Blend Tank PV-40
Methyl isobutyl ketone 0.0056475
R0413 P 274 - Product Hold Tank FV-02
Methyl isobutyl ketone 0.0013665
R0415 P 6001 - Reactor PR-06A
Methyl isobutyl ketone 0.0395325
R0416 P 6002 - Reactor PR-06B
Methyl isobutyl ketone 0.0395325
R0417 P 6003 - Reactor PR-06C
Methyl isobutyl ketone 0.011295
R0420 P 6008 - Product Rework Tank RV-201

78
Source ID
Source type (P=point, A=area, V=volume) Source name Pollutant
Emissions (tons/year)
Methyl isobutyl ketone 0.909248
R0421 P 6010 - Product Railcar Loading
Methyl isobutyl ketone 0.09036
R0422 P 6011 - Flexzone Truck Loading
Methyl isobutyl ketone 0.604283
R0423 P 6012 - Ketone Truck Loading Aniline 0.000003 Toluene 0.0000205
R0424 P 6020 - Flexzone Drumming Station
Methyl isobutyl ketone 0.0056475
R0425 P 6021 - Pelletizer FG-10
Methyl isobutyl ketone 0.0056475
R0431 P 6051 - Effluent Surge Tank
Methyl isobutyl ketone 0.773708
R0438 P 407-Finishing Vent Ethylene Dichloride 0.8080235
R0440 P 405 -Dehumidification Column Ethylene Dichloride 0.4476005 Ethylene Dichloride 0.295155 Ethylene Dichloride 0.1036855 Ethylene Dichloride 0.0833265 Ethylene Dichloride 0.1036855 Ethylene Dichloride 1.0718965

79
Source ID
Source type (P=point, A=area, V=volume) Source name Pollutant
Emissions (tons/year)
Ethylene Dichloride 1.114767 Ethylene Dichloride 0.527543 Ethylene Dichloride 0.1036855 Ethylene Dichloride 0.1879385
R0441 P 406 -Celogen OT Centrifuge Ethylene Dichloride 3.329386
R0446 P 9006 - Tar Trailer Loading Aniline 0.02132 Toluene 0.4697575
R0447 P 9022 - Railcar Loading Toluene 0.0498935
R0472 P 0198a - Maintenance Sumps Phenol 0.000004 Methanol 1.625424 Toluene 0.035773
R0473 P 124 - UBOB Separator Vent Condenser Chlorobenzene 0.0000385 Methyl Chloride 0.0266745 Benzene 0.0029105 Chlorobenzene 0.0000385 Toluene 0.1279085 Methanol 0.1117775 Benzene 0.0029105 Methyl Chloride 0.0266745 Toluene 0.1279085 Methanol 0.1117775
R0483 P 195 - UBOB Atmospheric Still Vent Scrubber Chlorobenzene 0.0025915

80
Source ID
Source type (P=point, A=area, V=volume) Source name Pollutant
Emissions (tons/year)
Methyl Chloride 4.3941045 Benzene 0.065922 Toluene 3.7783175
R0484 P 198 - Emergency Sumps Toluene 0.0034095 Methyl Chloride 0.000002 Chlorobenzene 0.000018 Methanol 0.036226 Benzene 0.000002 Phenol 0.000419
R0485 P 199 - Dried UBOB Storage Methanol 0.000895 Toluene 0.1831655 Benzene 0.000162 Aniline 0.0030205 Methyl Chloride 0.0000195 Chlorobenzene 0.0004245
R0488 P 204 - Reducer Toluene Condenser Vent Methanol 0.0188945 Benzene 0.0019655 Chlorobenzene 0.0001325 Methanol 0.0188945 Aniline 0.0000005 Aniline 0.0000005 Aniline 0.0000005 Methanol 0.0188945 Aniline 0.0000005 Benzene 0.0019655 Methanol 0.0188945
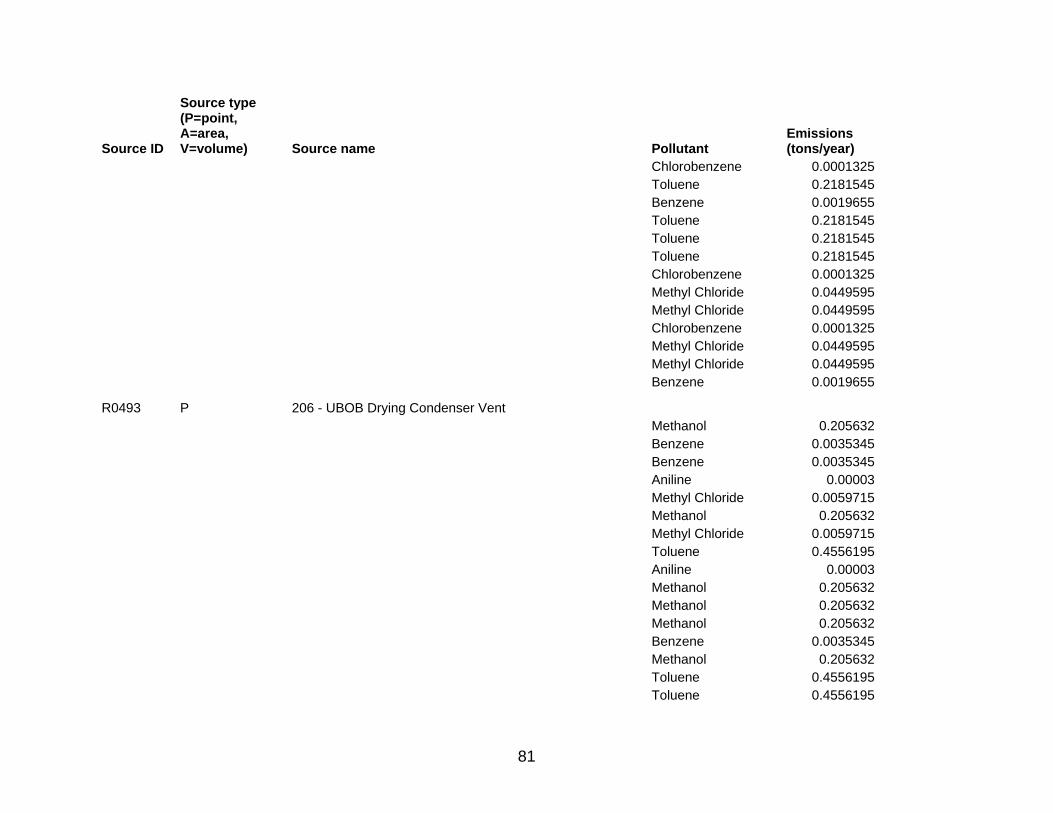
81
Source ID
Source type (P=point, A=area, V=volume) Source name Pollutant
Emissions (tons/year)
Chlorobenzene 0.0001325 Toluene 0.2181545 Benzene 0.0019655 Toluene 0.2181545 Toluene 0.2181545 Toluene 0.2181545 Chlorobenzene 0.0001325 Methyl Chloride 0.0449595 Methyl Chloride 0.0449595 Chlorobenzene 0.0001325 Methyl Chloride 0.0449595 Methyl Chloride 0.0449595 Benzene 0.0019655
R0493 P 206 - UBOB Drying Condenser Vent Methanol 0.205632 Benzene 0.0035345 Benzene 0.0035345 Aniline 0.00003 Methyl Chloride 0.0059715 Methanol 0.205632 Methyl Chloride 0.0059715 Toluene 0.4556195 Aniline 0.00003 Methanol 0.205632 Methanol 0.205632 Methanol 0.205632 Benzene 0.0035345 Methanol 0.205632 Toluene 0.4556195 Toluene 0.4556195

82
Source ID
Source type (P=point, A=area, V=volume) Source name Pollutant
Emissions (tons/year)
Benzene 0.0035345 Chlorobenzene 0.0002155 Chlorobenzene 0.0002155 Toluene 0.4556195 Chlorobenzene 0.0002155 Methyl Chloride 0.0059715 Chlorobenzene 0.0002155 Benzene 0.0035345 Toluene 0.4556195 Aniline 0.00003 Chlorobenzene 0.0002155 Aniline 0.00003 Methyl Chloride 0.0059715 Chlorobenzene 0.0002155 Aniline 0.00003 Aniline 0.00003 Benzene 0.0035345 Methyl Chloride 0.0059715 Methyl Chloride 0.0059715 Toluene 0.4556195
R0501 P 210 - Distilled UBOB Storage Tank Aniline 0.0008475 Methanol 0.000273 Methyl Chloride 0.0000285 Toluene 0.0620335 Benzene 0.0001005 Chlorobenzene 0.0001295
R0502 P 220 - Reactor Vent Toluene 0.54151 Toluene 0.54151

83
Source ID
Source type (P=point, A=area, V=volume) Source name Pollutant
Emissions (tons/year)
Methyl Chloride 0.177039 Benzene 0.005115 Methyl Chloride 0.177039 Chlorobenzene 0.0005255 Methyl Chloride 0.177039 Methyl Chloride 0.177039 Benzene 0.005115 Methyl Chloride 0.177039 Methyl Chloride 0.177039 Benzene 0.005115 Chlorobenzene 0.0005255 Chlorobenzene 0.0005255 Benzene 0.005115 Chlorobenzene 0.0005255 Methyl Chloride 0.177039 Methyl Chloride 0.177039 Chlorobenzene 0.0005255 Benzene 0.005115 Benzene 0.005115 Toluene 0.54151 Toluene 0.54151 Chlorobenzene 0.0005255 Chlorobenzene 0.0005255 Toluene 0.54151 Toluene 0.54151 Benzene 0.005115 Chlorobenzene 0.0005255 Toluene 0.54151 Toluene 0.54151 Methyl Chloride 0.177039 Toluene 0.54151

84
Source ID
Source type (P=point, A=area, V=volume) Source name Pollutant
Emissions (tons/year)
Benzene 0.005115 Chlorobenzene 0.0005255 Benzene 0.005115
R0512 P 221 - Crude Methanol Vent Condenser and Scrubber Toluene 0.000287 Methyl Chloride 0.0000095 Methyl Chloride 0.0000095 Benzene 0.0000055 Toluene 0.000287 Methanol 0.000918 Toluene 0.000287 Aniline 0.0000125 Methyl Chloride 0.0000095 Aniline 0.0000125 Aniline 0.0000125 Benzene 0.0000055 Methanol 0.000918 Methanol 0.000918 Benzene 0.0000055
R0516 P 222 - Reducer Toluene Condenser Vent Toluene 0.940148 Benzene 0.008171 Aniline 0.0000015 Methyl Chloride 0.179978 Methanol 0.0755775 Chlorobenzene 0.000582
R0517 P 225 - Intermediate NaTKB Storage Tank Methanol 0.3351295 Benzene 0.0000015

85
Source ID
Source type (P=point, A=area, V=volume) Source name Pollutant
Emissions (tons/year)
Methyl Chloride 0.0012515 Toluene 0.0002545 Chlorobenzene 0.0000005
R0518 P 234 - Causticizer Vent Toluene 0.3981245 Methanol 0.0974305
R0520 P 236 - Causticizer Separator Vent Methanol 0.1807895 Toluene 0.7387485
R0523 P 261 - Distilled UBOB Storage Chlorobenzene 0.0001125 Methyl Chloride 0.000028 Benzene 0.0000985 Methanol 0.0002535 Toluene 0.058642 Aniline 0.0008025
R0524 P 28 - Fresh Toluene Storage Tank Toluene 0.291365
R0525 P 282 - Toluene Seal Pot Toluene 0.0375525
R0526 P 33 - UBOB Drying Still Feed Tank Methanol 0.144361 Toluene 0.38228 Methyl Chloride 0.0045355 Methyl Chloride 0.0045355 Benzene 0.002607 Benzene 0.002607 Toluene 0.38228

86
Source ID
Source type (P=point, A=area, V=volume) Source name Pollutant
Emissions (tons/year)
Chlorobenzene 0.0002655 Methanol 0.144361 Chlorobenzene 0.0002655
R0528 P 413 - Methanol Column Receiver Methanol 0.079392 Toluene 0.000059
R0529 P 558 - UBOB Toluene Storage Condenser Vent Methyl Chloride 0.0947 Methyl Chloride 0.0947 Aniline 0.0000005 Methanol 0.034855 Aniline 0.0000005 Aniline 0.0000005 Methyl Chloride 0.0947 Methyl Chloride 0.0947 Methanol 0.034855 Aniline 0.0000005 Methanol 0.034855 Methyl Chloride 0.0947 Benzene 0.0017 Benzene 0.0017 Benzene 0.0017 Benzene 0.0017 Benzene 0.0017 Aniline 0.0000005 Aniline 0.0000005 Chlorobenzene 0.000293 Chlorobenzene 0.000293 Methanol 0.034855 Chlorobenzene 0.000293

87
Source ID
Source type (P=point, A=area, V=volume) Source name Pollutant
Emissions (tons/year)
Chlorobenzene 0.000293 Chlorobenzene 0.000293 Methanol 0.034855 Toluene 0.3199275 Toluene 0.3199275 Toluene 0.3199275 Toluene 0.3199275 Toluene 0.3199275 Chlorobenzene 0.000293 Methyl Chloride 0.0947 Methanol 0.034855 Benzene 0.0017 Toluene 0.3199275
R0537 P 6503 - UBOB Drying Still and Toluene Recovery Chlorobenzene 0.0000015 Methanol 0.002289 Benzene 0.0000925 Toluene 0.0048825 Methyl Chloride 0.000488
R0540 P 6516 - Light Ends Feed Tank Chlorobenzene 0.0001625 Toluene 0.109615 Methyl Chloride 0.030879 Benzene 0.0008435
R0543 P 6522 - UBOB Vacuum Still Vent Scrubber Toluene 5.961759 Chlorobenzene 0.004729 Benzene 0.0743515
R0546 P 6526 - Distilled UBOB Storage Vent

88
Source ID
Source type (P=point, A=area, V=volume) Source name Pollutant
Emissions (tons/year)
Benzene 0.0000935 Chlorobenzene 0.00012 Toluene 0.059269 Methanol 0.0002535 Aniline 0.0008145 Methyl Chloride 0.0000265
R0551 P 6531 - Tank Truck and Railcar Loading Operations Aniline 0.000062 Toluene 0.0000285
R0553 P 6533 - Catalyst Filter Dump Toluene 0.0000005
R0555 P 6595 - Rearranger Scrubber Chlorobenzene 0.0064805 Hydrochloric acid 0.0000305 Methyl Chloride 0.414256 Methanol 0.008014 Methanol 0.0322145 Methanol 0.0322145 Methanol 0.0322145 Methyl Chloride 0.414256 Methyl Chloride 0.414256 Toluene 1.084765 Aniline 0.006912 Benzene 0.005468 Hydrochloric acid 0.0000305 Toluene 1.084765 Hydrochloric acid 0.0000305 Toluene 1.084765 Toluene 3.9330735

89
Source ID
Source type (P=point, A=area, V=volume) Source name Pollutant
Emissions (tons/year)
R0561 P 77 - Distilled UBOB Storage Methanol 0.0002195 Toluene 0.051418 Methyl Chloride 0.0000185 Chlorobenzene 0.00011 Aniline 0.0007135 Benzene 0.0000915
RB9RS A B9 Releases Acetonitrile 0.0012
RDWRS A Deepwell Releases Methanol 10.514
RF002 A Equipment Fugitives Chlorine 0.5894935 Hydrochloric acid 0.3396525
RF004 A 5004 Fugitive Emissions Maleic anhydride 0.058
RF007 A 319 - Fugitive Emissions Carbon disulfide 0.992 Methanol 0.08 Toluene 9.514 Hydrogen sulfide 0.245 Chlorine 0.609 Aniline 2.226
RF008 A 3002 - Fugitive Emissions Cresols (mixed) 0.9903
1,1-Dimethylhydrazine 0.3683
Acetonitrile 0.513

90
Source ID
Source type (P=point, A=area, V=volume) Source name Pollutant
Emissions (tons/year)
Maleic anhydride 0.024643
RF009 A 284 - Royalene/Trilene Semiworks Fugitive Emissions n-Hexane 17.6184
RF010 A 2000 - Trilene I Fugitive Emissions n-Hexane 0.8906285
RF011 A 6200 - Fugitive Emissions Toluene 0.000012 Aniline 0.0000225
Methyl isobutyl ketone 1.4965885
RF012 A 409 -Fugitive Emissions Ethylene Dichloride 2.456583 Hydrochloric acid 0.6754505
RF013 A 6515 - UBOB Fugitive Emissions Benzene 0.068501 Aniline 0.07436 Hydrochloric acid 1.520978 Methanol 4.624648 Chlorobenzene 0.0434 Toluene 10.829488 Methyl Chloride 0.015321 Phenol 0.0261885 Phosgene 0.000001
RFXIA A Flexzone Insignificant Activities Methanol 1.05
ROTRS A OT Releases and Spills Ethylene Dichloride 2.92518 Hydrochloric acid 0.005

91
Source ID
Source type (P=point, A=area, V=volume) Source name Pollutant
Emissions (tons/year)
RR003 P 138-Reactor Vent Maleic anhydride 0.122755
RRYGC A Royalene Trilene GCXVII Activities n-Hexane 1.5035
RRYRS A Releases and Spills n-Hexane 0.232341
RSLIA A Services & Lab Insignificant Activities
Methyl isobutyl ketone 0.00188
Toluene 0.3206855 n-Hexane 0.020414 Ethylene glycol 0.000575 Methyl ethyl ketone 0.0151465 Methyl Chloride 0.004956 Ethyl benzene 0.157125 Methanol 0.074141 Carbon disulfide 0.0222835 Xylenes (mixed) 0.759234
RTZGC A Thiazoles GCXVII Activities Toluene 0.000028 Aniline 0.0000015
RTZRS A Thiazoles Releases and Spills Aniline 0.0000035 Toluene 0.0000195
RUBGC A UBOB GCXVII Activities Phenol 0.000002 Benzene 0.0000045 Methyl Chloride 0.0001045

92
Source ID
Source type (P=point, A=area, V=volume) Source name Pollutant
Emissions (tons/year)
Chlorobenzene 0.0000075 Methanol 0.0593955
RUBIA A UBOB Insignificant Activities Methanol 0.03978 Toluene 0.0544575 Hydrochloric acid 0.015429 n-Hexane 0.033162
RUBRS A UBOB Releases Toluene 1.03043

93
Appendix C 2009 Emissions Data

94
Source ID
Source type (P=point, A=A, V=volume) Source name Pollutant Emissions (tons/year)
R0003 A 2053 Inventory Tank n-Hexane 0.045733 Ethyl Chloride 0.1746445
R0004 A 2054 Equalization Tank n-Hexane 0.045733 Ethyl Chloride 0.1746445
R0006 A 2056 Flocculation Tank Ethyl Chloride 0.0037 n-Hexane 0.000888
R0007 A 2057 Dissolved Air Floatation Unit n-Hexane 5.7095365 Ethyl Chloride 2.479061
R0012 A 2063 Sludge Holding Tank Ethyl Chloride 0.0096205
R0014 A 2066 Effluent Lift Station Sump Ethyl Chloride 0.00148
R0015 A 2067 Influent Lift Station Sump Ethyl Chloride 0.00592 n-Hexane 0.001776
R0087 P 400 -EDC Storage Tank Ethylene Dichloride 0.000295
R0090 A 408 -Celogen OT/BHT Cooling Tower Ethylene Dichloride 0.01924
R0091 P 7003 -CSA Storage Tank Hydrochloric acid 0.0015
R0110 P 2905-Cummins Diesel Fire Pump 1,3-Butadiene 0.0000035

95
Source ID
Source type (P=point, A=A, V=volume) Source name Pollutant Emissions (tons/year)
Toluene 0.000035 Naphthalene 0.0000075 Benzene 0.0000805 Acrolein 0.000008 Formaldehyde 0.0001015 Acetaldehyde 0.000066 Xylenes (mixed) 0.0000245
R0111 P 2906-Detroit Diesel Fire Pump Acrolein 0.0000005 Acetaldehyde 0.0000045 Xylenes (mixed) 0.000002 Formaldehyde 0.0000075 Naphthalene 0.0000005 Benzene 0.000006 Toluene 0.0000025
R0125 P 2933-Flexzone Emergency Generator Benzene 0.000104 Toluene 0.0000455 Naphthalene 0.0000095 Acetaldehyde 0.0000855 1,3-Butadiene 0.0000045 Acrolein 0.0000105 Xylenes (mixed) 0.000032 Formaldehyde 0.000132
R0144 A 2071 Settling Tank n-Hexane 0.002664 Ethyl Chloride 0.0111005
R0168 A 300 - Hold Tank Ethylene Dichloride 0.003219 Hydrochloric acid 0.0029825

96
Source ID
Source type (P=point, A=A, V=volume) Source name Pollutant Emissions (tons/year)
R0170 A 305 - Clear Water Tank Hydrochloric acid 0.0003755 Ethylene Dichloride 0.0003185
R0171 A 306 - Lift Station Hydrochloric acid 0.0004695 Ethylene Dichloride 0.0037545
R0241 P 46 - Poly II Sample Collection Vent Stack n-Hexane 14.9609475
R0242 A 48 - Poly I Wash Tank Sump 1 Ethyl Chloride 0.047361 n-Hexane 0.007992
R0243 P 50 -Poly I Sample Collection Vent Stack n-Hexane 14.9609475
R0244 A 52 - Poly II Wash Tank Sump 1 Ethyl Chloride 0.0614215 n-Hexane 0.0111005
R0245 P 53 - Finishing II Dewatering Screen/Press Combined Vent n-Hexane 4.7443485
R0246 A 54 - Finishing I Recycle Water Sump n-Hexane 0.001776
R0247 P 55 - Finishing II Dryer A Zone 1 Vent n-Hexane 4.8606615
R0248 P 58 - Finishing II Dewatering Screen/Press Combined Vent n-Hexane 4.7443485
R0249 A 59 - Finishing II Recycle Water Drum n-Hexane 0.001776

97
Source ID
Source type (P=point, A=A, V=volume) Source name Pollutant Emissions (tons/year)
R0250 P 60 - Finishing II Dryer B Zone 1 Vent n-Hexane 4.8606615
R0251 P 61 - Finishing II Dryer B Zone 2 Vent n-Hexane 1.1264
R0252 P 65 - Additive Storage Tank n-Hexane 0.7175215
R0253 P 66 - Additive Storage Tank n-Hexane 0.7175215
R0254 P 67 - Dry Hexane Storage Tank Condenser n-Hexane 0.369417
R0255 A 68 - Poly I Gel Floc Dewatering Screen Sump 2 n-Hexane 0.042181
R0256 A 69 - Poly II Filter Box Screen for PV-114 n-Hexane 0.155848
R0257 P 102 - Royalene Flare n-Hexane 1.836474
R0258 P 157 - Finishing I Dryer C Zone 2 Vent n-Hexane 1.1202785
R0259 P 159 - Finishing I A Dewatering Screen/Press Combined Vent
n-Hexane 5.0902265
R0260 P 160 - Finishing I Dryer C Zone 1 Vent n-Hexane 4.8116875
R0261 P 169 - Finishing I Dewatering Screen/Press Combined Vent n-Hexane 5.0902265
R0262 P 170 - Finishing I Dryer D Zone 2 Vent n-Hexane 1.1202785

98
Source ID
Source type (P=point, A=A, V=volume) Source name Pollutant Emissions (tons/year)
R0263 P 172 - Finishing I Dryer D Zone 1 Vent n-Hexane 4.8116875
R0264 P 211 - Dry Hexane Storage Tank n-Hexane 0.821864
R0265 P 212 - Dry Hexane Storage Tank n-Hexane 0.7996635
R0266 P 245 - Finishing III A Dewatering Screen Vent n-Hexane 0.208139
R0267 P 246 - Finishing III B Dewatering Screen Vent n-Hexane 0.208139
R0268 P 247 - Finishing III Dryer A Feed Conveyor and Cyclone Vent
n-Hexane 15.2768015
R0269 P 248 - Finishing III Dryer B Feed Conveyor and Cyclone Vent
n-Hexane 15.2768015
R0270 P 249 - Finishing III Dryer A Zone 1 Vent n-Hexane 3.838331
R0271 P 250 - Finishing III Dryer A Zone 3 Vent n-Hexane 1.3773915
R0272 P 251 - Finishing III Dryer B Zone 1 Vent n-Hexane 3.838331
R0273 P 252 - Finishing III Dryer B Zone 3 Vent n-Hexane 1.3773915
R0274 P 254 - Poly III Sample Collection Vent Stack n-Hexane 14.9609475
R0275 A 257 - Finishing III Water Drum

99
Source ID
Source type (P=point, A=A, V=volume) Source name Pollutant Emissions (tons/year)
n-Hexane 0.001332
R0278 P 277 - Diene-Free Hexane Storage Tank n-Hexane 0.64648
R0279 P 278 - Poly II Hexane Recovery Pot A n-Hexane 0.932423
R0280 P 279 - Poly II Hexane Recovery Pot B n-Hexane 0.932423
R0281 P 280 - Poly I Hexane Recovery Pot n-Hexane 0.5816545
R0282 A 285 - Poly III Cooling Tower n-Hexane 4.4148
R0283 P 290 - Poly III Hexane Recovery Pots n-Hexane 0.932423
R0284 P 291 - Finishing 1 C Dryer Penthouse Vent n-Hexane 17.3765585
R0285 P 292 - Finishing 1 D Dryer Penthouse Vent n-Hexane 17.3765585
R0286 P 293 - Dry Hexane Storage Tank n-Hexane 0.8027715
R0287 A 302 - Royalene Lift Station n-Hexane 0.0106565 Ethyl Chloride 0.0125805
R0288 A 307 - Recovery Cooling Tower n-Hexane 0.3864
R0289 A 2002 - Trilene I Wash Tank Sampling/Disposal n-Hexane 0.0062675

100
Source ID
Source type (P=point, A=A, V=volume) Source name Pollutant Emissions (tons/year)
R0290 P 2003 - Trilene I Lab Hoods n-Hexane 0.05659
R0292 P 2007 - Trilene I A Off Spec Charge Tank n-Hexane 0.0006145
R0293 P 2008 - Trilene I B Off Spec Charge Tank n-Hexane 0.0006145
R0300 A 2015 - Product Packing/Drum Loading n-Hexane 0.215055
R0302 A 2017 - Trilene I Surface Water Sump 1 n-Hexane 0.0004915
R0303 A 2018 - Trilene I Process Sump 2 n-Hexane 0.0004915
R0304 A 2019 - Trilene I Surface Water Sump 3 Ethyl Chloride 0.0001025 n-Hexane 0.000246
R0306 A 2021 - Trilene I Drum Storage Area n-Hexane 0.003318
R0314 A 2201 - Poly I Monomer Compressor Oil Reservoir n-Hexane 0.003108
R0315 A 2202 - Poly I Filter Box for Slurry Tank PV-14 n-Hexane 0.154072
R0318 A 2205 - Poly I Floc Water Hydrosieve Vent n-Hexane 0.1771605
R0320 A 2207 - Poly I Recycle Water Drum Vent n-Hexane 0.000888
R0321 A 2208 - Poly I Gel Floc Dewatering Screen Vent

101
Source ID
Source type (P=point, A=A, V=volume) Source name Pollutant Emissions (tons/year)
n-Hexane 0.087914
R0322 P 2209 - Poly I Glycol Storage Tank Vent Ethylene glycol 0.0000815
R0323 A 2210 - Poly I Lab Hood Vent n-Hexane 0.000888
R0324 A 2215 - Poly I/II Lab Vent n-Hexane 0.0115445
R0325 A 2216 - Poly I Sump and Trench n-Hexane 0.000031
R0340 P 2301 - Finishing I Rework Tank n-Hexane 0.000444
R0341 A 2302 - Finishing I Conveyors, delumpers, balers, wrappers n-Hexane 0.373426
R0342 A 2401 - Poly II Monomer Compressor Oil Reservoir n-Hexane 0.003108
R0345 A 2406 - Poly II Hydrosieve Vent n-Hexane 0.114999
R0346 A 2407 - Poly II Hydrosieve Vent n-Hexane 0.114999
R0347 A 2408 - Poly II Floc Tank Water Drum Vents n-Hexane 0.048841
R0348 A 2410 - Poly II Recycle Water Drum Vent n-Hexane 0.000444
R0351 A 2416 - Poly II Filter Box for PV-214 n-Hexane 0.155404
R0352 A 2501 - Finishing II Sump

102
Source ID
Source type (P=point, A=A, V=volume) Source name Pollutant Emissions (tons/year)
n-Hexane 0.1518515
R0353 P 2502 - Finishing II Dryer A Cyclone Vent n-Hexane 17.5387845
R0354 P 2503 - Finishing II Dryer B Cyclone Vent n-Hexane 17.5387845
R0355 P 2504 - Finishing II Dryer A Zone 2 Vent n-Hexane 1.1264
R0356 P 2505 - Finishing II Rework Tank n-Hexane 0.000444
R0357 A 2506 - Finishing II Conveyors, delumpers, balers, wrappers
n-Hexane 0.376487
R0358 A 2507 - Finishing II Crumb Separator n-Hexane 0.031081
R0359 A 2603 - Poly III Monomer Compressor n-Hexane 0.003108
R0362 A 2608 - Poly III Recycle Water Tank n-Hexane 0.049729
R0363 A 2610 - Poly III Gel Floc Dewatering Screen n-Hexane 0.038185
R0364 A 2611 - Poly III Gel Floc Tank Dewatering Screen Sump 1 n-Hexane 0.00888 Ethyl Chloride 0.0532815
R0365 P 2612 - Poly III Glycol Storage Tank Vent Ethylene glycol 0.0000815
R0366 A 2613 - Poly III Lab Hood n-Hexane 0.000888

103
Source ID
Source type (P=point, A=A, V=volume) Source name Pollutant Emissions (tons/year)
R0369 A 2618 - Poly III Gel Floc Sump n-Hexane 0.0186485
R0370 A 2619 - Poly III Lab Mill Vent n-Hexane 0.005772
R0371 A 2704 - Finishing III Line A Dewatering Press Vent n-Hexane 3.927096
R0372 A 2705 - Finishing III Line B Dewatering Press Vent n-Hexane 3.927096
R0373 P 2714 - Finishing III Rework Tank n-Hexane 0.000444
R0374 A 2715 - Finishing III Conveyors, delumpers, balers, wrappers
n-Hexane 0.327513
R0375 A 2716 - Finishing III Sump I n-Hexane 0.049285
R0378 A 2804T - Recovery Scrubber Trench n-Hexane 0.00666
R0379 A 2804 - Recovery "Cat K" Scrubber Sump n-Hexane 0.00666
R0383 A 2809 - Poly III Sump n-Hexane 0.003108 Ethyl Chloride 0.0170205
R0384 A 2811 - Trilene Sump n-Hexane 0.000888
R0385 A 2812 - Flexzone Sump n-Hexane 0.0270845 Ethyl Chloride 0.126543

104
Source ID
Source type (P=point, A=A, V=volume) Source name Pollutant Emissions (tons/year)
R0386 A 2813 - New HCl Scrubber/VOCl3 Unloading/RV Blowdown Hydrochloric acid 0.00814
R0438 P 407-Finishing Vent Ethylene Dichloride 0.273085
R0440 P 405 -Dehumidification Column Chlorobenzene 0.0002765 p-Dichlorobenzene 0.0002765 Ethylene Dichloride 1.016025 Hydrochloric acid 0.0002765
R0441 P 406 -Celogen OT Centrifuge Ethylene Dichloride 0.002636
RDWGC A Deepwell GCSVII Activities Toluene 0.436613 Benzene 0.0436615 Ethylene Dichloride 0.001323 Chlorobenzene 0.001323
RDWRS A Deepwell Releases Ethylene Dichloride 0.0063
RF009 A 284 - Royalene/Trilene Semiworks Fugitive Emissions n-Hexane 29.364
RF010 A 2000 - Trilene I Fugitive Emissions n-Hexane 0.660525
RF012 A 409 -Fugitive Emissions Ethylene Dichloride 2.456585 p-Dichlorobenzene 0.0000005 Chlorobenzene 0.0000005 Hydrochloric acid 0.000085

105
Source ID
Source type (P=point, A=A, V=volume) Source name Pollutant Emissions (tons/year)
ROTRS A OT Releases and Spills Hydrochloric acid 0.0033 Ethylene Dichloride 0.008045
ROTV3 A OT - Decom Variance Ethylene Dichloride 0.026635
RRYGC A Royalene Trilene GCXVII Activities Ethyl Chloride 0.00037 n-Hexane 2.40449
RRYRS A Royalene Releases and Spills n-Hexane 0.02782
RSLIA A Services & Lab Insignificant Activities Hydrochloric acid 0.000065

106
Vita
Keith E. Gordon was born in New Orleans, Louisiana in 1971. He graduated
from Louisiana State University in 1996 with a Bachelor’s of Science in Environmental
Management Systems. He also served in the United States Marine Corps from 1992 to
2000. Mr. Gordon has worked in the environmental engineering profession for various
organizations over fourteen years. These companies include Avondale Shipyards,
Waterbury Companies, Chemtura Corporation and currently Lion Copolymer Geismar,
LLC in Geismar, Louisiana. He presently lives in Baton Rouge, LA with his wife and
three children.