macropore and surface seal interactions affecting water infiltration into soil
TRANSCRIPT

Macropore and Surface Seal Interactions Affecting Water Infiltrationinto Soil
S. D. Hla,* S. C. Gupta, and W. J. Rawls
ABSTRACTMacropores can increase water infiltration into soils whereas sur-
face sealing decreases infiltration. Using Webster clay loam (fine-loamy,mixed, mesic Typic Haplaquoll) and Port Byron silt loam (fine-silty,mixed, mesic Typic Hapludoll) soils, this study examined the effect ofsimulated rainfall on water infiltration into soils with earthworm(Aporrectodea tuberculata) and artificial macropores. Treatments in-cluded bare and covered soil surfaces, soils with and without macro-pores formed by earthworms, and soils with artificially formedmacropores of 2-, 3-, 4-, and 5-mm diameter. During simulated rain-fall, infiltration was measured by continuously monitoring the in-crease in container weight. Comparison of infiltration rates betweenbare and covered treatments showed that a surface seal developed onbare soils. The surface seal was effective in sealing visible macroporesvarying in diameter from 2 to 5 mm. Subsequent measurements witha disk permeameter at the surface and three subsurface depths showedthat open macropores at the surface were ineffective in conductingwater to deeper depths because they lacked continuity below the sur-face. Likewise, measurements of the water flux through individualearthworm macropores demonstrated that much of the increase inwater flux due to macropores was due to the contribution of only afew of the visible macropores. The description of macropore size andnumber by themselves may be insufficient for developing models ofwater entry into soils containing earthworm macropores.
DEFINING THE PATHWAYS by which rainwater movesfrom the soil surface to groundwater is of critical
importance as an increasing number of studies aredocumenting the presence of nitrates and pesticides inground water (Singer et al., 1982; Hallberg et al.,1984; Council for Agricultural Science and Technol-ogy, 1985; Nielsen and Lee, 1987). Although thereare a number of potential pathways for preferentialflow of water through the soil, much of the currentresearch has focused on the role of macropores onwater movement through the soil. For example, stud-ies by Edwards and Amerman (1984) and Edwards etal. (1988b) demonstrated that a greater number of ma-cropores in no-till than in moldboard plowed fieldsincreased the water infiltration into the no-till fields.Peterson and Dixon (1971) measured the infiltration
S.D. Ela, Silver Spruce Orchards, 3075 L Rd., Hotchkiss, CO81419; S.C. Gupta, Dep. of Soil Science, Univ. of Minnesota,St. Paul, MN 55108; and W.J. Rawls, USDA-ARS, Beltsville,MD 20705. Contribution from the Minnesota Agric. Exp. Stn.,Dep. of Soil Science, Univ. of Minnesota, Scientific Journal Se-ries, Paper no. 19013. Received 24 Apr. 1991. *Correspondingauthor.
Published in Soil Sci. Soc. Am. J. 56:714-721 (1992).
Runoffspout
13cm
1- 3 cm
Fig. 1. Assembly of soil containers used in rainfall simulatorexperiments.
rate of water into an exposed plow sole with openearthworm macropores and then remeasured the infil-tration on the same plot after the pores >1.6 mm indiameter were plugged at surface. The mean 60-minflow rates with open macropores were between 72 and85 times the rates with closed macropores.
The decrease in flow rates after the macropores wereplugged is an indication that, if macropores at the soilsurface are blocked, they will not contribute to waterflow. Germann et al. (1984) observed that, after theponded application of stained water to a soil contain-ing macropores, only some of the pores in the sub-surface soil were stained. They concluded that not allthe macropores in the subsurface depths were con-nected to the surface in a manner that allowed surfacewater to move into the pores.
One way in which macropores at or near the surfacecan be blocked is through the development of a sur-face seal during a rainstorm. Freebairn et al. (1989)showed that the development of a surface seal on baresoils during rainfall decreased water infiltration intosoils. In between rainstorms they noted that the sur-face seal from the previous rain was disrupted by ma-cropore openings. After 5 min of subsequent rainfall,however, they noted that the seal appeared to be againfully developed. Radcliffe et al. (1988) found that,although there were significantly greater numbers ofmacropores in moldboard-plowed vs. no-till plots, thefinal infiltration rate after sprinkling was lower for themoldboard than no-till plots. They were further ableto demonstrate that the lower moldboard-blow infil-tration rates were the result of decreased cover andincreased surface sealing. If the cover was artificiallyincreased to equal that of the no-till plot, the mold-

ELA ET AL.: MACROPORE FLOW AND SURFACE SEAL INTERACTIONS 715
board-plowed plot had higher infiltration rates than theno-till plot. Likewise, Lal (1976), Edwards et al.(1988b), and Heard et al. (1988) noted that increasedcover on no-till sites may be responsible for reducedsurface sealing and greater infiltration rates. In addi-tion, they were also able to document that part of theincreased infiltration on no-till sites was due to ma-cropore flow.
A possible conclusion from these studies might bethat the surface seal blocks macropore openings at thesoil surface during rainfall and thereby prevents ma-cropore flow. Since macropores are generally presentin soils and tilled soils are commonly bare during theearly part of the growing season, the focus of thisstudy was to directly investigate the effects of earth-worm macropores on water infiltration into soil andthe effects of surface seals on water movement intothese soil macropores.
MATERIALS AND METHODSThe two experiments described here consisted of mea-
suring water infiltration, during and after rainfall, into soilswith earthworm and artificially formed macropores.
SoilsTwo southern Minnesota soils, Webster clay loam and
Port Byron silt loam, were selected based on their wide-spread occurrence, agricultural importance and differingtextures. Bulk samples for each of these soils were collectedfrom the Ap horizon, air dried, and then ground to passthrough a 5-mm sieve. The Webster clay loam is derivedfrom glacial till and the plow layer is composed of 32%sand, 29% silt, and 39% clay; the clay minerals are dividedprimarily between smectite (40-50%), illite (15%), andvermiculite (15%) (Culley et al., 1987). The soil occurs insouth-central Minnesota and north-central Iowa; the soilused in the laboratory experiment was collected from theUniversity of Minnesota Southern Experiment Station, Wa-seca, MN.
The Port Byron silt loam is derived from loess and theAp horizon is composed of 4% sand, 71% silt, and 25%clay; the clays are dominated by illite (Freebairn, 1989).The soil is a major series in southeastern Minnesota and abulk sample was collected from the Lawler farm, 7 km eastof Rochester, MN.
Soil ContainersSoil containers were formed from 5-gallon (about 20 L)
tapered plastic buckets with false bottoms (Fig. 1). Thediameter of the bucket was 0.28 m at the soil surface and0.26 m at the top of the false bottom. Holes drilled throughthe false bottom allowed the free flow of air and water fromthe soil into the vented reservoir. During rain application,the bottom drain hole was plugged, thus allowing cumu-lative infiltration to be measured by monitoring the cumu-lative weight of the container. The drain hole was openedduring disk-permeameter measurements to prevent the bot-tom reservoir from filling and interfering with infiltrationflux measurements. An air vent for the bottom reservoirwas opened during rainfall to prevent air-pressure effectson water infiltration.
Each container was first packed with a 0.01- to 0.03-mlayer of Grade 16 sand (average particle diam. = 0.625mm) and then an additional layer of 0.13 m of air-dry soil.Average bulk density of the soil layer corresponded to —1.1Mg m~3. Details of the container set-up and how the soilmatric potential varied during surface seal development hasbeen reported by Freebairn et al. (1991).
Rainfall SimulatorThe laboratory experiments were carried out using a mul-
tiple-intensity, oscillating-head rainfall simulator, as de-scribed by Meyer and Harmon (1979). Meyer and Harmon(1979) showed that, at intensities >6.9 u,m s-1 (25 mmh-1), the impact energy (275 kJ ha-1 mm-1) pf the 80150nozzle is about that of natural rainfall, while the impactenergy (200 kJ ha-1 mm-1) of the 80100 nozzle is aboutthe same as 2.8 u,m s-1 (10 mm h-1) rainstorms. The drop-size distribution of the Veejets (Spraying Systems Co.,Bellwood, IL) provided by Meyer and Harmon (1979) isalso very similar to that observed in a natural rainstorm ofsimilar kinetic energy by Eigel and Moore (1983). Therainfall simulator was =3 m above the soil surface.
Infiltration was measured using simulated rainfall at high(30 n,m s-1) and low (9 u,m s-1) intensities. Rainfall du-ration was varied (from 40 to > 170 min) during each ex-periment so that the total applied rainfall would be equalunder both high- and low-intensity applications. Delays be-tween nozzle sweeps of =0.8 and 1.5 s provided 30 |xms-1 (108 mm h-1) and 9 u,m s-1 (32 mm h-1) intensitiesfrom the 80150 and 80100 nozzles, respectively. For treat-ments requiring cover, a furnace filter was placed on thesoil surface before rainfall impact. The containers were placedon a 5° slope during rainfall to prevent ponding and facil-itate the movement of free water at the surface.
During rainfall, the cumulative container weight wascontinuously monitored using a platform-scale transducerconnected to a data logger. Data were stored as 1-min av-erages of readings taken every second. The platform-scaletransducer was calibrated at the beginning of each day bytaking empty scale readings and readings with a knownmass.
Disk PermeameterThe disk permeameter originally designed by Perroux
and White (1988) was used in this study to characterizeinfiltration at 0-, 35-, and 70-mm tension. The contact-platediameter (0.22 m) was slightly smaller than the soil-con-tainer diameter at various depths. This facilitated the easymovement of the disk permeameter in and out of the con-tainer. Before water flux measurement at each depth, alayer of sand between 1 and 5 mm deep was placed to levelthe exposed surface.
The maximum pore radius (cm) controlling flow at anytension can be found using the capillarity equation (Hillel,1980):
2o- cosa _ 0.15pgh h [1]
where a is the surface tension of water (kg s-2), ot is thecontact angle between the water and the pore wall (assumedto be 0), p is the density of water (kg m-3), g is the ac-celeration due to gravity (m s~2), and h is the suction (cmof H2O) in the permeameter. Infiltration rates at 0-mm ten-sion correspond to water flux through all pores whereasinfiltration rates at tensions of 35 and 70 mm correspondto water flux through pores with diameters <0.86 and <0.43mm, respectively. The infiltration rates were measured at1-min intervals at each tension until a steady-state rate wasreached. Steady state was defined as the point at which therate of change in height of the water level in the permea-meter supply reservoir was the same for at least 5 min. Itgenerally took 30 to 60 min to reach the steady-state fluxat each of the tensions. After a steady state was reached,the infiltration test was stopped, the permeameter refilledwith water if necessary, and the air entry tube in the Mar-iotte reservoir adjusted to the next tension. Time betweenflux measurements at various tensions varied from 0 to 10

716 SOIL SCI. SOC. AM. J., VOL. 56, MAY-JUNE 1992
min. To avoid confusion between various flow rates, werefer to flow rates into soil during simulated rainfall asinfiltration rates and water flow rates with the disk per-meameter as water flux.
For disk-permeameter water fluxes as well as the numberof visible macropores measured at 0.01-, 0.05-, and 0.10-m depths, the soil containers were excavated using a wet-dry vacuum cleaner. Vacuuming provided a quick methodfor removing soil and also eliminated the problem of smear-ing (Trojan and Linden, 1992).Macropore Density and Size
Location of visible macropores was traced on plastic sheets,cut to the diameter of the soil container, before and afterrainfall at each excavation depth. Macropore numbers ateach depth were counted from the plastic sheets.
Experiment 1This experiment was designed to examine whether soils
with earthworm macropores exhibit higher infiltration ratesthan soils without macropores and if the development of asurface seal affects macropore flow. The treatments in-cluded a factorial combination of two rainfall intensities(high or low), two surface cover conditions (bare or surfacecovered with furnace filter) and two macropore conditions(presence or absence of earthworm macropores). Eachtreatment was duplicated.Soil Incubation with Earthworms
The soil was wetted by weight to field capacity watercontent (260 g kg-' moisture for both soils) using deionizedwater. Addition of the water through a furnace-filter coverminimized physical disturbance of the soil surface duringthe wetting process. Seven adult earthworms were placedon the soil surface after the containers were wetted; thisapproximately equals earthworm densities observed in thefield (D.R. Linden, USDA-ARS, St. Paul, MN, personalcommunication, 1989). Earthworms were collected fromfields on the University of Minnesota, St. Paul, campus.Aporrectodea tuberculata were selected since they are themost commonly occurring earthworms in the tilled fieldsof Minnesota (D.R. Linden, personal communication, 1989);Aporrectodea tuberculata is a subsurface dweller and feeder(Zachman et al., 1987).
Sixty grams of ground (<2 mm), moistened corn (Zeamays L.) residue were uniformly spread over the surface ofthe soil for food. The containers were covered with nylonscreen to prevent earthworms from escaping and then placedin a growth chamber for 6 wk. The water content of thesoil was checked biweekly by weighing the containers. Ifthe water content fell below 260 g kg-1, deionized waterwas added to bring the water content back to the field-capacity water content. Control containers without earth-worms were treated similarly except for the addition ofworms.
Growth-chamber temperature settings alternated between7°C at night and 16°C during the day. There were 12 h ofdarkness, a 1.5-h ramp time (the time it takes to changethe temperature from low to high and vice versa), 9 h offull fluorescent and incandescent light, and a 1.5-h ramptime back to darkness. The relative humidity was constantat 75%.
Two days before rainfall, containers in the growth cham-ber were wetted to field-capacity water content to ensuresimilar moisture content between replications. Just prior tothe application of rain, the remaining corn residue on thesoil surface was removed using a vacuum. A slot was cutthrough the container wall at the soil surface to allow run-off. A soil slurry was packed around the edge of the con-tainer to fill cracks and prevent bypass flow along edges.
Flux through individual macropores was measured at the0.00- and 0.01-m depths for the Port Byron soil only. Allvisible pores were included in this measurement. The num-ber of visible macropores was as low as 0 in the low-intensity uncovered treatment at 0-m depth to as high as 27in the low-intensity covered treatment at 0.01-m depth (Ela,1990). Water was directed into individual macropore open-ings with a flexible hose connected to a 100-mL burette.The water level in the burette was monitored every 60 or30 s, depending on the flow rate. A steady-state flow ratewas assumed when three consecutive readings were the same.The measured flux through individual pores varied from 0to 84 cm3 min-1. Several of the macropores were close tothe container wall. Since some of these macropores alsohad high water fluxes, it was assumed that these fluxesreflected the wall effect and are thus not included in thediscussion.
In this experiment, the cross-sectional areas of individualmacropores occurring at 0.00- and 0.01-m depth were alsomeasured by tracing the visible macropores onto plasticsheets and then running the sheets through a portable leafarea meter. The smallest and the largest cross-sectional areasof the visible macropores were 3 and 33 mm2, respectively.Assuming the macropores were circular, the equivalentsmallest and the largest diameters were 1.0 and 3.1 mm,respectively.
Experiment 2This experiment examined the effect of macropore size
on surface seal development. Treatments included a fac-torial combination of two rainfall intensities (high or low),two cover conditions (bare or surface covered with furnacefilter), and four sizes of macropores (2, 3, 4, or 5 mm indiam.). In addition, control containers with no pores werealso included in each treatment. The experiment also in-cluded an additional treatment where no rain was appliedbut water flux with the disk permeameter was measured forvarious sizes of macropores. All treatments were replicatedtwice.
Formation of Artificial MacroporesThirteen artificial macropores were formed in a worm-
free container by inserting a metal dowel of a given di-ameter vertically through a template and through the soil tothe sand layer. The containers were covered with plastic tominimize evaporative water loss and cured for 5 d beforerain application.
RESULTS AND DISCUSSIONSince the results of the experiments were similar
for the Webster and Port Byron soils, most of theresults presented here are for the Webster clay loam.For the purposes of discussion, we have used the termsmacropore flux for the difference in water flux be-tween 0- and 35-mm tension and mesopore flux forthe difference in water flux between 35- and 70-mmtensions. In other words, macropore flux representsthe flux through all pores >0.86 mm diam. and me-sopore flux represents the water flux through poresbetween 0.43- and 0.86-mm diameter.
Effect of Cover and Earthworm Channelson Water Infiltration
The comparison of infiltration rates in Webster clayloam soil with and without earthworm macropores, inthe presence and absence of cover, and for two rainfallintensities is shown in Fig. 2. As is evident from the
ELA ET AL.: MACROPORE FLOW AND SURFACE SEAL INTERACTIONS 717
comparison of the final Infiltration rate and the appliedrainfall rate, the high-intensity rain application ratewas higher than the infiltration capacity of the soil,whereas the low-intensity rate was lower than the soilinfiltration capacity. Runoff occurred from the high-intensity treatments after only a few minutes of rain-fall, whereas no runoff was observed in the low-in-tensity treatments. For a given rainfall intensity, thedifferences in final infiltration rates between coveredand uncovered treatments were distinct. The decreasein infiltration rate in uncovered compared with cov-ered treatments was due to the development of a sealat the soil surface. Since the infiltration rate for theuncovered treatments with and without earthwormmacropores decreased by the same magnitude, theearthworm macropores in soils either did not hinderthe development of the surface seal or the macroporeswere not open to the soil surface.
For covered treatments at a given rainfall intensity,the differences in infiltration rate between containerswith and without earthworms were small (Fig. 2). Thissuggests that the earthworm macropores were not ef-fective in infiltrating rainwater. There could be severalpossible reasons for this: (i) earthworm macroporesare not open to the soil surface; (ii) earthworm cast-ings cause macropore openings to be higher in ele-vation than the surrounding soil, preventing water flowinto the macropores, (iii) the earthworms were block-ing the macropores, or (iv) the overland flow patternsof free water were such that only a small area of thecontainer was contributing water to the macropore and,thus, the macropore was unsaturated.
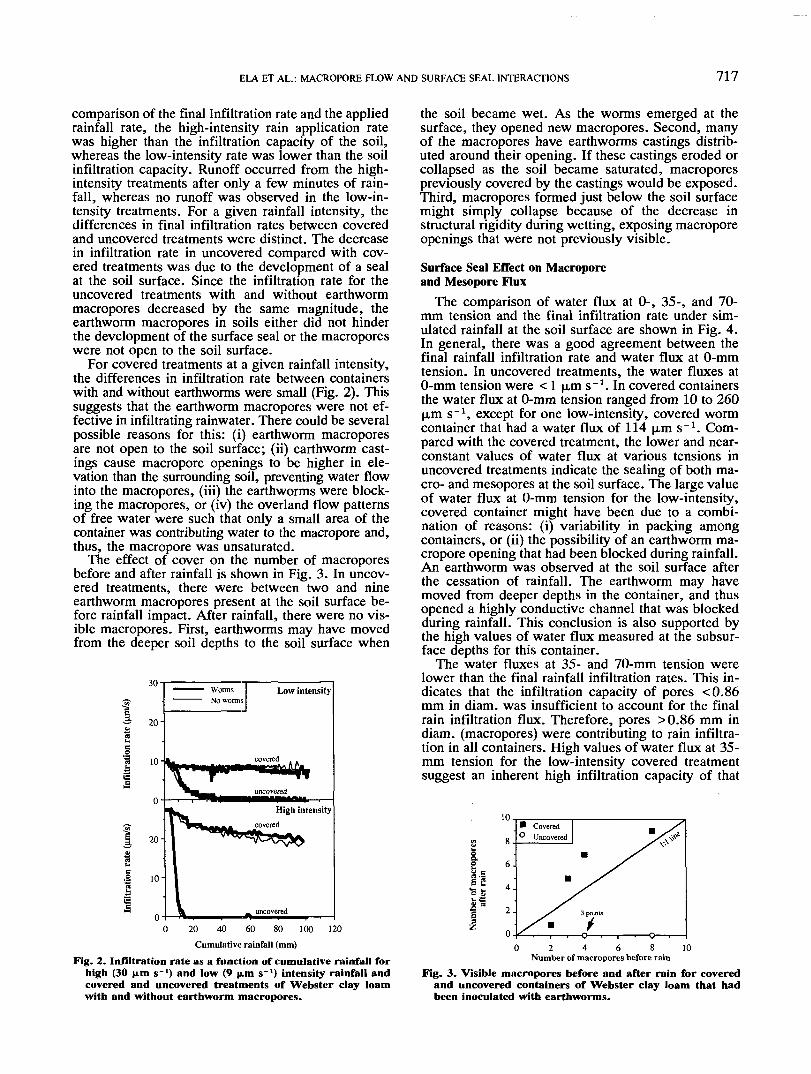
The effect of cover on the number of macroporesbefore and after rainfall is shown in Fig. 3- In uncov-ered treatments, there were between two and nineearthworm macropores present at the soil surface be-fore rainfall impact. After rainfall, there were no vis-ible macropores. First, earthworms may have movedfrom the deeper soil depths to the soil surface when
I0 20 40 60 80 100
Cumulative rainfall (mm)Fig. 2. Infiltration rate as a function of cumulative rainfall for
high (30 |un s~') and low (9 u,m s~') intensity rainfall andcovered and uncovered treatments of Webster clay loamwith and without earthworm macropores.
the soil became wet. As the worms emerged at thesurface, they opened new macropores. Second, manyof the macropores have earthworms castings distrib-uted around their opening. If these castings eroded orcollapsed as the soil became saturated, macroporespreviously covered by the castings would be exposed.Third, macropores formed just below the soil surfacemight simply collapse because of the decrease instructural rigidity during wetting, exposing macroporeopenings that were not previously visible.
Surface Seal Effect on Macroporeand Mesopore Flux
The comparison of water flux at 0-, 35-, and 70-mm tension and the final infiltration rate under sim-ulated rainfall at the soil surface are shown in Fig. 4.In general, there was a good agreement between thefinal rainfall infiltration rate and water flux at 0-mmtension. In uncovered treatments, the water fluxes at0-mm tension were < 1 |xm s"1. In covered containersthe water flux at 0-mm tension ranged from 10 to 260p,m s"1, except for one low-intensity, covered wormcontainer that had a water flux of 114 (xm s"1. Com-pared with the covered treatment, the lower and near-constant values of water flux at various tensions inuncovered treatments indicate the sealing of both ma-cro- and mesopores at the soil surface. The large valueof water flux at 0-mm tension for the low-intensity,covered container might have been due to a combi-nation of reasons: (i) variability in packing amongcontainers, or (ii) the possibility of an earthworm ma-cropore opening that had been blocked during rainfall.An earthworm was observed at the soil surface afterthe cessation of rainfall. The earthworm may havemoved from deeper depths in the container, and thusopened a highly conductive channel that was blockedduring rainfall. This conclusion is also supported bythe high values of water flux measured at the subsur-face depths for this container.
The water fluxes at 35- and 70-mm tension werelower than the final rainfall infiltration rates. This in-dicates that the infiltration capacity of pores <0.86mm in diam. was insufficient to account for the finalrain infiltration flux. Therefore, pores >0.86 mm indiam. (macropores) were contributing to rain infiltra-tion in all containers. High values of water flux at 35-mm tension for the low-intensity covered treatmentsuggest an inherent high infiltration capacity of that
I-a
I2 4 6 8
Number of macropores before rain10
Fig. 3. Visible macropores before and after rain for coveredand uncovered containers of Webster clay loam that hadbeen inoculated with earthworms.

718 SOIL SCI. SOC. AM. J., VOL. 56, MAY-JUNE 1992
Water flux (nm/s) Water flux (jim/s)0 20 40 60 80 20 40 60 80
WormsHigh, coveredLow, coveredHigh, uncoveredLow, uncovered
No wormsHigh, coveredLow, coveredHigh, uncoveredLow, uncovered
0 10 20 30Final rain infiltration rate (|0.m/s)
Fig. 4. Water flux at 0-, 35-, and 70-mm tension vs. finalinfiltration rates under simulated rainfall for Webster clayloam: (a) high- and (b) low-intensity rainfall correspondedto 30 fim s-1 (108 mm h~') and 9 |un s-1 (32 mm h'1),respectively. Note the change in scale for (a).
container, which may have been due to variation inpacking.
Macropore and Mesopore Flux Contributionwith Depth
The macro- and mesopore fluxes at various depthsin the treatments are shown in Fig. 5. As expected,containers with earthworms (Fig. 5, broken lines) gen-erally had higher water fluxes than containers withoutearthworms (Fig. 5, solid lines) at three depths (0.01,0.05, and 0.10 m). The differences in water fluxesbetween worm and no-worm treatments and the in-crease in water fluxes between the surface and 0.01-m depths demonstrate that, while macropores have apotential to increase water flux in the soil at subsur-face depths, they may be ineffective in contributingto infiltration in the soil. This may be due to macro-pore discontinuity to the surface, inaccessibility of waterto macropores due to higher microrelief around theopenings, or development of surface sealing duringraindrop impact.
This conclusion has important ramifications for ex-perimental studies. Removal of even 0.01 m of sur-face soil before infiltration measurements coulddramatically increase the macropore flux contribu-tions. This means that, while excavation of soil toexpose macropore openings provides information onpotential macropore flow (e.g., Peterson and Dixon,1971; Bouma, 1982; Edwards et al., 1988a; Habib et
o' ••
o.io-
0.12Macropores Mesopores
high, cov, wormshigh, cov, no wormshigh, uncov, wormshigh, uncov, no worms
low, cov, wormslow, cov, no wormslow, uncov, wormslow, uncov, no worms
Fig. 5. Variation in macropore and mesopore flux with soildepth in containers of Webster clay loam. Macropore fluxis defined as the difference in water flux at 0- and 35-mmtension and mesopore flux as the difference in water flux at35- and 70-mm tension. Each data point represents an averageof two replicates.
80
~ 60-
ii 'Jj 4°-l
If 20H
0
60-
g.-S' 40-||
S «j 20-
0^
Depth (m)° 0.00A 0.01• 0.05• 0.1
0 20 40 60 80Number of macropores
Fig. 6. Relationship of water flux at 0-mm tension and themacropore water flux versus the number of visible earthwormmacropores at four depths in Webster clay loam that hadbeen inoculated with earthworms.
al., 1988; Lauren et al., 1988), extrapolation of theseinfiltration rates or the number of macropore openingsback to the surface may provide incorrect estimatesof the surface infiltration rate.
Infiltration Rate vs. Number of MacroporesThe number of visible earthworm macropores on
the surface may be a poor predictor of the water fluxat 0-mm tension or the macropore flux. There waslittle or no correlation between pore numbers and waterflux at 0-mm tension or macropore flux (Fig. 6). Thenumber of macropores increased below the surface,with a maximum number occurring at either 0.05 or

ELA ET AL.: MACROPORE FLOW AND SURFACE SEAL INTERACTIONS 719
0.10 m. The water flux at 0-mm tension was alwayshigher at depths below the soil surface. Depending onthe treatment, the maximum water flux generally oc-curred at 0.05 or 0.10 m. The poor relationship be-tween number of macropores and infiltration rates at0-mm tension (Fig. 6) suggests a lack of continuity insome of the macropores at each depth.Water Flux through Individual Macropores
The increase in water flux into the Webster (Fig.5) soil in treatments with worms, compared with treat-ments without worms, demonstrates that earthwormmacropores can increase water flux in soil. The poorrelationship between the number of visible macro-pores and measured infiltration rates (Fig. 6), how-ever, indicates that only a few of the visible macroporesactually contribute to water flow. Measurements ofwater flow through individual earthworm macroporesin Port Byron silt loam at 0.00- and 0.01-m depthsupports this conclusion (Fig. 7). The ineffectivenessof a majority of the macropores in conducting waterdemonstrates that most of the visible macropores atthe soil surface and 0.01 m are discontinuous withdepth. The flow through only a few macropores,therefore, is responsible for the increased rainfall in-filtration rates observed in the earthworm-inoculatedcontainers.Macropore Area
The effect of cover on the macroporosity of the PortByron soil is shown in Fig. 8. Macropores at the sur-face occupied 0.19 and 0.39% of the area in high-and low-intensity covered treatments, respectively. Inuncovered treatments under both intensities, macro-pores at the surface occupied only 0.02% of the area.At 0.01-m depth, the macroporosities in covered anduncovered treatments were similar for the high-densitytreatment. The macroporosity of the low-intensity,covered treatment was higher than the correspondingvalue of the uncovered treatment. For all treatments
30
a10-
20-
10-
0.00m
0.01m
II..I0 5 10 15 20 25 30 35 40
Individual macropore flux (cm3/min)45
Fig. 7. Frequency distribution of macropores having variousflux rates at 0.00- and 0.01-m soil depth in Port Byron siltloam.
at the 0.01-m depth, the total area occupied by ma-cropores was a relatively small fraction of the soilarea. These observations suggest that only a smallportion of the soil surface contributes to macroporeflux, as calculated from the disk-permeameter mea-surements of water flux.
Artificial MacroporesAs described above for containers with earthworm
macropores, infiltration rates into covered containerswith artificial macropores were also higher than thoseinto similarly treated uncovered containers for bothhigh and low rainfall intensities (Fig. 9). This de-crease in infiltration rate for bare soil was due to thedevelopment of a surface seal. Under high-intensityrainfall, the surface seal completely blocked all ma-cropores, irrespective of their size, after 10 mm (6min) of rainfall. Under low-intensity rainfall, 20 to 30mm (40 min) of rainfall were necessary to develop asurface seal and block the macropores.
The infiltration rates of sealed surfaces (uncoveredtreatments) were slightly higher for the low-intensityrainfall than for the high-intensity rainfall. Also, thesurface seal formed under low-intensity rainfall didnot close all the artificial macropores at the surface(Fig. 10). Final rainfall infiltration rates did not cor-relate well with the number of open macropores.
The artificial macropore treatments demonstrate thatsurface seals can quickly block even large (5-mm)macropores under high-intensity rainfall. Although 30(xm s"1 (104 mm h"1) is a high intensity it would onlyneed to occur for a few minutes during part of a lowerintensity storm. Once the seal is formed, infiltrationinto that soil is essentially zero. Seals formed by lowerintensity rains on uncovered soils only partially cov-ered macropores open to the surface. The inwashingof soil material probably clogged these macropores at
0.008
0.006 -
| 'E 0.004 -
§ "" 0.002
0.000
0.006 -
!_ 'E o.oo4 -
I "" 0.002
0.000
0.00m
0.01m
HC HU LC LU
Fig. 8. The fraction of total area occupied by visible macroporesat two depths in treatments of Port Byron soil inoculatedwith earthworms. The treatments are HC — high intensity,covered; HU — high intensity, uncovered; LC — low intensity,covered; and LU — low intensity, uncovered. High- andlow-intensity rainfall corresponded to 30 Jim s~' (108 mmh~') and 9 pm s~' (32 mm h~'), respectively.

720 SOIL SCI. SOC. AM. J., VOL. 56, MAY-JUNE 1992
Ia>S
20 40 60Cumulative rainfall (mm)
20 40 60Cumulative rainfall (mm)
80
Fig. 9. Variation in infiltration rates into Webster clay loam with 13 artificial macropores as a function of cumulative rainfall.Macropores corresponded to 2, 3, 4, or 5 mm in diam. and were created by pushing metal rods through the soil. High- andlow-intensity rainfall corresponded to 30 jim s~' (108 mm h-1) and 9 JAHI s~' (32 mm h-1), respectively.
subsurface depths and prevented them from contrib-uting to flow. Only 5-mm-diam. macropores in thelow-intensity, uncovered treatment continued to con-duct water after the seal was formed.
CONCLUSIONSThe important conclusions from the experiments are
that: (i) the development of a surface seal reducesinfiltration rates into these soils primarily by decreas-ing macropore flux, (ii) most visible macropores formedby A tuberculata are discontinuous to the soil surfaceand thus do not contribute to rainfall infiltration, (iii)the rainfall infiltration rate or macropore flux is un-related to the number of visible macropores formedby A. tuberculata, and (iv) despite being open to the
._ £
•S S.*- P•S§e iz
1 2 3 4 5 6Diameter (mm)
Fig. 10. The number of artificial macropores remaining openat the surface of Webster clay loam under two rainfallintensities and in the presence or absence of cover. Thirteenmacropores of 2, 3, 4, or 5 mm in diam. were formed ineach container prior to rainfall. High- and low-intensityrainfall corresponded to 30 (Jim s~' (108 mm h ') and 9 |ims~* (32 mm h~'), respectively.
surface, macropores of the earthworm species studiedmay not conduct significant quantities of water duringrainfall because either they are blocked below the sur-face, the microrelief of the macropore opening pre-vents water entry into the macropore, or the contributingarea for runoff into the macropore is less than thatneeded to saturate the macropore. From the artificiallyformed and earthworm macropore studies, we con-cluded that the preferential flow of rainwater throughmacropores in these soils under bare tilled conditionswill be limited by the development of surface sealsthat will block most macropore openings up to 5 mmin diameter and by factors that decrease water fluxinto macropore openings.
ACKNOWLEDGMENTSThe authors gratefully acknowledge the funding support
of the Graduate School, University of Minnesota, and theLand Stewardship Project, Lewiston, MN, for data-loggingequipment and laboratory supplies.

RADULOVICH ET AL.: BYPASS FLOW THROUGH MICROAGGREGATED SOILS 721