macroeconomic determinants of economic growth in … · macroeconomic determinants of economic...
TRANSCRIPT
The Pakistan Development Review 37 : 2 (Summer 1998) pp. 125—148
Macroeconomic Determinants of Economic Growth in Pakistan
ZAFAR IQBAL and GHULAM MUSTAFA ZAHID
The main purpose of this paper has been to examine the effects of some of the key
macroeconomic variables on Pakistan’s economic growth. Multiple regression framework is used to separate out the effects of key macroeconomic factors on growth over the period 1959-60 to 1996-97. The quantitative evidence shows that primary education to be an important prerequisite for accelerating growth. Similarly, increasing the stock of physical capital would help to contribute to growth. The empirical results also suggest that openness of Pakistan’s economy promotes economic growth. Alternatively, the budget deficit is negatively related to both output growth variables. The external debt is also negatively related to growth, suggesting that relying on domestic resources is the best alternative to finance growth. However, the results presented in this study reinforce the importance of sensible long-run growth-oriented policies to obtain sustainable growth.
1. INTRODUCTION
Over the years, the unsustainable and downward trend in economic growth in Pakistan is worrisome for policy-makers, professionals, and foreign aid donor agencies. The unsustainable economic growth has been blamed mainly on the high inflation rate, a mounting fiscal deficit, increasing foreign debt and debt servicing, weak foreign demand for Pakistani products, low level of physical and human capital, unfavourable weather, political instability, and, among other factors, a deteriorating law and order situation in the country.
Economists began about 40 years ago to map the linkages between foreign aid and economic growth for developing countries. Gradually, their analysis has become more sophisticated. In this regard, the development of the two-gap models was an
Zafar Iqbal and Ghulam Mustafa Zahid are Senior Research Economist and Research Demographer, respectively, at the Pakistan Institute of Development Economics, Islamabad.
Authors’ Note: We acknowledge the useful comments and suggestions made by Ghulam Mohammad Arif, Ashfaq H. Khan and Zafar Mahmood. We are also thankful to anonymous referees of this journal for their helpful comments on an earlier version of this paper.
Iqbal and Zahid 126
important contribution to the literature of economic development.1 The central idea of the two-gap analysis is that foreign aid can serve as a means of breaking the bottlenecks, thereby permitting fuller utilisation of all resources and a continuation of development in an economy. The two-gap models, however, have been subject to a number of general criticisms, some directed more specifically at their application to analysing the impact of foreign aid on economic growth in developing countries. The opponents of the two-gap approach argue that foreign aid can impede rather than facilitate development in recipient countries.2 More recently, two-gap models have been extended into three-gap models, adding a fiscal constraint to the traditional foreign-exchange constraint and savings constraint as a third gap limiting the growth prospects of highly indebted developing economies.3 Two-gap and three-gap models, however, have been mainly criticised because of one of their strong assumptions that foreign assistance provides a one-to-one increment to the capital stock, as there is a range of mechanisms through which foreign aid may displace domestic capital formation and enhance domestic consumption in recipient countries.
Alternatively, a large theoretical and empirical literature exists relating a range of policy variables to economic growth in cross-country studies,4 but there have been few attempts to relate policy variables to growth in country-specific studies.5 Similarly, to the best of our knowledge, studies on determinants of economic growth in Pakistan have been very few; for example, Iqbal (1995, 1994), Khilji and Mahmood (1997), and Shabbir and Mahmood (1992). The main thrust of Iqbal (1994) is to analyse the impact of structural adjustment lending on real output growth in Pakistan. The regression results showed that real output growth declined with the availability of adjustment lending and there was a deterioration in the terms of trade while, alternatively, favourable weather and real domestic savings growth produced positive effects on real GDP growth. Iqbal (1995), in another study, uses a three-gap model to examine macroeconomic constraints to Pakistan’s economic growth, and shows that real devaluation, growth in foreign demand, and capacity utilisation allowed an accelerated growth rate of real GDP in Pakistan. Khilji and Mahmood (1997) find the defence burden to be negatively related to GDP growth. Shabbir and
1For example, Weisskopf (1972, 1972a); Landau (1971); Chenery and McEwan (1966); Chenery and Strout (1966); Adelman and Chenery (1966); McKinnon (1964) and Chenery and Bruno (1962), among others.
2For example, Mosley (1980); Findlay (1973); Voivodas (1973); Griffin and Enos (1970), and Bruton (1969).
3For example, Iqbal et al.(1998); Iqbal (1996, 1995); Taylor (1994, 1993, 1990, 1990a); Bacha (1990) and Solimano (1990).
4For example, Barro and Sala-i-Martin (1995); Hadjimichael et al. (1995); Barro and Lee (1994); Easterly and Rebello (1993); Mankiw et al. (1992); Barro (1991, 1990, 1989); Romer (1990, 1986); Becker et al. (1990); Khan and Reinhart (1990); Lucas (1988), and Hicks (1979), among others.
5Some papers, by Ram (1987) for time-series analysis of 88 developing countries, by McCarthy et al. (1985) for Colombia, by Sundararajan and Thakur (1980) for India and Korea, and by Elias (1978) for Latin American countries, are exceptions.
Macroeconomic Determinants of Economic Growth 127
Mahmood (1992) conclude that net foreign private investment has significant positive effects on the rate of growth of real GNP, while three other explanatory variables—namely, disbursements of external grants and loans, domestic savings, and exports—have a positive but statistically insignificant impact on real GNP growth.
However, these studies on growth in Pakistan suffer from some basic shortcomings. For example, they ignore the most important policy variables such as fiscal deficit, human and physical capital, openness of economy, external debt, and domestic demand. It is well-known in the recent literature that economic growth in developing countries depends crucially on these explanatory factors. Moreover, the previous studies do not find out the absolute and relative contributions of each individual explanatory variable to economic growth, while it is of crucial significance for policy formulation to find out the extent of each explanatory factor affecting economic growth. Keeping in view the correlation of individual variables, policy-makers can correct their policies in order to enhance long-run output growth. This study, therefore, fills these gaps not only by incorporating the important policy variables but also by using the latest available time-series data of Pakistan’s economy for the period 1959-60 to 1996-97. It provides quantitative evidence by undertaking econometric estimates of various key macroeconomic policies explaining economic growth in Pakistan.
The paper is organised in five sections. Section 2 presents the basic simple growth model. Section 3 reviews trends over time in output growth and other relevant explanatory variables during the period 1949-50 to 1996-97. Section 4 presents empirical testing of some of the implications of the growth model. Finally, the concluding section turns to indicate appropriate policy interventions to sustain and foster economic growth in Pakistan.
2. METHODOLOGY AND DATA
This section presents a simple growth model that attempts to capture the impact of some of the key macroeconomic policy variables on output growth in Pakistan. Two separate behavioural functions of growth rates in per capita real income (PCIg) and real GDP (Yg), representing economic growth, are specified as follows:
PCIg = β0 + β1 (PSE/LF) + β2(MSE/LF) + β3(HSE/LF) + β4O(OSE/LF) + β5(K/GDP) + β6(BD/GDP) + β7(X/GDP) + β8(M/GDP) +
β9(ED/GDP) + β10 PCI + β11PCISQ … … … … (1) Yg = α0 + α1(PSE/LF) + α2(MSE/LF) + α3(HSE/LF) + α4(OSE/LF) + α5(K/GDP) + α6(BD/GDP) + α7(X/GDP) + α8(M/GDP) +
Iqbal and Zahid 128
α9(ED/GDP) + α10 PCI + α11PCISQ … … … … (2) The explanatory variables chosen in the above Equations (1) and (2) are those
that appear in growth regressions of Easterly (1993), Easterly et al. (1993), and Barro (1991), as well as several others that are common in the literature. Table 1 provides the definitions of variables used and the sources of the data. It is noteworthy that some of the explanatory variables are normalised by GDP. One of the main advantages of normalisation of the relevant variables by GDP is to eliminate certain econometric problems, particularly multicollinearity among the explanatory variables.
Table 2 summarises the theoretical justification for the inclusion of selected explanatory variables used in the above specified functions. Starting from human capital, the role of human capital in explaining variation in the rate of growth of output is one that has been given considerable attention in the current literature relating to economic growth in developing countries. In the literature, as with many other variables, there has been conflicting evidence over the role of human capital in affecting the growth of output in developing countries. A number of studies, for example, Pritchett (1996); Benhabib and Spiegel (1994) and Spiegel (1994), have found a negative association between human capital and growth. Most recent economic growth studies (reported in Table 2), however, have listed human capital as a primary source of economic growth. These studies show that countries with greater initial stock of human capital experienced a more rapid rate of introduction of new goods and thereby tended to grow faster. Moreover, there is no general consensus among economists on the definition of human capital. The most commonly used proxies for human capital are the school enrolments as ratio to total employed labour force or total population, enrolment rate, adult literacy rate, and investment on education and health.6 Since the time-series data on all these alternative proxies of human capital are not readily available, in this study we use enrolments in primary schools (PSE), middle schools (MSE), high schools (HSE), and other educational institutions (OSE) as ratios to total employed labour force as proxies for human capital.7 Indeed, the enrolment data suffer from the same problems as other proxies of human capital because no one measure gives a direct skill available in the labour force. Turning to physical capital, growth and development theories have long regarded the accumulation of physical capital as the engine of a long-run sustained economic growth process. Moreover, the strong association between capital stock and growth performance is a well-established empirical fact in a number of recent studies, as indicated in Table 2, which shows that the higher rate of physical capital
6It is noted that none of these proxies of human capital provides a direct measure of skills available in the labour force. Even the existing Labour Force Surveys in Pakistan provide incomplete information on skills of the workforce.
7The enrolment rate measured as number of students enrolled in the designated class relative to the total population of the corresponding age group as a proxy for human capital might be a more appropriate explanatory variable, as has been used in numerous cross-section studies, but the necessary time-series data are not readily available in the case of Pakistan.
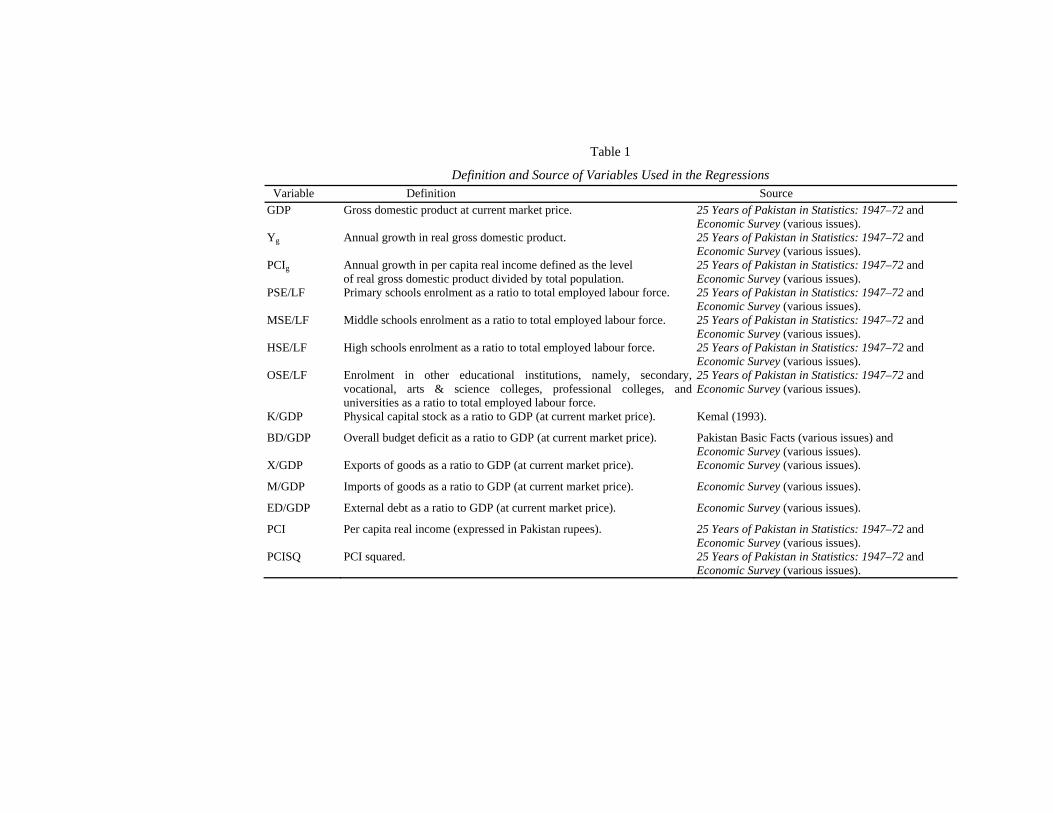
Table 1
Definition and Source of Variables Used in the Regressions Variable Definition Source GDP Gross domestic product at current market price. 25 Years of Pakistan in Statistics: 1947–72 and
Economic Survey (various issues). Yg Annual growth in real gross domestic product. 25 Years of Pakistan in Statistics: 1947–72 and
Economic Survey (various issues). PCIg Annual growth in per capita real income defined as the level
of real gross domestic product divided by total population. 25 Years of Pakistan in Statistics: 1947–72 and Economic Survey (various issues).
PSE/LF Primary schools enrolment as a ratio to total employed labour force. 25 Years of Pakistan in Statistics: 1947–72 and Economic Survey (various issues).
MSE/LF Middle schools enrolment as a ratio to total employed labour force. 25 Years of Pakistan in Statistics: 1947–72 and Economic Survey (various issues).
HSE/LF High schools enrolment as a ratio to total employed labour force. 25 Years of Pakistan in Statistics: 1947–72 and Economic Survey (various issues).
OSE/LF Enrolment in other educational institutions, namely, secondary,vocational, arts & science colleges, professional colleges, and universities as a ratio to total employed labour force.
25 Years of Pakistan in Statistics: 1947–72 and Economic Survey (various issues).
K/GDP Physical capital stock as a ratio to GDP (at current market price). Kemal (1993).
BD/GDP Overall budget deficit as a ratio to GDP (at current market price). Pakistan Basic Facts (various issues) and Economic Survey (various issues).
X/GDP Exports of goods as a ratio to GDP (at current market price). Economic Survey (various issues).
M/GDP Imports of goods as a ratio to GDP (at current market price). Economic Survey (various issues).
ED/GDP External debt as a ratio to GDP (at current market price). Economic Survey (various issues).
PCI Per capita real income (expressed in Pakistan rupees). 25 Years of Pakistan in Statistics: 1947–72 and Economic Survey (various issues).
PCISQ PCI squared. 25 Years of Pakistan in Statistics: 1947–72 and Economic Survey (various issues).

Table 2
Expected Impact of Explanatory Variables in Output Growth Functions Suggested Variables in the Regressions Expected Impact of Explanatory Variables on Growth Source Human Capital PSE/LF,
MSE/LF, HSE/LF, OSE/LF
Promoting human capital is expected to be instrumental in enhancing economic growth.
Barro and Sala–i–Martin (1995); Barro and Lee (1994); Mankiw et al. (1992); Barro (1991, 1989); Romer (1990); Becker et al. (1990); Lucas (1988) and Psacharopoulos (1973).
Physical Capital K/GDP Increasing rate of physical capital is expected to lead to higher rates of economic growth.
Easterly and Rebello (1993); Barro (1991); Khan and Reinhart (1990) and Sundararajan and Thakur (1980).
Fiscal Deficit BD/GDP It is expected that increasing budget deficit (or non- development expenditure) is associated with lower output growth.
Iqbal (1997, 1996); Easterly (1993); Easterly et al. (1993); Khan and Iqbal (1991); Murphy et al. (1991); Barro (1991, 1990, 1989); Grier and Tullock (1989); Barth and Brandely (1987); Landua (1986, 1983) and Kormendi and Meguire (1985).
Foreign Trade X/GDP, M/GDP
Increased openness of an economy (defined as imports and exports) is expected to promote growth.
Iqbal (1995); Shabbir and Mahmood (1992); Romer (1990, 1986); Grossman and Helpman (1989, 1989a); Lucas (1988); World Bank (1987); Hicks (1979) and Ram (1987).
Foreign Debt ED/GDP Increasing external debt is assumed to have a negative impact on economic growth.
Borensztein (1990, 1990a) and Eaton (1987).
Per Capita Real Income
PCI Following the basic neoclassical growth models, the output growth rate is expected to be inversely related to the absolute level of per capita real income.
Barro (1991).
Squared Per Capita Real Income
PCISQ An expected positive coefficient of the squared per capita real income implies that the force towards convergence (i.e., negative relation between growth and per capita real income) may attentuate as per capita real income rises.
Barro (1991).

Macroeconomic Determinants of Economic Growth 131
(or investment) leads to a higher rate of economic growth.8 Initially, the effects of fiscal policy on economic growth remained ambiguous
in the theoretical and empirical literature but the recent growth studies, mentioned in Table 2, have found a negative association between fiscal policy variables (budget deficit or non-development expenditure) and economic growth variables. Turning to the foreign trade sector, the theoretical and empirical literature both indicate that openness of an economy accelerates economic growth through its effects of increased competition, access to trade opportunities on efficiency of resource allocation, positive externalities stemming from access to improved technology and the accompanying knowledge spillovers, and access to essential production inputs from abroad. In addition, through openness, countries can manage to overcome the small size of their domestic market, relax foreign exchange constraint, and obtain positive externalities. In this paper, foreign trade variables—namely, exports of goods as a ratio to gross domestic product (X/GDP) and imports of goods as a ratio to gross domestic product (M/GDP)—are taken separately; these represent openness of Pakistan’s economy. Finally, following Barro (1991), we also use two income variables, namely, per capita real income (PCI) and squared per capita real income (PCISQ), as explanatory factors in growth functions (1) and (2). Regarding the real per capita income variable, it is expected that when per capita income is higher, it is harder to grow, as argued by Barro (1991). The second indirect effect that may be assumed is that in low-income countries like Pakistan, having high population growth rates and high dependency ratios, any increase in per capita real income raises consumption, thereby leaving low savings (or dissavings) and consequently lower output growth. Further, another income variable is squared per capita real income, which implies that instead of a linear form, the relation between growth rate in per capita real income and the level of per capita real income is now quadratic.
3. DEVELOPMENT OVER TIME OF KEY VARIABLES
Before proceeding to empirical investigation of growth functions, it may be useful to provide a cursory look of development over time of key variables used in the analysis. The data regarding growth rates of real GDP and per capita real income are taken into account; exports of goods, imports of goods, external debt, budget deficit, and physical capital are taken as percentages of GDP; and school enrolments as ratios to total employed labour force are divided into five decades, the 1950s, 1960s, 1970s, 1980s, and 1990s. Table 3 reviews the performance of these variables. It shows that positive average growth rates in real GDP and per capita real income
8Some researchers like Easterly and Rebelo (1993); Barro (1991) and Khan and Reinhart (1990) used real physical investment as a ratio to real GDP as a physical capital variable because the data on physical capital stock were not available. But we use real physical capital stock as a ratio to real GDP because the necessary time-series data are available in the case of Pakistan.

Iqbal and Zahid 132
Table 3
Development of Variables Used in the Regressions, 1950–997
Variable 1950s 1960s 1970s 1980s 1990s Yg (in Percentage) 2.74 6.52 5.08 6.41 4.70
PCI (in Pak. Rupees) 1609.00 1971.00 2536.00 3330.00 4108.00
PCIg (in Percentage) 0.27 3.61 1.89 3.23 1.68
PSE/LF (in Percentage) – 17.36 23.29 25.30 39.27
MSE/LF (in Percentage) – 3.71 5.53 6.57 9.96
HSE/LF (in Percentage) – 1.34 2.10 2.34 3.83
OSE/LF (in Percentage) – 1.00 1.53 1.95 2.96
K/GDP (in Percentage) 95.99 130.26 140.95 143.24 146.73
BD/GDP (in Percentage) – –2.03 9.38 7.78 7.35
X/GDP (in Percentage) 6.24 4.20 8.71 11.05 14.85
M/GDP (in Percentage) 9.32 11.48 14.57 20.27 19.89
ED/GDP (in Percentage) – 16.41 48.40 38.23 41.47
For the definition of variables, see Table 1.
were recorded during all the five decades. The incidence of growth, however, varied markedly and remained unstable during the whole period. Table 3 shows that Pakistan experienced annual average growth rates in real GDP of 2.7 percent in the 1950s, 6.5 percent in the 1960s, 5.1 percent in the 1970s, 6.4 percent in the 1980s, and 4.7 percent in the 1990s, while growth rates in per capita real income remained 0.3 percent, 3.6 percent, 1.9 percent, 3.2 percent, and 1.7 percent during the five decades, respectively.
Accumulation of physical and human capital is considered a major source of economic growth. Estimates of physical capital stock for the period 1947–93 are taken from Kemal (1993), and for the remaining years, 1994–97, data are generated using the depreciation rate and the gross fixed capital formation as in Kemal. Table 3 shows that physical capital stock as a percentage of GDP was only 96.0 in 1950s. Afterwards it significantly increased to 130.3 in the 1960s, 141.0 in the 1970s, 143.2 in the 1980s, and 146.7 in the 1990s. Turning to human capital, the levels of enrolment in primary schools, middle schools, high schools, and other educational institutions (i.e., secondary vocational, arts and science colleges, professional colleges, and universities) as a percentage of total employed labour force are taken as proxies for human capital in Pakistan. Table 3 delineates the existing human capital over the period under review. It shows that as a percentage of total employed labour
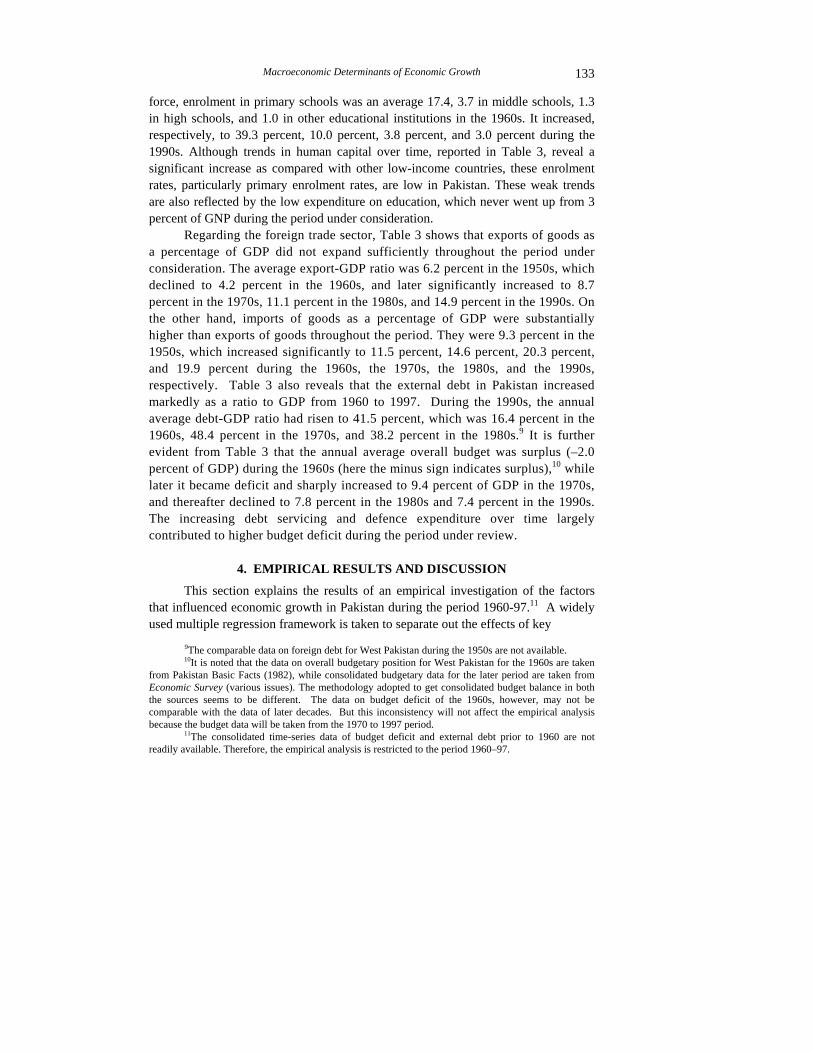
Macroeconomic Determinants of Economic Growth 133
force, enrolment in primary schools was an average 17.4, 3.7 in middle schools, 1.3 in high schools, and 1.0 in other educational institutions in the 1960s. It increased, respectively, to 39.3 percent, 10.0 percent, 3.8 percent, and 3.0 percent during the 1990s. Although trends in human capital over time, reported in Table 3, reveal a significant increase as compared with other low-income countries, these enrolment rates, particularly primary enrolment rates, are low in Pakistan. These weak trends are also reflected by the low expenditure on education, which never went up from 3 percent of GNP during the period under consideration.
Regarding the foreign trade sector, Table 3 shows that exports of goods as a percentage of GDP did not expand sufficiently throughout the period under consideration. The average export-GDP ratio was 6.2 percent in the 1950s, which declined to 4.2 percent in the 1960s, and later significantly increased to 8.7 percent in the 1970s, 11.1 percent in the 1980s, and 14.9 percent in the 1990s. On the other hand, imports of goods as a percentage of GDP were substantially higher than exports of goods throughout the period. They were 9.3 percent in the 1950s, which increased significantly to 11.5 percent, 14.6 percent, 20.3 percent, and 19.9 percent during the 1960s, the 1970s, the 1980s, and the 1990s, respectively. Table 3 also reveals that the external debt in Pakistan increased markedly as a ratio to GDP from 1960 to 1997. During the 1990s, the annual average debt-GDP ratio had risen to 41.5 percent, which was 16.4 percent in the 1960s, 48.4 percent in the 1970s, and 38.2 percent in the 1980s.9 It is further evident from Table 3 that the annual average overall budget was surplus (–2.0 percent of GDP) during the 1960s (here the minus sign indicates surplus),10 while later it became deficit and sharply increased to 9.4 percent of GDP in the 1970s, and thereafter declined to 7.8 percent in the 1980s and 7.4 percent in the 1990s. The increasing debt servicing and defence expenditure over time largely contributed to higher budget deficit during the period under review.
4. EMPIRICAL RESULTS AND DISCUSSION
This section explains the results of an empirical investigation of the factors that influenced economic growth in Pakistan during the period 1960-97.11 A widely used multiple regression framework is taken to separate out the effects of key
9The comparable data on foreign debt for West Pakistan during the 1950s are not available. 10It is noted that the data on overall budgetary position for West Pakistan for the 1960s are taken
from Pakistan Basic Facts (1982), while consolidated budgetary data for the later period are taken from Economic Survey (various issues). The methodology adopted to get consolidated budget balance in both the sources seems to be different. The data on budget deficit of the 1960s, however, may not be comparable with the data of later decades. But this inconsistency will not affect the empirical analysis because the budget data will be taken from the 1970 to 1997 period.
11The consolidated time-series data of budget deficit and external debt prior to 1960 are not readily available. Therefore, the empirical analysis is restricted to the period 1960–97.
Iqbal and Zahid 134
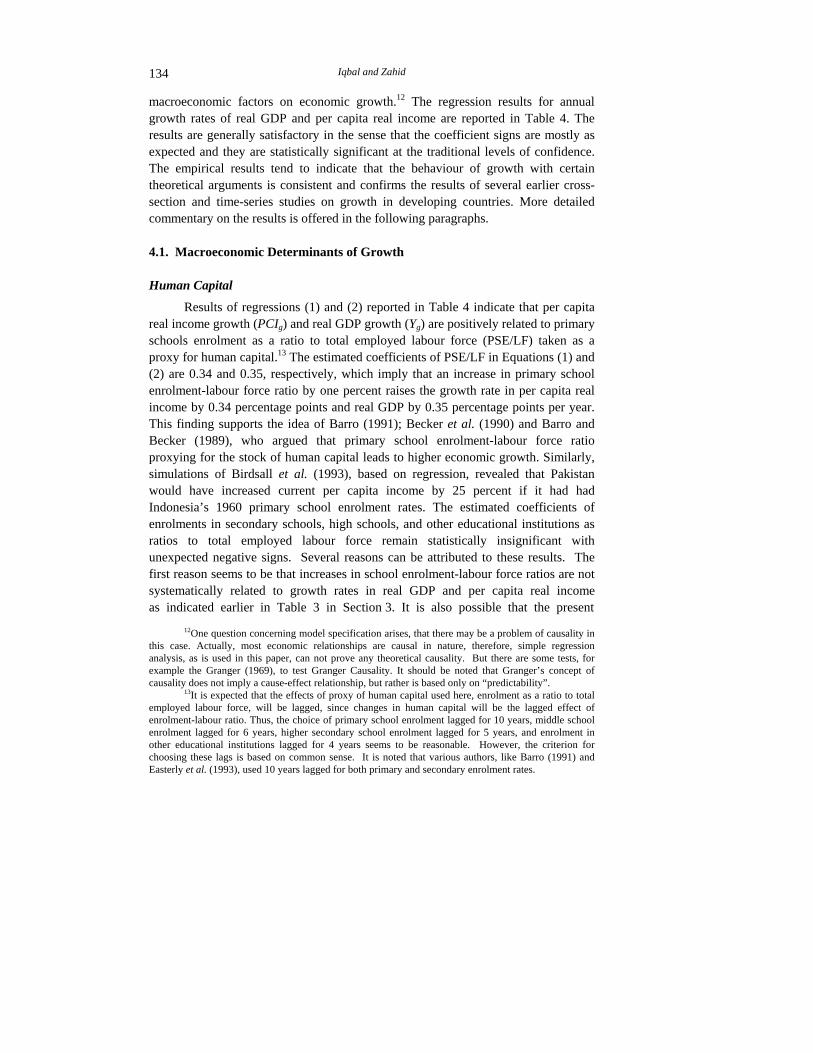
macroeconomic factors on economic growth.12 The regression results for annual growth rates of real GDP and per capita real income are reported in Table 4. The results are generally satisfactory in the sense that the coefficient signs are mostly as expected and they are statistically significant at the traditional levels of confidence. The empirical results tend to indicate that the behaviour of growth with certain theoretical arguments is consistent and confirms the results of several earlier cross-section and time-series studies on growth in developing countries. More detailed commentary on the results is offered in the following paragraphs. 4.1. Macroeconomic Determinants of Growth Human Capital
Results of regressions (1) and (2) reported in Table 4 indicate that per capita real income growth (PCIg) and real GDP growth (Yg) are positively related to primary schools enrolment as a ratio to total employed labour force (PSE/LF) taken as a proxy for human capital.13 The estimated coefficients of PSE/LF in Equations (1) and (2) are 0.34 and 0.35, respectively, which imply that an increase in primary school enrolment-labour force ratio by one percent raises the growth rate in per capita real income by 0.34 percentage points and real GDP by 0.35 percentage points per year. This finding supports the idea of Barro (1991); Becker et al. (1990) and Barro and Becker (1989), who argued that primary school enrolment-labour force ratio proxying for the stock of human capital leads to higher economic growth. Similarly, simulations of Birdsall et al. (1993), based on regression, revealed that Pakistan would have increased current per capita income by 25 percent if it had had Indonesia’s 1960 primary school enrolment rates. The estimated coefficients of enrolments in secondary schools, high schools, and other educational institutions as ratios to total employed labour force remain statistically insignificant with unexpected negative signs. Several reasons can be attributed to these results. The first reason seems to be that increases in school enrolment-labour force ratios are not systematically related to growth rates in real GDP and per capita real income as indicated earlier in Table 3 in Section 3. It is also possible that the present
12One question concerning model specification arises, that there may be a problem of causality in this case. Actually, most economic relationships are causal in nature, therefore, simple regression analysis, as is used in this paper, can not prove any theoretical causality. But there are some tests, for example the Granger (1969), to test Granger Causality. It should be noted that Granger’s concept of causality does not imply a cause-effect relationship, but rather is based only on “predictability”.
13It is expected that the effects of proxy of human capital used here, enrolment as a ratio to total employed labour force, will be lagged, since changes in human capital will be the lagged effect of enrolment-labour ratio. Thus, the choice of primary school enrolment lagged for 10 years, middle school enrolment lagged for 6 years, higher secondary school enrolment lagged for 5 years, and enrolment in other educational institutions lagged for 4 years seems to be reasonable. However, the criterion for choosing these lags is based on common sense. It is noted that various authors, like Barro (1991) and Easterly et al. (1993), used 10 years lagged for both primary and secondary enrolment rates.
Macroeconomic Determinants of Economic Growth 135
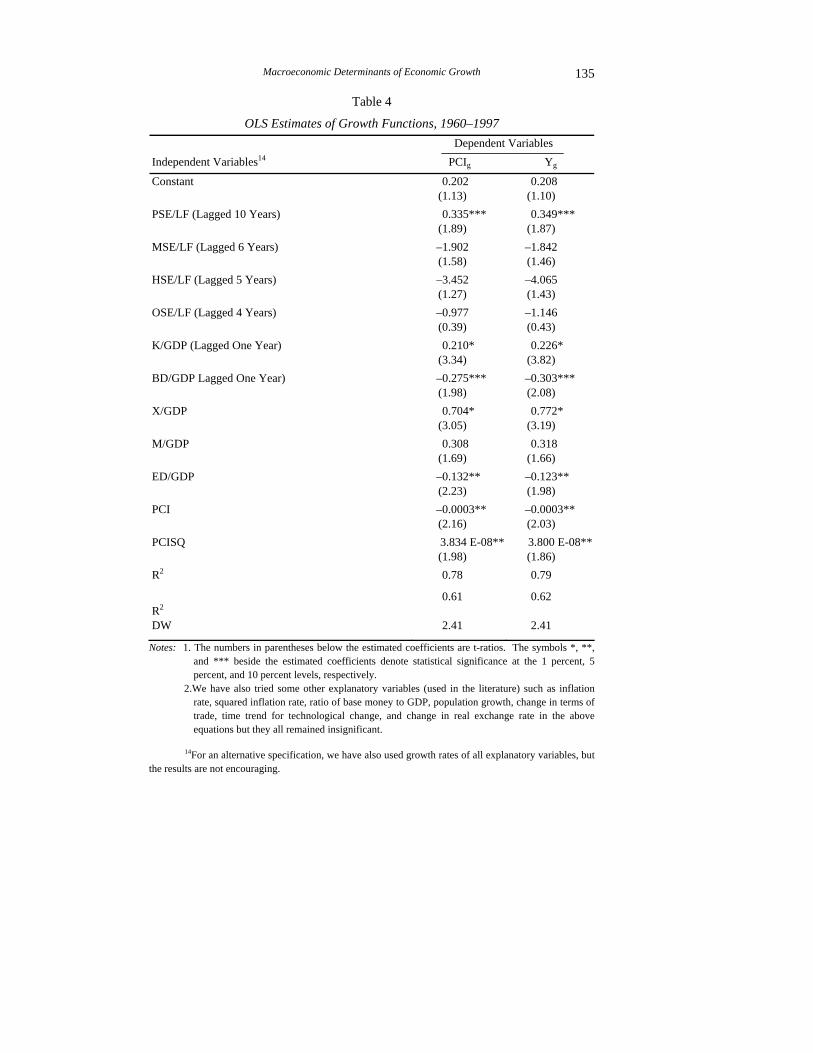
Table 4
OLS Estimates of Growth Functions, 1960–1997 Dependent Variables Independent Variables14 PCIg Yg
Constant 0.202 (1.13)
0.208 (1.10)
PSE/LF (Lagged 10 Years) 0.335*** (1.89)
0.349*** (1.87)
MSE/LF (Lagged 6 Years) –1.902 (1.58)
–1.842 (1.46)
HSE/LF (Lagged 5 Years) –3.452 (1.27)
–4.065 (1.43)
OSE/LF (Lagged 4 Years) –0.977 (0.39)
–1.146 (0.43)
K/GDP (Lagged One Year) 0.210* (3.34)
0.226* (3.82)
BD/GDP Lagged One Year) –0.275*** (1.98)
–0.303*** (2.08)
X/GDP 0.704* (3.05)
0.772* (3.19)
M/GDP 0.308 (1.69)
0.318 (1.66)
ED/GDP –0.132** (2.23)
–0.123** (1.98)
PCI –0.0003** (2.16)
–0.0003** (2.03)
PCISQ 3.834 E-08**(1.98)
3.800 E-08** (1.86)
R2 0.78 0.79
R2
0.61 0.62
DW 2.41 2.41
Notes: 1. The numbers in parentheses below the estimated coefficients are t-ratios. The symbols *, **, and *** beside the estimated coefficients denote statistical significance at the 1 percent, 5 percent, and 10 percent levels, respectively.
2.We have also tried some other explanatory variables (used in the literature) such as inflation rate, squared inflation rate, ratio of base money to GDP, population growth, change in terms of trade, time trend for technological change, and change in real exchange rate in the above equations but they all remained insignificant.
14For an alternative specification, we have also used growth rates of all explanatory variables, but the results are not encouraging.

Iqbal and Zahid 136
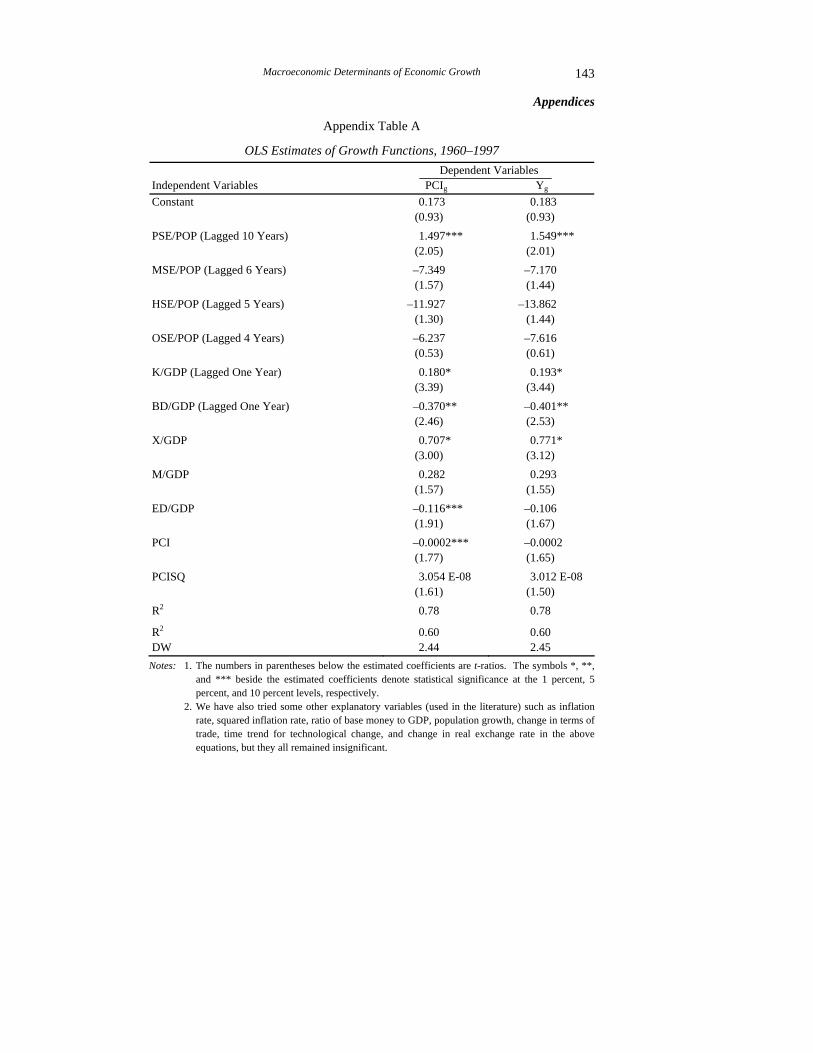
specification may not capture this effect fully. For the insignificance of human capital proxies, another reason seems to be the high correlation among primary, secondary, high, and other enrolment levels. We have also used enrolments in primary, middle, high, and other educational institutions as ratios to total population (POP) as alternative proxies for human capital, keeping all the other explanatory variables of Equations (1) and (2). The results are reported in Appendix Table A. It is worthwhile to note that no serious estimation problem arises and the signs and statistical significance levels remain unaltered and the conclusions do not change greatly.15
Physical Capital
Table 4 contains results for the ratio of real physical capital to real gross domestic product (K/GDP). The estimated positive coefficients of physical capital are 0.21 in Equation (1) and 0.23 in Equation (2), and both coefficients are statistically significant at one percent level. It indicates that one percent increase in physical capital-GDP ratio increases per capita real income growth by 0.21 and real GDP growth by 0.23 percentage points per annum. This finding tends to support the notion that the higher rate of physical capital accumulation leads to higher rate of economic growth. Budget Deficit
The rising budget deficit has been considered as one of the main constraints on economic growth in Pakistan. As mentioned earlier, annual budget deficit on average remained between 7.4 to 9.4 percent of GDP during the 1970s, 1980s, and 1990s. Most recently, policy-makers and donors also took fiscal deficit as one of the main reasons for current economic crisis (including the slowing down of growth) in Pakistan. As a priori expectation, the estimated coefficient of budget deficit as a ratio to gross domestic product (BD/GDP), reported in Table 4, shows a negative association with growth rates in per capita real income and real GDP. The estimated coefficients of (BD/GDP) are –0.28 in Equation (1) and –0.30 in Equation (2) and both coefficients are statistically significant, implying that one percentage increase in fiscal deficit-GDP ratio reduces the PCIg and Yg, respectively, by 0.28 and 0.30 percentage points per year (for absolute and relative contributions of budget deficit to economic growth (see Section 4.2). Various theoretical arguments can be given for the negative association between budget deficit and growth rates in the context of Pakistan. First, it can be argued that mounting fiscal deficit lowers real output growth through distorting effects from high taxation and government current expenditure
15We have also used the flow of investment in human capital (i.e., public investment on education and health) as an alternative proxy variable for human capital but the results are not encouraging.
Macroeconomic Determinants of Economic Growth 137
programmes on private sector productivity. The pioneering empirical work of Khan and Iqbal (1991) also showed that the increase in fiscal deficit reduces private savings in Pakistan. The second argument emphasises that higher budget deficit crowds out private sector investment activities as a result of its lower access to bank credits. It can also be argued that higher government spending creates expectations of future tax liabilities that in turn distorts incentives and lowers economic growth. Finally, budget deficit is also considered as a sign of macroeconomic instability, which ultimately affects output growth adversely. Foreign Trade
Foreign trade variables, namely exports of goods as a ratio to gross domestic product (X/GDP) and imports of goods as a ratio to gross domestic product (M/GDP), are taken separately and represent openness of Pakistan’s economy.16 The reason for taking separate exports and imports variables is that we want to see which variable affects more the growth rates of output in Pakistan. The results reported in Table 4 show that the estimated coefficients of X/GDP are 0.70 in Equation (1) and 0.77 in Equation (2) and both the coefficients are statistically significant at 99 percent level, implying that one percentage increase in export-GDP ratio raises the growth rates in per capita real income by 0.70 percentage points and real GDP by 0.77 percentage points per year. Besides the reasons given above, higher export earnings also relax the foreign exchange constraint on output growth. On the other hand, the estimated coefficients of M/GDP are 0.31 in Equation (1) and 0.32 in Equation (2), meaning that an increase in imports of goods (including machinery and intermediate inputs) by one percent accelerates the per capita real income growth by 0.31 percentage points and real gross domestic product growth by 0.32 percentage points per annum. It is obvious from these findings that output growth is affected positively by exports more than by imports.17 These findings follow the arguments by Romer (1990, 1986); Grossman and Helpman (1989, 1989a) and Lucas (1988) that increased openness to international trade promotes growth because of the increased availability of technologies accompanying knowledge spillovers. In addition, technological advancement, from access to goods and services, embodied technology, and discovery of new natural resources (which can be exported) may raise output growth because it basically shifts the production possibilities frontier out, exogenously. It is also worth noting that positive effects of exports on growth through the level of investment have been picked up in the capital stock variable. So
16We have also used the sum of imports and exports of goods as a ratio to GDP as a single proxy variable for the openness of Pakistan’s economy, but the results do not change much and the estimated coefficient remained positive and statistically significant.
17In general, the inclusion of export-GDP ratio and import-GDP ratio as explanatory variables in an equation may indicate a problem of multicollinearity because of interdependence of both the variables. But in this case, this problem does not seem to be so severe as the simple correlation between the two ratios is 0.77.
Iqbal and Zahid 138
this would suggest that, in these regressions, the export variable seems to be picking up effects which run through the level of total factor productivity. Foreign Debt
The estimated coefficient of external debt as a ratio to gross domestic product (ED/GDP) shows a negative impact on economic growth in both regressions (1) and (2). The estimated coefficients of ED/GDP are –0.13 in Equation (1) and –0.12 in Equation (2), implying that one percentage increase in external debt-GDP ratio reduces PCIg and Yg, respectively, by 0.13 and 0.12 percentage points per year.18 These results follow Borensztein (1990, 1990a) and Eaton (1987). An important reason seems to be that Pakistan is currently in a foreign debt trap because of the non-sustainable situation with regard to managing its debt obligations. The data show that increasing external debt (41.5 percent of GDP in 1990s) over time, debt service payments (22.2 percent of total revenue in 1990s), and associated tightening conditions by the donors are making it difficult for Pakistan to come out of the emerging debt trap. On the other hand, development expenditures have been continuously declining (7.5 percent of GDP in 1991-92 to 4.2 percent of GDP in 1996-97) over time. Consequently, a declining trend in economic growth in Pakistan is obvious. Income Variables
Following Barro (1991), Easterly (1993) and Easterly et al.(1993), we use per capita real income (PCI) as explanatory factors in regressions (1) and (2).19 The results reported in Table 4 show that the estimated coefficients of per capita real income in regression Equations (1) and (2) are negative and highly significant as expected a priori.20 The negative sign on PCI seems to be fairly plausible because it suggests that when per capita income is higher, it is harder to grow. As per capita real income is in Pakistani rupees, its estimated coefficient –0.0003 implies that an increase in per capita real income by Rs 1000 lowers the output growth by 0.3 percentage points per year. This finding follows Iqbal (1993), Easterly (1993), Easterly et al. (1993), Khan et al. (1992), and Barro (1991). Further, another income
18It is noted that the other direction of causation may be possible, i.e., the real income growth can be one of the determinants of demand and supply of external debt. For example, Boyce (1992) found that real income growth (as an explanatory variable) was negatively but insignificantly related to external debt in the case of the Philippines.
19We have also used time trend as an alternative variable in order to pick up the effects of total factor productivity on output growth, but the results turned out to be insignificant.
20Since population growth is an obvious possible determinant of per capita income growth, in principle, it should have been included directly as a factor. Here, it is not done because the annual data on the rate of population growth are not available as the Population Census in Pakistan is conducted with a gap of 10 to 17 years.
Macroeconomic Determinants of Economic Growth 139
variable is squared per capita real income (PCISQ) as had been taken by Barro (1991), which implies that instead of a linear form, the relation between growth rates in per capita real income and real GDP and the level of per capita real income is now quadratic. The estimated coefficient of the squared per capita real income is positive and statistically significant, implying that the force towards convergence (negative relation between growth and level) attentuates as per capita real income rises. These findings are consistent with Barro (1991). 4.2. Absolute and Relative Contribution of Policy Variables to Economic Growth
Since various explanatory variables in regressions (1) and (2) behaved rather differently during 1960–97, it may be useful to evaluate relative and absolute contributions of each explanatory variable to growth rates. Table 5 reports estimated relative and absolute contributions of key policy variables to growth rates of per capita real income and real GDP. Following Hicks (1979), the absolute contribution is calculated as the estimated coefficient multiplied by the standard deviation of the respective explanatory variable. The relative contribution of each explanatory variable is calculated dividing the estimates of absolute contribution to growth by the standard deviation of the dependent variable. This measure is introduced by Hadjimichael (1995). It is noted that, using this measure, the relative contributions of each explanatory variable have become unit-free.
The results reported in Table 5 (columns 3 and 6) show the absolute contributions of each explanatory variable to growth rates of per capita real income and real GDP, respectively. The results of column (3) show that of the five explanatory variables, which have significantly positive impact on per capita real income growth, human capital (defined as primary schools enrolment as a ratio to total employed labour force) has the largest positive absolute impact (2.50), followed by export earnings (2.29), physical capital stock (1.47), import of goods (1.28), and squared per capita income (0.17). On the other hand, the other three explanatory variables, which have a negative impact on per capita real income growth, the external debt variable has the largest absolute effect (–1.06), followed by budget deficit (–0.53) and per capita real income (–0.20). It is interesting to note that the signs and sequence of all the explanatory variables remain unchanged in the case of their absolute contributions to real GDP growth as reported in Table 5 (column 6). Similarly, of the five explanatory variables, human capital has the largest absolute effect (2.61), followed by export earnings account (2.51), physical capital (1.59), imports of goods (1.32), and squared per capita income (0.17), and, alternatively, external debt (–0.99), budget deficit (–0.58), and per capita real income (–0.20).
Turning to relative contributions, it is noteworthy that the sequence of the impact of explanatory variables in absolute and relative terms remains unchanged in
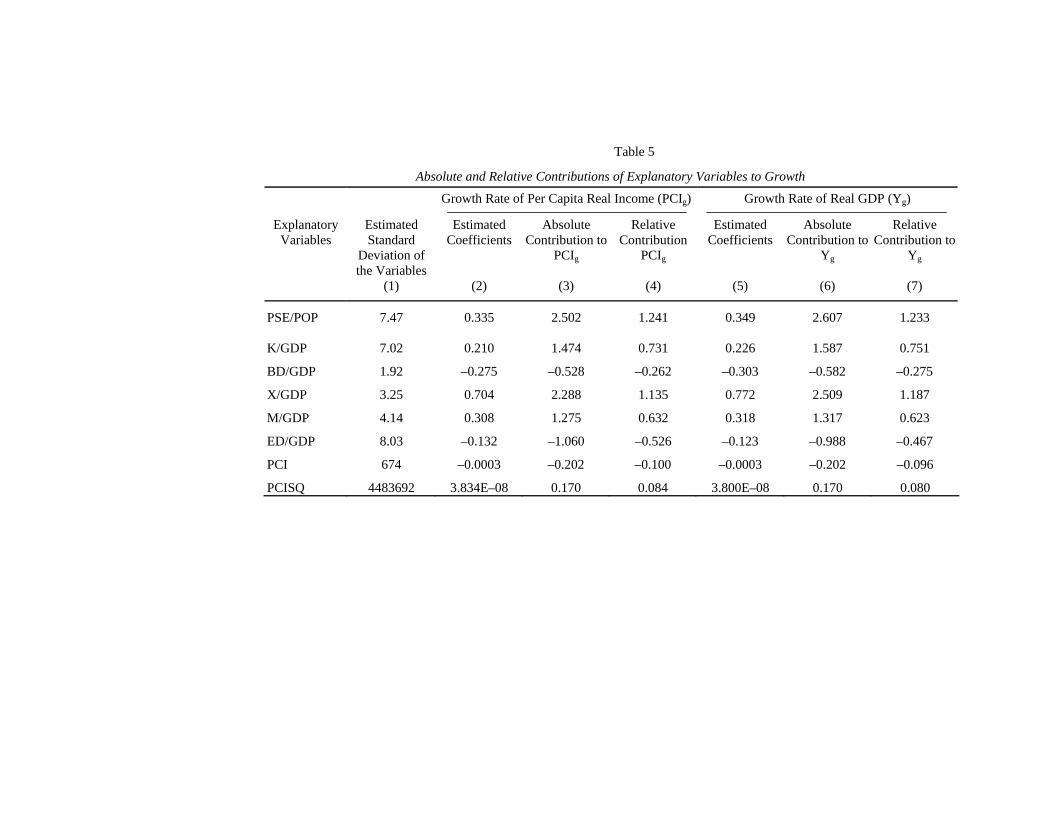
Table 5
Absolute and Relative Contributions of Explanatory Variables to Growth
Growth Rate of Per Capita Real Income (PCIg) Growth Rate of Real GDP (Yg)
Explanatory Variables
Estimated Standard
Deviation of the Variables
(1)
Estimated Coefficients
(2)
Absolute Contribution to
PCIg
(3)
Relative Contribution
PCIg
(4)
Estimated Coefficients
(5)
Absolute Contribution to
Yg
(6)
Relative Contribution to
Yg
(7)
PSE/POP 7.47 0.335 2.502 1.241 0.349 2.607 1.233
K/GDP 7.02 0.210 1.474 0.731 0.226 1.587 0.751
BD/GDP 1.92 –0.275 –0.528 –0.262 –0.303 –0.582 –0.275
X/GDP 3.25 0.704 2.288 1.135 0.772 2.509 1.187
M/GDP 4.14 0.308 1.275 0.632 0.318 1.317 0.623
ED/GDP 8.03 –0.132 –1.060 –0.526 –0.123 –0.988 –0.467
PCI 674 –0.0003 –0.202 –0.100 –0.0003 –0.202 –0.096
PCISQ 4483692 3.834E–08 0.170 0.084 3.800E–08 0.170 0.080
Macroeconomic Determinants of Economic Growth 141
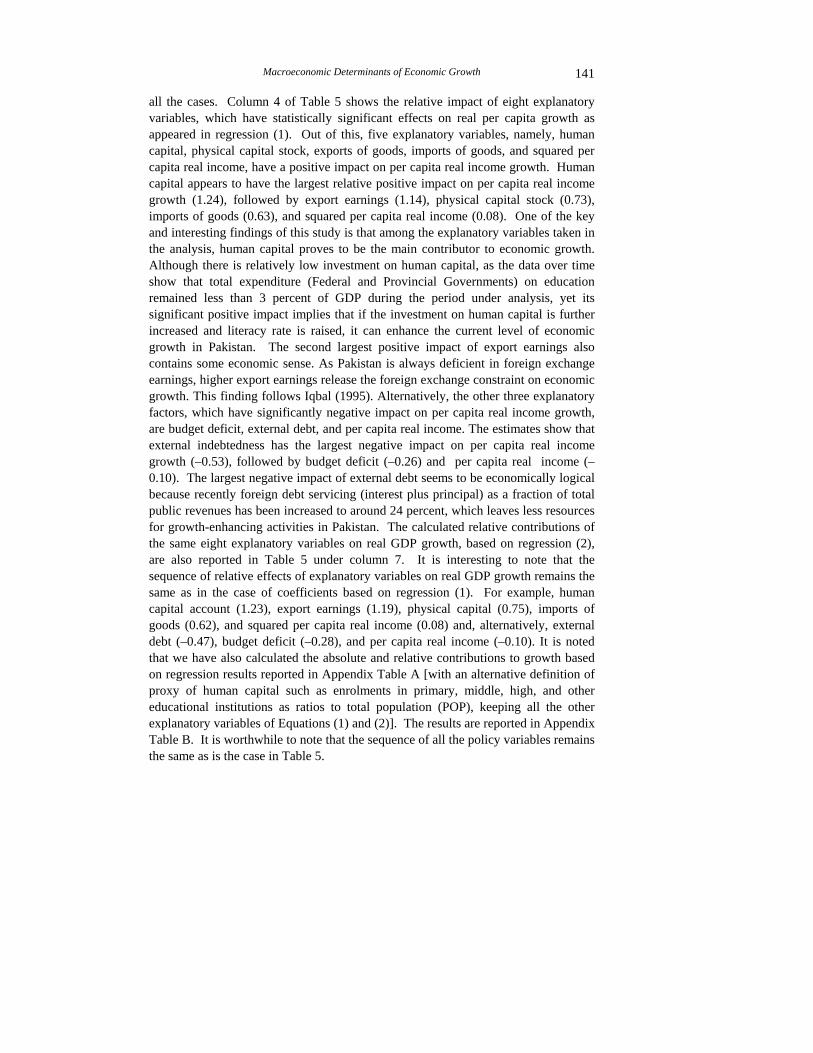
all the cases. Column 4 of Table 5 shows the relative impact of eight explanatory variables, which have statistically significant effects on real per capita growth as appeared in regression (1). Out of this, five explanatory variables, namely, human capital, physical capital stock, exports of goods, imports of goods, and squared per capita real income, have a positive impact on per capita real income growth. Human capital appears to have the largest relative positive impact on per capita real income growth (1.24), followed by export earnings (1.14), physical capital stock (0.73), imports of goods (0.63), and squared per capita real income (0.08). One of the key and interesting findings of this study is that among the explanatory variables taken in the analysis, human capital proves to be the main contributor to economic growth. Although there is relatively low investment on human capital, as the data over time show that total expenditure (Federal and Provincial Governments) on education remained less than 3 percent of GDP during the period under analysis, yet its significant positive impact implies that if the investment on human capital is further increased and literacy rate is raised, it can enhance the current level of economic growth in Pakistan. The second largest positive impact of export earnings also contains some economic sense. As Pakistan is always deficient in foreign exchange earnings, higher export earnings release the foreign exchange constraint on economic growth. This finding follows Iqbal (1995). Alternatively, the other three explanatory factors, which have significantly negative impact on per capita real income growth, are budget deficit, external debt, and per capita real income. The estimates show that external indebtedness has the largest negative impact on per capita real income growth (–0.53), followed by budget deficit (–0.26) and per capita real income (–0.10). The largest negative impact of external debt seems to be economically logical because recently foreign debt servicing (interest plus principal) as a fraction of total public revenues has been increased to around 24 percent, which leaves less resources for growth-enhancing activities in Pakistan. The calculated relative contributions of the same eight explanatory variables on real GDP growth, based on regression (2), are also reported in Table 5 under column 7. It is interesting to note that the sequence of relative effects of explanatory variables on real GDP growth remains the same as in the case of coefficients based on regression (1). For example, human capital account (1.23), export earnings (1.19), physical capital (0.75), imports of goods (0.62), and squared per capita real income (0.08) and, alternatively, external debt (–0.47), budget deficit (–0.28), and per capita real income (–0.10). It is noted that we have also calculated the absolute and relative contributions to growth based on regression results reported in Appendix Table A [with an alternative definition of proxy of human capital such as enrolments in primary, middle, high, and other educational institutions as ratios to total population (POP), keeping all the other explanatory variables of Equations (1) and (2)]. The results are reported in Appendix Table B. It is worthwhile to note that the sequence of all the policy variables remains the same as is the case in Table 5.
Iqbal and Zahid 142
5. CONCLUSIONS AND POLICY IMPLICATIONS
In recent years, Pakistan’s economic growth has remained unsustainable to an alarming extent, which has caused serious concern to policy-makers, professionals, and foreign donor agencies. As unsustainable economic growth has been caused by numerous factors, the main purpose of this paper has been to examine the effects of some of the key macroeconomic variables on Pakistan’s economic growth. Multiple regression framework is used to separate out the effects of key macroeconomic factors on growth over the period 1959-60 to 1996-97. The empirical results drawn from the analysis are representative of ongoing research on the determinants of output growth. However, the results presented in this study reinforce the importance of sensible long-run growth-oriented policies to obtain sustainable growth. As it is always difficult to draw precise conclusions from regression analysis, nevertheless, the findings drawn from this study should be treated as suggestive; obviously, much more remains to be done in this area.
The results reported in this paper have led us to the following major conclusions. The quantitative evidence shows that real GDP growth and per capita real income growth are positively related to the primary school enrolment-labour force ratio (proxy of human capital). It implies that primary education is an important prerequisite for accelerating growth. Therefore, primary education must be considered as the foundation-stone upon which the economic development in Pakistan can be erected. The Government must provide primary education to all school-age children to improve the literacy rate within a minimum time-span. It is noted that the average annual share of primary school enrolment in total enrolment has been about 70 percent during the period under consideration. Similarly, increasing the stock of physical capital would also help to contribute to growth. Thus, the Government must ensure the provision of adequate physical capital (including appropriate infrastructure), with effective private sector participation, in order to sustain economic growth. The empirical results also suggest that openness of Pakistan’s economy (defined as exports and imports of goods) would promote economic growth.
The budget deficit is negatively related to both output growth variables. There is a general consensus among economists that budget deficit is the mother of all economic ills. Therefore, lowering the budget deficit through reducing non-development expenditure would help to enhance economic growth. Similarly, the external debt is also negatively related to growth, suggesting that relying on domestic resources is the best alternative to finance growth. The fact that per capita real income has a negative impact on growth suggests that when per capita income is higher, it is harder to grow.
Macroeconomic Determinants of Economic Growth 143
Appendices
Appendix Table A
OLS Estimates of Growth Functions, 1960–1997 Dependent Variables Independent Variables PCIg Yg Constant 0.173
(0.93) 0.183
(0.93) PSE/POP (Lagged 10 Years) 1.497***
(2.05) 1.549***
(2.01) MSE/POP (Lagged 6 Years) –7.349
(1.57) –7.170 (1.44)
HSE/POP (Lagged 5 Years) –11.927 (1.30)
–13.862 (1.44)
OSE/POP (Lagged 4 Years) –6.237 (0.53)
–7.616 (0.61)
K/GDP (Lagged One Year) 0.180* (3.39)
0.193* (3.44)
BD/GDP (Lagged One Year) –0.370** (2.46)
–0.401** (2.53)
X/GDP 0.707* (3.00)
0.771* (3.12)
M/GDP 0.282 (1.57)
0.293 (1.55)
ED/GDP –0.116*** (1.91)
–0.106 (1.67)
PCI –0.0002*** (1.77)
–0.0002 (1.65)
PCISQ 3.054 E-08 (1.61)
3.012 E-08
(1.50) R2 0.78 0.78
R2 0.60 0.60 DW 2.44 2.45
Notes: 1. The numbers in parentheses below the estimated coefficients are t-ratios. The symbols *, **, and *** beside the estimated coefficients denote statistical significance at the 1 percent, 5 percent, and 10 percent levels, respectively.
2. We have also tried some other explanatory variables (used in the literature) such as inflation rate, squared inflation rate, ratio of base money to GDP, population growth, change in terms of trade, time trend for technological change, and change in real exchange rate in the above equations, but they all remained insignificant.
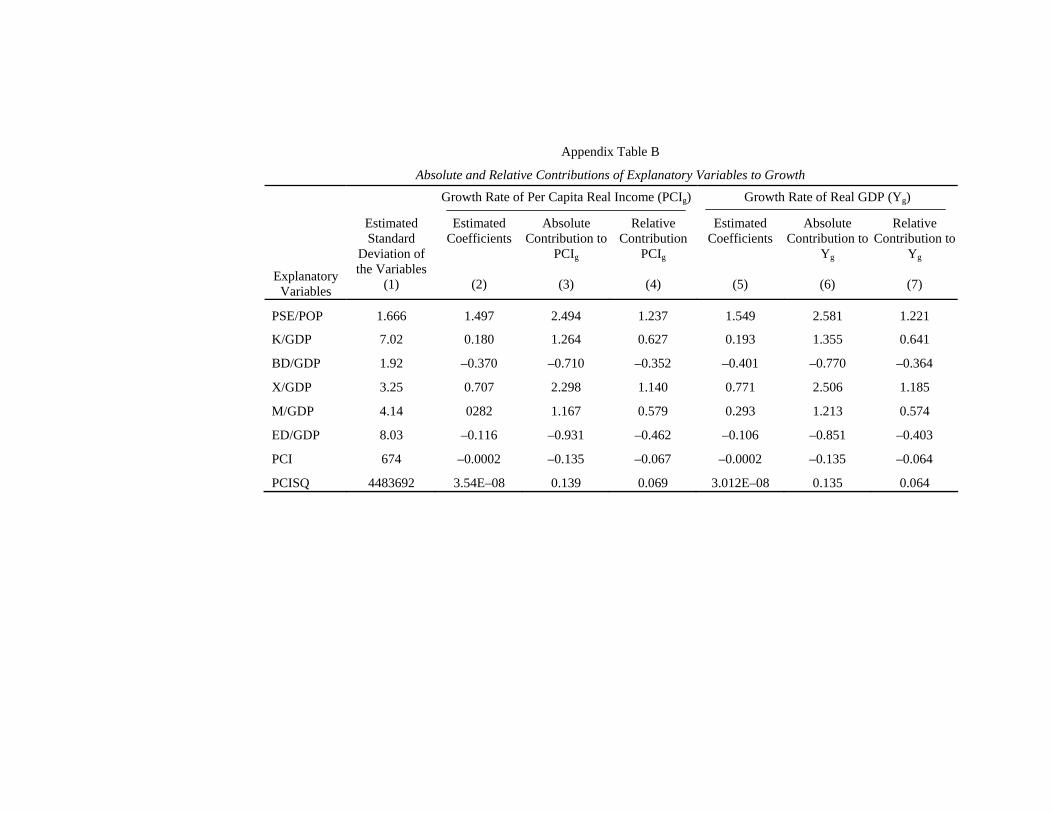
Appendix Table B
Absolute and Relative Contributions of Explanatory Variables to Growth
Growth Rate of Per Capita Real Income (PCIg) Growth Rate of Real GDP (Yg)
Explanatory Variables
Estimated Standard
Deviation of the Variables
(1)
Estimated Coefficients
(2)
Absolute Contribution to
PCIg
(3)
Relative Contribution
PCIg
(4)
Estimated Coefficients
(5)
Absolute Contribution to
Yg
(6)
Relative Contribution to
Yg
(7)
PSE/POP 1.666 1.497 2.494 1.237 1.549 2.581 1.221
K/GDP 7.02 0.180 1.264 0.627 0.193 1.355 0.641
BD/GDP 1.92 –0.370 –0.710 –0.352 –0.401 –0.770 –0.364
X/GDP 3.25 0.707 2.298 1.140 0.771 2.506 1.185
M/GDP 4.14 0282 1.167 0.579 0.293 1.213 0.574
ED/GDP 8.03 –0.116 –0.931 –0.462 –0.106 –0.851 –0.403
PCI 674 –0.0002 –0.135 –0.067 –0.0002 –0.135 –0.064
PCISQ 4483692 3.54E–08 0.139 0.069 3.012E–08 0.135 0.064

Macroeconomic Determinants of Economic Growth 145
REFERENCES
Adelman, I. F., and H. B. Chenery (1966) Foreign Aid and Economic Development: The Case of Greece. The Review of Economics and Statistics 48: 1–19.
Bacha, E. L. (1990) A Three-Gap Model of Foreign Transfers and the GDP Growth Rate in Developing Countries. Journal of Development Economics 32: 279–296.
Barro, R. J., and X. Sala-i-Martin (1995) Economic Growth. McGraw Hill. Barro, R. J., and J. W. Lee (1994) Losers and Winners in Economic Growth.
Proceedings of the World Bank Annual Conference on Development Economics, 267–297.
Barro, R. J. (1991) Economic Growth in a Cross-section of Countries. Quarterly Journal of Economics 106:2 407–443.
Barro, R. J. (1990) Government Spending in a Simple Model of Endogenous Growth. Journal of Political Economy 98:5 103–125.
Barro, R. J (1989) A Cross-country Study of Growth, Saving, and Government. National Bureau of Economic Research, Cambridge, Massachusetts. (NBER Working Paper No. 2855.)
Barth, J. R., and M. D. Bradley (1987) The Impact of Government Spending on Economic Activity. George Washington University, Washington. (Manuscript.)
Becker, G., K. Murphy, and R. Tamura (1990) Human Capital, Fertility, and Economic Growth. Journal of Political Economy 98:5 12–37.
Benhabib, J. M., and M. Spiegel (1994) The Role of Human Capital in Economic Development: Evidence from Cross-country Data. Journal of Monetary Economics 34: 141–173.
Birdsall, N., D. Ross, and R. Sabot (1993) Underinvestment in Education: How Much Growth has Pakistan Foregone? The Pakistan Development Review 32:4 453–499.
Borensztein, E. (1990) Debt Overhang, Credit Rationing and Investment. Journal of Development Economics 32: 315–335.
Borensztein, E. (1990a) Debt Overhang, Debt Reduction and Investment: The Case of the Philippines. International Monetary Fund. Washington. (IMF Working Paper 90/77.)
Boyce, J. K. (1992) The Revolving Door? External Debt and Capital Flight: A Philippines Case Study. World Development 20:2 335–349.
Bruton, H. J. (1969) The Two Gap Approach to Aid and Development: Comment. The American Economic Review 59: 439–446.
Chenery, H. B., and A. McEwan (1966) Optimal Patterns of Growth and Aid: The Case of Pakistan. The Pakistan Development Review 6:2 209–242.
Chenery, H. B., and A. M. Strout (1966) Foreign Assistance and Economic Development. The American Economic Review 56: 680–733.
Iqbal and Zahid 146
Chenery, H. B., and M. Bruno (1962) Development Alternatives in an Open Economy: The Case of Israel. The Economic Journal 72: 79-103.
Easterly, W. (1993) How Much Do Distortions Affect Growth? Journal of Monetary Economics 32: 187–212.
Easterly, W., M. Kremer, L. Pritchett, and L. H. Summers (1993) Good Policy or Good Luck? Country Growth Performance and Temporary Shocks. Journal of Monetary Economics 32: 459–483.
Easterly, W., and S. Rebelo (1993) Fiscal Policy and Economic Growth: An Empirical Investigation. Journal of Monetary Economics 32: 417–458.
Easterly, W., R. King, R. Levine, and S. Rebelo (1991) How Do National Policies Affect Long-Run Growth?: A Research Agenda. Washington. (World Bank Working Paper WPS 794.)
Eaton, J. (1987) Public Debt Guarantees and Private Capital Flight. World Bank Economic Review 1:3 377–395.
Elias, V. J. (1978) Sources of Economic Growth in Latin American Countries. The Review of Economics and Statistics 60:3 362–370.
Findlay, R. (1973) International Trade and Development Theory. New York and London: Columbia University Press.
Granger, C. W. J. (1969) Investigation Causal Relations by Econometric Models and Cross-Spectral Methods. Econometrica 24–36.
Grier, K., and G. Tullock (1989) An Empirical Analysis of Cross-National Economic Growth: 1951–1980. Journal of Monetary Economics 24:2 259–276.
Griffin, K. B., and J. L. Enos (1970) Foreign Assistance: Objectives and Consequences. Economic Development and Cultural Change 18: 313–327.
Grossman, G. M., and E. Helpman (1989) Endogenous Product Cycles. Cambridge, Massachusetts. (NBER Working Paper 2913.)
Grossman, G. M., and E. Helpman (1989a) Growth and Welfare in a Small Open Economy. Cambridge, Massachusetts. (NBER Working Paper 2970.)
Hadjimichael, M. T., D. Ghura, M. Muhleisen, R. Nord, and E. M. Ucer (1995) Sub-Saharan Africa Growth, Savings, and Investment, 1986–93. Washington, D.C.: International Monetary Fund.
Hicks, N. L. (1979) Growth vs Basic Needs: Is there a Trade-Off? World Development 7: 985–994.
Iqbal, Z., J. James, and G. Pyatt (1998) Three-Gap Analysis of Structural Adjustment in Pakistan. Journal of Policy Modelling. (Forthcoming.)
Iqbal, Z. (1996) Three-Gap Analysis of Structural Adjustment in Pakistan. Ph.D. Dissertation (unpublished).
Iqbal, Z. (1995) Constraints to the Economic Growth of Pakistan: A Three-Gap Approach. The Pakistan Development Review 34:4 1119–1133.

Macroeconomic Determinants of Economic Growth 147
Iqbal, Z. (1994) Macroeconomic Effects of Adjustment Lending in Pakistan. The Pakistan Development Review 33:4 1011–1031.
Iqbal, Z. (1993) Institutional Variations in Savings Behaviour in Pakistan. The Pakistan Development Review 32:4 1293–1311.
Kemal, A. R. (1993) Sources of Growth in Pakistan. Report on Economic and Social Well-being for the Eighth Five Year Plan.
Khan, A. H., L. Hasan, and A. Malik (1994) Determinants of National Savings Rate in Pakistan. Economia Internazionale 47:4 365–382.
Khan, A. H., L. Hasan, and A. Malik (1992) Dependency Ratio, Foreign Capital Inflows, and the Rate of Savings in Pakistan. The Pakistan Development Review 31:4 843–856.
Khan, A. H., and Z. Iqbal (1991) Fiscal Deficit and Private Sector Activities in Pakistan. Economia Internazionale 44: 3–11.
Khan, M. S., and C. Reinhart (1990) Private Investment and Economic Growth in Developing Countries. World Development 18: 19–27.
Khilji, N. M., and A. Mahmood (1997) Military Expenditures and Economic Growth in Pakistan. The Pakistan Development Review 36:4 791–808.
Kormendi, R. C., and P. G. Meguire (1985) Macroeconomic Determinants of Growth: Cross-country Evidence. Journal of Monetary Economics 16:2 141–163.
Landau, D. L. (1986) Government Spending and Economic Growth in the Less Developed Countries: An Empirical Study for 1960–80. Economic Development and Cultural Change 35:1 35–75.
Landau, D. L. (1983) Government Expenditure and Economic Growth: A Cross Country Study. Southern Economic Journal 49:3 783–792.
Landau, L. (1971) Saving Functions for Latin America. In H. B. Chenery (ed) Studies in Development Planning. Cambridge, Massachusetts: Harvard University Press. 299–321.
Lucas, R. (1988) On the Mechanics of Economic Development: W.A. Mackintosh Lecture. Journal of Monetary Economics 22:1 3–42.
Mankiw, G. N., D. Romer, and D. N. Weil (1992) A Contribution to the Empirics of Economic Growth. Quarterly Journal of Economics 107: 407–437.
McCarthy, F. D., J. Hanson, and Soonwan K. (1985) Sources of Growth in Colombia: 1963–1980. Journal of Economic Studies 12: 3–14.
McKinon, R. I. (1964) Foreign Exchange Constraints in Economic Development and Efficient Aid Allocation. The Economic Journal 74: 388-409.
Mosley, P. (1980) Aid, Savings and Growth Revisited. Oxford Bulletin of Economics and Statistics 42: 79–95.

Iqbal and Zahid 148
Murphy, K., A. Shleifer, and R. Vishny (1991) The Allocation of Talent: Implications for Growth. Quarterly Journal of Economics 106:2 503–530.
Nelson, R. R., and E. S. Phelps (1966) Investment in Humans, Technological Diffusion and Economic Growth. American Economic Review 56:2 69–75.
Pritchett, L. (1996) Where Has All the Education Gone? The World Bank, Policy Research Department, Washington, D.C. (Policy Research Working Paper No. 1581.)
Psacharopoulos, G. (1973) Returns to Education. San Francisco: Jossey-Bass. Ram, R. (1987) Exports and Economic Growth in Developing Countries: Evidence
from Time-Series and Cross Section Data. Economic Development and Cultural Change 36:1 51–72.
Romer, P. M. (1990) Human Capital and Growth. Paper Presented at the Carnegie-Rochester Conference on Economic Policy, Rochester, New York.
Romer, P. M. (1986) Increasing Returns and Long-Run Growth. Journal of Political Economy 94:5 1002–1037.
Shabbir, T., and A. Mahmood (1992) The Effects of Foreign Private Investment on Economic Growth in Pakistan. The Pakistan Development Review 31:4 831–841.
Solimano, A. (1990) Macroeconomic Constraints for Medium-term Growth and Distribution: A Model for Chile. Working Papers, Country Economics Department, The World Bank, WPS 400.
Spiegel, M. (1994) Determinants of Long-run Productivity Growth: A Selective Survey with Some New Empirical Results. (Mimeo.)
Sundararajan, V., and S. Thakur (1980) Public Investment, Crowding Out and Growth: A Dynamic Model Applied to India and Korea. IMF Staff Papers 27:4 814–855.
Taylor, L. (1994) Gap Models. Journal of Development Economics 45: 17–34. Taylor, L. (1993) The Rocky Road to Reform. Cambridge: MIT Press. Taylor, L. (1990) A Three-Gap Model. In F. D. McCarthy (ed) Problems of Developing
Countries in the 1990s. 55–90. Taylor, L. (1990a) Foreign Resource Flows and Developing Country Growth. Helsinki:
WIDER. Voivodas, C. S. (1973) Exports, Foreign Capital Inflow and Economic Growth. Journal
of International Economics 3: 337–349. Weiskopf, T. E. (1972) An Econometric Test of Alternative Constraints on the Growth
of Underdeveloped Countries. The Review of Economics and Statistics 54: 67–78. Weiskopf, T. E. (1972a) The Impact of Foreign Capital Inflow on Domestic Savings in
Underdeveloped Countries. Journal of International Economics 2: 25–38. World Bank (1987) World Development Report. New York: Oxford University
Press.