macroalgae contribute to nested mosaics of ph variability
TRANSCRIPT

BGD12, 4907–4945, 2015
Macroalgaecontribute to nested
mosaics of pHvariability
D. Krause-Jensen et al.
Title Page
Abstract Introduction
Conclusions References
Tables Figures
J I
J I
Back Close
Full Screen / Esc
Printer-friendly Version
Interactive Discussion
Discussion
Paper
|D
iscussionP
aper|
Discussion
Paper
|D
iscussionP
aper|
Biogeosciences Discuss., 12, 4907–4945, 2015www.biogeosciences-discuss.net/12/4907/2015/doi:10.5194/bgd-12-4907-2015© Author(s) 2015. CC Attribution 3.0 License.
This discussion paper is/has been under review for the journal Biogeosciences (BG).Please refer to the corresponding final paper in BG if available.
Macroalgae contribute to nested mosaicsof pH variability in a sub-Arctic fjord
D. Krause-Jensen1,2, C. M. Duarte3,4, I. E. Hendriks5, L. Meire6,7, M. E. Blicher6,N. Marbà5, and M. K. Sejr1,2
1Arctic Research Centre, Bioscience, Arhus University, C. F. Møllers Allé 8, 8000 Århus C,Denmark2Department of Bioscience, Arhus University, Vejlsøvej 25, 8600 Silkeborg, Denmark3Red Sea Research Center, King Abdullah University of Science and Technology, Thuwal23955-6900, Kingdom of Saudi Arabia4Faculty of Biosciences, Fisheries and Economics, University of Tromsø, Tromsø, Norway5Department of Global Change Research, IMEDEA (CSIC-UIB) Instituto Mediterráneo deEstudios Avanzados, Miquel Marqués 21, 07190 Esporles, Spain6Greenland Climate Research Centre, Greenland Institute of Natural Resources, Kivioq 2, Box570, 3900 Nuuk, Greenland7Marine Biology Laboratory, University of Ghent (UGent), Krijgslaan 281 (S8), 9000 Gent,Belgium
4907

BGD12, 4907–4945, 2015
Macroalgaecontribute to nested
mosaics of pHvariability
D. Krause-Jensen et al.
Title Page
Abstract Introduction
Conclusions References
Tables Figures
J I
J I
Back Close
Full Screen / Esc
Printer-friendly Version
Interactive Discussion
Discussion
Paper
|D
iscussionP
aper|
Discussion
Paper
|D
iscussionP
aper|
Received: 10 February 2015 – Accepted: 3 March 2015 – Published: 27 March 2015
Correspondence to: D. Krause-Jensen ([email protected])
Published by Copernicus Publications on behalf of the European Geosciences Union.
4908

BGD12, 4907–4945, 2015
Macroalgaecontribute to nested
mosaics of pHvariability
D. Krause-Jensen et al.
Title Page
Abstract Introduction
Conclusions References
Tables Figures
J I
J I
Back Close
Full Screen / Esc
Printer-friendly Version
Interactive Discussion
Discussion
Paper
|D
iscussionP
aper|
Discussion
Paper
|D
iscussionP
aper|
Abstract
The Arctic Ocean is considered the most vulnerable ecosystem to ocean acidification(OA) and large-scale assessments of pH and the saturation state for aragonite (Ωarag)indicate that it is already close to corrosive states (Ωarag < 1). In high-latitude coastalwaters the regulation of pH and Ωarag is far more complex than offshore because in-5
creased biological activity and input of glacial meltwater affect pH. As most calcifiers oc-cupy coastal habitats, the assessment of risks from OA to these vulnerable organismscannot be derived from extrapolation of current and forecasted offshore conditions, butrequires an understanding of the regimes of pH and Ωarag in their coastal habitats. Toincrease knowledge of the natural variability of pH in the Arctic coastal zone and specif-10
ically to test the influence of benthic vegetated habitats, we quantified pH-variability ina Greenland fjord in a nested scale approach. A sensor array logging pH, O2, PAR,temperature and salinity was applied on spatial scales ranging from km-scale acrossthe horizontal extension of the fjord, over 100 m scale vertically in the fjord, 10–100 mscale between subtidal habitats with and without kelp forests and between vegetated15
tidal pools and adjacent vegetated shores, to cm-m scale within kelp forests and mm-scale across boundary layers of macrophyte tissue. In addition, we assessed the tem-poral variability in pH on diurnal and seasonal scales. Based on pH-measurementscombined with relationships between salinity, total alkalinity and dissolved inorganiccarbon we also estimated variability of Ωarag. Results show variability in pH and Ωarag20
of up to 0.2–0.3 units at several scales, i.e. along the horizontal and vertical extensionof the fjord, between seasons and on a diel basis in benthic habitats and within 1 m3
of kelp forest. Vegetated intertidal pools exhibited extreme diel pH variability of > 1.5units and macrophyte boundary layers a pH-range of up to 0.8 units. Overall, Ωarag wasfavorable to calcification, and pelagic and benthic metabolism was an important driver25
of pH and Ωarag producing mosaics of variability from low levels in the dark to peaklevels at high irradiance. We suggest that productive coastal environments may formniches of high pH in a future acidified Arctic Ocean.
4909

BGD12, 4907–4945, 2015
Macroalgaecontribute to nested
mosaics of pHvariability
D. Krause-Jensen et al.
Title Page
Abstract Introduction
Conclusions References
Tables Figures
J I
J I
Back Close
Full Screen / Esc
Printer-friendly Version
Interactive Discussion
Discussion
Paper
|D
iscussionP
aper|
Discussion
Paper
|D
iscussionP
aper|
1 Introduction
The Arctic Ocean is considered to be the most vulnerable ecosystem to ocean acidi-fication due to the combined effects of low temperature, which increases the solubilityof CO2 and, at places, dilution of the buffering capacity of seawater by freshwater in-puts (Fabry et al., 2009; AMAP, 2013). Indeed, large-scale assessments of pH and the5
saturation state for aragonite (Ωarag) indicate that Arctic Ocean seawaters are alreadyin close proximity to corrosive states (Ωarag < 1, Fabry et al., 2009). However, whereasthis has been documented for offshore waters, the Arctic contains a massive coast-line, comprising about 35 % of the world’s coastline (Krause-Jensen and Duarte, 2014)where the regulation of pH and Ωarag is far more complex than that offshore (Hofmann10
et al., 2011; Duarte et al., 2013). In coastal waters, the role of air–sea CO2 exchange inregulating pH operates along with watershed effects driven by the discharge of fresh-water and the effects of metabolically intense communities on pH (Duarte et al., 2013).The Greenland Ice Sheet is melting at a rate that has more than doubled in the recentdecade (Helm et al., 2014) and Greenland fjords are, hence, potentially among the15
most susceptible to the effects of freshening and acidification.As most calcifiers occupy coastal habitats, the assessment of risks of Arctic acidifica-
tion to these vulnerable species cannot be derived from extrapolation of the current andforecasted offshore conditions alone, but requires an understanding of the regimes ofpH and Ωarag in the coastal habitats they occupy. Such information is currently largely20
lacking for the Arctic in general and for Greenland in particular, which calls for effortsto understand variability of pH in the coastal zone informing on the factors controllingpH and ultimately determining the vulnerability of the coastal Arctic Ocean ecosystemto ocean acidification.
Greenland has a vast and highly indented coastline, extending along about25
44 000 km and representing ca. 12 % of the world’s coastline (Krause-Jensen andDuarte, 2014). This coastline forms a complex network of fjords and open coasts thatcontains multiple features contributing to heterogeneity, such as continental ice and
4910

BGD12, 4907–4945, 2015
Macroalgaecontribute to nested
mosaics of pHvariability
D. Krause-Jensen et al.
Title Page
Abstract Introduction
Conclusions References
Tables Figures
J I
J I
Back Close
Full Screen / Esc
Printer-friendly Version
Interactive Discussion
Discussion
Paper
|D
iscussionP
aper|
Discussion
Paper
|D
iscussionP
aper|
freshwater discharge at the headwaters, variable slopes and substrates, differentialwater residence time conducive to widely distinct temperature regimes within neigh-boring areas (Olesen et al., 2015), and tides that generate intertidal habitats and forceflow patterns. In addition, Greenland fjords often support highly productive kelp forests(Krause-Jensen et al., 2012) and intertidal seaweed communities (Høgslund et al.,5
2014), which have been suggested to have the capacity to affect pH and Ωarag locally(Krause-Jensen and Duarte, 2014) as demonstrated for subtropical and tropical veg-etated habitats (e.g. Hofmann et al., 2011; Hendriks et al., 2014). Calcifiers such asbivalves, brittle stars and sea urchins are ecologically important as they contribute sig-nificantly to carbon cycling in both sub-Arctic and high-Arctic areas of Greenland where10
their distribution range from the intertidal zone to > 300 m depth (Sejr et al., 2002;Blicher et al., 2007, 2009, 2013; Blicher and Sejr, 2011). Calcifiers, especially bivalvesare also important prey items for marine mammals (Born et al., 2003) and sea birds(Blicher et al., 2011).
Although the variability in pH and Ωarag in Greenland fjords has not been reported,15
available oceanography and environmental surveys suggest that this may be substan-tial. For instance, in Young Sound, Sejr et al. (2011) found that the extent of sea-icecover and inputs of glacial melt water affect seawater pCO2 levels and sea–air ex-change at spatial, seasonal and inter-annual scales. Seasonal dynamics of autotrophicand heterotrophic plankton metabolism have also been found to markedly affect pCO220
levels in Kobbefjord, a sub-Arctic fjord in SW Greenland (Sejr et al., 2014). However,information on scales of variability in pH and Ωarag in Greenland fjords is still lacking,precluding the assessment of their current and future vulnerability to ocean acidifica-tion.
Here we quantify pH variability in Kobbefjord, SW Greenland. This sub-Arctic fjord25
supports dense and productive subtidal kelp forests, intertidal macroalgal habitats andhigh abundance of bivalves and sea urchins with important roles in the ecosystem(Blicher et al., 2009; Krause-Jensen et al., 2012). We hypothesize that Kobbefjord con-tains a mosaic of pH environments nested across a range of scales of variability and
4911

BGD12, 4907–4945, 2015
Macroalgaecontribute to nested
mosaics of pHvariability
D. Krause-Jensen et al.
Title Page
Abstract Introduction
Conclusions References
Tables Figures
J I
J I
Back Close
Full Screen / Esc
Printer-friendly Version
Interactive Discussion
Discussion
Paper
|D
iscussionP
aper|
Discussion
Paper
|D
iscussionP
aper|
that primary production in general, and by macroalgae in particular, may be an impor-tant driver of pH variability relevant for benthic calcifiers. We first assess seasonal andspatial variability in the pelagic pH at km scale along the horizontal extension and at100 m scale vertically in the fjord. We then examine diel variability in pH within subtidalbenthic habitats colonized by kelp forest or microalgae/scattered filamentous algae as5
well as in vegetated tidal pools and adjacent vegetated intertidal shores, with the dis-tance between parallel deployments at the 10–100 m scale. We further explore the pHvariability 3-dimensionally at cm- to m-scale within the kelp forest ecosystem and atmm-scale across the thallus boundary layer of key macrophyte species. Whereas ourassessment focuses on pH, we also discuss the associated variability of Ωarag.10
2 Methods
2.1 Study area
Kobbefjord is located in the extensive Godthåbsfjord system in south west Greenland(Fig. 1a). The fjord is 17 km long and 0.8–2 km wide and has a maximum depth of150 m. It is subjected to marked exchange of coastal water driven by a tidal range15
of 1–4.5 m (Richter et al., 2011) and receives freshwater mainly from a river in theinnermost part of the fjord, leading to a salinity gradient in the surface water. Sea-ice usually covers the inner part of the fjord from December to early May, but theouter part of the fjord is permanently ice free. Whereas the phytoplankton communityis the main primary producer in the central parts of the fjord (Sejr et al., 2014), subtidal20
macroalgae form productive benthic habitats along the shores to water depths of ca.40 m (Krause-Jensen et al., 2012) interspaced with communities of benthic microalgae(Glud et al., 2010; Attard et al., 2014) as well as with scattered eelgrass meadows at1–3 m depth (Olesen et al., 2015). Communities of intertidal macroalgae are prominentin the intertidal zone where they form an important habitat for e.g. blue mussel (Blicher25
et al., 2013).
4912

BGD12, 4907–4945, 2015
Macroalgaecontribute to nested
mosaics of pHvariability
D. Krause-Jensen et al.
Title Page
Abstract Introduction
Conclusions References
Tables Figures
J I
J I
Back Close
Full Screen / Esc
Printer-friendly Version
Interactive Discussion
Discussion
Paper
|D
iscussionP
aper|
Discussion
Paper
|D
iscussionP
aper|
Three field campaigns targeting seasonal- and fjord-scale variability in pH in thepelagic zone were conducted in the spring (19 April), mid-summer (18 July) and latesummer (3 September) of 2013 (Fig. 1b). The late summer survey was associatedwith an intensive campaign (27 August–6 September 2013) exploring pH variability inshallow subtidal kelp habitats and neighboring habitats colonized by benthic microal-5
gae and scattered filamentous algae (Fig. 1c). A final late summer campaign (22–30August 2014) addressed pH variability in vegetated tidal pools and surface waters ofadjacent vegetated shores (Fig. 1c). All pH data from fjord-scale to micro-scale arereported on the total pH scale.
2.2 Fjord and seasonal scale pH variation10
To determine the large-scale spatial and seasonal variation in physical and chemicalparameters in the water column of Kobbefjord, vertical profiles were measured at 11stations located along a longitudinal gradient following the main central axis of thefjord on 19 April, 18 July, and 3 September 2013 (Fig. 1b). We used a Seabird CTD(SBE19plus) equipped with sensors for temperature, conductivity, fluorescence (Sea-15
point Chlorophyll Fluorometer), oxygen (SBE 43, Seabird) and pH (SBE18, Seabird).Alongside CTD profiles, water samples were collected using a 5 L Niskin bottle at 1,5, 10, 20, 30, and 40 m depth. Water was collected for dissolved oxygen measure-ment using Winkler titration (Parsons et al., 1984) which was used to calibrate theCTD oxygen optode. The pH sensor was calibrated using NBS buffers and a sea-20
water TRIS buffer prepared according to Dickson (2007). Unfiltered water was trans-ferred to 150 mL borosilicate glass bottles for pH analysis. The samples were poisonedwith a saturated mercuric chloride solution, cooled and stored in darkness until arrival.Back in the lab, pH was measured potentiometrically using a glass reference electrode(Orion, Ross Ultra pH/ATC Triode) calibrated with NBS buffers and a seawater TRIS25
buffer prepared according to Dickson (2007). The measurements were used to correctthe offset of the SBE 18 pH measurements.
4913

BGD12, 4907–4945, 2015
Macroalgaecontribute to nested
mosaics of pHvariability
D. Krause-Jensen et al.
Title Page
Abstract Introduction
Conclusions References
Tables Figures
J I
J I
Back Close
Full Screen / Esc
Printer-friendly Version
Interactive Discussion
Discussion
Paper
|D
iscussionP
aper|
Discussion
Paper
|D
iscussionP
aper|
For estimation of the saturation state of aragonite (Ωarag), samples for analyses ofdissolved inorganic carbon (CT) and total alkalinity (AT) were collected at 5 stationson one occasion (3 September 2013). Triplicate 12 mL samples were collected at 5,10, 20, 30, 40 m depth and near the bottom. Samples were carefully siphoned throughtygon tubing from Niskin bottles to 12 mL septum-capped glass vial (exetainers) al-5
lowing the water to overflow for two volume changes. The samples were poisonedwith 100 µL 5 % HgCl2 to avoid biological alteration. CT was analyzed with a CT an-alyzer (AS-C3, Apollo Scitech Inc). The accuracy of the analysis was 2.4 µmolkg−1
(average numerical deviation from the reference material value) and the precision was1.4 µmolkg−1 (average SD of triplicate samples). AT was analysed on an alkalinity titra-10
tor, AS-ALK2 from Apollo Scitech with verification against the same certified referencematerial used for pH measurements or a Metrohm Titrando 808 by open cell titration(Dickson et al., 2007) using Batch 136 supplied by the Andrew Dickson lab at UCSan Diego for verification. Average analysis accuracy was 2.9 µmolkg−1 (average nu-merical deviation from the reference material value). Relationships between AT and15
salinity (S) were used to verify the published relationship for the Godthåbsfjord system(TA= 159+63S, Meire et al., 2014) which was subsequently applied for calculation ofAT based on salinity data collected in April, July and September. Ωarag was calculatedfrom AT and pH using the CO2SYS excel programme version 2.1 (Pierrot et al., 2006)with the K1 and K2 constants from Mehrbach et al. (1973), as modified by Dickson and20
Millero (1987).
2.3 Small-scale and diurnal-scale pH variation
To measure small-scale and diurnal-scale variation in pH and physico-chemical vari-ables in kelp forests and adjacent sub-tidal habitats colonized by microalgae and scat-tered filamentous algae we constructed four metal frames each measuring approxi-25
mately 0.90m×0.90m×1.10m. Each frame was equipped with instruments that al-lowed continuous measurements of temperature, salinity, water level, oxygen concen-tration, photosynthetically active radiation (PAR) and pH at ca 50 cm above the seafloor
4914

BGD12, 4907–4945, 2015
Macroalgaecontribute to nested
mosaics of pHvariability
D. Krause-Jensen et al.
Title Page
Abstract Introduction
Conclusions References
Tables Figures
J I
J I
Back Close
Full Screen / Esc
Printer-friendly Version
Interactive Discussion
Discussion
Paper
|D
iscussionP
aper|
Discussion
Paper
|D
iscussionP
aper|
(Fig. 1s). Measurements were made every 10 min or less. We conducted 3 paralleldeployments of two frames in kelp habitats and two frames in habitats colonized bymicroalgae and scattered filamentous algae, with each deployment lasting about 48 h.The typical distance between the frames in each habitat was 10–20 m and betweenkelp forests and habitats colonized by microalgae and scattered filamentous algae ap-5
proximately 100 m. Conductivity, temperature and water level were measured usingtwo Hydrolab DS5X and MicroCats (SBE37 Seabird). Oxygen concentration was mea-sured using MiniDot oxygen loggers, Precision Measurement Engineering, and Hydro-lab DS5X. PAR was measured using Odyssey PAR loggers from Dataflow SystemsPty Limited. pH was measured using Hydrolab DS5X and SeaFet pH loggers from10
Satlantic. Hydrolab DS5X pH sensors were calibrated with a routine two-point calibra-tion using NIST buffers of pHNBS 7.0 and 10.0. Before and after each deployment allinstruments were placed in a 50 L tank with sea water to intercalibrate sensors. AllpH loggers were offset to the same newly calibrated high-precision seafet pH sensor,calibrated at the Satlantic facility (www.satlantic.com) on the total scale using single-15
point calibration. Oxygen sensors were calibrated to O2 concentrations of the tank asdetermined from Winkler titrations.
To monitor three-dimensional pH variations on a m-scale within the kelp canopy,we deployed a custom built multi-sensor array, consisting of an autonomous data log-ger (Datataker DT85, serial number 096 831) in a water-tight housing (custom built by20
Albatros Marine Technologies S.I.) with 16 pre-amplified pH electrodes (Omega, PHE-1304-NB). The pH sensors were attached to the submersible logger by 5 m long cablesto allow for adjusting their position as needed (Fig. A1). The sensors were configuredin-situ in a three dimensional array on the metal frame occupying a volume of approxi-mately 1 m3, with 4 sensors at 0.1 m from the bottom, 4 sensors at 0.2 m, 4 sensors just25
underneath the canopy and 4 above the canopy, which typically extended about 0.75 mabove the seafloor. All pH sensors were calibrated with a three point calibration usingNIST buffers of pHNBS 4.0, 7.0 and 10.0 allowing at least 5 min between every readingfor the sensors to stabilize. All pH loggers were offset to the same newly calibrated
4915

BGD12, 4907–4945, 2015
Macroalgaecontribute to nested
mosaics of pHvariability
D. Krause-Jensen et al.
Title Page
Abstract Introduction
Conclusions References
Tables Figures
J I
J I
Back Close
Full Screen / Esc
Printer-friendly Version
Interactive Discussion
Discussion
Paper
|D
iscussionP
aper|
Discussion
Paper
|D
iscussionP
aper|
high-precision seafet pH sensor as mentioned above. On several occasions triplicatesamples for determination of CT and AT were collected and analyzed as describedabove to allow calculation of carbonate chemistry and Ωarag.
pH-variation in vegetated tidal pools and adjacent intertidal habitats on the shorewere quantified over a diurnal cycle through sampling at low tide just after pool forma-5
tion and prior to pool inundation during day and night. pH and Ωarag were calculatedfrom CT and AT samples collected and analyzed as described above and computedusing the CO2SYS program (Pierrot et al., 2006) with in situ information on tempera-ture and salinity. Salinity was analysed from water samples based on measurementsof conductivity (Orion 3 STAR Conductivity benchtop) while oxygen concentration and10
water temperature were determined using a portable meter (Hack, HQ40d).
2.4 Micro-scale pH variation
pH-variations at a millimeter scale were measured in the laboratory on 6 differentspecies of macrophytes (Ascophyllum nodosum, Fucus vesiculosus, Saccharina longi-cruris, Agarum clathratum, Ulva lactuca, Zostera marina) occurring in Kobbefjord and15
collected either there or, for logistic reasons, in another branch of the Godthåbsfjordsystem. From each species, a piece of approximately 5cm×2 cm was cut and mountedon a microscope slide in an aquarium with seawater before measurements. The set-upwas mounted in a room with climate control and temperature was kept at 2–3 C. Wemeasured pH from a point close to the leaf surface up until out of the diffusive bound-20
ary layer (DBL) where the pH was stable. We used UNISENSE micro-pH sensors with25 or 50 µm tips, connected to a Volt meter with 1 decimal precision for mV measure-ments (Consort, R362). pH sensors were calibrated with a three point calibration usingNIST buffers of pHNBS 4,0; 7,0 and 10,0 allowing at least 5 min between every readingfor the sensor to stabilize. A USB microscope (Dinocapture) connected to a PC with25
on-screen visualization software aided in visually establishing the lowest point of themeasurements, as close to the macrophyte surface as possible without breaking thetip of the electrode. A scaled picture from this lowest point allowed for back calculating
4916

BGD12, 4907–4945, 2015
Macroalgaecontribute to nested
mosaics of pHvariability
D. Krause-Jensen et al.
Title Page
Abstract Introduction
Conclusions References
Tables Figures
J I
J I
Back Close
Full Screen / Esc
Printer-friendly Version
Interactive Discussion
Discussion
Paper
|D
iscussionP
aper|
Discussion
Paper
|D
iscussionP
aper|
the actual distance to the leaf surface afterwards. We allowed readings at this lowestpoint to stabilize for > 5 min after which the mV value was written down manually. Themicrosensor was then raised 20 µm with a precise 1-D micromanipulator, afterwards30 µm, after which we continued with 50 µm increments and then 100 and 500 µmincrements until a stable pH was obtained for 3 measurements or more and we con-5
sidered we were outside the DBL. We evaluated 3 replicas of each species at a lightintensity of 200 µmol photons m−2 s−1, and calculated the ∆pH across the boundarylayer (defined from the tissue surface to where pH was at 0.99× water-column pH).
3 Results
3.1 Fjord-scale and seasonal pH variability10
Large seasonal and spatial variability was observed in pH-values along the longitudinalgradient centrally in the fjord (Fig. 2a). pHT in surface water increased in April dueto CO2 consumption by the spring bloom as evidenced by a very high fluorescence(Fig. A2), to a maximum value of almost 8.50, most pronounced in the mouth of thefjord with values of around 8.25 in the inner part (Fig. 2). Accordingly, a horizontal15
gradient of around 0.25 pH units was observed along the main axis of the fjord. pHTvalues in upper layers decreased during the summer to around 8.35 in July and withthe maximum observed towards the inner part of the fjord. A further decrease in pHwas observed in September, with more homogenous values in surface waters along thefjord gradient resulting in a horizontal range of only 0.05 pH units. Vertical gradients in20
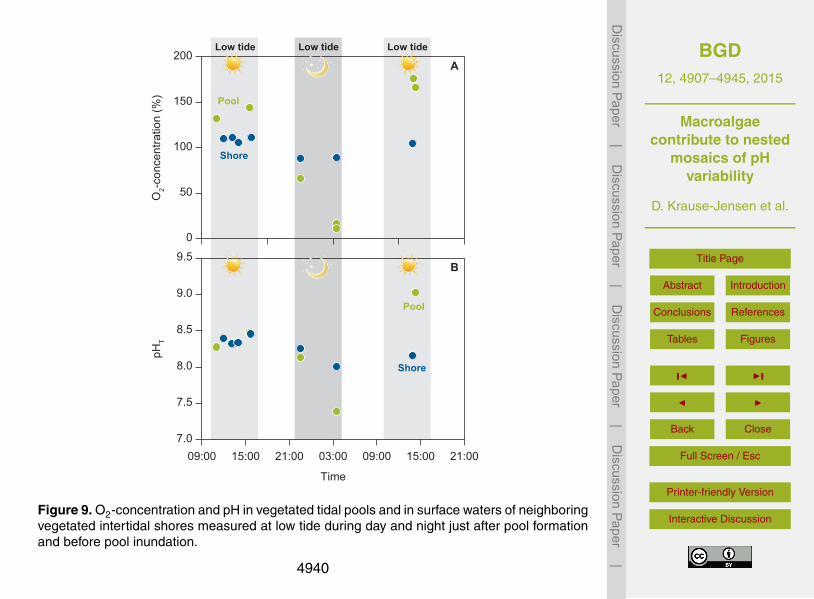
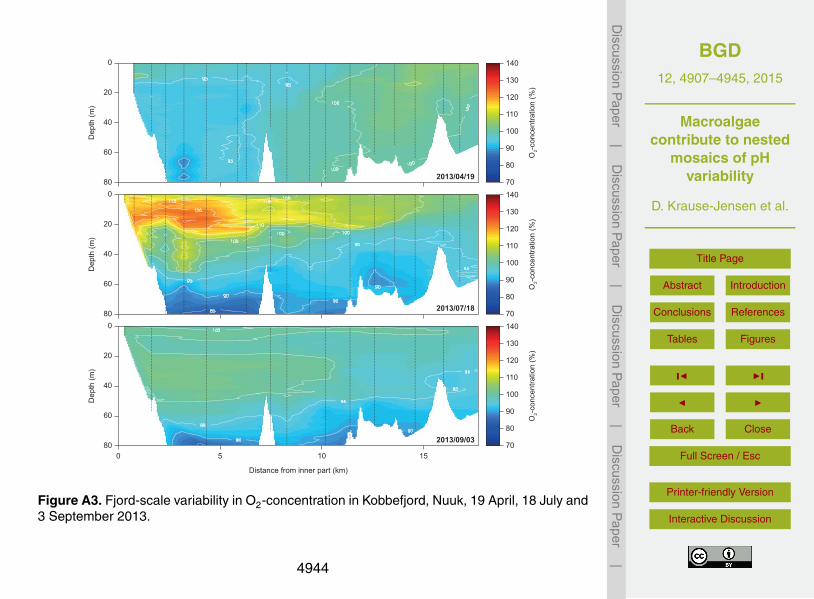
pH from the surface to the deeper waters of the fjord ranged from only 0.1 units in April,when the fjord was vertically mixed, over 0.15 units in September to 0.25 pH units inJuly when maximum pHT values of 8.35 occurred in a subsurface algal bloom in theinner parts of the fjord with waters supersaturated in oxygen (up to 120 % saturation,Figs. A2 and A3) and minimum values of pHT 8.1 were measured in the deeper sectors25
(Fig. 2a). Seasonally pH varied between 0.2 and 0.3 units in both surface and deep
4917

BGD12, 4907–4945, 2015
Macroalgaecontribute to nested
mosaics of pHvariability
D. Krause-Jensen et al.
Title Page
Abstract Introduction
Conclusions References
Tables Figures
J I
J I
Back Close
Full Screen / Esc
Printer-friendly Version
Interactive Discussion
Discussion
Paper
|D
iscussionP
aper|
Discussion
Paper
|D
iscussionP
aper|
waters over the 5 months. Corresponding Ωarag values ranged from minimum values of1.5, observed in the bottom waters of the inner part of the fjord in July and September,to maximum values of 3, observed in the surface and subsurface waters in April andJuly (Fig. A4).
Oxygen saturation at the fjord-scale ranged greatly from 85 to 127 % and was5
strongly related to pH for each of the three periods (Fig. 3a), pointing at strong bio-logical control of pH variability within the fjord. The slope of the pH vs. O2 relationshipwas steepest for the April survey when the highest pH levels were observed. Exami-nation of pH values in relation to fluorescence and temperature also showed that thewarmest waters, of up to 10 C, observed in July, supported intermediate pH, while the10
highest pH was observed in the coldest waters, corresponding to the April survey whentemperatures were uniformly low across the fjord (Fig. 3b). On a vertical scale, the coldbottom waters with low fluorescence generally supported the lowest pH values acrossseasons. Hence, overall, pH showed much tighter correlation with O2 levels than withwater temperature, and the correlation between pH and O2 was matched by a close15
correlation between Ωarag and O2-levels (Fig. 3c).
3.2 Small-scale and diurnal pH- variability in kelp forests and benthic habitatscolonized by microalgae/scattered filamentous algae
The 3 parallel deployments in kelp forest and habitats colonized by microalgae andscattered filamentous algae encompassed 6 complete diurnal cycles which exhibited20
peak pHT-levels during the day of 8.11 (8.04–8.19) (avg.(SD)) and of 8.08 (8.02–8.16), respectively, as opposed to minimum pHT-levels during night of 8.02 (7.97–8.06) and 8.01 (7.94–8.09), respectively, with no significant difference between habi-tats (t test, p > 0.05). The diurnal range of minimum night pH to maximum day pH wasslightly higher in the kelp forest (avg.±SD= 0.098±0.061) than above the microal-25
gae/filamentous algae (0.073±0.052) (paired, one-tailed t test, p = 0.041).There were large differences in the extent of diel fluctuations in pH among deploy-
ments dependent on incident irradiance and the shifting phase of tidal state and the4918

BGD12, 4907–4945, 2015
Macroalgaecontribute to nested
mosaics of pHvariability
D. Krause-Jensen et al.
Title Page
Abstract Introduction
Conclusions References
Tables Figures
J I
J I
Back Close
Full Screen / Esc
Printer-friendly Version
Interactive Discussion
Discussion
Paper
|D
iscussionP
aper|
Discussion
Paper
|D
iscussionP
aper|
solar cycle (Fig. 4). Diel pH fluctuations were small during dark, cloudy days and whenhigh tide coincided with peak solar radiation, thereby reducing incident irradiance onthe benthic habitat. In contrast, diel pH fluctuations were amplified in deployments dur-ing sunny days when low tide coincided with peak solar radiation (Fig. 4). Hence, theinteraction between tide and the solar cycle controlled incident radiation and thereby5
induced fluctuations in photosynthetic activity and pH. This was particularly apparent inkelp forests where peak daily pH increased as a function of maximum daily photosyn-thetic solar radiation reaching the habitat during the day whereas this relationship wasnot significant in the water column above the microalgae/filamentous algae (Fig. 5).Indeed, biologic control of pH was also reflected in strong relationships between pH10
and O2 concentration within each deployment in the kelp forests (R2 = 0.64–0.76) par-ticularly during high irradiance, as opposed to weaker pH vs. O2 relationships for themicroalgae/filamentous algae sites (R2 = 0.05–0.15) which also showed much smallervariability in O2 levels (98–114 % saturation) than did the kelp forest (92–128 % satu-ration) (Fig. 6). The diurnal range of O2 concentrations in the kelp forest matched the15
range recorded at pelagic fjord-scale on a seasonal basis (85–127 %, Fig. 3).Changes in water masses by the tide, reflected by changes in salinity and tempera-
ture, also contributed to variations in pH and O2 levels. This was visible as incidencesof sudden changes in pH paralleling fluctuations in salinity and also as differences inpH levels between deployments in water masses of different salinity (Fig. 4). However,20
salinity explained much less of the variation in pH than did O2, except in one deploy-ment in the microalgae/filamentous algae habitat when salinity explained 51 % of thevariation in pH as opposed to 15 % explained by O2 (R2 = 0.04–0.33 in kelp forest;R2 = 0.04–0.51 in microalgae/filamentous algae, data not shown). So, overall biologi-cal activity had a much stronger influence on pH than had exchange of water masses.25
The observed diurnal pH variability also translated into important fluctuations inΩarag, involving 0.18±0.06 units (from max night levels of 1.77±0.21 to min day levelsof 1.60±0.17) in the kelp forest and 0.14±0.07Ωarag units (from max night levels of1.72±0.30 to min day levels of 1.58±0.26) at the microalgae/filamentous algae sites.
4919

BGD12, 4907–4945, 2015
Macroalgaecontribute to nested
mosaics of pHvariability
D. Krause-Jensen et al.
Title Page
Abstract Introduction
Conclusions References
Tables Figures
J I
J I
Back Close
Full Screen / Esc
Printer-friendly Version
Interactive Discussion
Discussion
Paper
|D
iscussionP
aper|
Discussion
Paper
|D
iscussionP
aper|
3.3 Meter to millimeter-scale pH variability in kelp forests
Examination of the variability in pH within 1 m3 kelp forest, sampled from the bottomof the canopy to the overlying water column, using the multi-electrode array, showedvery large concurrent pH variability involving about 0.2 to 0.3 pH unit differences atany given time and with a total pHT range of 7.76–8.36 across deployments (Fig. 7). In5
general, pH tended to be highest at the top of the canopy and in the water just abovethe canopy, reflecting that the canopy top is the most photosynthetically active layer,while pH was generally lower in the shaded bottom part of the canopy (Fig. 7) wherephotosynthetic biomass and incident light are lower and respiration rates higher. Therange of pH within 1 m3 of kelp forest at any one point in time was comparable among10
deployments, despite the different light conditions, although the absolute values of pHdiffered among deployments with highest levels observed at peak incident light (Fig. 7).This small-scale variability in pH also translated into a variability in Ωarag of about 0.20
units in 1 m3 of habitat at any time.pH also varied significantly within the boundary layer of the six macrophyte species15
examined in the light (Fig. 8a), with pH increasing by 0.07–0.85 units, depending onspecies, from the top of the 0.3–2.2 mm thick boundary layer to the surface of the plants(Fig. 8b). There were important differences among species, which likely related to theirphotosynthetic rates and variations in the thickness of their boundary layer.
3.4 pH variability in intertidal pools20
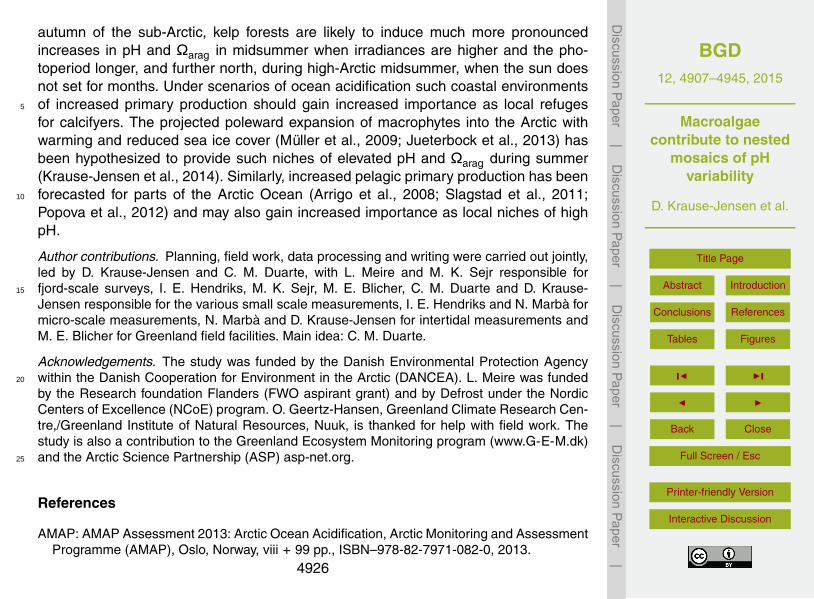
pH and oxygen concentration showed important diel variability in vegetated intertidalpools, with oxygen super-saturation (up to 176 %) during the day and under-saturation(down to 11 %) at night, compared to far more uniform concentrations in the surfacewaters on the adjacent vegetated shore (89–111 % saturation, Fig. 9). Accordingly, pHTchanged greatly in intertidal pools, reaching maximum values of 9.0 during the day and25
minimum values of 7.4 during night periods, i.e. a diel range of ca. 1.6 pHT units. DielpHT fluctuations in the surface waters of the adjacent shore were much smaller (8.0–
4920

BGD12, 4907–4945, 2015
Macroalgaecontribute to nested
mosaics of pHvariability
D. Krause-Jensen et al.
Title Page
Abstract Introduction
Conclusions References
Tables Figures
J I
J I
Back Close
Full Screen / Esc
Printer-friendly Version
Interactive Discussion
Discussion
Paper
|D
iscussionP
aper|
Discussion
Paper
|D
iscussionP
aper|
8.5) but still high, reflecting the metabolic activity of the intertidal vegetation growing onthe shore (Fig. 9). The difference in pH between vegetated intertidal pools and adjacentshores provided an additional example of variability in pH between adjacent habitats.Data are available in digital form (Krause-Jensen et al., 2015).
4 Discussion5
Our results highlight the nested scales of variability of pH present in the Kobbefjordecosystem involving (1) seasonal variability, largely driven by the phytoplankton springbloom as a major event affecting pH, (2) diel variability acting through complex changesin submarine irradiance modulating rates of photosynthesis and respiration of benthicvegetation driven by the interaction of the solar and the tidal cycles, (3) large-scale10
variability along horizontal and vertical fjord gradients reflecting gradients in metabolicactivity in combination with movement of water masses, (4) variability between subtidalhabitats with and without kelp forests and between vegetated tidal pools and adja-cent vegetated shores reflecting variable degrees of biological control, (5) small-scalethree dimensional variability due to heterogeneity in metabolic processes and mixing in15
vegetated habitats, and (6) micro-scale variability across the boundary layers of macro-phytes (Fig. 10).
Overall, metabolic processes played a fundamental role in driving pH-variabilityacross scales, as reflected in strong relationships between oxygen concentration andpH at the fjord-scale and at both diel and seasonal scales. Primary producers played20
a major role in the regulation of pH-variability, both in the pelagic zone where, partic-ularly, the intense spring bloom characteristic of Arctic ecosystems (Takahashi et al.,2003; Sejr et al., 2014) induced high pH in the subsurface layers while respiratoryprocess in the bottom waters reduced pH; and in the nearshore benthic environmentwhere the presence of subtidal kelp forests and intertidal macroalgae induced marked25
spatial and diurnal variability in pH. The mosaics of pH reflected that the density of theprimary producers, and the spatio-temporal separation of photosynthesis and ecosys-
4921

BGD12, 4907–4945, 2015
Macroalgaecontribute to nested
mosaics of pHvariability
D. Krause-Jensen et al.
Title Page
Abstract Introduction
Conclusions References
Tables Figures
J I
J I
Back Close
Full Screen / Esc
Printer-friendly Version
Interactive Discussion
Discussion
Paper
|D
iscussionP
aper|
Discussion
Paper
|D
iscussionP
aper|
tem respiration in combination with mixing of water masses were key drivers of thevariability in both planktonic and benthic communities. Thus, the vertical gradient ofdeclining pH from upper illuminated to lower shaded habitats varied from the 10–100 mscale in the planktonic community to the m scale in the dense kelp forest.
The scale of seasonal pH-variability in the planktonic community (Fig. 10) compared5
well with previous reports for the Arctic, showing the spring bloom as a prevalent driverof pCO2 (Sejr et al., 2011; Meire et al., 2014). The diel variability in kelp beds wasin range with that reported from a Californian kelp forest (Frieder et al., 2012), whilegreater than reported for Mediterranean seagrass beds (Hendriks et al., 2014), andbelow the range of up to 1 pH unit reported for dense algal mats (Middelboe and10
Hansen, 2007). The diel variability in pH in the kelp forest was subjected to a strongerdirect biological control than that of the microalgae/filamentous algae, as reflected instronger pH vs. O2 relationships and steeper pH vs. light relationships, because of thelarger density of the kelps and associated faster rates of metabolic activity per unitvolume in combination with reduced flow in the dense habitat. The habitat colonized15
by microalgae/filamentous algae carried a less distinct biological signal reflecting thebenthic primary producers at the site in combination with a signal from the planktoniccommunity and the nearby kelp forests in the water masses exchanged with tidal cur-rents. The marked biological control of pH in kelp forests suggests that diel pH maybe even more pronounced during sunny days with more intense photosynthesis than20
during the generally overcast conditions of our survey. Thus, while the identified pH-range and pH vs. O2-relationships for the planktonic community covered the full growthseason, they solely represented a few overcast September days in the benthic habi-tats and would likely involve markedly higher levels had they covered the full growthseason. For sub-Antarctic giant kelp forests, the diel amplitude in pCO2 and CT (Delille25
et al., 2009) during productive periods as well as the seasonal amplitude in pH, CT andpCO2 (Delille et al., 2000) were reported to be markedly higher within the kelp forestas compared with unvegetated habitats, underlining the kelps’ strong biological controlof pH.
4922

BGD12, 4907–4945, 2015
Macroalgaecontribute to nested
mosaics of pHvariability
D. Krause-Jensen et al.
Title Page
Abstract Introduction
Conclusions References
Tables Figures
J I
J I
Back Close
Full Screen / Esc
Printer-friendly Version
Interactive Discussion
Discussion
Paper
|D
iscussionP
aper|
Discussion
Paper
|D
iscussionP
aper|
We further show, for the first time, significant 3-d variability in pH within 1 m3 ofkelp forest, with pH ranging about 0.2–0.3 pH units at any one point in time and a totalvariability across deployments of 7.76–8.36 pHT, resembling the range recorded acrossthe entire growth season in the pelagic. Levels of pH were dependent on the position inthe kelp canopy, with the highest pH generally appearing at the top of the canopy and5
decreasing toward the seafloor, likely reflecting the vertical structure of photosyntheticactivity in the kelp bed. Changes in pH were particularly pronounced in small tidal pools,where photosynthesis of dense seaweed stands of primarily Ascophyllum nodosumand Fucus spp. drove O2 levels to heavy super saturation (176 %) and forced pH toextremes of up to pHT 9.0 at low tide during sunny days, corresponding to Ωarag of 4.1410
and pCO2 of 13 µatm compared to night-values of pHT 7.4, Ωarag of 0.27 and pCO2of 1647 µatm driven by community respiration which almost depleted O2 in the pools(11 % saturation). In surface waters of adjacent densely vegetated intertidal shores, weobserved a maximum pHT of 8.5 with corresponding Ωarag 2.23 and pCO2 of 96 µatmduring the day and a minimum pHT of 8.0, with corresponding Ωarag of 0.54 and pCO215
of 243 µatm during the night. While intertidal brown macroalgae thrive in such habitatswhen regularly flushed as in the current study, apparently only Ulva (Enteromorpha)intestinalis occurs in isolated, rarely flushed rock pools where it can drive pH to levels> 10 (Björk et al., 2004).
At the micro-scale, pH also showed considerable variability with a range of up to20
0.85 pH units across the boundary layer of the key species of the vegetated shal-low ecosystems, with high pH levels at the tissue surface declining towards the bulkwater during day time (Fig. 8). There was substantial variability among species, withintertidal macroalgae (Ascophyllum and Fucus) showing the largest pH range. This mi-croscale pH variability across boundary layers compared well previous observations for25
the calcifying alga Hamelida discoidea (pH-range across boundary layer of 0.7, de Beerand Larkum, 2001) as well as for the coralline algae Sporolithon durum (light-dark pHchange at tissue surface 0.9; Hurd et al., 2011; Roleda and Hurd, 2012) and Arthrocar-dia corymbosa (pH range across boundary layer e.g. 0.4, depending on flow; Cornwall
4923

BGD12, 4907–4945, 2015
Macroalgaecontribute to nested
mosaics of pHvariability
D. Krause-Jensen et al.
Title Page
Abstract Introduction
Conclusions References
Tables Figures
J I
J I
Back Close
Full Screen / Esc
Printer-friendly Version
Interactive Discussion
Discussion
Paper
|D
iscussionP
aper|
Discussion
Paper
|D
iscussionP
aper|
et al., 2013). The boundary layer thickness as well as the pH range across it dependsmarkedly on flow conditions. Reduced flows as present in dense vegetation increasethe boundary layer thickness and consequently the pH range (Hurd et al., 2011; Corn-wall et al., 2013). Exchange of water masses with different salinity and temperaturealso added to the variability in pH as indicated for both pelagic (Fig. 3b) and benthic5
(Fig. 4) systems but showed much weaker correlation to pH than did O2 concentrationsreflecting the biological control.
The processes above resulted in nested scales of pH variability in the Kobbefjordecosystem (Fig. 10), with variability ranging 0.2–0.85 units across spatial scales and0.2–1.6 units over diurnal to seasonal scales. This variability provides a dynamic mo-10
saic of niches for organisms. Niches of high pH may be particularly important for themore vulnerable larval and juveniles stages of calcifiers under acidic conditions asprojected for the future (Kroecker et al., 2013). The suitability for calcifiers is best rep-resented by Ωarag, where calcifiers should be favored by high Ωarag values. The Kobbe-fjord ecosystems host a number of calcifying species, including bivalves such as blue15
mussel, scallops and snails, echinoderms, such as green sea urchins, and crustaceanssuch as Pseudobalanus balanoides, calcareous algae and foraminifers. Overall, theidentified Ωarag conditions were favorable to calcification as they were generally wellabove 1, particularly in illuminated habitats with intense photosynthesis. The phyto-plankton spring bloom, depleting CO2 and driving Ωarag to values close to 3, would20
also provide adequate conditions for pelagic calcifiers, as it would provide the doublebenefit of adequate environments for aragonite deposition and food supply to supportgrowth and the energetic demands of calcifiers. Canopies of kelp and intertidal sea-weed environments may also provide adequate niches for calcifiers during summer,when Ωarag values would be highest through the cumulative action of the processes25
upregulating pH and Ωarag values discussed above. Indeed, most calcifiers spawn andrecruit in early summer (Arendt et al., 2013) when pCO2 remains low, warmer watertemperatures lead to higher Ωarag and high solar radiation and long photoperiod allowseaweeds to draw down CO2 further (Delille et al., 2000).
4924

BGD12, 4907–4945, 2015
Macroalgaecontribute to nested
mosaics of pHvariability
D. Krause-Jensen et al.
Title Page
Abstract Introduction
Conclusions References
Tables Figures
J I
J I
Back Close
Full Screen / Esc
Printer-friendly Version
Interactive Discussion
Discussion
Paper
|D
iscussionP
aper|
Discussion
Paper
|D
iscussionP
aper|
The upregulating effect of primary producers on pH is counterbalanced by the op-posite effect of respiration and decomposition prevailing in shaded and deeper basinsand periods as illustrated by the large scale seasonal variability in the pelagic commu-nity (Fig. 2), and paralleled in kelp forests outside the productive period (Delille et al.,2009) as well as during night time and in shaded layers of the kelp forest (Fig. 7) and5
tidal pools (Fig. 9). These shaded habitats with diurnally low Ωarag could be challenginghabitats for calcifyers. Interestingly, however, blue mussels grew in close associationwith macroalgae even in intertidal pools, where they would experience maximum Ωaragvalues of up to 4.28 when low tide occurred at noon as opposed to levels as low as0.28 during night (Fig. 9). Blue mussels have indeed been observed to abound in in-10
tertidal macroalgal habitats (Blicher et al., 2013) and along with other calcifiers to betrophically linked with habitat-forming algae such as Ascophyllum (Riera et al., 2009).Probably the recurring periods of high Ωarag in combination with adequate food sup-ply can compensate for the potential problems of low Ωarag during night. Laboratoryexperiments have demonstrated that semidiurnal fluctuations of 0.3 pH units may com-15
pensate for negative effects of constantly low pH on the development of mussel larvae(Frieder et al., 2014). Calcareous epiphytic organisms, such as encrusted algae andbryozoans would also experience high variability in Ωarag at the surface of the planttissue, where periodically high Ωarag values favors calcification, as elegantly demon-strated by de Beer and Larkum (2001).20
The existence of a mosaic of environments in the Kobbefjord underlines the im-portance of metabolic processes along with habitat configuration and interactionsamong community constituents in affecting pH in coastal ecosystems as opposed tothe simpler situation in the open ocean (Duarte et al., 2013; Hendriks et al., 2014).This pronounced influence of metabolic processes occurs in spite of Kobbefjord being25
a macrotidal area with marked exchange of water masses with the coastal region andis probably also the case in many other shallow coastal areas in the Arctic, as hasalso been highlighted for areas in the temperate zone (Duarte et al., 2013). While thecurrent study explored pH in benthic habitats under overcast situations in the early
4925
BGD12, 4907–4945, 2015
Macroalgaecontribute to nested
mosaics of pHvariability
D. Krause-Jensen et al.
Title Page
Abstract Introduction
Conclusions References
Tables Figures
J I
J I
Back Close
Full Screen / Esc
Printer-friendly Version
Interactive Discussion
Discussion
Paper
|D
iscussionP
aper|
Discussion
Paper
|D
iscussionP
aper|
autumn of the sub-Arctic, kelp forests are likely to induce much more pronouncedincreases in pH and Ωarag in midsummer when irradiances are higher and the pho-toperiod longer, and further north, during high-Arctic midsummer, when the sun doesnot set for months. Under scenarios of ocean acidification such coastal environmentsof increased primary production should gain increased importance as local refuges5
for calcifyers. The projected poleward expansion of macrophytes into the Arctic withwarming and reduced sea ice cover (Müller et al., 2009; Jueterbock et al., 2013) hasbeen hypothesized to provide such niches of elevated pH and Ωarag during summer(Krause-Jensen et al., 2014). Similarly, increased pelagic primary production has beenforecasted for parts of the Arctic Ocean (Arrigo et al., 2008; Slagstad et al., 2011;10
Popova et al., 2012) and may also gain increased importance as local niches of highpH.
Author contributions. Planning, field work, data processing and writing were carried out jointly,led by D. Krause-Jensen and C. M. Duarte, with L. Meire and M. K. Sejr responsible forfjord-scale surveys, I. E. Hendriks, M. K. Sejr, M. E. Blicher, C. M. Duarte and D. Krause-15
Jensen responsible for the various small scale measurements, I. E. Hendriks and N. Marbà formicro-scale measurements, N. Marbà and D. Krause-Jensen for intertidal measurements andM. E. Blicher for Greenland field facilities. Main idea: C. M. Duarte.
Acknowledgements. The study was funded by the Danish Environmental Protection Agencywithin the Danish Cooperation for Environment in the Arctic (DANCEA). L. Meire was funded20
by the Research foundation Flanders (FWO aspirant grant) and by Defrost under the NordicCenters of Excellence (NCoE) program. O. Geertz-Hansen, Greenland Climate Research Cen-tre,/Greenland Institute of Natural Resources, Nuuk, is thanked for help with field work. Thestudy is also a contribution to the Greenland Ecosystem Monitoring program (www.G-E-M.dk)and the Arctic Science Partnership (ASP) asp-net.org.25
References
AMAP: AMAP Assessment 2013: Arctic Ocean Acidification, Arctic Monitoring and AssessmentProgramme (AMAP), Oslo, Norway, viii + 99 pp., ISBN–978-82-7971-082-0, 2013.
4926

BGD12, 4907–4945, 2015
Macroalgaecontribute to nested
mosaics of pHvariability
D. Krause-Jensen et al.
Title Page
Abstract Introduction
Conclusions References
Tables Figures
J I
J I
Back Close
Full Screen / Esc
Printer-friendly Version
Interactive Discussion
Discussion
Paper
|D
iscussionP
aper|
Discussion
Paper
|D
iscussionP
aper|
Arendt, K. E., Juul-Pedersen, T., Mortensen, J., Blicher, M. E., and Rysgaard, S: A 5-year studyof seasonal patterns in mesozooplankton community structure in a sub-Arctic fjord revealsdominance of Microsetella norvegica (Crustacea, Copepoda), J. Plankton Res., 35, 105–120,doi:10.1093/plankt/fbs087, 2013.
Arrigo, K. R., van Dijken, G., and Pabi, S.: Impact of a shrinking Arctic ice cover on marine5
primary production, Geophys. Res. Lett., 35, 1–6, 2008.Attard, K. M., Glud, R. N., McGinnis, D. F., and Rysgaard, S.: Seasonal rates of benthic primary
production in a Greenland fjord measured by aquatic eddy correlation, Limnol. Oceanogr.,59, 1555–1569, 2014.
Blicher, M. E. and Sejr, M. K.: Abundance, oxygen consumption and carbon demand of brittle10
stars in Young Sound and the NE Greenland shelf, Mar. Ecol.-Prog. Ser., 422, 139–144,doi:10.3354/meps08915, 2011.
Blicher, M. E., Rysgaard, S., and Sejr, M. K.: Growth and production of sea urchin Strongylo-centrotus droebachiensis in a high-Arctic fjord, and growth along a climatic gradient (64 to77 degrees N) (vol 341, pg 89, 2007), Mar. Ecol. Ser., 341, 89–102, 2007.15
Blicher, M. E., Sejr, M. K., and Rysgaard, S.: High carbon demand of dominant macrozooben-thic species indicates their central role in ecosystem carbon flow in a sub-Arctic fjord, Mar.Ecol. Ser., 383, 127–140, doi:10.3354/meps07978, 2009.
Blicher, M. E., Rasmussen, L. M., Sejr, M. K., Merkel, F. R., and Rysgaard, S.: Abundanceand energy requirements of eiders (Somateria spp.) suggest high predation pressure on20
macrobenthic fauna in a key wintering habitat in SW Greenland, Polar Biol., 34, 1105–1116,doi:10.1007/s00300-011-0968-3, 2011.
Blicher, M. E., Sejr, M. K., and Høgslund, S.: Population structure of Mytilus edulis in the inter-tidal zone in a sub-Arctic fjord, SW Greenland, Mar. Ecol.-Prog. Ser., 487, 89–100, 2013.
Björk, M., Axelsson, L., and Beer, S.: Why is Ulva intestinalis the only macroalga inhabiting25
isolated rock pools along the Swedish Atlantic coast?, Mar. Ecol.-Prog. Ser., 284, 109–116,2004.
Born, E. W., Rysgaard, S., Ehlme, G., Sejr, M., Acquarone, M., and Levermann, N.: Underwaterobservations of foraging free-living Atlantic walruses (Odobenus rosmarus rosmarus) andestimates of their food consumption, Polar Biol., 26, 348–357, 2003.30
Cornwall, C. E., Hepburn, C. D., Pritchard, D., Currie, K. I., McGraw, C. M., Hunter, K. A.,and Hurd, C. L.: Carbon use-strategies in macroalgae: differential responses to lowered
4927

BGD12, 4907–4945, 2015
Macroalgaecontribute to nested
mosaics of pHvariability
D. Krause-Jensen et al.
Title Page
Abstract Introduction
Conclusions References
Tables Figures
J I
J I
Back Close
Full Screen / Esc
Printer-friendly Version
Interactive Discussion
Discussion
Paper
|D
iscussionP
aper|
Discussion
Paper
|D
iscussionP
aper|
pH and implications for ocean acidification, J. Phycol., 48, 137–144, doi:10.1111/j.1529-8817.2011.01085.x, 2012.
De Beer, D. and Larkum, A. W. D.: Photosynthesis and calcification in the calcifying algaeHalimeda discoidea studied with microsensors, Plant Cell Environ., 24, 1209–1217, 2001.
Delille, B., Delille, D., Fiala, M., Prevost, C., and Frankignoulle, M.: Seasonal changes of pCO25
over a subantarctic Macrocystis kelp bed, Polar Biol., 23, 706–716, 2000.Delille, B., Borges, A. V., and Delille, D.: Influence of giant kelp beds (Macrocystis pyrifera) on
diel cycles of pCO2 and DIC in the sub-Antarctic coastal area, Estuar. Coast. Shelf S., 81,114–122, doi:10.1016/j.ecss.2008.10.004, 2009.
Dickson, A. G. and Millero, F. J.: A comparison of the equilibrium constants for the dissociation10
of carbonic acid in seawater media, Deep-Sea Res., 34, 1733–1743, 1987.Dickson, A. G., Sabine, C. L., and Christian, J. R.: Guide to Best Practices For Ocean CO2
Measurements, PICES Special Publication, 191 pp., 2007.Duarte, C., Hendriks, I., Moore, T., Olsen, Y., Steckbauer, A., Ramajo, L., Carstensen, J., Trot-
ter, J., and McCulloch, M.: Is ocean acidification an open-ocean syndrome?, understanding15
anthropogenic impacts on seawater pH, Estuar. Coast., 36, 221–236, 2013.Fabry, V. J., McClintock, J. B., Mathis, J. T., and Grebmeier, J. M.: Ocean acidification at high
latitudes, The Bellweather. Oceanogr., 22, 160–171, 2009.Frieder, C. A., Nam, S. H., Martz, T. R., and Levin, L. A.: High temporal and spatial variability
of dissolved oxygen and pH in a nearshore California kelp forest, Biogeosciences, 9, 3917–20
3930, doi:10.5194/bg-9-3917-2012, 2012.Frieder, C. A., Gonzales, J. P., Bockmon, E. E., Navarro, M. O., and Levini, L. A.: Can variable
pH and low oxygen moderate ocean acidification outcomes for mussel larvae?, Glob. ChangeBiol., 20, 754–764, doi:10.1111/gcb.12485, 2014, 2014.
Glud, R. N., Berg, P., Hume, A., Batty, P., Blicher, M. E., Lennert, K., and Rysgaard, S.: Benthic25
O2 exchange across hard-bottom substrates quantified by eddy correlation in a sub-Arcticfjord, Mar. Ecol.-Prog. Ser., 417, 1–12, doi:10.3354/meps08795, 2010.
Helm, V., Humbert, A., and Miller, H.: Elevation and elevation change of Greenland and Antarc-tica derived from CryoSat-2, The Cryosphere, 8, 1539–1559, doi:10.5194/tc-8-1539-2014,2014.30
Hendriks, I. E., Olsen, Y. S., Ramajo, L., Basso, L., Steckbauer, A., Moore, T. S., Howard, J.,and Duarte, C. M.: Photosynthetic activity buffers ocean acidification in seagrass meadows,Biogeosciences, 11, 333–346, doi:10.5194/bg-11-333-2014, 2014.
4928

BGD12, 4907–4945, 2015
Macroalgaecontribute to nested
mosaics of pHvariability
D. Krause-Jensen et al.
Title Page
Abstract Introduction
Conclusions References
Tables Figures
J I
J I
Back Close
Full Screen / Esc
Printer-friendly Version
Interactive Discussion
Discussion
Paper
|D
iscussionP
aper|
Discussion
Paper
|D
iscussionP
aper|
Hofmann, G. E., Smith, J. E., Johnson, K. S., Send, U., Levin, L. A., Micheli, F., Paytan, A., Price,N. N., Peterson, B., Takeshita, Y., Matson, P. G., Crook, E. D., Kroeker, K. J., Gambi, M. C.,Rivest, E. B., Frieder, C. A., Yu, P. C., and Martz, T. R.: High-frequency dynamics of ocean ph:a multi-ecosystem comparison, PLoS ONE, 6, e28983, doi:10.1371/journal.pone.0028983,2011.5
Hurd, C. L., Cornwall, C. E., Currie, K., Hepburn, C. D., McGraw, C. M., Hunter, K. A., andBoyd, P. W.: Metabolically-induced pH fluctuations by some coastal calcifiers exceed pro-jected 22nd century ocean acidification: a mechanism for differential susceptibility?, Glob.Change Biol., 17, 3254–3262, doi:10.1111/j.1365-2486.2011.02473.x, 2011.
Høgslund, S., Sejr, M. S., Wiktor Jr., J., Blicher, M. E., and Wegeberg, S.: Intertidal commu-10
nity composition along rocky shores in Southwest Greenland: a quantitative approach, PolarBiol., 37, 1549–1561, doi:10.1007/s00300-014-1541-7, 2014.
Jueterbock, A., Tyberghein, L., Verbruggen, H., Coyer, J. A., Olsen, J. L., and Hoarau, G.:Climate change impact on seaweed meadow distribution in the North Atlantic rocky intertidal,Ecol. Evol., 3, 1356–1373, doi:10.1002/ece3.541, 2013.15
Krause-Jensen, D. and Duarte, C. M. Expansion of vegetated coastal ecosystems in the futureArctic, Front. Mar. Sci., 1, 77, doi:10.3389/fmars.2014.00077, 2014.
Krause-Jensen, D., Marbà, N., Olesen, B., Sejr, M. K., Christensen, P. B., Rodrigues, J., Re-naud, P. E., Balsby, T. J. S., and Rysgaard, S.: Seasonal sea ice cover as principal driver ofspatial and temporal variation in depth extension and annual production of kelp in Greenland,20
Glob. Change Biol., 18, 2981–2994, 2012.Krause-Jensen, D., Duarte, C. M., Hendriks, I. E., Meire, L., Blicher, M. E., Marbà, N., and
Sejr, M. K.: Nested scales of pH variability in sub-Arctic Kobbefjord, SW Greenland”, DIGI-TAL.CSIC, available at: http://hdl.handle.net/10261/112946, 2015.
Kroeker, K. J., Kordas, R. L., Crim, R., Hendriks, I. E., Ramajos, L., Singh, G. S.,25
Duarte, C. M., and Gattuso, J.-P.: Impacts of ocean acidification on marine organisms:quantifying sensitivities and interaction with warming, Glob. Change Biol., 19, 1884–1896,doi:10.1111/gcb.12179, 2013.
Mehrbach, C., Culberson, C. H., Hawley, J. E., and Pytkowicz, R. M.: Measurement of the ap-parent dissociation constants of carbonic acid in seawater at atmospheric pressure, Limnol.30
Oceanogr., 18, 897–907, 1973.Meire, L., Søgaard, D. H., Mortensen, J., Meysman, F. J. R., Soetaert, K., Arendt, K. E., Juul-
Pedersen, T., and Rysgaard, S.: Glacial meltwater and primary production as drivers for
4929

BGD12, 4907–4945, 2015
Macroalgaecontribute to nested
mosaics of pHvariability
D. Krause-Jensen et al.
Title Page
Abstract Introduction
Conclusions References
Tables Figures
J I
J I
Back Close
Full Screen / Esc
Printer-friendly Version
Interactive Discussion
Discussion
Paper
|D
iscussionP
aper|
Discussion
Paper
|D
iscussionP
aper|
strong CO2 uptake in fjord and coastal waters adjacent to the Greenland Ice Sheet, Biogeo-sciences Discuss., 11, 17925–17965, doi:10.5194/bgd-11-17925-2014, 2014.
Middelboe, A. L. and Hansen, P. J.: Direct effects of pH and inorganic carbon on macroalgalphotosynthesis and growth, Mar. Biol. Res., 3, 134–144, 2007.
Müller, R., Laepple, T., Bartsch, I., and Wiencke, C. Impact of oceanic warming on the5
distribution of seaweeds in polar and cold-temperate waters, Bot. Mar., 52, 617–638,doi:10.1515/BOT.2009.080, 2009.
Olesen, B., Krause-Jensen, D., Marbà, N., and Christensen, P. B.: Eelgrass (Zostera marina L.)meadows in subarctic Greenland: dense meadows with slow biomass turnover, Mar. Ecol.-Prog. Ser., 518, 107–121, doi:10.3354/meps11087, 2015.10
Pierrot, D. E. L. and Wallace, D. W. R.: MS Excel Program Developed for CO2 Sys-tem Calculations, ORNL/CDIAC-105a, Carbon Dioxide Information Analysis Center,Oak Ridge National Laboratory, U. S. Department of Energy, Oak Ridge, Tennessee,doi:10.3334/CDIAC/otg.CO2SYS_XLS_CDIAC105a, 2006.
Popova, E. E., Yool, A., Coward, A. C., Dupont, F., Deal, C., Elliott, S., Hunke, E., Jin, M.,15
Steele, M., and Zhang, J.: What controls primary production in the Arctic Ocean? Resultsfrom an intercomparison of five general circulation models with biogeochemistry, J. Geophys.Res., 117, C00D12, doi:10.1029/2011JC007112, 2012.
Riera, P., Escaravage, C., and Leroux, C.: Trophic ecology of the rocky shore community asso-ciated with the Ascophyllum nodosum zone (Roscoff, France): a δ13C vs. δ15N investigation,20
Estuar. Coast. Shelf S., 81, 143–148, 2009.Richter, A., Rysgaard, S., Dietrich, R., Mortensen, J., and Petersen, D.: Coastal tides in West
Greenland derived from tide gauge records, Ocean Dynam., 61, 39–49, doi:10.1007/s10236-010-0341-z, 2011.
Roleda, M. Y. and Hurd, C. L.: Seaweed responses to ocean acidification, in: Seaweed Biology,25
Ecological Studies, 219, edited by: Wiencke, C. and Bischof, K., Springer-Verlag, Berlin,Heidelberg, 407–431, ISBN 978-3-642-28450-2.xiii, 510 pp., 2012.
Sejr, M. K., Sand, M. K., Jensen, K. T., Petersen, J. K., Christensen, P. B., and Rysgaard, S.:Growth and production of Hiatella arctica (Bivalvia) in a high-Arctic fjord (Young Sound,Norhteast Greenland), Mar. Ecol.-Prog. Ser., 244, 163–169, 2002.30
Sejr, M. K., Krause-Jensen, D., Rysgaard, S., Sørensen, L. L., Christensen, P. B., andGlud, R. N.: Air–sea flux of CO2 in arctic coastal waters influenced by glacial melt waterand sea ice, Tellus B, 63, 815–822, doi:10.1111/j.1600-0889.2011.00540.x, 2011.
4930

BGD12, 4907–4945, 2015
Macroalgaecontribute to nested
mosaics of pHvariability
D. Krause-Jensen et al.
Title Page
Abstract Introduction
Conclusions References
Tables Figures
J I
J I
Back Close
Full Screen / Esc
Printer-friendly Version
Interactive Discussion
Discussion
Paper
|D
iscussionP
aper|
Discussion
Paper
|D
iscussionP
aper|
Sejr, M. K., Krause-Jensen, D., Dalsgaard, T., Ruiz-Halpern, S., Duarte, C. M., Middelboe, M.,Glud, R. N., Bendtsen, J., and Rysgaard, S.: Seasonal dynamics of autotrophic and het-erotrophic plankton metabolism and pCO2 in a subarctic Greenland fjord, Limnol. Oceanogr.,59, 1764–1778, 2014.
Slagstad, D., Ellingsen, I. H., and Wassmann, P.: Evaluating primary and secondary production5
in an Arctic Ocean void of summer sea ice: an experimental simulation approach, Prog.Oceanogr., 90, 117–131, doi:10.1016/j.pocean.2011.02.009, 2011.
Takahashi, T., Olafsson, J., Goddard, J. G., Chipman, D. W., and Sutherland, S. C.: Seasonalvariation of CO2 and nutrients in the high-latitude surface oceans: a comparative study,Global Biogeochem. Cy., 7, 843–878, 1993.10
Uppström L. R.: The boron/chlorinity ratio of deep-sea water from the Pacific Ocean, Deep-SeaRes., 21, 161–162, 1974.
4931

BGD12, 4907–4945, 2015
Macroalgaecontribute to nested
mosaics of pHvariability
D. Krause-Jensen et al.
Title Page
Abstract Introduction
Conclusions References
Tables Figures
J I
J I
Back Close
Full Screen / Esc
Printer-friendly Version
Interactive Discussion
Discussion
Paper
|D
iscussionP
aper|
Discussion
Paper
|D
iscussionP
aper|
Figure 1. (a) Location of Kobbefjord, Nuuk. (b) Location of sampling sites in Kobbefjord: Fjordscale sites (CTD, CT, AT: filled circles; CTD: open circles), vegetated subtidal sites (open circles# 1–3), and intertidal sites (open circles (#4). (c) Photopanel of benthic habitats: a typical kelpforest habitat and habitat colonized by microalgae/scattered filamentous algae (example fromsite # 1, representative of sites # 1–3 in map) and a vegetated intertidal pool and the adjacentvegetated shore (site # 4 in map).
4932

BGD12, 4907–4945, 2015
Macroalgaecontribute to nested
mosaics of pHvariability
D. Krause-Jensen et al.
Title Page
Abstract Introduction
Conclusions References
Tables Figures
J I
J I
Back Close
Full Screen / Esc
Printer-friendly Version
Interactive Discussion
Discussion
Paper
|D
iscussionP
aper|
Discussion
Paper
|D
iscussionP
aper|
8.3
8.3
8.4
8.4
8.4
8.2
8.15
8.25
8.35 8.35
8.2
8.3
8.2
8.15 8.158.15
8.15
8.25
8.38.3
8.5
8.4
8.3
8.2
8.1
8.0
7.9
0
20
40
60
800
20
40
60
800
20
40
60
80
Dep
th (m
)D
epth
(m)
Dep
th (m
)
Distance from inner part (km)
pHT
8.5
8.4
8.3
8.2
8.1
8.0
7.9
pHT
8.5
8.4
8.3
8.2
8.1
8.0
7.9
pHT
2013/04/19
2013/07/18
2013/09/03
0 5 10 15
Figure 2. Fjord-scale pH-variability in Kobbefjord 19 April, 18 July and 3 September 2013.
4933

BGD12, 4907–4945, 2015
Macroalgaecontribute to nested
mosaics of pHvariability
D. Krause-Jensen et al.
Title Page
Abstract Introduction
Conclusions References
Tables Figures
J I
J I
Back Close
Full Screen / Esc
Printer-friendly Version
Interactive Discussion
Discussion
Paper
|D
iscussionP
aper|
Discussion
Paper
|D
iscussionP
aper|
Figure 3. Fjord-scale relationships in Kobbefjord between pH and oxygen (a), temperature andfluorescence with associated pH-levels shown with symbol color (b), and pH and Ωarag (c),based on three sampling occasions: 19 April, 18 July and 3 September 2013.
4934

BGD12, 4907–4945, 2015
Macroalgaecontribute to nested
mosaics of pHvariability
D. Krause-Jensen et al.
Title Page
Abstract Introduction
Conclusions References
Tables Figures
J I
J I
Back Close
Full Screen / Esc
Printer-friendly Version
Interactive Discussion
Discussion
Paper
|D
iscussionP
aper|
Discussion
Paper
|D
iscussionP
aper|
Figure 4. Diurnal variability in pH, O2, water depth (all measured by Hydrolab) and light (mea-sured by Odyssey loggers) at ca. 50 cm above the seafloor in kelp forests (a–c) and habitatscolonized by microalgae/filamentous algae (e–f) during three parallel deployment in Kobbe-fjord, Nuuk, 27–30 August, 30 August–2 September, 2–5 September 2013. The deploymentsrepresent the benthic sites (# 1–3, respectively) shown on the map (Fig. 1).
4935

BGD12, 4907–4945, 2015
Macroalgaecontribute to nested
mosaics of pHvariability
D. Krause-Jensen et al.
Title Page
Abstract Introduction
Conclusions References
Tables Figures
J I
J I
Back Close
Full Screen / Esc
Printer-friendly Version
Interactive Discussion
Discussion
Paper
|D
iscussionP
aper|
Discussion
Paper
|D
iscussionP
aper|
Figure 5. Maximum daily pH in a kelp forest (green dots) and above microalgae/filamentousalgae (blue dots) as a function of maximum daily incident light over 6 full days as measuredduring three parallel deployment in Kobbefjord, Nuuk, 27–30 August, 30 August–2 Septem-ber, 2–5 September 2013. Linear fit and coefficient of determination shown for the significantrelationship for the kelp forest.
4936

BGD12, 4907–4945, 2015
Macroalgaecontribute to nested
mosaics of pHvariability
D. Krause-Jensen et al.
Title Page
Abstract Introduction
Conclusions References
Tables Figures
J I
J I
Back Close
Full Screen / Esc
Printer-friendly Version
Interactive Discussion
Discussion
Paper
|D
iscussionP
aper|
Discussion
Paper
|D
iscussionP
aper|
Figure 6. pH vs. O2 concentration for three parallel deployments (# 1–3 shown by increasingcolor intensity) in subtidal habitats colonized by kelp forests (top panel) or microalgae/scatteredfilamentous algae (bottom panels) in Kobbefjord, Nuuk, August–September 2013. Each deploy-ment represents 10 min loggings by multiloggers (Hydrolab) over ca. 2 diurnal cycles. Linearfits and coefficients of determination are shown.
4937

BGD12, 4907–4945, 2015
Macroalgaecontribute to nested
mosaics of pHvariability
D. Krause-Jensen et al.
Title Page
Abstract Introduction
Conclusions References
Tables Figures
J I
J I
Back Close
Full Screen / Esc
Printer-friendly Version
Interactive Discussion
Discussion
Paper
|D
iscussionP
aper|
Discussion
Paper
|D
iscussionP
aper|
Figure 7. pH-variability within 1 m3 of kelp forest in Kobbefjord, Nuuk, during three deploymentsin late August–September 2013. 16 pH-sensors were configured in-situ in a 3-d array with 4sensors at 0.1 m from the bottom, 4 sensors at 0.2 m, 4 sensors just underneath the canopyand 4 in the water column above the canopy, which typically extended about 0.75 m above theseafloor.
4938

BGD12, 4907–4945, 2015
Macroalgaecontribute to nested
mosaics of pHvariability
D. Krause-Jensen et al.
Title Page
Abstract Introduction
Conclusions References
Tables Figures
J I
J I
Back Close
Full Screen / Esc
Printer-friendly Version
Interactive Discussion
Discussion
Paper
|D
iscussionP
aper|
Discussion
Paper
|D
iscussionP
aper|
Figure 8. Microscale pH-variability across boundary layers of blades of 6 different macrophytespecies illuminated by 200 µmol photons m−2 s−1: the kelps Saccharina latissima and Agarumclathratum, the intertidal brown macroalgae: Fucus vesiculosus and Ascophyllum nodosum,the green macroalga Ulva lactuca and the seagrass Zostera marina. (a) pH levels (mean of2–3 replicate measurements) across blade boundary layers fitted by an exponential model(y = y0+a×exp−b×x, R2 > 0.90 for all individual fits). (b) pH range across the boundary layerof the various species.
4939
BGD12, 4907–4945, 2015
Macroalgaecontribute to nested
mosaics of pHvariability
D. Krause-Jensen et al.
Title Page
Abstract Introduction
Conclusions References
Tables Figures
J I
J I
Back Close
Full Screen / Esc
Printer-friendly Version
Interactive Discussion
Discussion
Paper
|D
iscussionP
aper|
Discussion
Paper
|D
iscussionP
aper|
Time
pHT
O2-c
once
ntra
tion
(%)
0
50
100
150
200
7.0
7.5
8.0
8.5
9.0
9.5
09:00 09:0015:00 15:0021:00 03:00 21:00
A
B
Low tide Low tideLow tide
Shore
Shore
Pool
Pool
Figure 9. O2-concentration and pH in vegetated tidal pools and in surface waters of neighboringvegetated intertidal shores measured at low tide during day and night just after pool formationand before pool inundation.
4940

BGD12, 4907–4945, 2015
Macroalgaecontribute to nested
mosaics of pHvariability
D. Krause-Jensen et al.
Title Page
Abstract Introduction
Conclusions References
Tables Figures
J I
J I
Back Close
Full Screen / Esc
Printer-friendly Version
Interactive Discussion
Discussion
Paper
|D
iscussionP
aper|
Discussion
Paper
|D
iscussionP
aper|
Figure 10. Conceptual summary of nested scales of temporal and spatial variability in pH inKobbefjord, Nuuk. The figure shows the maximum pH range at the various scales examined.From lower left to upper right: (1) micro-scale variability across macrophyte boundary layers,(2) small scale variability within kelp forests, (3) diurnal variability in vegetated subtidal habitatsand intertidal pools/adjacent shores and variability between habitats at the 100 m scale, (4)seasonal and fjord-scale horizontal variability.
4941

BGD12, 4907–4945, 2015
Macroalgaecontribute to nested
mosaics of pHvariability
D. Krause-Jensen et al.
Title Page
Abstract Introduction
Conclusions References
Tables Figures
J I
J I
Back Close
Full Screen / Esc
Printer-friendly Version
Interactive Discussion
Discussion
Paper
|D
iscussionP
aper|
Discussion
Paper
|D
iscussionP
aper|
Figure A1. Photo of deployment frame with loggers shown on the deck of the boat (upperpanel) and in situ in the kelp forest (site # 1, central panel). Markings in upper panel show thearray of 16 pH sensors connected to a common pH logger, the hydrolab measuring salinity,temperature and oxygen and a PAR logger (odyssey).
4942

BGD12, 4907–4945, 2015
Macroalgaecontribute to nested
mosaics of pHvariability
D. Krause-Jensen et al.
Title Page
Abstract Introduction
Conclusions References
Tables Figures
J I
J I
Back Close
Full Screen / Esc
Printer-friendly Version
Interactive Discussion
Discussion
Paper
|D
iscussionP
aper|
Discussion
Paper
|D
iscussionP
aper|
0
20
40
60
800
20
40
60
800
20
40
60
80
Dep
th (m
)D
epth
(m)
Dep
th (m
)
Distance from inner part (km)
10
8
6
4
2
0
10
8
6
4
2
0
10
8
6
4
2
0
Fluo
resc
ence
(µg
L-1)
Fluo
resc
ence
(µg
L-1)
Fluo
resc
ence
(µg
L-1)
2013/04/19
2013/07/18
2013/09/03
0 5 10 15
Figure A2. Fjord-scale variability in fluorescence in Kobbefjord, Nuuk, 19 April, 18 July and 3September 2013.
4943
BGD12, 4907–4945, 2015
Macroalgaecontribute to nested
mosaics of pHvariability
D. Krause-Jensen et al.
Title Page
Abstract Introduction
Conclusions References
Tables Figures
J I
J I
Back Close
Full Screen / Esc
Printer-friendly Version
Interactive Discussion
Discussion
Paper
|D
iscussionP
aper|
Discussion
Paper
|D
iscussionP
aper|
0
20
40
60
800
20
40
60
800
20
40
60
80
Dep
th (m
)D
epth
(m)
Dep
th (m
)
Distance from inner part (km)
140
100
110
120
130
80
90
70140
100
110
120
130
80
90
70140
100
110
120
130
80
90
70
O2-c
once
ntra
tion
(%)
O2-c
once
ntra
tion
(%)
O2-c
once
ntra
tion
(%)
2013/04/19
2013/07/18
2013/09/03
0 5 10 15
Figure A3. Fjord-scale variability in O2-concentration in Kobbefjord, Nuuk, 19 April, 18 July and3 September 2013.
4944

BGD12, 4907–4945, 2015
Macroalgaecontribute to nested
mosaics of pHvariability
D. Krause-Jensen et al.
Title Page
Abstract Introduction
Conclusions References
Tables Figures
J I
J I
Back Close
Full Screen / Esc
Printer-friendly Version
Interactive Discussion
Discussion
Paper
|D
iscussionP
aper|
Discussion
Paper
|D
iscussionP
aper|
0
20
40
60
800
20
40
60
800
20
40
60
80
Dep
th (m
)D
epth
(m)
Dep
th (m
)
Distance from inner part (km)
3.0
2.0
2.5
1.5
3.0
2.0
2.5
1.5
3.0
2.0
2.5
1.5
Ωar
agΩ
arag
Ωar
ag
2013/04/19
2013/07/18
2013/09/03
0 5 10 15
Figure A4. Fjord-scale variability in Ωarag in Kobbefjord, Nuuk, 19 April, 18 July and 3 Septem-ber 2013.
4945