macro-tidal salt marsh ecosystem response to culvert - cbwes
TRANSCRIPT

R E S E A R C H A R T I C L E
Macro-Tidal Salt Marsh Ecosystem Response toCulvert ExpansionTony Bowron,1 Nancy Neatt,1 Danika van Proosdij,2,3 Jeremy Lundholm4 and Jennie Graham1
AbstractThe purpose of this paper was to examine the vegeta-tive, sedimentary, nekton and hydrologic conditions pre-restoration and the initial 2 years post-restoration at apartially restricted macro-tidal salt marsh site. Replace-ment of the culvert increased tidal flow by 88%. This wasinstrumental in altering the geomorphology of the site,facilitating the creation of new salt marsh pannes, expan-sion of existing pannes in the mid and high marsh zones,and expansion of the tidal creek network by incorporat-ing relict agricultural ditches. In addition, the increase inarea flooded resulted in a significant increase in nekton use,fulfilling the mandate of a federal habitat compensationprogram to increase and improve the overall availabilityand accessibility of fish habitat. The restoration of a morenatural hydrological regime also resulted in the die-off offreshwater and terrestrial vegetation along the upland edge
of the marsh. Two years post-restoration, Salicornia euro-pea (glasswort) and Atriplex glabriuscula (marsh orache),were observed growing in these die-back areas. Similarchanges in the vegetation community structure were notobserved at the reference site; however, the latter did con-tain higher species richness. This study represents the firstcomprehensive, quantitative analysis of ecological responseto culvert replacement in a hypertidal ecosystem. Thesedata will contribute to the development of long-term datasets of pre- and post-restoration, and reference marsh con-ditions to determine if a marsh is proceeding as expected,and to help with models that are aimed at predicting theresponse of marshes to tidal restoration at the upper endof the tidal spectrum.
Key words: Bay of Fundy, GPAC protocol, LiDAR, nekton,restoration monitoring, RSET.
Introduction
Over approximately the last 1,000 years, human activitieshave reduced the amount of salt marsh and free-flowing tidalriver habitats in many areas, including Europe (e.g., Toniset al. 2002; Elias & van der Spek 2006), North America(e.g., Wells 1999; Neckles et al. 2002), and Australia (e.g.,Wolanski et al. 2001). Conservative estimates for the Bay ofFundy put the loss of salt marsh habitat between 80 and 85%(Gordon 1989), mostly associated with diking and conversionto agricultural land. Although these activities are of historicaland social significance, it is now recognized that the significantloss of habitat, species, and primary productivity that hasresulted from the construction of dikes, modern tidal barriers(causeways), and coastal development has had significant
1 CB Wetlands and Environmental Specialists Inc., 37 Royal Masts Way, Bedford,Nova Scotia B4A 4B1, Canada2 Department of Geography, Saint Mary’s University, 923 Robie St., Halifax, NSB3H 3C3, Canada3 Address correspondence to D. van Proosdij, email [email protected] Department of Biology, Saint Mary’s University, 923 Robie St., Halifax, NSB3H 3C3, Canada
© 2009 Society for Ecological Restoration Internationaldoi: 10.1111/j.1526-100X.2009.00602.x
ecological implications, which are preventable and repairable(Sinicrope et al. 1990; Burdick et al. 1997).
Salt marsh ecosystem function may be restored passivelywhen a dike is breached during a storm with little to no humaninterference (Crooks et al. 2002) or through active meansby planned removal or modification of a barrier to restorehydrology (Klotzli & Grootjans 2001). Examination of passiverestoration sites can provide long-term records about vege-tation and geomorphic recovery (Crooks et al. 2002; French2006; Byers & Chmura 2007); however, this provides lim-ited information about driving and/or limiting variables withinthe first few years after the breach event that may influ-ence the ultimate recovery of the system (e.g., Klotzli &Grootjans 2001; Able et al. 2008). Both the European andNorth American experiences have shown that salt marsh re-establishment is not inevitable at all sites following a breach(e.g., Haltiner et al. 1997; French et al. 2000; Klotzli & Groot-jans 2001; Williams & Orr 2002). Properly monitored restora-tion projects can sometimes provide additional informationon constraints that may have caused a restoration project toproceed along successional pathways not initially anticipated(Klotzli & Grootjans 2001). Constraints include inadequatesedimentation or hydrology, high groundwater salinity, lownutrient levels, erosion, and lack of appropriate seed source
Restoration Ecology 1

Marsh Response to Culvert Expansion
(e.g., Burdick et al. 1997; Haltiner et al. 1997; Williams &Orr 2002; French 2006).
Tidal wetlands are valuable ecosystems and their restora-tion has become a common practice in the Gulf of Maine overthe past two decades (Short et al. 2000; Neckles et al. 2002;Konisky et al. 2006). In Atlantic Canada, salt marsh restora-tion is in its infancy and although decommissioning projectshave been conducted by non-government organizations such asDucks Unlimited Canada (DUC) and government departmentssuch as Nova Scotia Department of Agriculture over the lastdecade, no formal salt marsh restoration projects with associ-ated monitoring programs were undertaken until this study.The Cheverie Creek (CHV) restoration project, undertakenby the Nova Scotia Department of Transportation and Infras-tructure Renewal (NSTIR) as a Habitat Compensation Project(”Harmful Alteration Disruption or Destruction of Fish Habi-tat” [HADD]), represents the first fully monitored, active saltmarsh restoration project undertaken in Atlantic Canada. As aHADD it must include a long-term (6-year) monitoring pro-gram to ensure project success.
We examined the hydrologic, sedimentary, vegetative, andnekton conditions pre-restoration and the initial 2 years post-restoration at a macro-tidal salt marsh site. A modified formof the Global Program of Action Coalition for the Gulf ofMaine Regional Monitoring Protocol (GPAC protocol) wasemployed (Neckles et al. 2002). Although culvert replacementprojects are a popular restoration practice in the Gulf ofMaine Region (Konisky et al. 2006), this study was the firstcomprehensive, quantitative data set of ecological responseto culvert replacement in a high macro-tidal ecosystem. Thegoals of the study were to evaluate the rate of vegetationrecovery after culvert replacement and to assess the influenceof marsh morphology, sediment dynamics, and hydrologyin re-establishing conditions and processes critical for self-maintenance of tidal marshes and fish habitat. We hypothesizedthat increasing the size of the culvert would permit naturalmarsh functions to be enhanced. In addition, we determinedif and how monitoring protocols need to be adapted inenvironments where abiotic factors are at the extreme range(e.g., tides and ice). Given the paucity of reference salt marshesin the region, we also evaluated the adequacy of a singlereference site as a control.
MethodsStudy Site
The Bay of Fundy is an extension of the Gulf of Maine, onthe east coast of Canada. It is a high macro-tidal estuarywith semidiurnal tides that may exceed 15 m, exposingextensive intertidal mud flats at low tide. Suspended sedimentconcentrations within the Minas Basin in the upper Bay arehigh, ranging from 150 mg/L over the marsh surface (vanProosdij et al. 2006a) to 4,000 mg/L (Amos & Tee 1989)in the Basin. This inorganic material contributes to the highsedimentation rates recorded on marshes within the region(e.g., Chmura et al. 2001; van Proosdij et al. 2006a, 2006b)
and their minerogenic nature. The CHV (45◦09′31.44′N,64◦10′09.84′W) marsh is located on the southern shore of theMinas Basin in the upper reaches of the Bay of Fundy. Thewater depth over the marsh during high tides can be upwardsof 1–1.5 m. In the winter, rafted ice floes can become trappedon the marsh surface, depositing sediment and root rhizomematerial in the spring (van Proosdij et al. 2006b).
The monitoring program was conducted on the front 29.5ha of CHV, with the majority of monitoring activities focusedon the north side of the creek. Highway 215 crosses the mouthof the CHV by way of a two-lane causeway-culvert structure.Historically, this system was diked (approximately 200 yearsago) and used for agricultural purposes. There are remnants ofthe abandoned dike on both sides of the main creek, runningperpendicular to the creek. The causeway was originallyconstructed approximately 50 m seaward of the dike with asmall bridge section spanning the main creek channel. Thebridge was replaced by a wooden box culvert with flap gate in1960, completely restricting tidal flow. Encroachment of tree,shrub, and freshwater species occurred over approximately 25years until tidal flow was partially restored when the flap gatewas removed unintentionally in the early 1980s. Tidal flowwas partially restricted at this time, causing a significant (1m) tidal restriction for spring tides, allowing tidal flow to 4–5ha of the marsh surface. Restoration activities consisted ofthe replacement of the remnants of the wooden box culvert(Fig. 1a) with a 9.2 × 5.5–m elliptical aluminum culvert(Fig. 1b), increasing the culvert opening approximately 7-foldfrom 4.7 to 32.6 m2. This restored tidal flow to 43 ha (430,000m2) of former marsh surface on spring tide events. This site isdirectly behind the causeway, which protects the marsh edgesfrom wave action (Fig. 2).
The zonation of the CHV vegetation community resemblesthat of other Fundy salt marshes such as Allen Creek (45◦52′N,64◦21′W; van Proosdij et al. 1999) and Dipper Harbour(45◦06′N, 66◦26′W; Byers & Chmura 2007). The majority ofthe marsh surface is of the high marsh variety, with low marshfringing the main creek and some marsh surface pannes anddrainage channels (Fig. 2).
The reference site for this compensation site is BassCreek (CHV-R), located in Bramber, 5 km North of CHV(45◦11′55.24′N, 64◦07′58.11′W). Highway 215 also crossesthe mouth of this creek with a causeway-bridge combination.The bridge spans the width of the creek and does not restricttidal flow. The study area at CHV-R is 5.9 ha.
Field Methods
A pre- and post-restoration monitoring program was devel-oped for the CHV Salt Marsh Restoration Project in 2005(Bowron & Chiasson 2006), which was based on the GPACprotocol with elements drawn from other programs/studies.The program involved a minimum of 1 year pre- and 5 yearspost-restoration data collection for a series of physical andbiological parameters within the ecological indicator cate-gories of hydrology, soils and sediments, vegetation, fish, andinvertebrates. The indicator categories, physical and biological
2 Restoration Ecology

Marsh Response to Culvert Expansion
(a) (b)
Figure 1. (a) Old box culvert at CHV in 2002 and (b) new culvert installed in December 2005.
Figure 2. Sampling design for first 8 of 26 lines at CHV superimposed over LiDAR elevations. LiDAR provided by T. Webster of the AdvancedGeomatics Research Group at COGS, 2007. Elevations expressed relative to CGVD28 vertical datum.
Restoration Ecology 3

Marsh Response to Culvert Expansion
Tab
le1.
The
Che
veri
eC
reek
Salt
Mar
shR
esto
ratio
nm
onito
ring
prog
ram
,inc
ludi
ngco
rean
dad
ditio
nale
colo
gica
lind
icat
ors,
met
hodo
logi
es,a
ndth
esi
te-s
peci
ficap
plic
atio
n(X
:all
site
s;C
–C
HV
-R).
Pos
t
Cat
egor
yP
aram
eter
sSa
mpl
ing
Met
hod
Ann
ual
Sam
plin
gF
requ
ency
Pre
Yr
1Y
r2
Hyd
rolo
gyH
ydro
logy
sign
alD
aily
max
imum
wat
erle
vel
(man
ual
wat
erle
vel
reco
rder
),co
ntin
uous
(1-
or5-
min
ute
inte
rval
s)w
ater
leve
lre
cord
ers
(Sol
inst
Lev
elog
ger
Mod
el30
01)
Dai
lym
axim
ums:
CH
V:
18Se
ptem
ber–
2O
cto-
ber
2003
Con
tinu
ous
wat
erle
vel:
CH
V(5
min
utes
):3
Nov
embe
r–24
Nov
embe
r20
06;
CH
V(1
min
ute)
:19
Nov
embe
r–19
Dec
embe
r20
07;
and
CH
V-R
(5m
inut
es):
19D
ecem
ber
2006
–9
Janu
ary
2007
X—
X
Dep
thto
grou
ndw
ater
Gro
undw
ater
wel
ls(0
.02
m×
1m
sam
pled
atde
pth
0.9
m)
CH
Van
dC
HV
-R:
biw
eekl
yJu
ly–
Nov
embe
r20
03;
July
–N
ovem
ber
2004
;m
onth
lyfr
omJu
lyto
Sept
embe
r20
06an
dJu
lyto
Sept
embe
r20
07
XX
X
Pore
wat
ersa
linity
Gro
undw
ater
wel
ls;
sipp
erC
HV
and
CH
V-R
:bi
wee
kly
July
–N
ovem
ber
2003
;Ju
ly–
Nov
embe
r20
04;
mon
thly
from
July
toSe
ptem
ber
2006
and
July
toSe
ptem
ber
2007
XX
X
Soi
lsan
dse
dim
ents
Sedi
men
tel
evat
ion
Rod
Sedi
men
tE
leva
tion
Tabl
es(R
SETs
)C
HV
:fou
rsta
tions
,ins
talle
dJu
ne20
05,m
easu
red
Sept
embe
r20
05,
2006
,an
d20
07C
HV
-R:
two
stat
ions
inst
alle
dSe
ptem
ber
2006
,on
est
atio
nin
stal
led
Oct
ober
2006
,m
easu
red
Oct
ober
2006
and
2007
XX
X
Sedi
men
tac
cret
ion
Sedi
men
tpl
ates
*;m
arke
rho
rizo
ns(t
hree
per
RSE
T)
sam
pled
usin
ga
cryo
geni
cco
rer
(Cah
oon
etal
.19
96)
Sedi
men
tpl
ates
—C
HV
:25
loca
tion
s;m
onth
lyfr
omJu
lyto
Dec
em-
ber
2002
;Ju
lyto
Oct
ober
2003
;Ja
nuar
yto
Nov
embe
r20
04;
annu
ally
July
2005
,20
06an
d20
07M
arke
rho
rizo
ns—
CH
V:
inst
alle
dJu
ne20
05,
mea
sure
dSe
ptem
ber
2006
,200
7C
HV
-R:i
nsta
lled
Oct
ober
2006
;mea
-su
red
Oct
ober
2007
XX
X
Sedi
men
tch
arac
teri
stic
s(b
ulk
dens
ity,
orga
nic
mat
ter
cont
ent,
sedi
men
tty
pe)
Sedi
men
tco
res
(soi
lsa
mpl
es)
pair
edsa
mpl
es:
(30
mL
syri
nge
wit
hba
secu
tan
d5
×15
–cm
core
)
CH
V:
25pa
ired
sam
ples
,Ju
ly20
02;
23pa
ired
sam
ples
,O
ctob
er20
06C
HV
-R:
19pa
ired
sam
ples
,O
ctob
er20
06
XX
—
4 Restoration Ecology

Marsh Response to Culvert Expansion
Tab
le1.
Con
tinue
d.
Pos
t
Cat
egor
yP
aram
eter
sSa
mpl
ing
Met
hod
Ann
ual
Sam
plin
gF
requ
ency
Pre
Yr
1Y
r2
Veg
etat
ion
Com
posi
tion
Abu
ndan
ceH
eigh
tPo
int
inte
rcep
tm
etho
d(1
-m2
plot
s)C
HV
:12
9pl
ots,
annu
ally
Aug
ust
2002
,A
ugus
t20
04,
Aug
ust
2006
,A
ugus
t20
07C
HV
-R:
27pl
ots,
annu
ally
Aug
ust
2003
,A
ugus
t20
06,
Aug
ust
2007
XX
X
Nek
ton
Com
posi
tion
Spec
ies
rich
ness
Den
sity
Len
gth
Min
now
trap
sin
pann
es,
tidal
cree
ks,
and
mai
nch
anne
l(s
mal
lfis
h);
beac
hse
ine
(30
m×
1m
;6
mm
mes
hsi
ze)
onm
arsh
surf
ace
(all
size
s)
All
site
s:sp
ring
tide
.Fou
rm
inno
wtr
aps
and
thre
epu
lls
wit
hbe
ach
sein
epe
rsa
mpl
ing
date
CH
V:
18O
ctob
er20
05;
17A
ugus
t20
06,
8Se
ptem
ber
2006
,6O
ctob
er20
06;2
007
and
CH
V-
R:
19O
ctob
er20
05;
11Se
ptem
ber
2006
,7
Oct
ober
2006
;20
07
XX
X
Inve
rteb
rate
sL
arva
lm
osqu
ito(a
bund
ance
)Si
xdi
psa
mpl
espe
rpa
nne
(dip
per)
CH
V:
10pa
nnes
;m
onth
lyfr
omJu
neto
Sept
em-
ber
2004
;m
onth
lyfr
omJu
lyto
Sept
embe
r20
05;
6Ju
ly20
06,
20Ju
ly20
06,
14A
ugus
t20
06;
mon
thly
from
June
toSe
ptem
ber
2007
CH
V-R
:m
onth
lyfr
omJu
neto
Sept
embe
r20
04;
mon
thly
from
July
toSe
ptem
ber
2005
;6
July
2006
,20
July
2006
,14
Aug
ust
2006
;m
onth
lyfr
omJu
neto
Sept
embe
r20
07
XX
X
Restoration Ecology 5

Marsh Response to Culvert Expansion
parameters, data collection methods, and sampling frequencyare described in Table 1.
Sampling was conducted at all sites using transects estab-lished in a non-biased, systematic sampling design tied intosurveyed benchmarks. Twenty-six were established at CHV(Fig. 2) and eight at CHV-R. Data collection was conductedat sampling stations established at equal intervals along eachtransect, and surveyed with the Total Station.
Hydrology
A digital elevation model (DEM) was produced for eachsite using a 2004 1:10,000 aerial photograph, and elevationsurvey data collected using a combination of differentialglobal position system (DGPS), Leica TCR-705 Total Station,and 2007 LiDAR data (Fig. 2). All topographic data werereferenced to the Canadian Geodetic Vertical Datum 1928(CGVD28). The hydroperiod and summary hypsometric curvefor each site were modeled using the tidal signal and DEM forthe marsh surface (Table 1).
Depth to groundwater was sampled using seven ground-water wells installed adjacent to vegetation stations at CHV(Fig. 2), and six at CHV-R. A single measurement (centime-ters below marsh surface) was taken at each station during lowtide (Table 1).
Soils and Sediments
The location and frequency of pore water salinity samplingat all sites were matched with depth to groundwater sam-pling (Fig. 2). Salinity was measured at shallow (0.15 m)and deep (0.45 m) wells using a handheld refractometer(2003–2004). In 2005, the salinity well method was replacedby the use of a soil probe (sipper) (Roman et al. 2001). Due tothe high sediment concentration of water samples collected bythe sipper, samples were bottled and returned to the lab andallowed time for the sediment to settle out before a refrac-tometer reading was taken.
Marsh surface elevation change (+/ − 0.001 m) was mea-sured once per year using four rod sediment elevation tables(RSETs; Cahoon et al. 2002) at CHV and three at CHV-R. Allmeasurements were taken at low tide and at the same time inthe growing season (September) to minimize the influence ofevapotranspiration (Paquette et al. 2004).
Vertical accretion at all sites was measured using feldsparmarker horizons and a cryogenic corer as described by Cahoonet al. (1996). Three 0.5-m2 marker horizons per RSET stationwere established at each site (Table 1). In 2002, twenty-five10 × 20–cm aluminum plates were inserted 10 cm below themarsh at CHV (Fig. 2) according to the design, installation,and sampling method described in van Proosdij et al. (2006a).
Sediment cores (bulk density, organic matter [OM], andgrain size) were collected using a stratified random samplingprocedure paired with vegetation sampling plots (Fig. 2;Table 1). OM content was determined by loss on ignition(LOI), while grain size was analyzed using a Coulter LS200.
Vegetation
The marsh vegetation community was surveyed using perma-nent 1-m2 plots. A detailed vegetation survey (species com-position, percent cover, and height) was conducted at CHVin 2002 on the 92 plots on the first eight transects (Fig. 2).This method was replicated in 2004 on the remaining 27 plotsat CHV as well as on the 27 at CHV-R. Plots sampled in2002 were combined with plots sampled in 2004 to assess thepre-restoration condition. Post-restoration species compositionand abundance were determined within each plot using a pointintercept method (abundance = frequency of contact of eachspecies with 25 points within plot) (Roman et al. 2001).
Mean plot species richness and cover of bare ground werecompared between sites and years using repeated measuresanalysis of variance (ANOVA). Differences in vegetationcomposition were assessed using nonparametric multivariateANOVA (NPMANOVA), with species abundances as depen-dent variables (including only species occurring in five or moreplots; 100 permutations) (Anderson 2001).
Nekton
A beach seine and a set of four minnow traps were usedto sample nekton on the marsh surface, pannes, and tidalcreeks during spring tide events. Sampling with the beach seinewas conducted according to the methodology developed andused by the Community Aquatic Monitoring Project (CAMP)(Weldon et al. 2005). Smaller species in the salt pannes andtidal creeks were sampled using the minnow traps. The trapswere deployed before high tide and retrieved once the tidelevel had dropped (approximately 3.5 hours). Nekton densitymeasures were limited to samples of known area (i.e., minnowtrap excluded) (Konisky et al. 2006).
All captured specimens were held in buckets, identified tospecies level, counted (to a maximum of 300 per species), andmeasured for length (15 individuals per species).
ResultsHydrology
Based on the 2007 tidal signal data, LiDAR, and on-sitemeasurements including observed tree die-off, the total areaof recovering marsh at CHV has increased approximately 8-fold from 5 to 43 ha (Fig. 3). A comparison of the upstreamtidal signal to the downstream tidal signal (Table 1) indicatesthat the new culvert has eliminated the tidal restriction on alltides under 7.1 m (CGVD28) (85% of tides).
There was no significant difference in depth to watertable between pre- and post-measures at CHV (t test, t =1.20, df = 40, p = 0.235); however, depth to water table atCHV-R was significantly deeper than observed at CHV for allyears (t test, t = −3.16, df = 52, p = 0.003). The detectabledifference was therefore spatial in nature and there was notemporal change. Both sites showed strong seasonal trends,with the greatest depths to water table recorded in July.
6 Restoration Ecology

Marsh Response to Culvert Expansion
Figure 3. Hypsometric curves pre- and post-restoration at CHV and baseconditions at CHV-R. Original culvert restricted tides to less than 6 mabove geodetic datum, new culvert permits tides up to 7.1 m.
Soils and Sediments
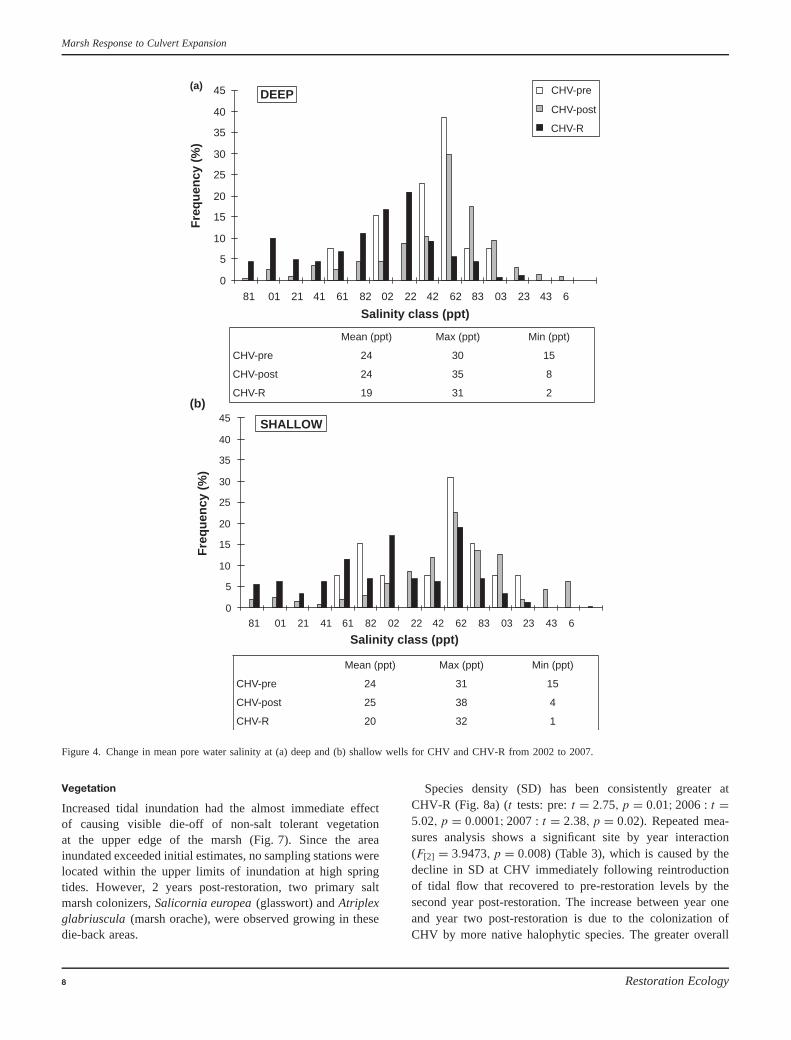
Average soil salinity ranged between 1 and 31 ppt at CHV-Rand 0–36 ppt at CHV and were generally lower in the summerand increasing in the fall (Fig. 4). Mean pore water salin-ity levels at CHV post-restoration were significantly higher (ttest, t = −6.78, df = 72, p = 2.75E−09) than pre-restorationlevels. The largest changes in salinity were observed at thehigh marsh stations and those further upstream. In addition,mean pore water salinities at CHV were found to be signif-icantly higher than those of CHV-R (t test, t = 14.15, df =77, p = 4.00E−23) in the same year. Pre-restoration, at CHV,no significant differences were detected between shallow anddeep wells (t test, t = −0.388, df = 134, p = 0.698). Whenthe shallow wells at CHV and CHV-R were compared, nosignificant difference was observed (t test, p < 0.174); how-ever, there was a significant difference (t test, t = 11.02, df =45, p = 2.23E−14) measured between the deep wells at bothsites (CHV > CHV-R). A significant difference was detectedpost-restoration between the shallow and deep samples at CHV(t test, t = 2.11, df = 26, p = 0.041).
A trend of decreasing bulk density and increasing organicmatter content with increasing geodetic elevation and distancefrom the main creek was observed both pre- and post-restoration at CHV (Fig. 5a & 5b). One year post-restorationthere was a minor increase in bulk density across the marsh(up to CHV-R levels) and a decrease in organic matter whencompared to pre-restoration conditions. Pre-restoration, CHVrecorded an increase in mean grain size with increasingelevation and distance from the main tidal creek (Fig. 5c).Post-restoration, mean grain size decreased with increasingelevation, but exhibited no discernable pattern at CHV-R.
The mean net change in surface elevation at CHV washighly variable both at a station between years and betweendifferent sites across the marsh within the same year (Table 2).After the first year, all of the sediment plates installed within
the first 0.5 m of the tidal creek were lost due to erosion,likely due to ice scour. There was no significant differencebetween pre- and post-sediment accretion rates using plates(paired t test: t = 1.2108, df = 12, p = 0.249). The mean pre-restoration accretion rate was 0.7 ± 0.5 cm/year comparedwith a 0.4 ± 0.5 cm/year rate from 2005 to 2007 (Table 2).
Table 2. Mean rate of change in marsh surface elevation measured at sed-iment plates at CHV pre- (2002–2005) and post-restoration (2005–2007).
Mean Rate of Change (cm/yr± SD)
Station Elevation (m) Pre Post
L1S2 4.4 0.7 ± 0.1 NAL1S6 4.8 0.3 ± 0.3 10.9 ± 4.9L1S8 5.1 0.4 ± 0.2 0.5 ± 0.3L2S6 6.2 1.1 ± 0.6 NAL3S2 4.2 0.7 ± 0.2 1.2 ± 0.5L3S4 5.2 1.3 ± 0.3 1.0 ± 0.9L5S2 4.6 0.7 ± 0.6 0.4 ± 0.4L5S4 5.6 2.0 ± 0.4 –1.3 ± 1.5L5S6 6.0 1.2 ± 0.2 0.3 ± 1.1L5S2(S) 6.1 0.5 ± 0.2 0.2 ± 0.1L7S2 5.6 0.4 ± 0.2 –0.4 ± 0.1L7S5 6.4 0.2 ± 0.3 0.2 ± 0.2L7S8 6.2 0.1 ± 0.2 NAL7S14 7.1 0.6 ± 0.2 1.1 ± 0.5L8S3 4.8 0.7 ± 0.0 0.4 ± 0.3L8S5 5.1 0.7 ± 0.2 0.0 ± 0.5Overall mean 0.7 ± 0.5 0.4 ± 0.7
All elevations relative to CGVD28 datum. NA = plate was not relocated post-restoration. Only stations that survived at least 1 year were included in the analysis.See Figure 2 for location of stations.
Since the RSET stations were not installed until 2005,no RSET data are available pre-restoration. One year post-restoration, the change in surface elevation was highest atRSET-02 and RSET-03, both with a net rate of change of2.2 cm/year (Fig. 6). The lowest recorded change in surfaceelevation was in the sedge community at RSET-04 with 0.6 ±0.1 cm/year (± SE). Both marker horizons and buried plates(within a 30 m radius of RSETs) were within the same range ofaccretion values (Fig. 6). Subtracting the marker horizon datafrom the RSET measurement leaves 0.35 cm to subsurfaceprocesses. The lowest value (0.63 cm/year) was at RSET-04indicating minimal subsurface processes at work. RSET-02had the highest change in surface elevation attributable tosubsurface processes (1.23 cm/year), which could be due topore water flux given its proximity to the tidal creek (Fig. 6).
Two years post-restoration, the 2005–2006 elevation trendswere repeated with slightly lower values (Fig. 5). There wasno significant difference between years (2006 vs. 2007) atCHV (t test: t = 1.6646, df = 3, p = 0.1946). However, sta-tistically significant differences in changes in surface elevationwere recorded between CHV (mean ± SE = 1.22 ± 0.08) andCHV-R (mean ± SE = 0.26 ± 0.03) (t test: t = −3.62, df =3.7, p = 0.025) in 2007.
Restoration Ecology 7
Marsh Response to Culvert Expansion
0
5
10
15
20
25
30
35
40
45
81 01 21 41 61 82 02 22 42 62 83 03 23 43 6
0
5
10
15
20
25
30
35
40
45
81 01 21 41 61 82 02 22 42 62 83 03 23 43 6
Mean (ppt) Max (ppt) Min (ppt)
CHV-pre 24 30 15
CHV-post 24 35 8
CHV-R 19 31 2
Mean (ppt) Max (ppt) Min (ppt)
CHV-pre 24 31 15
CHV-post 25 38 4
CHV-R 20 32 1
(a)
(b)
DEEP
SHALLOW
Fre
qu
ency
(%
)
Salinity class (ppt)
CHV-pre
CHV-post
CHV-R
Fre
qu
ency
(%
)
Salinity class (ppt)
Figure 4. Change in mean pore water salinity at (a) deep and (b) shallow wells for CHV and CHV-R from 2002 to 2007.
Vegetation
Increased tidal inundation had the almost immediate effectof causing visible die-off of non-salt tolerant vegetationat the upper edge of the marsh (Fig. 7). Since the areainundated exceeded initial estimates, no sampling stations werelocated within the upper limits of inundation at high springtides. However, 2 years post-restoration, two primary saltmarsh colonizers, Salicornia europea (glasswort) and Atriplexglabriuscula (marsh orache), were observed growing in thesedie-back areas.
Species density (SD) has been consistently greater atCHV-R (Fig. 8a) (t tests: pre: t = 2.75, p = 0.01; 2006 : t =5.02, p = 0.0001; 2007 : t = 2.38, p = 0.02). Repeated mea-sures analysis shows a significant site by year interaction(F[2] = 3.9473, p = 0.008) (Table 3), which is caused by thedecline in SD at CHV immediately following reintroductionof tidal flow that recovered to pre-restoration levels by thesecond year post-restoration. The increase between year oneand year two post-restoration is due to the colonization ofCHV by more native halophytic species. The greater overall
8 Restoration Ecology

Marsh Response to Culvert Expansion
0
10
20
30
40
50
60
70
80
05 0 100 150 200
Distance from main creek (m)
org
anic
mat
ter
con
ten
t (%
)
0.0
0.2
0.4
0.6
0.8
1.0
1.2
1.4
1.6
05 0 100 150 200
Distance from main creek (m)
Bu
lk d
ensi
ty (
g c
m–3
)
CHV-pre
CHV-post
CHV-R
0
20
40
60
80
100
120
140
160
180
05 01 00 150 200
Distance from main creek (m)
mea
n g
rain
siz
e (m
icro
ns)
(a) (b)
(c)
Figure 5. (a) Changes in bulk density, (b) organic matter content, and (b) mean grain size at CHV and CHV-R pre- and post-restoration relative to themain tidal creek.
0.0
0.5
1.0
1.5
2.0
2.5
3.0
RSET-01 (6.5 m) RSET-02 (6.35 m) RSET-03 (6.45 m) RSET-04 (6.66 m)
Mea
n c
han
ge
in s
urf
ace
elev
atio
n (
cm y
r–1)
RSET-Yr1-post
RSET-Yr2-post
marker horizon-mean post
plate-pre
plate-mean post
Figure 6. Mean annual change in surface elevation recorded at RSETs (± SE) and mean sediment accretion based on the marker horizons and sedimentplates (within area of RSETs) for the first 2 years post-restoration at CHV. Elevations expressed relative to CGVD28 datum.
Restoration Ecology 9

Marsh Response to Culvert Expansion
Figure 7. Areas of change in vegetated community, panne expansion, and extent of die-off 2 years post-culvert replacement calculated from 2007LiDAR survey and on-site tide record. LiDAR provided by T. Webster of the Advanced Geomatics Research Group at COGS, 2007. Elevationsexpressed relative to CGVD28 vertical datum.
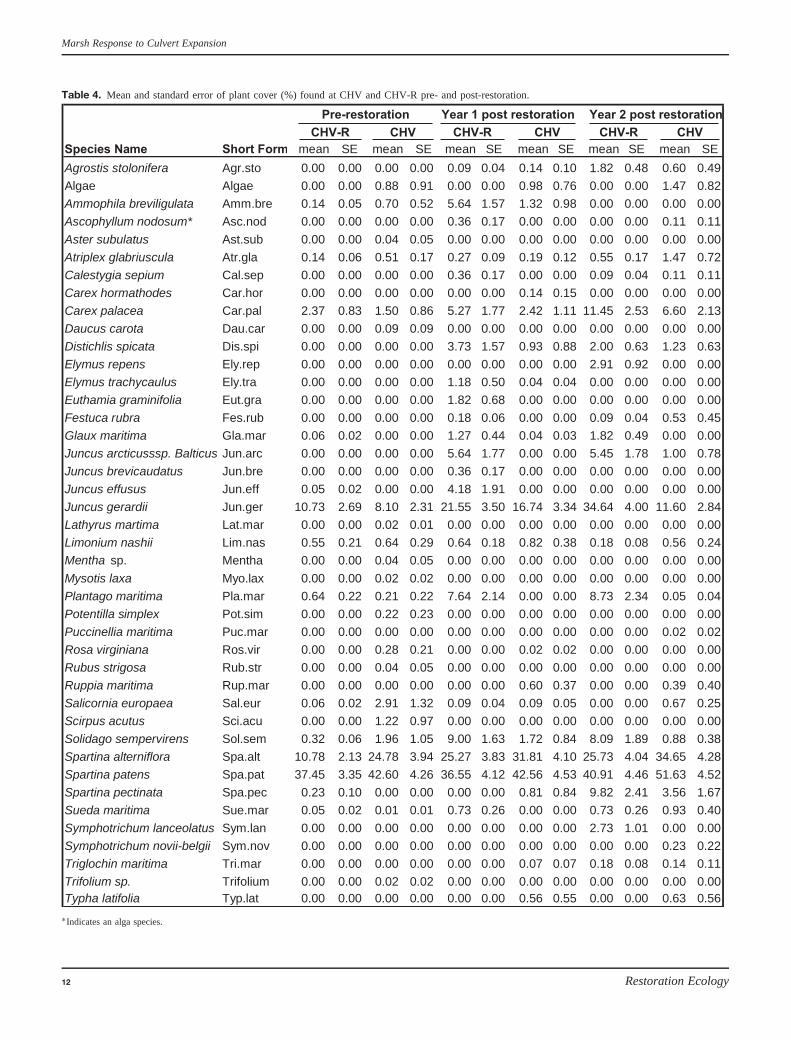
SD at CHV-R can be attributed to a number of uncommonspecies such as Solidago sempervirens (seaside goldenrod) andPlantago maritima (seaside plantain) that are more frequentat CHV-R. These are typically found in the upper marsh/saltmeadow areas where the dominants are Carex palacea (saltmarsh sedge) and Spartina pectinata (prairie cordgrass). Thesespecies do occur at CHV but less frequently; thus, they are lesslikely to contribute to greater average SD. Overall, speciesrichness (SR) (total number of species encountered in plots)was usually greater at CHV than CHV-R, but not consistentamong years (pre: 24 vs. 18, year 1 post: 20 vs. 22, and year 2post: 24 vs. 19). The amount of unvegetated area (bare ground)has been dynamic at both sites, with the formation of pannesbeing one of the main processes responsible for this. In bothyears post-restoration, there was a greater area of bare groundat CHV (site by year interaction: F[2] = 3.6579, p = 0.013)(Table 3; Fig. 8b).
The two sites had similar plant communities pre-restorationand year one post (NPMANOVA for site differences: pre-restoration F[1] = 1.592, p = 0.19; year 1 post F1 = 0.939,
Table 3. Repeated measures ANOVA for (a) species density and (b)unvegetated area.
(a)
Factor df SS MS F P
Site 1 148.97 148.97 24.846 <0.00001Residuals 128 767.46 6.00Year 3 15.12 5.04 4.3134 0.005Site × year 3 13.83 4.61 3.9473 0.008Residuals 384 448.55 1.17
(b)
Factor df SS MS F P
Site 1 123.5 123.5 0.5636 0.45Residuals 128 28046.6 219.1Year 3 1817 606 4.7095 0.003Site × year 3 1411 470 3.6579 0.013Residuals 384 49376 129
df = degrees of freedom; SS = sum of squares; MS = mean square.
10 Restoration Ecology

Marsh Response to Culvert Expansion
Pre- Yr 1 Post- Yr 2 Post-
Year
02
46
810
12
Pre- Yr 1 Post- Yr 2 Post-
CHVCHV-R
Year
01
23
4
CHVCHV-R
05
Mea
n #
sp
ecie
s p
er m
2M
ean
per
cen
t co
ver
bar
e g
rou
nd
(a)
(b)
Figure 8. Comparison of (a) mean species density (number ofspecies/m2) and (b) mean percent bare ground between CHV andCHV-R pre- and post-restoration.
p = 0.37) but differed in year two post (year 2 post F[1] =2.862, p = 0.03). These differences are attributable to greaterabundances of Spartina alterniflora (smooth or salt marshcordgrass) and Spartina patens (salt meadow cordgrass) atCHV in year two post (Table 4). Plant communities alsochanged more over time in CHV compared with CHV-R(Table 4). In general, upland and dune vegetation at CHVbecame upper marsh/salt meadow vegetation characterized byC. palacea and S. pectinata. The change in vegetation compo-sition at CHV also reflected the increasing dominance of saltmarsh vegetation (S. alterniflora and S. patens) (Table 4).
Nekton
Post-restoration, five species of fish were caught, which istwo species less than was encountered prior to restoration
(Table 5). It is likely that the presence of Fundulus diaphanousduring pre-restoration and its absence during post-restorationsampling was due to misidentification of individuals dur-ing the initial year of survey work (later identified as Fun-dulus heteroclitus [mummichog]). Fundulus heteroclitus andMenidia menidia (Atlantic silverside) were consistently thedominant species at both sites during all sampling periods.However, at CHV, F. heteroclitus represented the largest per-centage of fish (56–95%) caught, whereas at the referencesite, M. menidia dominated (73–94%) (Table 5). There was amarked increase in the density of fish between pre- and post-restoration conditions, particularly within the pannes at CHV(Table 5).
Discussion
Culvert replacement resulted in an 8-fold increase in the areaflooded upstream of the causeway, significantly increasingthe area available for fish habitat and salt marsh ecosystemdevelopment thereby fulfilling the mandate of the HADDsproject. The increased hydrology, and its interaction withexisting marsh morphology, re-established conditions andprocesses critical for self-maintenance of tidal marshes andfish habitat. This was reflected by rapid changes in veg-etation community composition and development of newpannes.
As with most salt marsh restoration projects (e.g., Onaindiaet al. 2001; Hinkle & Mitsch 2005; Wolters et al. 2005a), theprimary variables driving the ecosystem response are hydrol-ogy and surface topography or elevation. Elevation relativeto the tidal frame has been known to be a primary determi-nant of vegetation colonization and succession (e.g., Boumanset al. 2002; Crooks et al. 2002). The restoration of a morenatural hydrological regime to CHV resulted in changes inthe biological community. The most visible indicator of thischange continues to be the die-off of freshwater and terres-trial vegetation (trees) along the upland edge of much of themarsh and recolonization by early successional salt marshspecies. In addition, there was a marked decline in the numberof freshwater and upland vegetation species and an increasein the abundance of halophytic vegetation (Spartina alterni-flora, Spartina patens, and Juncus gerardii ). While disper-sal limitations and/or competition with pre-existing vegetationcould still affect the salt marsh vegetation expansion at CHV,this study shows that vegetation recovery can be rapid whensources for recolonization are nearby and shifts in abiotic con-ditions result in mortality of terrestrial vegetation. The ratesof vegetation change within the first 2 years were rapid andcomparable to other culvert replacement projects (e.g., Burdicket al. 1997; Konisky et al. 2006).
The pre-restoration geomorphology of the site also con-tributed to the patterns of vegetation change and created con-ditions favorable for growth of halophytic vegetation and fishhabitat. For example, a new panne developed in an old filled-inoxbow. No new tidal creek channels were incised as have beenrecorded in other systems (Williams & Orr 2002; D’Alpaos
Restoration Ecology 11
Marsh Response to Culvert Expansion
Table 4. Mean and standard error of plant cover (%) found at CHV and CHV-R pre- and post-restoration.
Pre-restoration
Species Name Short Form
Agrostis stolonifera Agr.sto 0.00 0.00 0.00 0.00 0.09 0.04 0.14 0.10 1.82 0.48 0.60 0.49
Algae Algae 0.00 0.00 0.88 0.91 0.00 0.00 0.98 0.76 0.00 0.00 1.47 0.82
Ammophila breviligulata Amm.bre 0.14 0.05 0.70 0.52 5.64 1.57 1.32 0.98 0.00 0.00 0.00 0.00
Ascophyllum nodosum* Asc.nod 0.00 0.00 0.00 0.00 0.36 0.17 0.00 0.00 0.00 0.00 0.11 0.11
Aster subulatus Ast.sub 0.00 0.00 0.04 0.05 0.00 0.00 0.00 0.00 0.00 0.00 0.00 0.00
Atriplex glabriuscula Atr.gla 0.14 0.06 0.51 0.17 0.27 0.09 0.19 0.12 0.55 0.17 1.47 0.72
Calestygia sepium Cal.sep 0.00 0.00 0.00 0.00 0.36 0.17 0.00 0.00 0.09 0.04 0.11 0.11
Carex hormathodes Car.hor 0.00 0.00 0.00 0.00 0.00 0.00 0.14 0.15 0.00 0.00 0.00 0.00
Carex palacea Car.pal 2.37 0.83 1.50 0.86 5.27 1.77 2.42 1.11 11.45 2.53 6.60 2.13
Daucus carota Dau.car 0.00 0.00 0.09 0.09 0.00 0.00 0.00 0.00 0.00 0.00 0.00 0.00
Distichlis spicata Dis.spi 0.00 0.00 0.00 0.00 3.73 1.57 0.93 0.88 2.00 0.63 1.23 0.63
Elymus repens Ely.rep 0.00 0.00 0.00 0.00 0.00 0.00 0.00 0.00 2.91 0.92 0.00 0.00
Elymus trachycaulus Ely.tra 0.00 0.00 0.00 0.00 1.18 0.50 0.04 0.04 0.00 0.00 0.00 0.00
Euthamia graminifolia Eut.gra 0.00 0.00 0.00 0.00 1.82 0.68 0.00 0.00 0.00 0.00 0.00 0.00
Festuca rubra Fes.rub 0.00 0.00 0.00 0.00 0.18 0.06 0.00 0.00 0.09 0.04 0.53 0.45
Glaux maritima Gla.mar 0.06 0.02 0.00 0.00 1.27 0.44 0.04 0.03 1.82 0.49 0.00 0.00
Juncus arcticusssp. Balticus Jun.arc 0.00 0.00 0.00 0.00 5.64 1.77 0.00 0.00 5.45 1.78 1.00 0.78
Juncus brevicaudatus Jun.bre 0.00 0.00 0.00 0.00 0.36 0.17 0.00 0.00 0.00 0.00 0.00 0.00
Juncus effusus Jun.eff 0.05 0.02 0.00 0.00 4.18 1.91 0.00 0.00 0.00 0.00 0.00 0.00
Juncus gerardii Jun.ger 10.73 2.69 8.10 2.31 21.55 3.50 16.74 3.34 34.64 4.00 11.60 2.84
Lathyrus martima Lat.mar 0.00 0.00 0.02 0.01 0.00 0.00 0.00 0.00 0.00 0.00 0.00 0.00
Limonium nashii Lim.nas 0.55 0.21 0.64 0.29 0.64 0.18 0.82 0.38 0.18 0.08 0.56 0.24
Mentha sp. Mentha 0.00 0.00 0.04 0.05 0.00 0.00 0.00 0.00 0.00 0.00 0.00 0.00
Mysotis laxa Myo.lax 0.00 0.00 0.02 0.02 0.00 0.00 0.00 0.00 0.00 0.00 0.00 0.00
Plantago maritima Pla.mar 0.64 0.22 0.21 0.22 7.64 2.14 0.00 0.00 8.73 2.34 0.05 0.04
Potentilla simplex Pot.sim 0.00 0.00 0.22 0.23 0.00 0.00 0.00 0.00 0.00 0.00 0.00 0.00
Puccinellia maritima Puc.mar 0.00 0.00 0.00 0.00 0.00 0.00 0.00 0.00 0.00 0.00 0.02 0.02
Rosa virginiana Ros.vir 0.00 0.00 0.28 0.21 0.00 0.00 0.02 0.02 0.00 0.00 0.00 0.00
Rubus strigosa Rub.str 0.00 0.00 0.04 0.05 0.00 0.00 0.00 0.00 0.00 0.00 0.00 0.00
Ruppia maritima Rup.mar 0.00 0.00 0.00 0.00 0.00 0.00 0.60 0.37 0.00 0.00 0.39 0.40
Salicornia europaea Sal.eur 0.06 0.02 2.91 1.32 0.09 0.04 0.09 0.05 0.00 0.00 0.67 0.25
Scirpus acutus Sci.acu 0.00 0.00 1.22 0.97 0.00 0.00 0.00 0.00 0.00 0.00 0.00 0.00
Solidago sempervirens Sol.sem 0.32 0.06 1.96 1.05 9.00 1.63 1.72 0.84 8.09 1.89 0.88 0.38
Spartina alterniflora Spa.alt 10.78 2.13 24.78 3.94 25.27 3.83 31.81 4.10 25.73 4.04 34.65 4.28
Spartina patens Spa.pat 37.45 3.35 42.60 4.26 36.55 4.12 42.56 4.53 40.91 4.46 51.63 4.52
Spartina pectinata Spa.pec 0.23 0.10 0.00 0.00 0.00 0.00 0.81 0.84 9.82 2.41 3.56 1.67
Sueda maritima Sue.mar 0.05 0.02 0.01 0.01 0.73 0.26 0.00 0.00 0.73 0.26 0.93 0.40
Symphotrichum lanceolatus Sym.lan 0.00 0.00 0.00 0.00 0.00 0.00 0.00 0.00 2.73 1.01 0.00 0.00
Symphotrichum novii-belgii Sym.nov 0.00 0.00 0.00 0.00 0.00 0.00 0.00 0.00 0.00 0.00 0.23 0.22
Triglochin maritima Tri.mar 0.00 0.00 0.00 0.00 0.00 0.00 0.07 0.07 0.18 0.08 0.14 0.11
Trifolium sp. Trifolium 0.00 0.00 0.02 0.02 0.00 0.00 0.00 0.00 0.00 0.00 0.00 0.00
Typha latifolia Typ.lat 0.00 0.00 0.00 0.00 0.00 0.00 0.56 0.55 0.00 0.00 0.63 0.56
CHV-R
mean SE mean SE
CHV-R CHV
mean SE mean SE
CHV-R CHV
mean SE mean SE
CHV
Year 1 post restoration Year 2 post restoration
∗Indicates an alga species.
12 Restoration Ecology

Marsh Response to Culvert Expansion
Table 5. (a) Percent composition of total catch of fish species for CHV and CHV-R during pre- and post-restoration sampling programs, all samplingmethods and (b) mean and maximum density of fish per beach seine pull.
(a)Pre-restoration Post-restoration Year One Post-restoration Year Two
Common Name Species Name CHV CHV-R CHV CHV-R CHV CHV-R
Atlantic silversidea Menidia menidia 10.0 74.1 6.5 94.0 4.6 72.7Banded Killifisha Fundulus heteroclitus 7.1 — — — — —Three-spine sticklebacka Gasterosteus aculeatus 11.4 0.8 1.4 — — —Nine-spine sticklebacka,b Pungitius pungitius — — 0.5 — 0.4 —Mummichoga Fundulus heteroclitus 55.7 24.9 91.5 6.0 94.9 26.6Tomcoda,b Microgadus tomcod 2.9 — — — — —American eela,b Anguilla rostrata 10.0 0.3 0.2 — 0.1 —Striped Bassc,b Morone saxatilis — — — — — —Brook trouta Salvelinus fontinalis 2.9 — — — — 0.8Total 100 100 100 100 100 100(b)Mean # fish per m2 per pull 0.02 0.83 0.07 0.11 1.28 0.11Maximum # fish per m2 per pull 0.03 1.48 0.19 0.18 3.56 0.18
aResident species.bMigratory species.cObserved being caught at mouth of system on the flood tide by local recreational fishermen (hook and line).
et al. 2007), likely due to the relatively elevated marsh plat-form and existing salt marsh vegetation. Rather, the returningfloodwaters reactivated the relict agricultural ditches whichprovided a conduit to the high marsh. Because this area wasalready waterlogged, it is not surprising that a large pannedeveloped and higher salinities were recorded as tidal watersevaporated. In addition, the increased tidal volume lead tomore flooding and created a hybrid network of channels incor-porating the ditches and natural tidal creeks. This system willlikely develop into the “superimposed” network type describedby Allen (2000).
The increased tidal channel density increased the proximityof segments of the marsh surface to a tidal channel (Lathropet al. 2000). Plant distribution is often related to tidal creeknetworks (e.g., Sanderson et al. 2000, 2001) and increaseddiversity has been recorded at other sites if drainage structuresare constructed and maintained (Wolters et al. 2005a). AtCHV, after an initial decline in species density immediatelyfollowing the reintroduction of tidal flow (likely due to theloss of upland species), colonization by native halophyticvegetation was rapid adjacent to the channel network and atthe upland boundary. With the reintroduction of tidal flow, theupland or freshwater plants were displaced and limited by theincreased salinity in these regions as found elsewhere (Crainet al. 2004).
Increasing the cross-sectional area of the culvert facilitatedmore effective tidal exchange, diminishing waterlogging insome areas of the marsh which is known to reduce vegetativecolonization (Haltiner et al. 1997; Crooks et al. 2002; Dausseet al. 2008), while inundating other areas leading to panneformation. Success was also dependent on the ability of themarsh surface to accrete vertically within the tidal frame(e.g., French 2006; Byers & Chmura 2007). Fundy marshestypically have high rates of sediment accretion (e.g., Chmura
et al. 2001; Ollerhead et al. 2003; van Proosdij et al. 2006b).Both CHV (pre- and post-restoration) and CHV-R recordedaccretion rates within the upper range of accretion ratesmeasured in the region. In addition, rates are still greater thancalculated rates of sea level rise for the region (0.55 cm/year;Shaw et al. 1998) and the presence of the causeway willprovide protection from the impact of storm waves. However,the rates recorded at CHV in both post-restoration years werethree times that of the reference site. We do not know ifthis difference is due to external variables such as suspendedsediment availability or position of the RSET stations withinthe marsh, which can significantly influence accretion rates(van Proosdij et al. 2006b). The increased tidal exchangemay also influence the amount of sediment deposition on themarsh surface by increasing the inundation frequency (e.g.,Cahoon & Reed 1995; French 2006; Byers & Chmura 2007).This increase was not observed at CHV post-restoration andalthough not statistically significant, there was a mean decreaseof 0.3 cm/year. There was considerable spatial variability insediment accretion across the marsh surface in all years whichis consistent with other studies (e.g., Allen 1992; van Proosdijet al. 2006a, 2006b).
The main way to assess success of restoration is by deter-mining similarity of vegetation cover and biomass betweenreference and restored marshes (e.g., Neckles et al. 2002; War-ren et al. 2002; Mitsch & Jorgensen 2004). Ideally, the refer-ence marsh should be similar in size, geometry, potential tidalrange, landscape position, adjacent land use, and water qual-ity (Neckles et al. 2002). However, the availability of undikedmarshes within the upper Bay is limited, reducing the numberof potential reference marshes. CHV-R marsh is comparableto CHV in most senses; however, it is smaller in size, thereforehas a smaller range of elevations. Thus, the two sites are posi-tioned differently within the tidal frame. The mean elevation
Restoration Ecology 13

Marsh Response to Culvert Expansion
relative to CGVD28 datum of the CHV marsh platform is 5.49m (approximately 0.28 m less than mean high water [MHW])whereas CHV-R is 5.77 (= MHW). There is twice the rangeof elevation (2.4–7.4 m) at CHV versus CHV-R (4.2–6.6 m).This larger surface area and shallower upland slope will influ-ence the recolonization of the site and potentially the SR. Onceappropriate species colonize the study site, we might expectsignificant differences in overall species abundances (Onain-dia et al. 2001; Garbutt et al. 2006; Dausse et al. 2008): here adifference was detected just 2 years post-restoration. CHV hasa greater abundance of low marsh vegetation, characterized byS. alterniflora, whereas CHV-R has more high marsh or saltmeadow vegetation with Carex palacea and J. gerardii (blackgrass). The large vegetation growth range of S. alterniflora(Byers & Chmura 2007) will allow it to take advantage ofthe wide elevation range available at CHV. Furthermore, thissuggests that simple indicators such as SD may not be usefulindicators of restoration success, when restoration and refer-ence sites have environmental differences that select for plantcommunities with inherently different species pool sizes. Inthis case, low marsh communities are typically species poor,so CHV can be expected to have lower SD than CHV-R evenif the restoration of native salt marsh vegetation is success-ful and even though CHV has greater total species richness.Furthermore, certain species such as Plantago maritima havebeen found to thrive in the upper mid marsh which is regu-larly disturbed by ice (Chmura et al. 1997). Since CHV hasbeen isolated from the large ice blocks from the Bay whichtypically blanket undiked exposed marshes in the region dueto the presence of the causeway, the relative lack of Plantagomay be associated with lack of ice disturbance. Explicit mod-eling of the relationships between the biota and environmentalconditions may increase the utility of the single-reference siteapproach.
Faunal response is dependent on access to the shallowintertidal marsh surface and intertidal and subtidal creeks(Able et al. 2008). The response of nekton can be rapidwith an increase in density (Roman et al. 2002; Able et al.2008); however, SR can decrease (Raposa 2002). At CHV,there was a marked increase in the relative abundance of fishpre- and post-restoration, mostly due to the increased pannesize and creek network. This increased density was morepronounced in year two, which is consistent with findingsof other culvert replacement projects in the Gulf of Maine(Konisky et al. 2006). Consistently, more fish were caught atCHV compared to the reference site which may be attributedto the behavior of the dominant species. At CHV, Fundulusheteroclitus, a resident fish, dominated whereas at the referencesite Menidia menidia, a migrant species, occurred with thehighest frequency.
The monitoring program developed for this restorationproject was based largely on the GPAC protocol. The programexpanded on the protocols’ core indicators to include inver-tebrates (not reported in this paper) and winter conditions,modified a number of data collection methods (point inter-cept method for vegetation; sipper for interstitial pore watersalinity; capped/sealed wells and a breathing tube for depth
to water table; and beach seine and minnow traps for nek-ton), and increased the frequency of sampling events (nekton).Most of these modifications and additions were necessary inorder to accommodate the hydrological and climatic condi-tions experienced in the Bay of Fundy, issues of scale, andprogramming requirements. This modified monitoring pro-gram remains consistent enough with the GPAC protocolto facilitate comparisons with GPAC monitored sites, whilebeing more responsive to Bay of Fundy and other local site-specific conditions. Our results can provide insight into theecological interrelationships between biotic and abiotic vari-ables and contribute to the development of a set of referencemarsh conditions for future restoration projects in the Bayof Fundy.
Implications for Practice
• The availability of high-resolution elevation data suchas LiDAR early in the restoration process can signifi-cantly assist with effective placement of sampling sta-tions, particularly the RSETs and accurate tidal floodmodeling.
• Monitoring programs need to consider the spatial vari-ability of sedimentary processes such as sediment accre-tion within their sampling strategy.
• Simple indicators such as SR may not be useful indi-cators of restoration success, when restoration and ref-erence sites occupy different positions within the tidalframe or significant different ranges in elevation relativeto MHW.
• Culvert replacement projects can be an effective restora-tion technique in macro-tidal environments if the newculverts are sufficiently large to allow the majority ofspring tides to pass freely.
Acknowledgments
This restoration project would not have been possible with-out the financial and logistical assistance of the NSTIR, DFO,Ducks Unlimited Canada, local landowners/community, andthe Ecology Action Center. The Mount Allison Coastal Wet-lands Institute, Envirosphere Consultants, and R. Koniskyprovided assistance with laboratory analyses. G. Chmura isappreciated for assisting with RSET installations. G. Baker(Maritime Provinces Spatial Analysis Research Unit) providedinvaluable assistance with surveying and GIS analysis. T. Web-ster (COGS) generously provided the 2007 LiDAR survey.The Community Based Monitoring Network at Saint Mary’sUniversity is thanked for loaning water quality measuringequipment. Field data collection would not have been pos-sible without the assistance of E. O’Toole, A. Silver, and S.Townsend. Between 2002 and 2005, research was supportedfinancially by a wide range of sources (Bowron & Chiasson2006). Since 2005 funding has been provided by NSTIR andDFO-SCH.
14 Restoration Ecology

Marsh Response to Culvert Expansion
LITERATURE CITED
Able, K.W., T. M. Grothues, S. M. Hagan, M. E. Kimball, D. M. Nemerson,and G. L. Taghon. 2008. Long term response of fishes and other faunato restoration of former salt hay farms: multiple measures of restorationsuccess. Reviews in Fish Biology and Fisheries 18:65–97.
Allen, J. R. L. 1992. Large-scale textural patterns and sedimentary processeson salt marshes in the Severn Estuary, southwest Britain. SedimentaryGeology 81:299–318.
Allen, J. R. L. 2000. Morphodynamics of holocene salt marshes: a reviewsketch from the Atlantic and Southern North Sea coasts of Europe.Quaternary Science Reviews 19:1155–1231.
Amos, C. L., and K. T. Tee. 1989. Suspended sediment transport processesin Cumberland Basin, Bay of Fundy. Journal of Geophysical Research94:14407–14417.
Anderson, M. J. 2001. A new method for non-parametric multivariate analysisof variance. Austral Ecology 26:32–46.
Boumans, R. M. J, D. M. Burdick, and M. Dionne. 2002. Modeling habitatchange in salt marshes after tidal restoration. Restoration Ecology10:543–555.
Bowron, T. M., and N. C. Chiasson. 2006. Pre-construction monitoring ofthe Cheverie Creek Salt Marsh Restoration Project. CB Wetlands andEnvironmental Specialists Publication No. 1.
Burdick, D. M., M. Dionne, R. M. Boumans, and F. T. Short. 1997. Eco-logical responses to tidal restoration of two northern New England saltmarshes. Wetlands Ecology and Management 4:129–144.
Byers, S., and G. L. Chmura. 2007. Salt marsh vegetation recovery on theBay of Fundy. Estuaries and Coasts 30:869–877.
Cahoon, D. R., and D. J. Reed. 1995. Relationships among marsh surfacetopography, hydroperiod, and soil accretion in a deteriorating Louisianasalt marsh. Journal of Coastal Research 11:357–369.
Cahoon, D. R., J. C. Lynch, and R. M. Knaus. 1996. Improved cryogeniccoring device for sampling wetland soils. Journal of SedimentaryResearch 66:1025–1027.
Cahoon, D. R., J. C. Lynch, C. Perez, B. Segura, R. Holland, C. Stelly, G.Stephenson, and P. Hensel. 2002. A device for high precision mea-surement of wetland sediment elevation: II. The rod surface elevationtable. Journal of Sedimentary Research 72:734–739.
Chmura, G. L., P. Chase, and J. Bercovitch. 1997. Climatic controls on themiddle marsh zone in Fundy saltmarshes. Estuaries 20:689–699.
Chmura, G. L., A. Coffey, and R. Crago. 2001. Variation in surface sedimentdeposition on salt marshes in the Bay of Fundy. Journal of CoastalResearch 17:221–227.
Crain, C. M., B. R. Silliman, S. L. Bertness, and M. D. Bertness. 2004. Phys-ical and biological drivers of plant distribution across estuarine salinitygradients. Ecology 85:2539–2549.
Crooks, S., J. Schutten, G. D. Sheern, K. Pye, and A. J. Davy. 2002. Drainageand elevation as factors in the restoration of salt marsh in Britain.Restoration Ecology 10:591–602.
D’Alpaos, A., S. Lanzoni, M. Marani, A. Bonometto, G. Cecconi, andA. Rinaldo. 2007. Spontaneous tidal network formation within a con-structed salt marsh: observations and morphodynamic modeling. Geo-morphology 91:186–197.
Dausse, A., A. Bonnis, J. B. Bouzille, and J. C. Lefeuvre. 2008. Sedimentdispersal in a polder after partial tidal restoration: implications for saltmarsh restoration. Applied Vegetation Science 11:3–12.
Elias, E. P. L., and A. J. F. van der Spek. 2006. Long-term morphodynamicevolution of Texel Inlet and its ebb-tidal delta (The Netherlands). MarineGeology 225:5–21.
French, P. W. 2006. Managed realignment–the developing story of a com-paratively new approach to soft engineering. Estuarine Coastal and ShelfScience 67:406–423.
French, C. E., J. R. French, N. J. Clifford, and C. J. Watson. 2000.Sedimentation-erosion dynamics of abandoned reclamations: therole of waves and tides. Continental Shelf Research 20:1711–1733.
Garbutt, R. A., C. J. Reading, M. Wolters, A. J. Gray, and P. Rothery. 2006.Monitoring the development of intertidal habitats on former agriculturalland after managed realignment of coastal defences at Tollesbury, Essex,UK. Marine Pollution Bulletin 53:155–164.
Gordon, D. C. Jr. 1989. Habitat loss in the Gulf of Maine. Pages 106–119.Sustaining our common heritage. Proceedings of the Gulf of MaineConference. December 10–12. Gulf of Maine Council on the MarineEnvironment, Portland, Maine.
Haltiner, J., J. B. Zedler, K. E. Boyer, G. D. Williams, and J. C. Callaway.1997. Influence of physical processes on design, functioning andevolution of tidal wetlands in California (USA). Wetlands Ecology andManagement 4:73–91.
Hinkle, R. L., and W. J. Mitsch. 2005. Salt marsh vegetation recovery atsalt hay farm wetland restoration sites on Delaware Bay. EcologicalEngineering 25:240–251.
Klotzli, F., and A. P. Grootjans. 2001. Restoration of natural and semi-natural wetland systems in Central Europe: progress and predictabilityof developments. Restoration Ecology 9:209–219.
Konisky, R. A, D. M. Burdick, M. Dionne, and H. A. Neckles. 2006. Aregional assessment of salt marsh restoration and monitoring in the Gulfof Maine. Restoration Ecology 14:516–525.
Lathrop, R. G., M. B. Cole, and R. D. Showalter. 2000. Quantifying thehabitat structure and spatial pattern of New Jersey (U.S.A.) salt marshesunder different management regimes. Wetlands Ecology and Management8:163–172.
Mitsch, W. J. and S. E. Jørgensen. 2004. Ecological engineering and ecosystemrestoration. John Wiley and Sons, Malden, Massachusetts.
Neckles, H. A., M. Dionne, D. M. Burdick, C. T. Roman, R. Buchsbaum, andE. Hutchins. 2002. A monitoring protocol to assess tidal restorationof salt marshes on local and regional Scales. Restoration Ecology10:556–563.
Ollerhead, J., D. van Proosdij and R. G. Davidson-Arnott. 2003. Spatial vari-ability in changes in surface elevation in salt marshes of the CumberlandBasin, Bay of Fundy. Proceedings of the Canadian Coastal Conference,Kingston, Ontaria. Canadian Coastal Science and Engineering Associa-tion.
Onaindia, M., I. Albizu, and I. Amezaga. 2001. Effect of time on the naturalregeneration of salt marsh. Applied Vegetation Science 4:247–256.
Paquette, C. H., K. L. Sundberg, R. J. Bouman, and G. L. Chmura. 2004.Changes in saltmarsh surface elevation due to variability in evapotran-spiration and tidal flooding. Estuaries 27:82–89.
Raposa, K. 2002. Early responses of fishes and crustaceans to restorationof a tidally restricted New England salt marsh. Restoration Ecology10:665–676.
Roman, C. T., M. J. James-Pirri, and J. F. Heltshe. 2001. Monitor-ing salt marshvegetation: a protocol for the long-term coastalecosystem monitoring program at Cape Cod National Seashore.www.nature.nps.gov/im/monitor/protocolcdb.cfm.
Roman, C. T., K. B. Raposa, S. C. Adamowicz, M. James-Pirri, andJ. G. Catena. 2002. Quantifying vegetation and nekton response totidal restoration of a New England salt marsh. Restoration Ecology10:450–460.
Sanderson, E.W., S. Ustin and T. Foin. 2000. Influence of tidal channels onthe distribution of salt marsh species in Petaluma marsh, CA, USA. PlantEcology 146:29–41.
Sanderson, E., T. Foin, and S. Ustin. 2001. A simple empirical model of saltmarsh plant spatial distributions with respect to tidal channel networks.Ecological Modeling 139:293–307.
Shaw, J., R. B. Taylor, S. Colomon, H. A. Christian, and L. Forbes. 1998.Potential impacts of global sea-level rise on Canadian coasts. CanadianGeographer 42:365–379.
Short, F. T, D. M. Burdick, C. A. Short, R. C. Davis, and P. A Morgan. 2000.Developing success criteria for restored eelgrass, salt marsh and mudflathabitats. Ecological Engineering 15:239–252.
Sinicrope, T. L., P. G. Hine, R. S. Warren, and W. A. Niering. 1990. Restora-tion of an impounded salt marsh in New England. Estuaries 13:25–60.
Restoration Ecology 15

Marsh Response to Culvert Expansion
Tonis, I. E., J. M. T. Stam, and J. van de Graaf. 2002. Morphological changesof the Haringvliet estuary after closure in 1970. Coastal Engineering44:191–203.
Van Proosdij, D., J. Ollerhead, R. G. D. Davidson-Arnott, and L. E. Schostak.1999. Allen Creek marsh, Bay of Fundy: a macro-tidal coastal saltmarsh.The Canadian Geographer 43:316–322.
Van Proosdij, D., J. Ollerhead, and R. G. D. Davidson-Arnott. 2006a. Sea-sonal and annual variations in the sediment mass balance of a macro-tidalsalt marsh. MarineGeology 225:103–127.
Van Proosdij, D., R. G. D. Davidson-Arnott, and J. Ollerhead. 2006b. Controlson the spatial patterns of sediment deposition across a macro-tidal saltmarsh over single tidal cycles. Estuarine, Coastal and Shelf Science69:64–86.
Warren, R. S., P. E. Fell, R. Rozsa, A. Hunter Brawley, A. C. Orsted, E. R.Olson, V. Swamy, and W. A. Niering. 2002. Salt marsh restoration inConnecticut: 20 years of science and management. Restoration Ecology10:497–513.
Weldon, J., D. Garbary, S. Courtenay, W. Ritchie, C. Godin, M. H. Theriault,M. Boudreau, and A. Lapenna. 2005. The Community Aquatic
Monitoring Project (CAMP) for measuring Marine Environmental Healthin Coastal Waters of the southern Gulf of St. Lawrence: 2004 overview.Canadian Technical Report Fisheries and Aquatic Science 2624.
Wells, P. G. 1999. Environmental impacts of barriers entering the Bayof Fundy. Report of an ad-hoc Environment Canada working group.Canadian Wildlife Technical Report Series no. 334, Ottawa, ON.
Williams, P. B., and M. K. Orr. 2002. Physical evolution of restored breachedlevee marshes in San Francisco Bay Estuary. Restoration Ecology10:527–542.
Wolanski, E., K. Moore, S. Spagnol, N. D’Adamo, and C. Pattiaratchi. 2001.Rapid, human-induced siltation of the macro-tidal Ord Estuary, WesternAustralia. Estuarine, Coastal and Shelf Science 53:717–732.
Wolters, M., A. Garbutt, and J. P. Bakker. 2005a. Salt marsh restoration:evaluating the success of de-embankments in North West Europe.Biological Conservation 123:249–268.
Wolters, M., J. P. Bakker, M. D. Bertness, R. L. Jeffries, and I. Moller. 2005b.Salt marsh erosion and restoration in south east England: squeezingthe evidence requires realignment. Journal of Applied Ecology 42:844–851.
16 Restoration Ecology