macro data for the unemployment insurance...
TRANSCRIPT

Macro Data for the Unemployment Insurance System
Presentation toUnemployment Insurance Task ForceBy Employment Security Department
September 21, 2005

9/21/05 Prepared by Employment Security Department, UI Research and Analysis for Joint Legislative Task Force on Unemployment Insurance
1
100,000
125,000
150,000
175,000
200,000
225,000
250,000
1994 1995 1996 1997 1998 1999 2000 2001 2002 2003 2004
Total Number of Unemployed - AnnuallyWashington State
1994 - 2004 (Not Seasonally Adjusted)
9/21/05 Prepared by Employment Security Department, UI Research and Analysis for Joint Legislative Task Force on Unemployment Insurance
2
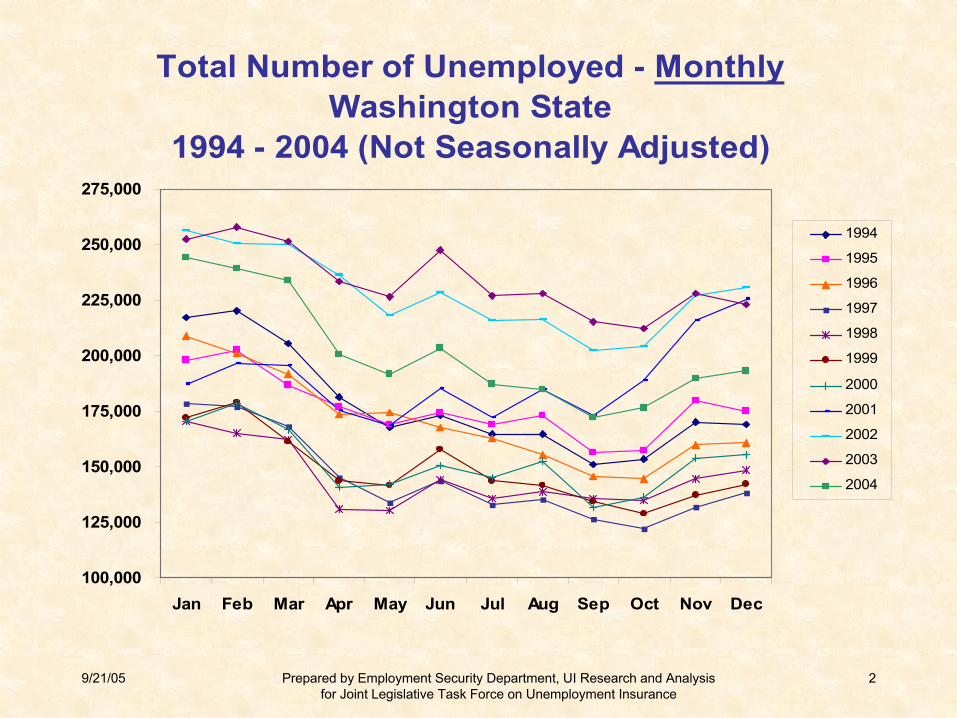
100,000
125,000
150,000
175,000
200,000
225,000
250,000
275,000
Jan Feb Mar Apr May Jun Jul Aug Sep Oct Nov Dec
1994
1995
1996
1997
1998
1999
2000
2001
2002
2003
2004
Total Number of Unemployed - MonthlyWashington State
1994 - 2004 (Not Seasonally Adjusted)

9/21/05 Prepared by Employment Security Department, UI Research and Analysis for Joint Legislative Task Force on Unemployment Insurance
3
1999 2000 2001 2002 2003 2004 1999 2000 2001 2002 2003 2004
U.S. 4.2 4.0 4.8 5.8 6.0 5.5 1.8 1.7 2.3 2.9 2.8 2.4
WA 4.7 4.8 6.1 7.1 7.2 6.0 3.1 2.8 3.6 4.4 4.0 3.0
WA's Rank 12th 9th 1st 2nd 3rd 7th 2nd 2nd 3rd 3rd 4th 7th
IUR (%) - Insured Unemployment RateTUR (%) - Total Unemployment Rate
Unemployment Rates (%) - U.S. and Washington1999 - 2004 (Not Seasonally Adjusted)

9/21/05 Prepared by Employment Security Department, UI Research and Analysis for Joint Legislative Task Force on Unemployment Insurance
4
2003 2004King $ 435,992,665 $ 264,424,729Snohomish $ 179,736,460 $ 102,314,230Pierce $ 160,883,716 $ 104,690,846Spokane $ 78,695,264 $ 51,773,583Clark $ 60,658,404 $ 36,594,860Yakima $ 51,539,095 $ 33,503,882Chelan $ 15,856,750 $ 9,924,508Garfield $ 193,718 $ 135,596
Entire State $ 1,472,375,970 $ 911,915,981
Benefits Paid to Residents ofSelected of Washington Counties
1999 - 2004

9/21/05 Prepared by Employment Security Department, UI Research and Analysis for Joint Legislative Task Force on Unemployment Insurance
5
1999 2000 2001 2002 2003 2004
Asotin 34th 33rd 32nd 33rd 35th 31st
Ferry 32nd 34th 36th 36th 33rd 33rd
Franklin 20th 20th 22nd 20th 18th 18th
Grays Harbor 12th 13th 16th 16th 16th 14th
Island 19th 23rd 20th 18th 19th 19th
Okanogan 17th 19th 21st 22nd 23rd 21st
Stevens 21st 22nd 19th 23rd 22nd 23rd
* Ranking differs across years by more than 3
Benefits PaidRankings of Selected* Washington Counties
1999 - 2004

9/21/05 Prepared by Employment Security Department, UI Research and Analysis for Joint Legislative Task Force on Unemployment Insurance
6
Benefits Paid as Percentof Covered WagesWashington State
1999-2004
1.04% 1.08% 1.69% 1.73% 1.48% 0.90%0%
10%
20%
30%
40%
50%
60%
70%
80%
90%
100%
1999 2000 2001 2002 2003 2004
Benefits - billions: $.949 B $1.048 B $1.645 B $1.678 B $1.472 B $.912 B

9/21/05 Prepared by Employment Security Department, UI Research and Analysis for Joint Legislative Task Force on Unemployment Insurance
7
Highest 2004Construction - Specialty Trade Contractors 10.4%
Administrative & Support 6.7%Health Care & Social Assistance 6.1%
Retail Trade - Speciality 5.9%Metal, Machine, Transportation Mfg. 4.8%
LowestFishing 0.6%
Waste Management 0.4%Mining 0.2%Utilities 0.2%
Management - Companies & Enterprises 0.1%
Industries with Highest and LowestPERCENT of CLAIMANTS
1999 - 2004

9/21/05 Prepared by Employment Security Department, UI Research and Analysis for Joint Legislative Task Force on Unemployment Insurance
8
Highest 2002 2004Fishing 9.0% 6.9%
Construction - Nonresidential Building 6.0% 3.4%Construction - Heavy & Civil Engineering 6.1% 3.3%
Construction - Specialty Trade Contractors 4.7% 2.7%Food, Beverage, Clothing Mfg. 3.3% 2.3%
LowestHealth Care & Social Assistance 0.7% 0.5%
Information 0.8% 0.4%Management - Companies & Enterprises 0.8% 0.3%
Aerospace Product Mfg. 2.4% 0.2%Education Services 0.4% 0.2%
Industries with Highest and LowestBENEFIT PAYMENTS as PERCENT of TOTAL WAGES
2002 - 2004

9/21/05 Prepared by Employment Security Department, UI Research and Analysis for Joint Legislative Task Force on Unemployment Insurance
9
Highest 2004Aerospace Product Mfg. $419
Management - Companies & Enterprises $410Information $404
Construction - Heavy & Civil Engineering $398Construction - Nonresidential Building $390
LowestAgriculture-Other, Forestry, Hunting $228
Retail Trade - General & Misc. $220Accomodation Services $205
Food Services $186Agriculture - Fruits & Vegetables $172
Industries with Highest and LowestAVERAGE WEEKLY BENEFIT AMOUNT (WBA)
1999 - 2004
9/21/05 Prepared by Employment Security Department, UI Research and Analysis for Joint Legislative Task Force on Unemployment Insurance
10
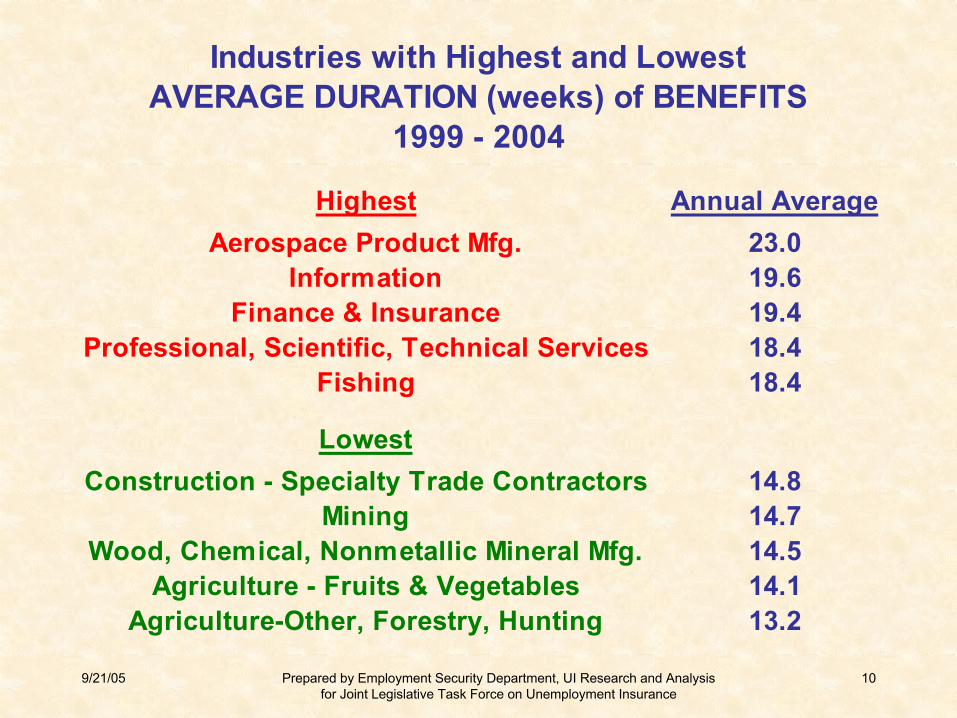
Highest Annual AverageAerospace Product Mfg. 23.0
Information 19.6Finance & Insurance 19.4
Professional, Scientific, Technical Services 18.4Fishing 18.4
LowestConstruction - Specialty Trade Contractors 14.8
Mining 14.7Wood, Chemical, Nonmetallic Mineral Mfg. 14.5
Agriculture - Fruits & Vegetables 14.1Agriculture-Other, Forestry, Hunting 13.2
Industries with Highest and LowestAVERAGE DURATION (weeks) of BENEFITS
1999 - 2004

9/21/05 Prepared by Employment Security Department, UI Research and Analysis for Joint Legislative Task Force on Unemployment Insurance
11
Highest Annual AverageConstruction - Specialty Trade Contractors 121,121,881$
Metal, Machine, Transportation Mfg. 87,445,810$ Aerospace Product Mfg. 83,198,602$
Professional, Scientific, Technical Services 69,171,004$ Administrative & Support 64,188,883$
LowestWaste Management 7,147,838$
Warehousing 6,587,843$ Mining 3,396,288$ Utilities 2,845,178$
Management - Companies & Enterprises 2,048,987$
Industries with Highest and LowestTOTAL DOLLAR VALUE of BENEFITS
1999 - 2004

9/21/05 Prepared by Employment Security Department, UI Research and Analysis for Joint Legislative Task Force on Unemployment Insurance
12
Highest Annual AverageConstruction - Specialty Trade Contractors $ 81,151,673
Retail Trade - Speciality $ 77,133,125Metal, Machine, Transportation Mfg. $ 70,439,427
Professional, Scientific, Technical Services $ 62,487,733Wholesale Trade $ 62,394,882
LowestUtilities $ 3,919,126
Public Administration $ 3,682,131Fishing $ 3,419,876Mining $ 3,107,365
Management - Companies & Enterprises $ 2,201,754
Industries with Highest and LowestTOTAL DOLLAR VALUE of TAXES PAID by TAXABLE EMPLOYERS
1999 - 2004

9/21/05 Prepared by Employment Security Department, UI Research and Analysis for Joint Legislative Task Force on Unemployment Insurance
13
HighestAverage
Exhaustion RateAverage # ofExhaustees
Aerospace Product Mfg. 53.3% 3,464Information 40.5% 3,068
Fishing 38.5% 541Finance & Insurance 38.5% 2,071
Real Estate, Rental, Leasing 36.4% 1,299
LowestConstruction - Specialty Trade Contractors 22.1% 5,405Construction - Heavy & Civil Engineering 21.6% 1,901
Agriculture - Fruits & Vegetables 21.2% 1,508Mining 20.4% 134
Agriculture-Other, Forestry, Hunting 17.6% 1,564
Industries with Highest and LowestCLAIMANTS WHO EXHAUSTED BENEFITS
2000 - 2004

9/21/05 Prepared by Employment Security Department, UI Research and Analysis for Joint Legislative Task Force on Unemployment Insurance
14
1994 1995 1996 1997 1998 1999 2000 2001 2002 2003 2004
U.S. 23.7 24.0 24.0 23.9 23.7 23.8 23.8 24.1 23.8 23.6 22.6
WA 25.7 26.0 26.0 26.0 26.1 26.2 26.2 26.7 26.5 26.3 26.3
WA's Rank 14th 2nd 2nd 2nd 2nd 2nd 2nd 2nd 2nd 2nd 2nd
1994 1995 1996 1997 1998 1999 2000 2001 2002 2003 2004
U.S. 15.5 14.7 14.9 14.6 13.8 14.5 13.7 13.8 16.5 16.4 16.1
WA 18.8 18.5 18.7 16.8 18.4 18.4 16.2 16.4 19.5 18.4 17.4
WA's Rank 2nd 2nd 2nd 4th 1st 1st 3rd 2nd 1st 4th 8th
Average Duration (weeks) of Benefits - U.S. and Washington1999 - 2004
POTENTIAL
ACTUAL

9/21/05 Prepared by Employment Security Department, UI Research and Analysis for Joint Legislative Task Force on Unemployment Insurance
15
1994 1995 1996 1997 1998 1999 2000 2001 2002 2003 2004
U.S. 36.3 34.3 33.4 32.8 31.8 31.4 31.8 34.1 42.6 43.4 39.0
WA 37.4 34.5 32.5 27.7 33.2 35.0 29.0 30.8 38.0 36.8 29.0
WA's Rank 13th 15th 17th 28th 10th 8th 26th 24th 27th 32nd 42nd
Exhaustion Rates (%) - U.S. and Washington1999 - 2004

9/21/05 Prepared by Employment Security Department, UI Research and Analysis for Joint Legislative Task Force on Unemployment Insurance
16
Jul 98 - Jun 99 Jul 00 - Jun 01 Jul 02 - Jun 03 Jul 04 - Jun 05
Min WBA 87$ 102$ 107$ 111$ Max WBA 410$ 478$ 496$ 496$
Min WBA 7,080 9,886 10,752 19,370Max WBA 40,627 48,448 61,500 34,457Min WBA 3.7% 4.1% 3.8% 9.6%Max WBA 21.4% 20.0% 21.9% 17.1%
Min WBA 9.5 M$ 16.9 M$ 21.6 M$ 26.0 M$ Max WBA 319.9 M$ 497.8 M$ 748.1 M$ 201.1 M$ Min WBA 1.0% 1.1% 1.1% 3.7%Max WBA 34.7% 34.0% 37.3% 28.8%
# and % of Claimants & Benefits Paidat Minimum and Maximum Weekly Benefit Amounts (WBA)
Washington StateAlternating Fiscal Years 1999 - 2005
CLAIMANTS
BENEFITS PAID (in millions of dollars)
WBA Amounts
Dollars at
Percent at
Number at
Percent at

9/21/05 Prepared by Employment Security Department, UI Research and Analysis for Joint Legislative Task Force on Unemployment Insurance
17
MaximumWBA
MinimumWBA
Massachusetts WashingtonRhode Island Michigan/Rhode IslandConnecticut OregonWashington OhioNew Jersey Kansas
Nebraska/Missouri NevadaSouth Dakota Oklahoma
Arizona North CarolinaAlabama Louisiana
Mississippi Hawaii
HIG
HES
TLO
WES
TStates with Highest and Lowest
Maximum and Minimum Weekly Benefit Amount (WBA)1998 - 2005

9/21/05 Prepared by Employment Security Department, UI Research and Analysis for Joint Legislative Task Force on Unemployment Insurance
18
1999 2000 2001 2002 2003 2004
U.S. 33.1 32.9 34.6 36.8 36.5 35.2
WA 40.3 39.6 43.5 45.1 43.7 41.4
WA's Rank 13th 14th 8th 5th 6th 6th
Average Wage Replacement Rates (%)U.S. and Washington
1999 – 2004

9/21/05 Prepared by Employment Security Department, UI Research and Analysis for Joint Legislative Task Force on Unemployment Insurance
19
1999 2000 2001 2002 2003 2004
U.S. 37.4 34.4 44.6 43.8 40.7 36.8
WA 55.0 49.0 51.1 52.6 46.2 40.6
WA's Rank 6th 12th 15th 11th 16th 14th
Recipiency Rates (%)U.S. and Washington
1999 – 2004

9/21/05 Prepared by Employment Security Department, UI Research and Analysis for Joint Legislative Task Force on Unemployment Insurance
20
# of Weeks Taken to Exhaust BenefitsWashington State
Regular Benefit Entitlements Only1998 - 2005
-
5,000
10,000
15,000
20,000
25,000
30,000
35,000
40,000
45,000
1 - 5
6 - 10
11 - 1
516
- 20
21 - 2
5 26 27 28 29 30
# of weeks
# of
Exh
uast
ees 1998
1999200020012002200320042005
9/21/05 Prepared by Employment Security Department, UI Research and Analysis for Joint Legislative Task Force on Unemployment Insurance
21
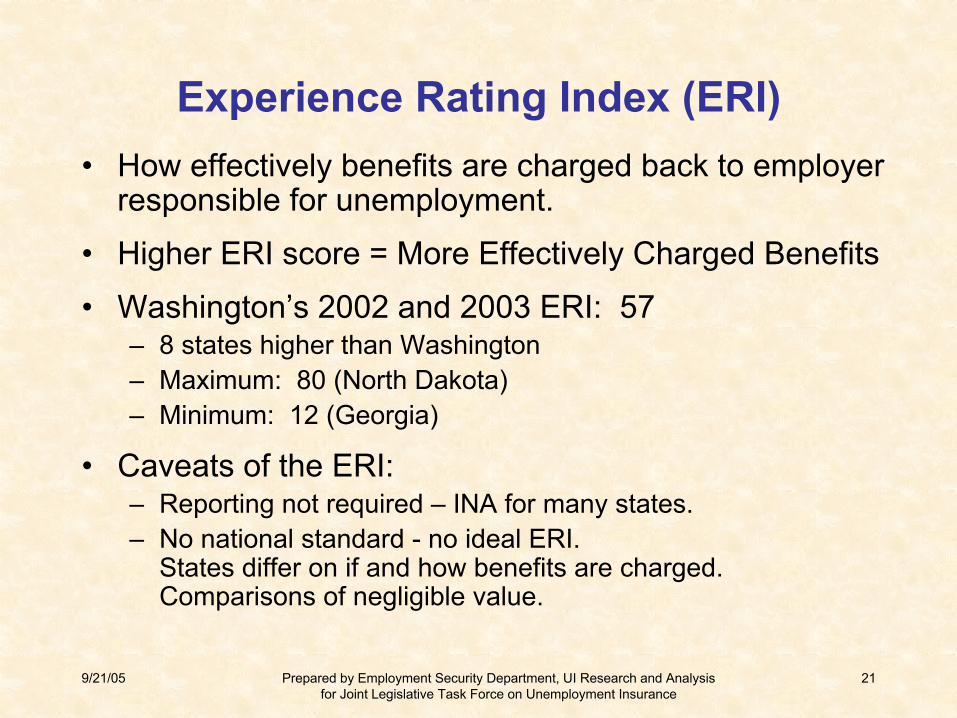
Experience Rating Index (ERI)• How effectively benefits are charged back to employer
responsible for unemployment.
• Higher ERI score = More Effectively Charged Benefits
• Washington’s 2002 and 2003 ERI: 57– 8 states higher than Washington– Maximum: 80 (North Dakota)– Minimum: 12 (Georgia)
• Caveats of the ERI: – Reporting not required – INA for many states.– No national standard - no ideal ERI.
States differ on if and how benefits are charged.Comparisons of negligible value.
9/21/05 Prepared by Employment Security Department, UI Research and Analysis for Joint Legislative Task Force on Unemployment Insurance
22
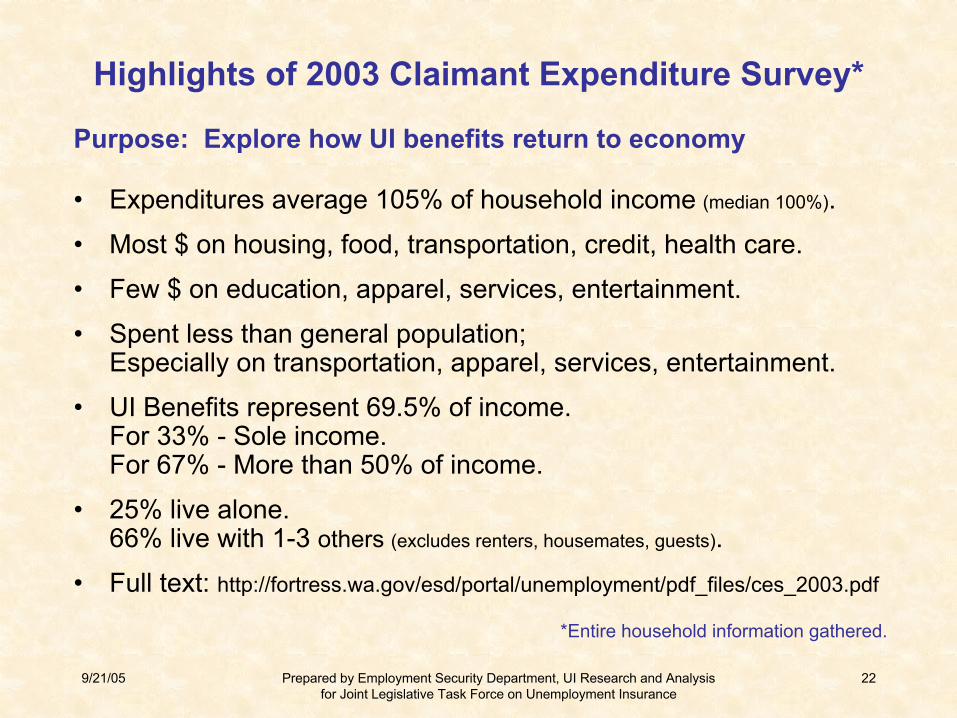
Highlights of 2003 Claimant Expenditure Survey*
Purpose: Explore how UI benefits return to economy
• Expenditures average 105% of household income (median 100%).
• Most $ on housing, food, transportation, credit, health care.
• Few $ on education, apparel, services, entertainment.
• Spent less than general population;Especially on transportation, apparel, services, entertainment.
• UI Benefits represent 69.5% of income.For 33% - Sole income.For 67% - More than 50% of income.
• 25% live alone.66% live with 1-3 others (excludes renters, housemates, guests).
• Full text: http://fortress.wa.gov/esd/portal/unemployment/pdf_files/ces_2003.pdf
*Entire household information gathered.

9/21/05 Prepared by Employment Security Department, UI Research and Analysis for Joint Legislative Task Force on Unemployment Insurance
23
Percent of All Employers in Each Rate ClassAverages 1994 - 2005
0%
10%
20%
30%
40%
50%
1 4 7 10 13 16 19 22 25 28 31 34 37 40
Rate Class

9/21/05 Prepared by Employment Security Department, UI Research and Analysis for Joint Legislative Task Force on Unemployment Insurance
24
Percent of All Employers in Each Rate Class2005
0%
10%
20%
30%
40%
50%
1 4 7 10 13 16 19 22 25 28 31 34 37 40
Rate Class