macom technology solutions holdings (mtsi)
TRANSCRIPT

MACOM Technology Solutions Holdings (MTSI)
May 2016

2
Forward-Looking Statement Safe Harbor and Use
of Non-GAAP Financial Measures
This presentation contains forward-looking statements based on management’s beliefs and assumptions and on information currently available to our
management. Forward-looking statements include, among others, statements concerning our acquisition, divestment and debt and equity financing
transactions and litigation matters, including those regarding any potential benefits and synergies, strategic plans, divesti tures, restructuring, cost savings,
accretion, and financial and business expectations associated with such transactions and litigations, as well as any other statements regarding our plans,
beliefs or expectations or our future business or financial results. Forward-looking statements include all statements that are not historical facts and
generally may be identified by terms such as "anticipates," "believes," "could," "estimates," "expects," "intends," "may," "plans," "potential,” "predicts,"
"projects," "seeks," "should," "will," "would" or similar expressions and the negatives of those terms.
Our forward-looking statements are subject to assumptions, risks and uncertainties, and are not guarantees of future results. Actual results may differ
materially from the outcomes stated or implied by our forward-looking statements based on any assumptions and risk factors we may mention today or
otherwise, or in our Annual Report on Form 10-K filed with the SEC on November 24, 2015, Quarterly Report on Form 10-Q filed with the SEC on April
27, 2016 or other filings we have made with the SEC, which are publicly-available on the SEC's EDGAR database located at www.sec.gov. All financial
guidance projections referenced in this presentation were made as of April 26, 2016 or another historical date noted herein, and any references to such
projections herein are not intended to reaffirm them as of any later date. MACOM undertakes no obligation to update any forward-looking statement or
projection at any future date. This presentation includes information and projections derived from third-party sources concerning addressable market size
and growth rates and similar general economic or industry data. MACOM has not independently verified any information and projections from third party
sources incorporated herein.
We make references in this presentation to certain financial information calculated on a basis other than in accordance with accounting principles generally
accepted in the United States (GAAP). These non-GAAP measures are provided as additional insight into on-going financial performance. These non-GAAP
measures are provided in addition to, and not as a substitute for, or superior to, measures of financial performance prepared in accordance with GAAP. See
our reconciliation of MACOM non-GAAP results to the nearest GAAP measure in the appendix provided at the end of this presentation. We are unable to
provide a quantitative reconciliation for certain non-GAAP measures presented herein to the most directly comparable GAAP measure because we cannot
reliably forecast acquisition, integration and other costs related to our acquisitions, which are difficult to predict and estimate. Our fiscal year end is the Friday
closest to September 30th. Fiscal year 2016 will include 52 weeks.
This presentation also contains market statistics and industry data that are subject to uncertainty and are not necessarily reflective of market conditions.
Although MACOM believes that these statistics and data are reasonable, they have been derived from third party sources and have not been independently
verified by MACOM.

3
• Pure play leader in high performance analog RF,
microwave, millimeterwave and photonic
semiconductors
• Growth and richer product mix driving gross and
operating margin expansion
• Focused R&D investments in high-growth, high-margin
applications
• Broad catalog business of long lifecycle products serving
large and diverse end markets
• Disciplined consolidator and proven integrator
• Scalable “fab-lite” manufacturing model with
differentiated domestic manufacturing
• Increasing profitability supported by strong balance
sheet
• Experienced management team supported by best in
class operating professionals
Company Highlights

4
Serving Large and Diverse End Markets
Cloud connected apps
economy driven by: cloud
computing, hyperscale data
centers, optical networking,
streaming video and
mobile internet devices
Demand for improved
situational awareness on
the modern battlefield
through active antenna
arrays and high data
density networks
Servicing transition from
GaAs to GaN technologies
Growth driven by the Cloud Connected Apps Economy
and the Modern Networked Battlefield
NETWORKSAEROSPACE/
DEFENSEMULTI-MARKET

5
…from RF to Light
Broad Catalog of Highly Specialized Products
Serving a Broad Frequency Spectrum
Industrial
Broad-
band
Wireless Data,
Toll TagsGPS,
Avionic,
Radar
Cellular DVB,
Satellite
Radio
WiMAX,
WLAN,
Access
Points
Test
Equipment
Microwave
Radio Links
DBS, Industrial
Imaging
Satellite Payload
Communications
Industrial
VSAT
Millimeterwave
Radio Links
UAV
Datalink
SATCOM
Terminal
Communication
Tracking and
Jamming
Adaptive
Cruise
Control
Scientific
Imaging and
MeasurementRadar
Communications
BroadcastLasers for
Access Networks
Lasers for
Mobile
Backhaul
Lasers for
Data
Centers
Lasers for
Silicon
Photonics
Lasers for
HAMR
Blue and
Green
Lasers
1 MHz 6 GHz 20 GHz Light110 GHz
Radio Frequency Microwave Millimeterwave Light
• Sticky, value-added technologies
• High speed analog RF, μW, mmW
and photonic engineering
competencies
• Long product lifecycles
Diverse Array of Products and Form Factors
Integrated
Circuits
Diodes, Switch
Limiters,
Switches
Passive
Components
Crosspoint
Switches
PhotonicsMulti-Chip
Modules

6
Focused R&D Investments
Building on 60 years of engineering expertise, MACOM is a
trusted partner to industry leaders worldwide
60YEARS OF
INNOVATION
Products
Device Technology Applications

7
Growth and Richer Product Mix
Quarterly Revenue by Adjusted GM(1)
$0
$20,000,000
$40,000,000
$60,000,000
$80,000,000
$100,000,000
$120,000,000
Q4'12 Q1'16
RE
VE
NU
E
60.0%
(1) (1) Adjusted Gross Margin is a Non-GAAP measure and has been adjusted for the automotive business now reflected as discontinued operations
and other items. Please see the appendix for reconciliation to GAAP. Q116 excludes FiBest and Metelics/Aeroflex acquisitions
Significant gross
margin expansion due
to product mix shift
Organic investment in
high margin, high
performance products
Focused acquisition
efforts on high
margin, high value-
add businesses
Below 60%
60% to 70%
70%+
42.4% CAGR
22.5% CAGR
4.6% CAGR
8
Our M&A strategy is designed to:
• Acquire companies that expand MACOM’s footprint in adjacent markets
(>$50 million purchase price)
• Acquire smaller product companies that accelerate MACOM’s growth strategies
with products, people and intellectual property (<$30 million purchase price)
• Investments in exchange for licensed Patents and Intellectual Property to design new
products that MACOM will bring to market in a specific field of use
• Target neutral to accretive in year 1
Disciplined Consolidator and Proven Integrator
*EPS is Non-GAAP
9
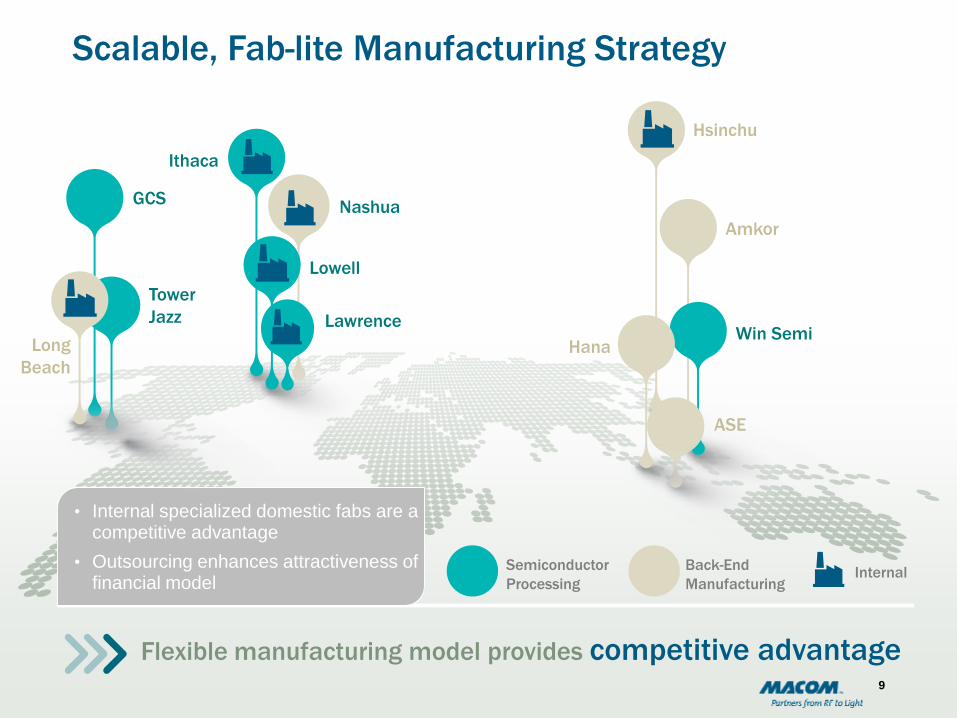
Scalable, Fab-lite Manufacturing Strategy
Tower
Jazz
GCS
Amkor
• Internal specialized domestic fabs are a competitive advantage
• Outsourcing enhances attractiveness of financial model
Semiconductor
Processing
Back-End
Manufacturing
Flexible manufacturing model provides competitive advantage
Hsinchu
Win Semi
ASE
Hana
Ithaca
Long
Beach
9
Internal
Lowell
Nashua
Lawrence

10
Experienced and Proven Management Team
Greg Baker SVP & GM, RF
and Microwave
Robert McMullanSVP & CFO
Preet VirkSVP & GM,
Networks
Michael MurphySVP, Engineering
Jack Kennedy SVP & GM, Aerospace and
Defense
Robert DennehySVP, Operations
Thomas HwangSVP, Global Sales
Alex Behfar Chief Scientist, SVP &
GM,
Photonic Solutions
John CroteauPresident & CEO
Toshihiro TakadaSVP & President, MACOM
K.K.

Recipe for Growth & Profitability

12
Secular Growth Drivers
Active Antennas
mmW Data Links
Optical
GaN
Pulsed
Power
Transistors
PIN
Diodes
LDMOS
Power
Transistors
Bipolar
Power
TransistorsLow
Power SOI
Switches
GaAs
Radar
MMICsmmW
Backhaul
MMICs
uW
Backhaul
MMICs10-20G
Optical
PMDs
GaN Power
Transistors
mmW
Radios
GaN
Switches,
Mixers
Active
Antenna
MMICs
High Power
GaAs Switches
GaAs
Mixers
100G
Optical
PMDs
30 YEARS

1313
OPTICAL
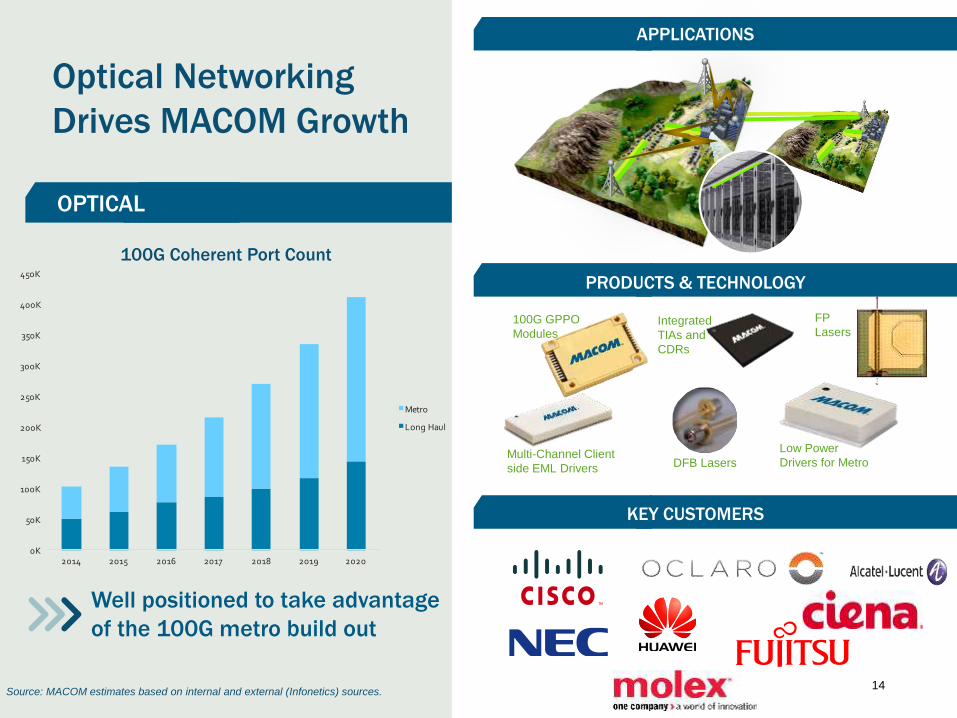
14
Low Power
Drivers for Metro
FP
Lasers100G GPPO
Modules
Multi-Channel Client
side EML Drivers
Integrated
TIAs and
CDRs
DFB Lasers
Optical Networking
Drives MACOM Growth
Source: MACOM estimates based on internal and external (Infonetics) sources.
Well positioned to take advantage
of the 100G metro build out
100G Coherent Port Count
OPTICAL
PRODUCTS & TECHNOLOGY
KEY CUSTOMERS
APPLICATIONS
0K
50K
100K
150K
200K
250K
300K
350K
400K
450K
2014 2015 2016 2017 2018 2019 2020
Metro
Long Haul
15
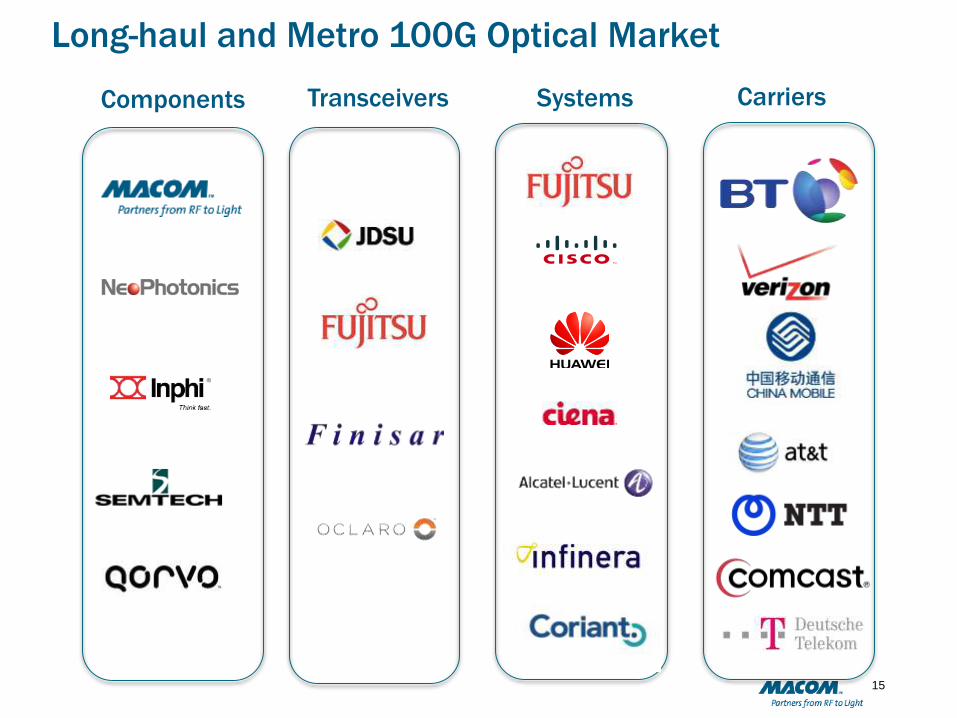
Long-haul and Metro 100G Optical Market
Components Systems CarriersTransceivers
16
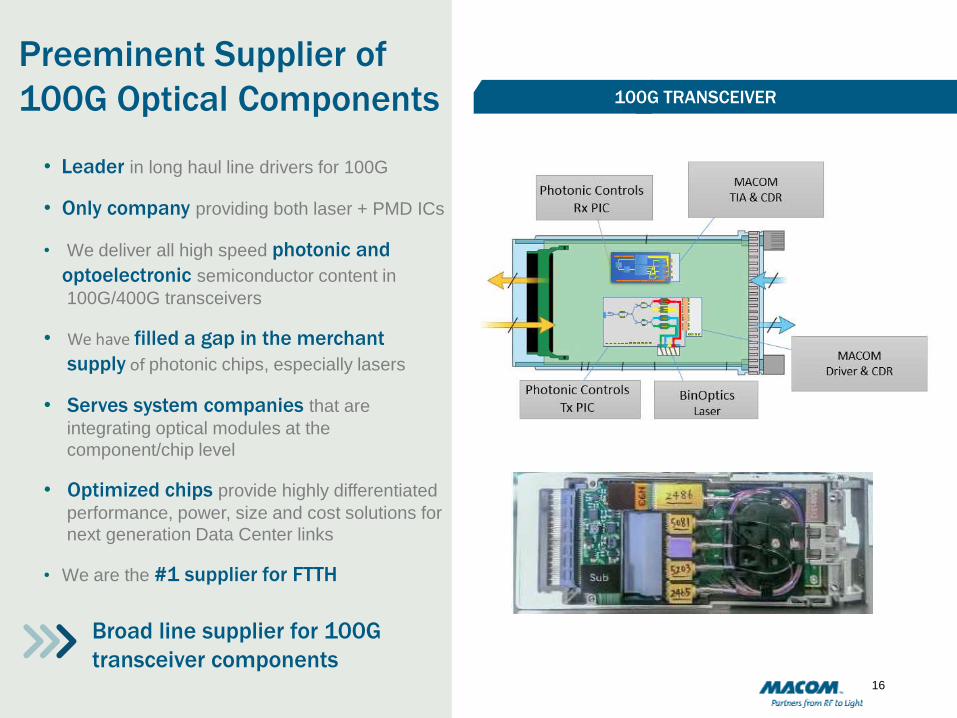
Preeminent Supplier of
100G Optical Components
Broad line supplier for 100G
transceiver components
• Leader in long haul line drivers for 100G
• Only company providing both laser + PMD ICs
• We deliver all high speed photonic and
optoelectronic semiconductor content in
100G/400G transceivers
• We have filled a gap in the merchant
supply of photonic chips, especially lasers
• Serves system companies that are
integrating optical modules at the
component/chip level
• Optimized chips provide highly differentiated
performance, power, size and cost solutions for
next generation Data Center links
• We are the #1 supplier for FTTH
100G TRANSCEIVER

1717
GaN
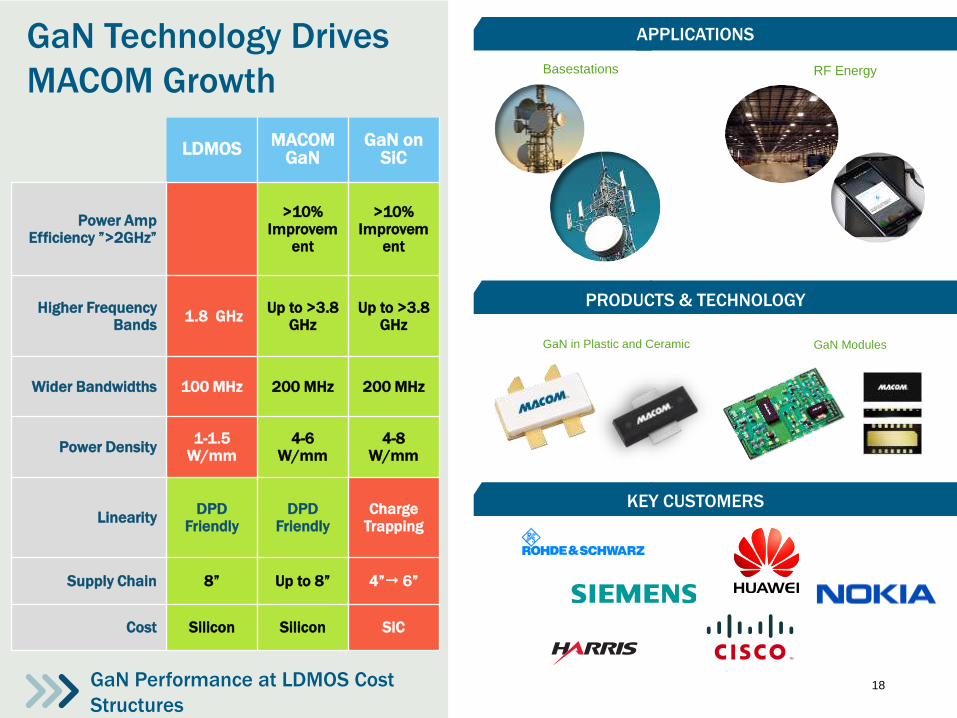
18
GaN Technology Drives
MACOM Growth
GaN Performance at LDMOS Cost
Structures
GaN in Plastic and Ceramic
PRODUCTS & TECHNOLOGY
KEY CUSTOMERS
APPLICATIONS
Basestations RF Energy
LDMOSMACOM
GaNGaN on
SiC
Power AmpEfficiency ”>2GHz”
>10% Improvem
ent
>10% Improvem
ent
Higher Frequency Bands
1.8 GHzUp to >3.8
GHzUp to >3.8
GHz
Wider Bandwidths 100 MHz 200 MHz 200 MHz
Power Density 1-1.5
W/mm4-6
W/mm 4-8
W/mm
LinearityDPD
FriendlyDPD
FriendlyCharge
Trapping
Supply Chain 8” Up to 8” 4” 6”
Cost Silicon Silicon SiC
GaN Modules

19
MACOM Innovation is Leading Commercial
GaN Adoption
MACOM is poised to enable GaN performance at silicon cost structures
Source: Internal MTSI Estimates
FUNDAMENTAL IP POSITION

20
MACOM Innovation is Leading Commercial
GaN Adoption
Source: Internal MTSI Estimates
1
10
100
1000
Rela
tive C
ost ($
/mm
2)
6”
GaAs
Leveraging
Existing Assets
Exploiting Mass Market
Industrial Base
8”
GaNVarious
Suppliers
GCS
5X
4X
TBA
5X
Materials
Innovations
FUNDAMENTAL IP POSITION
MACOM is poised to enable GaN performance at silicon cost structures

2121
ACTIVE ANTENNAS

22
Active Antennas for Radar
and Communications
Drives MACOM Growth
Well positioned to take advantage of
the shift from Mechanically Scanned
Arrays to Active Antenna Arrays.
Radar
PRODUCTS & TECHNOLOGY
TARGET CUSTOMERS
APPLICATIONS
Radar Communications
Radiator
BeamformerModule
RF Chip Set
0
500
1000
1500
2000
Rad
ar
Tra
nsceiv
er
Ele
ctr
onic
s (
$M
)
Year
Source: Strategy Analytics
Radar RF Electronics
SPARTM Tile

23
MACOM Innovation Drives Active Antennas in Civil
and Military Radar Applications
Successful Field Testsin Oklahoma
MACOM has demonstrated the commercial and functional viability that
can support large scale civil and military deployments in the field
Terminal Area Aircraft
Long Range Aircraft
Long Range
Weather
Terminal Area
Weather
ASR-8 ASR-9 ASR-11
ARSR-4ARSR-3ARSR-1/2
NEXRAD TDWR

24
MACOM Innovation Drives Active Antennas in
Defense Radar Applications
1,000 – 10,000X
More RF Content
Expected order of magnitude increase in RF content due to the transition
from Mechanically Scanned Arrays to Active Electronically Scanned Arrays
Air Traffic
Control
Shipborne
Airborne
Ground
Based
25
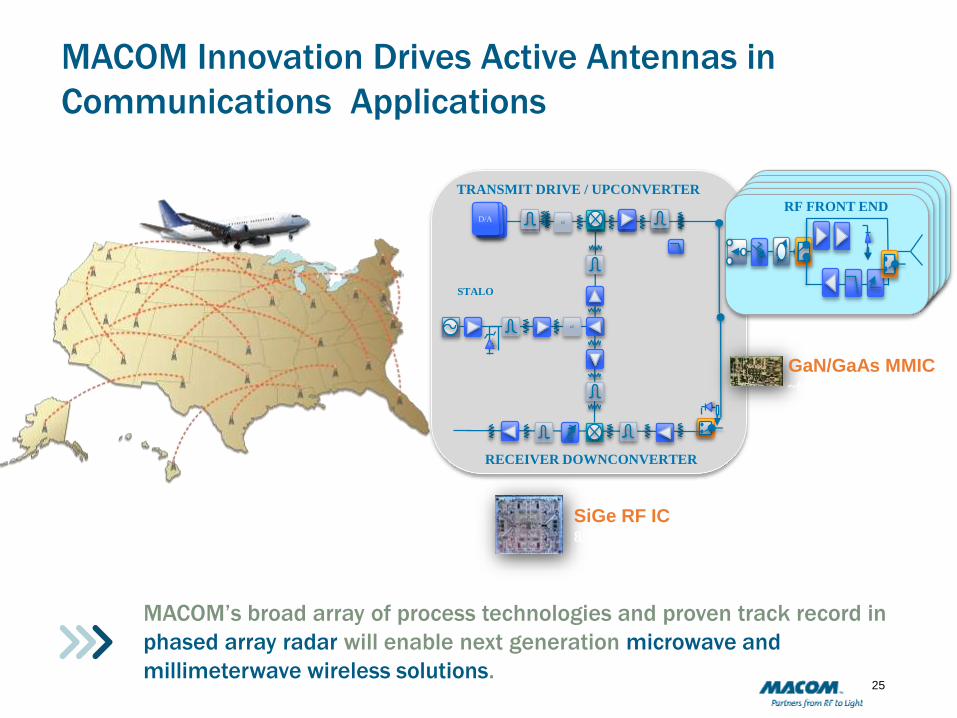
MACOM Innovation Drives Active Antennas in
Communications Applications
x2
x2
TRANSMIT DRIVE / UPCONVERTER
STALO
D/AD/AD/AD/A
RECEIVER DOWNCONVERTER
SiGe RF IC850 transistors (octal)
GaN/GaAs MMIC~60 transistors
RF FRONT END
MACOM’s broad array of process technologies and proven track record in
phased array radar will enable next generation microwave and
millimeterwave wireless solutions.

2626
FINANCIAL OVERVIEW

27
Revenue Performance
Adjusted Revenue
1Non-GAAP financial measure and excludes revenue from our automotive business discontinued operations and other items. Please see the appendix for a reconciliation to
GAAP. Guidance is as of April, 26, 2016 and is not updated or reaffirmed hereby
$109.1
$93.3 $93.3 $96.6$102.4
$115.8
$138-$142
$50
$75
$100
$125
$150
$112.6
$133.6

28
Adjusted Gross Margin Performance
Adjusted Gross Margin1
Improvingproduct mix
Continued focus
manufacturing
cost reductions 40.0%
45.0%
50.0%
55.0%
60.0%
65.0%
70.0%
58.0%58.7% 59.0%
57.0%
58.1 %57.6%
1 Non-GAAP financial measure. Please see the appendix for reconciliation to GAAP. Guidance is as of April, 26, 2016 and is not updated or reaffirmed hereby. For the three months ended January 2, 2015, reflects a Non-GAAP gross margin increase
of 2.1% relating to a change in revenue recognition estimates made during the quarter.
.
56.8%57.4%58.0%

29
Operating Performance
Increased Profitability and Adjusted EPS Growth
Delivering
profits while continuing
to invest
19.3%21.3% 21.9%
23.2% 23.6% 23.2% 23.9%
10.0%
15.0%
20.0%
25.0%
FQ3 14 FQ4 14 FQ1 15 FQ2 15 FQ3 15 FQ4 15 FQ1 16 FQ2 16
Adjusted EPS (1)
$0.25 $0.270.29 $0.31 $0.33 $0.34
$0.49-$0.52
$0.10
$0.20
$0.30
$0.40
$0.50
$0.60
FQ3 14 FQ4 14 FQ1 15 FQ2 15 FQ3 15 FQ4 15 FQ1 16 FQ2 16 FQ3 16Guidance
Adjusted Operating Margin (1)
1 Adjusted Operating Margin and Adjusted EPS Revenue are Non-GAAP measures, and have been adjusted for the automotive business now reflected as discontinued operations
and other items. Please see the appendix for reconciliation to GAAP. Guidance is as of April, 26, 2016 and is not updated or reaffirmed hereby.
24.3%
$0.42$0.46

30
Balance Sheet
April 1,
2016
October 2,
2015
April 1,
2016
October 2,
2015
ASSETS LIABILITIES AND STOCKHOLDERS' EQUITY
Current assets: Current liabilities:
Cash and cash equivalents 58,187$ 122,312$ Current portion of debt obligations 4,499$ 4,058$
Short Term Investments 23,632 39,557 Accounts payable, accrued liabiltities and other 78,335 67,418
Accounts receivable, net 91,604 83,950 Total current liabilities 82,834 71,476
Inventories 106,972 79,943 Long-term debt obligations, less current portion 341,396 340,504
Deferred income taxes - 31,431 Common stock warrant liability 40,901 21,822
Income tax receivable 16,077 15,854 Deferred income taxes 13,920 -
Prepaids and other current assets 11,553 11,172 Other long-term liabilities 7,338 7,916
Total current assets 308,025 384,219 Total liabilities 486,390 441,718
Property and equipment, net 99,637 83,759 Total stockholders' equity 414,008 424,533
Goodwill & intangible assets 397,370 337,012 Total liabilities and stockholders' equity 900,398$ 866,251$
Deferred income taxes 83,909 48,239
Other long term assets 11,457 13,023
Total assets 900,398$ 866,251$

31
• Drive revenue growth through market share
gains and leadership in high growth segments
of our markets
• Accelerate growth through targeted
acquisitions and investments in high growth,
defensible markets
• Expand margins to drive strong EPS growth
and increase shareholder value
Our Strategy

32
Appendix
32
33
Non-GAAP Financial Measures
This non-GAAP information excludes non-consulting agreement related discontinued operations, the impact of fair value
accounting in merger and acquisitions (M&A) of businesses, M&A costs, including acquisition and related integration
costs, certain cost savings from synergies expected from M&A activities, income and expenses from transition services
related to M&A activities, expected amortization of acquisition-related intangibles, share-based and other non-cash
compensation expense, certain cash compensation, restructuring charges, impairment charges, litigation settlement
and costs, changes in the carrying values of assets and liabilities measured at fair value, contingent consideration,
amortization of debt discounts and issuance costs, debt settlement costs, other non-cash expenses, earn-out costs,
restructuring costs and certain income tax items. The non-GAAP information includes consulting agreement related
revenue associated with the Automotive business divestiture. Management does not believe that the adjusted items are
reflective of MACOM's underlying performance. The adjustment of these and other similar items from MACOM's non-
GAAP presentation should not be interpreted as implying that these items are non-recurring, infrequent or unusual.
These and other similar items are also excluded from Adjusted EBITDA, which is non-GAAP earnings before interest,
income taxes, depreciation and amortization. MACOM believes this adjusted non-GAAP financial information provides
additional insight into these items and MACOM's performance and has, therefore, chosen to provide this information to
investors for a consistent basis of comparison and to help them evaluate the results of MACOM's operations and enable
more meaningful period to period comparisons. These adjusted non-GAAP measures may be different than similar
measures used by other companies and should be considered in addition to, not as a substitute for, or superior to,
measures of financial performance prepared in accordance with GAAP. A reconciliation between GAAP and adjusted
non-GAAP financial data used in this presentation is included in the supplemental financial data attached to this
presentation

34Note: MTSI’s fiscal year end is the Friday closest to September 30th.