machine learning lecture 2 - rwth aachen …...in practice, the convergence to a gaussian can be...
TRANSCRIPT

1
Pe
rce
ptu
al
an
d S
en
so
ry A
ug
me
nte
d C
om
pu
tin
gM
ach
ine
Le
arn
ing
Win
ter
‘19
Machine Learning – Lecture 2
Probability Density Estimation
10.10.2019
Bastian Leibe
RWTH Aachen
http://www.vision.rwth-aachen.de
rce
ptu
al
an
d S
en
so
ry A
ug
me
nte
d C
om
pu
tin
gM
ach
ine
Le
arn
ing
Win
ter
‘19
Announcements: Reminders
• Moodle electronic learning room
Slides, exercises, and supplementary material will be made
available here
Lecture recordings will be uploaded 2-3 days after the lecture
Moodle access should now be fixed for all registered participants!
• Course webpage
http://www.vision.rwth-aachen.de/courses/
Slides will also be made available on the webpage
• Please subscribe to the lecture on rwth online!
Important to get email announcements and moodle access!
2B. Leibe
Pe
rce
ptu
al
an
d S
en
so
ry A
ug
me
nte
d C
om
pu
tin
gM
ach
ine
Le
arn
ing
Win
ter
‘19
Course Outline
• Fundamentals
Bayes Decision Theory
Probability Density Estimation
• Classification Approaches
Linear Discriminants
Support Vector Machines
Ensemble Methods & Boosting
Randomized Trees, Forests & Ferns
• Deep Learning
Foundations
Convolutional Neural Networks
Recurrent Neural Networks
3B. Leibe
Pe
rce
ptu
al
an
d S
en
so
ry A
ug
me
nte
d C
om
pu
tin
gM
ach
ine
Le
arn
ing
Win
ter
‘19
Topics of This Lecture
• Bayes Decision Theory Basic concepts
Minimizing the misclassification rate
Minimizing the expected loss
Discriminant functions
• Probability Density Estimation General concepts
Gaussian distribution
• Parametric Methods Maximum Likelihood approach
Bayesian vs. Frequentist views on probability
4B. Leibe
Pe
rce
ptu
al
an
d S
en
so
ry A
ug
me
nte
d C
om
pu
tin
gM
ach
ine
Le
arn
ing
Win
ter
‘19
Recap: The Rules of Probability
• We have shown in the last lecture
• From those, we can derive
5B. Leibe
Sum Rule
Product Rule
Bayes’ Theorem
where
Pe
rce
ptu
al
an
d S
en
so
ry A
ug
me
nte
d C
om
pu
tin
gM
ach
ine
Le
arn
ing
Win
ter
‘19
Probability Densities
• Probabilities over continuous
variables are defined over their
probability density function
(pdf) .
• The probability that x lies in the interval is given by
the cumulative distribution function
6
( , )z
B. Leibe Image source: C.M. Bishop, 2006

2
Pe
rce
ptu
al
an
d S
en
so
ry A
ug
me
nte
d C
om
pu
tin
gM
ach
ine
Le
arn
ing
Win
ter
‘19
Expectations
• The average value of some function under a
probability distribution is called its expectation
• If we have a finite number N of samples drawn from a pdf,
then the expectation can be approximated by
• We can also consider a conditional expectation
7
( )p x( )f x
discrete case continuous case
B. Leibe
Pe
rce
ptu
al
an
d S
en
so
ry A
ug
me
nte
d C
om
pu
tin
gM
ach
ine
Le
arn
ing
Win
ter
‘19
Variances and Covariances
• The variance provides a measure how much variability there
is in around its mean value .
• For two random variables x and y, the covariance is defined
by
• If x and y are vectors, the result is a covariance matrix
8B. Leibe
Pe
rce
ptu
al
an
d S
en
so
ry A
ug
me
nte
d C
om
pu
tin
gM
ach
ine
Le
arn
ing
Win
ter
‘19
Bayes Decision Theory
17B. Leibe
Thomas Bayes, 1701-1761
Image source: Wikipedia
“The theory of inverse probability is founded upon an
error, and must be wholly rejected.”
R.A. Fisher, 1925
Pe
rce
ptu
al
an
d S
en
so
ry A
ug
me
nte
d C
om
pu
tin
gM
ach
ine
Le
arn
ing
Win
ter
‘19
Bayes Decision Theory
• Example: handwritten character recognition
• Goal:
Classify a new letter such that the probability of misclassification is
minimized.
18B. LeibeSlide credit: Bernt Schiele Image source: C.M. Bishop, 2006
Pe
rce
ptu
al
an
d S
en
so
ry A
ug
me
nte
d C
om
pu
tin
gM
ach
ine
Le
arn
ing
Win
ter
‘19
Bayes Decision Theory
• Concept 1: Priors (a priori probabilities)
What we can tell about the probability before seeing the data.
Example:
• In general:
19B. Leibe
kp C
1
2
0.75
0.25
p C
p C
1
2
C a
C b
1k
k
p C
Slide credit: Bernt Schiele
Pe
rce
ptu
al
an
d S
en
so
ry A
ug
me
nte
d C
om
pu
tin
gM
ach
ine
Le
arn
ing
Win
ter
‘19
Bayes Decision Theory
• Concept 2: Conditional probabilities
Let x be a feature vector.
x measures/describes certain properties of the input.
– E.g. number of black pixels, aspect ratio, …
p(x|Ck) describes its likelihood for class Ck.
20B. Leibe
| kp x C
x
|p x b
|p x a
x
Slide credit: Bernt Schiele

3
Pe
rce
ptu
al
an
d S
en
so
ry A
ug
me
nte
d C
om
pu
tin
gM
ach
ine
Le
arn
ing
Win
ter
‘19
Bayes Decision Theory
• Example:
• Question:
Which class?
Since is much smaller than , the decision
should be ‘a’ here.
21B. Leibe
|p x a |p x b
15x
Slide credit: Bernt Schiele
|p x a |p x b
Pe
rce
ptu
al
an
d S
en
so
ry A
ug
me
nte
d C
om
pu
tin
gM
ach
ine
Le
arn
ing
Win
ter
‘19
Bayes Decision Theory
• Example:
• Question:
Which class?
Since is much smaller than , the decision
should be ‘b’ here.
22B. Leibe
|p x a |p x b
25x
|p x a |p x b
Slide credit: Bernt Schiele
Pe
rce
ptu
al
an
d S
en
so
ry A
ug
me
nte
d C
om
pu
tin
gM
ach
ine
Le
arn
ing
Win
ter
‘19
Bayes Decision Theory
• Example:
• Question:
Which class?
Remember that p(a) = 0.75 and p(b) = 0.25…
I.e., the decision should be again ‘a’.
How can we formalize this?
23B. Leibe
|p x a |p x b
20x
Slide credit: Bernt Schiele
Pe
rce
ptu
al
an
d S
en
so
ry A
ug
me
nte
d C
om
pu
tin
gM
ach
ine
Le
arn
ing
Win
ter
‘19
Bayes Decision Theory
• Concept 3: Posterior probabilities
We are typically interested in the a posteriori probability, i.e., the probability of class Ck given the measurement vector x.
• Bayes’ Theorem:
• Interpretation
24B. Leibe
| ||
|
k k k k
k
i i
i
p x C p C p x C p Cp C x
p x p x C p C
Likelihood PriorPosterior
Normalization Factor
|kp C x
Slide credit: Bernt Schiele
Pe
rce
ptu
al
an
d S
en
so
ry A
ug
me
nte
d C
om
pu
tin
gM
ach
ine
Le
arn
ing
Win
ter
‘19
Bayes Decision Theory
25B. Leibe
x
x
x
|p x a |p x b
| ( )p x a p a
| ( )p x b p b
|p a x |p b x
Decision boundary
Likelihood
Posterior =Likelihood £ Prior
NormalizationFactor
Likelihood £Prior
Slide credit: Bernt Schiele
Pe
rce
ptu
al
an
d S
en
so
ry A
ug
me
nte
d C
om
pu
tin
gM
ach
ine
Le
arn
ing
Win
ter
‘19
Bayesian Decision Theory
• Goal: Minimize the probability of a misclassification
26B. Leibe
=
Z
R1
p(C2jx)p(x)dx+
Z
R2
p(C1jx)p(x)dx
The green and blue
regions stay constant.
Only the size of the
red region varies!
Image source: C.M. Bishop, 2006
How does
𝑝(mistake) change
when we move ො𝑥?
Decision rule:
𝑥 < ො𝑥 𝒞1𝑥 ≥ ො𝑥 𝒞2

4
Pe
rce
ptu
al
an
d S
en
so
ry A
ug
me
nte
d C
om
pu
tin
gM
ach
ine
Le
arn
ing
Win
ter
‘19
Bayes Decision Theory
• Optimal decision rule
Decide for C1 if
This is equivalent to
Which is again equivalent to (Likelihood-Ratio test)
27B. Leibe
p(C1jx) > p(C2jx)
p(xjC1)p(C1) > p(xjC2)p(C2)
p(xjC1)p(xjC2)
>p(C2)p(C1)
Decision threshold
Slide credit: Bernt Schiele
Pe
rce
ptu
al
an
d S
en
so
ry A
ug
me
nte
d C
om
pu
tin
gM
ach
ine
Le
arn
ing
Win
ter
‘19
Generalization to More Than 2 Classes
• Decide for class k whenever it has the greatest posterior
probability of all classes:
• Likelihood-ratio test
28B. Leibe
p(Ckjx) > p(Cjjx) 8j 6= k
p(xjCk)p(Ck) > p(xjCj)p(Cj) 8j 6= k
p(xjCk)p(xjCj)
>p(Cj)p(Ck)
8j 6= k
Slide credit: Bernt Schiele
Pe
rce
ptu
al
an
d S
en
so
ry A
ug
me
nte
d C
om
pu
tin
gM
ach
ine
Le
arn
ing
Win
ter
‘19
Classifying with Loss Functions
• Generalization to decisions with a loss function
Differentiate between the possible decisions and the possible true
classes.
Example: medical diagnosis
– Decisions: sick or healthy (or: further examination necessary)
– Classes: patient is sick or healthy
The cost may be asymmetric:
29B. Leibe
loss(decision = healthyjpatient = sick) >>
loss(decision = sick jpatient = healthy)
Slide credit: Bernt Schiele
Pe
rce
ptu
al
an
d S
en
so
ry A
ug
me
nte
d C
om
pu
tin
gM
ach
ine
Le
arn
ing
Win
ter
‘19
Classifying with Loss Functions
• In general, we can formalize this by introducing a loss matrix Lkj
• Example: cancer diagnosis
30B. Leibe
Decision
Tru
thLcancer diagnosis =
Lkj = loss for decision Cj if truth is Ck:
Pe
rce
ptu
al
an
d S
en
so
ry A
ug
me
nte
d C
om
pu
tin
gM
ach
ine
Le
arn
ing
Win
ter
‘19
Classifying with Loss Functions
• Loss functions may be different for different actors.
Example:
Different loss functions may lead to different Bayes optimal
strategies.
31B. Leibe
Lstocktrader (subprime) =
µ¡12cgain 0
0 0
¶
Lbank (subprime) =
µ¡12cgain 0
0
¶
“invest”“don’t
invest”
Pe
rce
ptu
al
an
d S
en
so
ry A
ug
me
nte
d C
om
pu
tin
gM
ach
ine
Le
arn
ing
Win
ter
‘19
Minimizing the Expected Loss
• Optimal solution is the one that minimizes the loss.
But: loss function depends on the true class, which is unknown.
• Solution: Minimize the expected loss
• This can be done by choosing the regions such that
which is easy to do once we know the posterior class
probabilities .
32B. Leibe
Rj
p(Ckjx)

5
Pe
rce
ptu
al
an
d S
en
so
ry A
ug
me
nte
d C
om
pu
tin
gM
ach
ine
Le
arn
ing
Win
ter
‘19
Minimizing the Expected Loss
• Example:
2 Classes: C1, C2
2 Decision: ®1, ®2
Loss function:
Expected loss (= risk R) for the two decisions:
• Goal: Decide such that expected loss is minimized
I.e. decide ®1 if
33B. Leibe
L(®jjCk) = Lkj
Slide credit: Bernt Schiele
Pe
rce
ptu
al
an
d S
en
so
ry A
ug
me
nte
d C
om
pu
tin
gM
ach
ine
Le
arn
ing
Win
ter
‘19
Minimizing the Expected Loss
Adapted decision rule taking into account the loss.
34B. Leibe
R(®2jx) > R(®1jx)L12p(C1jx) +L22p(C2jx) > L11p(C1jx) +L21p(C2jx)
(L12 ¡L11)p(C1jx) > (L21¡L22)p(C2jx)(L12 ¡L11)
(L21 ¡L22)>
p(C2jx)p(C1jx)
=p(xjC2)p(C2)p(xjC1)p(C1)
p(xjC1)p(xjC2)
>(L21 ¡L22)
(L12 ¡L11)
p(C2)p(C1)
Slide credit: Bernt Schiele
Pe
rce
ptu
al
an
d S
en
so
ry A
ug
me
nte
d C
om
pu
tin
gM
ach
ine
Le
arn
ing
Win
ter
‘19
The Reject Option
• Classification errors arise from regions where the largest
posterior probability is significantly less than 1.
These are the regions where we are relatively uncertain about
class membership.
For some applications, it may be better to reject the automatic
decision entirely in such a case and, e.g., consult a human expert.35
B. Leibe
p(Ckjx)
Image source: C.M. Bishop, 2006
Pe
rce
ptu
al
an
d S
en
so
ry A
ug
me
nte
d C
om
pu
tin
gM
ach
ine
Le
arn
ing
Win
ter
‘19
Discriminant Functions
• Formulate classification in terms of comparisons
Discriminant functions
Classify x as class Ck if
• Examples (Bayes Decision Theory)
36B. Leibe
y1(x); : : : ; yK(x)
yk(x) > yj(x) 8j 6= k
yk(x) = p(Ckjx)yk(x) = p(xjCk)p(Ck)yk(x) = log p(xjCk) + log p(Ck)
Slide credit: Bernt Schiele
Pe
rce
ptu
al
an
d S
en
so
ry A
ug
me
nte
d C
om
pu
tin
gM
ach
ine
Le
arn
ing
Win
ter
‘19
Different Views on the Decision Problem
• First determine the class-conditional densities for each class
individually and separately infer the prior class probabilities.
Then use Bayes’ theorem to determine class membership.
Generative methods
• First solve the inference problem of determining the posterior class
probabilities.
Then use decision theory to assign each new x to its class.
Discriminative methods
• Alternative
Directly find a discriminant function which maps each input x
directly onto a class label.
37B. Leibe
yk(x) / p(xjCk)p(Ck)
yk(x) = p(Ckjx)
yk(x)
Pe
rce
ptu
al
an
d S
en
so
ry A
ug
me
nte
d C
om
pu
tin
gM
ach
ine
Le
arn
ing
Win
ter
‘19
Topics of This Lecture
• Bayes Decision Theory Basic concepts
Minimizing the misclassification rate
Minimizing the expected loss
Discriminant functions
• Probability Density Estimation General concepts
Gaussian distribution
• Parametric Methods Maximum Likelihood approach
Bayesian vs. Frequentist views on probability
Bayesian Learning
38B. Leibe

6
Pe
rce
ptu
al
an
d S
en
so
ry A
ug
me
nte
d C
om
pu
tin
gM
ach
ine
Le
arn
ing
Win
ter
‘19
Probability Density Estimation
• Up to now
Bayes optimal classification
Based on the probabilities
• How can we estimate (= learn) those probability densities?
Supervised training case: data and class labels are known.
Estimate the probability density for each class separately:
(For simplicity of notation, we will drop the class label in the
following.)
39B. Leibe
p(xjCk)p(Ck)
p(xjCk)Ck
Ck
Slide credit: Bernt Schiele
Pe
rce
ptu
al
an
d S
en
so
ry A
ug
me
nte
d C
om
pu
tin
gM
ach
ine
Le
arn
ing
Win
ter
‘19
Probability Density Estimation
• Data: x1, x2, x3, x4, …
• Estimate: p(x)
• Methods
Parametric representations (today)
Non-parametric representations (lecture 3)
Mixture models (lecture 4)
40B. Leibe
x
x
Slide credit: Bernt Schiele
Pe
rce
ptu
al
an
d S
en
so
ry A
ug
me
nte
d C
om
pu
tin
gM
ach
ine
Le
arn
ing
Win
ter
‘19
The Gaussian (or Normal) Distribution
• One-dimensional case
Mean ¹
Variance ¾2
• Multi-dimensional case
Mean ¹
Covariance §
41B. Leibe
N (xj¹; ¾2) = 1p2¼¾
exp
½¡(x¡ ¹)2
2¾2
¾
N(xj¹;§) =1
(2¼)D=2j§j1=2 exp
½¡1
2(x¡¹)T§¡1(x¡¹)
¾
Image source: C.M. Bishop, 2006
Pe
rce
ptu
al
an
d S
en
so
ry A
ug
me
nte
d C
om
pu
tin
gM
ach
ine
Le
arn
ing
Win
ter
‘19
Gaussian Distribution – Properties
• Central Limit Theorem
“The distribution of the sum of N i.i.d. random variables becomes
increasingly Gaussian as N grows.”
In practice, the convergence to a Gaussian can be very rapid.
This makes the Gaussian interesting for many applications.
• Example: N uniform [0,1] random variables.
42B. Leibe Image source: C.M. Bishop, 2006
Pe
rce
ptu
al
an
d S
en
so
ry A
ug
me
nte
d C
om
pu
tin
gM
ach
ine
Le
arn
ing
Win
ter
‘19
Gaussian Distribution – Properties
• Quadratic Form N depends on x through the exponent
Here, M is often called the
Mahalanobis distance from x to ¹.
• Shape of the Gaussian
§ is a real, symmetric matrix.
We can therefore decompose it into its eigenvectors
and thus obtain with .
Constant density on ellipsoids with main directions along the eigenvectors ui and scaling factors . 43
§ =
DX
i=1
¸iuiuTi
p¸i
Image source: C.M. Bishop, 2006
Pe
rce
ptu
al
an
d S
en
so
ry A
ug
me
nte
d C
om
pu
tin
gM
ach
ine
Le
arn
ing
Win
ter
‘19
Gaussian Distribution – Properties
• Special cases
Full covariance matrix
General ellipsoid shape
Diagonal covariance matrix
Axis-aligned ellipsoid
Uniform variance
Hypersphere
44B. Leibe
§= diagf¾ig
§= ¾2I
§= [¾ij]
Image source: C.M. Bishop, 2006
7
Pe
rce
ptu
al
an
d S
en
so
ry A
ug
me
nte
d C
om
pu
tin
gM
ach
ine
Le
arn
ing
Win
ter
‘19
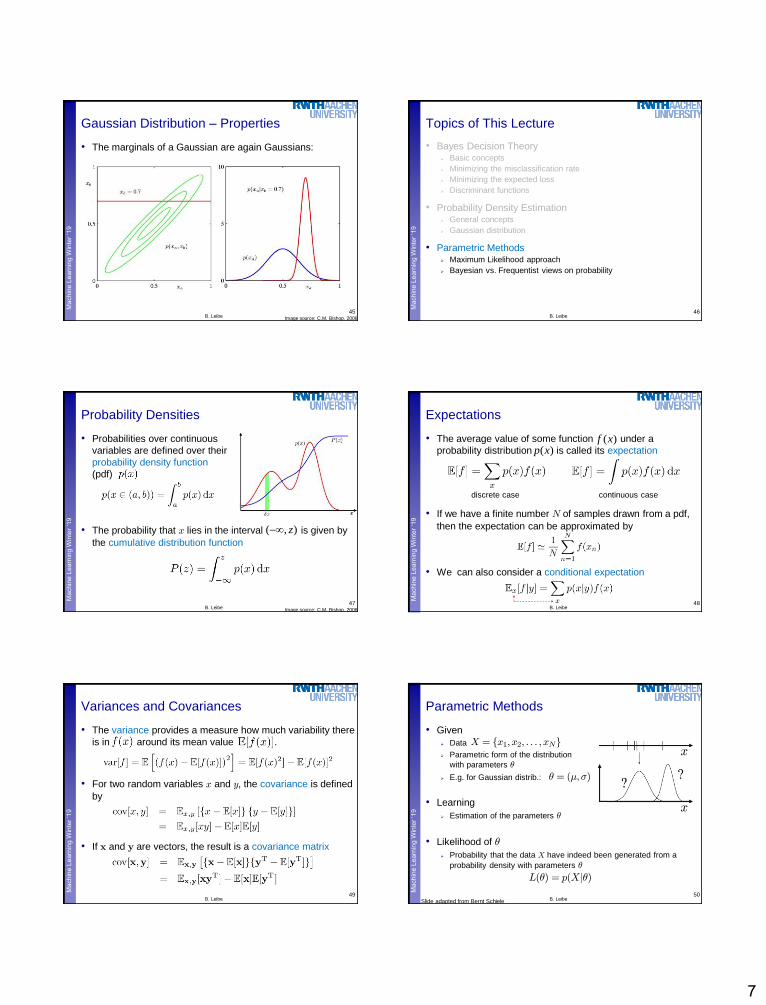
Gaussian Distribution – Properties
• The marginals of a Gaussian are again Gaussians:
45B. Leibe Image source: C.M. Bishop, 2006
Pe
rce
ptu
al
an
d S
en
so
ry A
ug
me
nte
d C
om
pu
tin
gM
ach
ine
Le
arn
ing
Win
ter
‘19
Topics of This Lecture
• Bayes Decision Theory Basic concepts
Minimizing the misclassification rate
Minimizing the expected loss
Discriminant functions
• Probability Density Estimation General concepts
Gaussian distribution
• Parametric Methods Maximum Likelihood approach
Bayesian vs. Frequentist views on probability
46B. Leibe
Pe
rce
ptu
al
an
d S
en
so
ry A
ug
me
nte
d C
om
pu
tin
gM
ach
ine
Le
arn
ing
Win
ter
‘19
Probability Densities
• Probabilities over continuous
variables are defined over their
probability density function
(pdf) .
• The probability that x lies in the interval is given by
the cumulative distribution function
47
( , )z
B. Leibe Image source: C.M. Bishop, 2006
Pe
rce
ptu
al
an
d S
en
so
ry A
ug
me
nte
d C
om
pu
tin
gM
ach
ine
Le
arn
ing
Win
ter
‘19
Expectations
• The average value of some function under a
probability distribution is called its expectation
• If we have a finite number N of samples drawn from a pdf,
then the expectation can be approximated by
• We can also consider a conditional expectation
48
( )p x( )f x
discrete case continuous case
B. Leibe
Pe
rce
ptu
al
an
d S
en
so
ry A
ug
me
nte
d C
om
pu
tin
gM
ach
ine
Le
arn
ing
Win
ter
‘19
Variances and Covariances
• The variance provides a measure how much variability there
is in around its mean value .
• For two random variables x and y, the covariance is defined
by
• If x and y are vectors, the result is a covariance matrix
49B. Leibe
Pe
rce
ptu
al
an
d S
en
so
ry A
ug
me
nte
d C
om
pu
tin
gM
ach
ine
Le
arn
ing
Win
ter
‘19
Parametric Methods
• Given
Data
Parametric form of the distribution
with parameters µ
E.g. for Gaussian distrib.:
• Learning
Estimation of the parameters µ
• Likelihood of µ
Probability that the data X have indeed been generated from a
probability density with parameters µ
50B. Leibe
x
xX = fx1; x2; : : : ; xNg
µ = (¹;¾)
L(µ) = p(Xjµ)
Slide adapted from Bernt Schiele

8
Pe
rce
ptu
al
an
d S
en
so
ry A
ug
me
nte
d C
om
pu
tin
gM
ach
ine
Le
arn
ing
Win
ter
‘19
E(µ) = ¡ lnL(µ) = ¡NX
n=1
ln p(xnjµ)
Maximum Likelihood Approach
• Computation of the likelihood
Single data point:
Assumption: all data points are independent
Log-likelihood
Estimation of the parameters µ (Learning)
– Maximize the likelihood
– Minimize the negative log-likelihood
51B. Leibe
L(µ) = p(Xjµ) =NY
n=1
p(xnjµ)
p(xnjµ)
Slide credit: Bernt Schiele
Pe
rce
ptu
al
an
d S
en
so
ry A
ug
me
nte
d C
om
pu
tin
gM
ach
ine
Le
arn
ing
Win
ter
‘19
Maximum Likelihood Approach
• Likelihood:
• We want to obtain such that is maximized.
52B. Leibe
L(µ) = p(Xjµ) =NY
n=1
p(xnjµ)
L(µ̂)µ̂
µ̂
p(Xjµ)
µ
Slide credit: Bernt Schiele
Pe
rce
ptu
al
an
d S
en
so
ry A
ug
me
nte
d C
om
pu
tin
gM
ach
ine
Le
arn
ing
Win
ter
‘19
Maximum Likelihood Approach
• Minimizing the log-likelihood
How do we minimize a function?
Take the derivative and set it to zero.
• Log-likelihood for Normal distribution (1D case)
53B. Leibe
E(µ) = ¡NX
n=1
ln p(xnj¹; ¾)
= ¡NX
n=1
ln
µ1p2¼¾
exp
½¡jjxn ¡ ¹jj2
2¾2
¾¶
@
@µE(µ) = ¡ @
@µ
NX
n=1
lnp(xnjµ) = ¡NX
n=1
@@µp(xnjµ)p(xnjµ)
!= 0
Pe
rce
ptu
al
an
d S
en
so
ry A
ug
me
nte
d C
om
pu
tin
gM
ach
ine
Le
arn
ing
Win
ter
‘19
Maximum Likelihood Approach
• Minimizing the log-likelihood
54B. Leibe
@
@¹E(¹; ¾) = ¡
NX
n=1
@@¹p(xnj¹; ¾)
p(xnj¹; ¾)
= ¡NX
n=1
¡2(xn ¡ ¹)
2¾2
=1
¾2
NX
n=1
(xn ¡ ¹)
=1
¾2
ÃNX
n=1
xn ¡N¹
!
p(xnj¹; ¾) =1p2¼¾
e¡ jjxn¡¹jj2
2¾2@
@¹E(¹; ¾) = ¡
NX
n=1
@@¹p(xnj¹; ¾)
p(xnj¹; ¾)
= ¡NX
n=1
¡2(xn ¡ ¹)
2¾2
=1
¾2
NX
n=1
(xn ¡ ¹)
=1
¾
ÃNX
n=1
xn ¡N¹
!
@
@¹E(¹; ¾) = ¡
NX
n=1
@@¹p(xnj¹; ¾)
p(xnj¹; ¾)
= ¡NX
n=1
¡2(xn ¡ ¹)
2¾2
=1
¾
NX
n=1
(xn ¡ ¹)
=1
¾
ÃNX
n=1
xn ¡N¹
!
@
@¹E(¹; ¾) = ¡
NX
n=1
@@¹p(xnj¹; ¾)
p(xnj¹; ¾)
= ¡NX
n=1
¡2(xn ¡ ¹)
2¾2
=1
¾
NX
n=1
(xn ¡ ¹)
=1
¾
ÃNX
n=1
xn ¡N¹
!
Pe
rce
ptu
al
an
d S
en
so
ry A
ug
me
nte
d C
om
pu
tin
gM
ach
ine
Le
arn
ing
Win
ter
‘19
Maximum Likelihood Approach
• We thus obtain
• In a similar fashion, we get
• is the Maximum Likelihood estimate for the
parameters of a Gaussian distribution.
• This is a very important result.
• Unfortunately, it is wrong…
55B. Leibe
¹̂ =1
N
NX
n=1
xn
¾̂2 =1
N
NX
n=1
(xn ¡ ¹̂)2
“sample mean”
“sample variance”
µ̂ = (¹̂; ¾̂)
Pe
rce
ptu
al
an
d S
en
so
ry A
ug
me
nte
d C
om
pu
tin
gM
ach
ine
Le
arn
ing
Win
ter
‘19
Maximum Likelihood Approach
• Or not wrong, but rather biased…
• Assume the samples x1, x2, …, xN come from a true
Gaussian distribution with mean ¹ and variance ¾2
We can now compute the expectations of the ML estimates with
respect to the data set values. It can be shown that
The ML estimate will underestimate the true variance.
• Corrected estimate:
56B. Leibe
E(¹ML) = ¹
E(¾2ML) =
µN ¡ 1
N
¶¾2
~¾2 =N
N ¡ 1¾2ML =
1
N ¡ 1
NX
n=1
(xn ¡ ¹̂)2

9
Pe
rce
ptu
al
an
d S
en
so
ry A
ug
me
nte
d C
om
pu
tin
gM
ach
ine
Le
arn
ing
Win
ter
‘19
Maximum Likelihood – Limitations
• Maximum Likelihood has several significant limitations
It systematically underestimates the variance of the distribution!
E.g. consider the case
Maximum-likelihood estimate:
We say ML overfits to the observed data.
We will still often use ML, but it is important to know about
this effect.
57B. Leibe
xN = 1;X = fx1g
x
¾̂ = 0 !
¹̂
Slide adapted from Bernt Schiele
Pe
rce
ptu
al
an
d S
en
so
ry A
ug
me
nte
d C
om
pu
tin
gM
ach
ine
Le
arn
ing
Win
ter
‘19
Deeper Reason
• Maximum Likelihood is a Frequentist concept
In the Frequentist view, probabilities are the frequencies of random,
repeatable events.
These frequencies are fixed, but can be estimated more precisely
when more data is available.
• This is in contrast to the Bayesian interpretation
In the Bayesian view, probabilities quantify the uncertainty about
certain states or events.
This uncertainty can be revised in the light of new evidence.
• Bayesians and Frequentists do not like
each other too well…
58B. Leibe
Pe
rce
ptu
al
an
d S
en
so
ry A
ug
me
nte
d C
om
pu
tin
gM
ach
ine
Le
arn
ing
Win
ter
‘19
Bayesian vs. Frequentist View
• To see the difference…
Suppose we want to estimate the uncertainty whether the Arctic ice
cap will have disappeared by the end of the century.
This question makes no sense in a Frequentist view, since the event
cannot be repeated numerous times.
In the Bayesian view, we generally have a prior,
e.g., from calculations how fast the polar ice is melting.
If we now get fresh evidence, e.g., from a new satellite, we may
revise our opinion and update the uncertainty from the prior.
This generally allows to get better uncertainty estimates for
many situations.
• Main Frequentist criticism
The prior has to come from somewhere and if it is wrong, the result
will be worse.59
B. Leibe
Posterior / Likelihood £Prior
Pe
rce
ptu
al
an
d S
en
so
ry A
ug
me
nte
d C
om
pu
tin
gM
ach
ine
Le
arn
ing
Win
ter
‘19
Bayesian Approach to Parameter Learning
• Conceptual shift
Maximum Likelihood views the true parameter vector µ to be
unknown, but fixed.
In Bayesian learning, we consider µ to be a random variable.
• This allows us to use knowledge about the parameters µ
i.e. to use a prior for µ
Training data then converts this
prior distribution on µ into
a posterior probability density.
The prior thus encodes knowledge we have about the type of
distribution we expect to see for µ.60
B. LeibeSlide adapted from Bernt Schiele
Pe
rce
ptu
al
an
d S
en
so
ry A
ug
me
nte
d C
om
pu
tin
gM
ach
ine
Le
arn
ing
Win
ter
‘19
Bayesian Learning
• Bayesian Learning is an important concept
However, it would lead to far here.
I will introduce it in more detail in the Advanced ML lecture.
61B. Leibe
Pe
rce
ptu
al
an
d S
en
so
ry A
ug
me
nte
d C
om
pu
tin
gM
ach
ine
Le
arn
ing
Win
ter
‘19
References and Further Reading
• More information in Bishop’s book
Gaussian distribution and ML: Ch. 1.2.4 and 2.3.1-2.3.4.
Bayesian Learning: Ch. 1.2.3 and 2.3.6.
Nonparametric methods: Ch. 2.5.
90B. Leibe
Christopher M. Bishop
Pattern Recognition and Machine Learning
Springer, 2006