maastrichtian carbon isotope stratigraphy and cyclostratigraphy of
TRANSCRIPT
1
Maastrichtian carbon isotope stratigraphy and cyclostratigraphy of the Newfoundland Margin (Site U1403, IODP Leg 342) Oliver Friedrich1, Sietske J. Batenburg2,3, Kazuyoshi Moriya4, Silke Voigt2, Cécile Cournède5, Iris Moebius1,6, Peter Blum7, André Bornemann8, Jens Fiebig2, Takashi Hasegawa4, Pincelli 5 M. Hull9, Richard D. Norris10, Ursula Röhl11, Thomas Westerhold11, Paul A. Wilson12 and the IODP Expedition 342 Scientists 1 Institute of Earth Sciences, Ruprecht-Karls-University Heidelberg, Im Neuenheimer Feld 234-236, 69120 Heidelberg, Germany 2 Institute of Geosciences, Goethe-University Frankfurt, Altenhöferallee 1, 60438 Frankfurt am Main, Germany 10 3 present address: Department of Earth Sciences, University of Oxford, South Parks Road, Oxford OX1 3AN, United Kingdom 4 School of Natural Sciences and Technology, Kanazawa University, Kakuma-machi, Kanazawa, Ishikawa 920-1192, Japan 5 CEREGE, Université Aix-Marseille, Europole de l’Arbois BP 80 1, 13545 Aix en Provence, France 15 6 present address: Lamont-Doherty Earth Observatory, Columbia University, 61 Route 9W, Palisades NY 10964, USA 7 Integrated Ocean Drilling Program, Texas A&M, 1000 Discovery Drive, College Station, TX 77845-9547, USA. 8 Bundesanstalt für Geowissenschaften und Rohstoffe, Stilleweg 2, 30655 Hannover, Germany 20 9 Department of Geology and Geophysics, Yale University, 210 Whitney Ave, New Haven, CT 06511, USA. 10 Scripps Institution of Oceanography, University of California San Diego, 9500 Gilman Drive, La Jolla, CA 92093-0244, USA. 11 MARUM, University Bremen, Leobener Strasse, 28359 Bremen, Germany 12 National Oceanography Centre Southampton, University of Southampton, Waterfront Campus, European Way, 25 Southampton SO14 3ZH, UK
Correspondence to: Oliver Friedrich ([email protected])
Clim. Past Discuss., doi:10.5194/cp-2016-51, 2016Manuscript under review for journal Clim. PastPublished: 18 May 2016c© Author(s) 2016. CC-BY 3.0 License.
2
Abstract. Earth’s climate during the Maastrichtian (latest Cretaceous) was punctuated by brief warming and
cooling episodes, accompanied by perturbations of the global carbon cycle. Superimposed on a long-term
cooling trend, the middle Maastrichtian is characterized by deep-sea warming and relatively high values of stable
carbon-isotope ratios, followed by strong climatic variability towards the end of the Cretaceous. A lack of
knowledge on the timing of climatic change inhibits our understanding of underlying causal mechanisms. We 5 present an integrated stratigraphy from Site U1403, providing an expanded deep ocean record from the North
Atlantic (IODP Expedition 342, Newfoundland Margin). Distinct sedimentary cyclicity suggests that orbital
forcing played a major role on depositional processes, which is confirmed by statistical analyses of high
resolution elemental data obtained by X-ray fluorescence (XRF) scanning. Astronomical calibration reveals that
the investigated interval encompasses seven 405-kyr cycles (Ma4051 to Ma4057) and spans 2.8 Myr directly 10 preceding the Cretaceous/Paleocene (K/Pg) boundary. A high-resolution carbon-isotope record from bulk
carbonates allows to identify global trends in the late Maastrichtian carbon cycle. Low-amplitude variations (up
to 0.4 ‰), typical for open ocean settings, are compared to the hemipelagic Zumaia section (N-Spain), with a
well-established independent cyclostratigraphic framework. Whereas the pre-K/Pg oscillations and the negative
values of the Mid-Maastrichtian Event (MME) can be readily discerned in both records, patterns diverge around 15 67.5 Ma, with Site U1403 more reliably reflecting global climate change. Our new carbon isotope record and the
established cyclostratigraphy from Site U1403 may serve as a future reference for detailed studies of late
Maastrichtian events in the North Atlantic.
1 Introduction
Following the high temperatures of the mid-Cretaceous greenhouse (e.g., Wilson et al., 2002; Forster et al., 20 2007; Bornemann et al., 2008; Friedrich et al., 2008), the latest Cretaceous is characterized by long-term climate
cooling culminating in the late Campanian to Maastrichtian (e.g., Clarke and Jenkyns, 1999; Huber et al., 2002;
Friedrich et al., 2012). Superimposed on this long-term trend are several short-term cooling pulses with the most
pronounced episode occurring across the Campanian-Maastrichtian boundary (the so-called Campanian-
Maastrichtian Boundary Event, CMBE). The CMBE is characterized by distinct changes in stable oxygen and 25 carbon isotope records, indicating deep-water cooling and changing rates of organic carbon burial (e.g., Barrera
et al., 1997; Frank and Arthur, 1999; Barrera and Savin, 1999; Friedrich et al., 2004, 2009; Frank et al., 2005;
Friedrich and Hemleben, 2007; Voigt et al., 2012; Jung et al., 2013). Shortly after the CMBE, the Mid-
Maastrichtian Event (MME; MacLeod et al., 1996) marks a time of deep-sea warming (Jung et al., 2013) and the
acme occurrence of inoceramid bivalves in numerous open-ocean sites (e.g., MacLeod 1994; MacLeod et al., 30 1996).
Although the CMBE and MME have been studied extensively (Jung et al., 2013, and references therein), the
causal mechanisms triggering the events are still poorly understood due to poor constraints on timing. The low
temporal resolution of Maastrichtian biozones and pronounced biotic provincialism complicate correlation
further. This provincialism is related to the latest Cretaceous climate cooling which resulted in the formation of 35 three main provinces (Tethyan, Boreal and Austral; e.g., Huber and Watkins, 1992; Premoli Silva and Sliter,
1994; Burnett, 1998; Lees, 2002; Lees and Bown, 2005). To overcome the limitations of insufficient age models
and biotic provincialism, high-resolution carbon isotope curves have recently been used for detailed stratigraphic
correlation of Maastrichtian sections representing a variety of depositional settings (e.g., Voigt et al., 2010,
Clim. Past Discuss., doi:10.5194/cp-2016-51, 2016Manuscript under review for journal Clim. PastPublished: 18 May 2016c© Author(s) 2016. CC-BY 3.0 License.
3
2012; Batenburg et al., 2012; Jung et al., 2012; Thibault et al., 2012a, b). Successful correlation of carbon
isotope curves from the European shelf seas with datasets derived from deep-sea sediments in the tropical
Pacific Ocean proved the usefulness and accuracy of this approach (Voigt et al., 2010, 2012). Furthermore, an
astronomical age scale has been established for the Maastrichtian (Batenburg et al., 2012, 2014) that allows the
reconstruction of the spatial and temporal extent of Maastrichtian events. 5 Here, we present a new, high-resolution carbon isotope dataset from bulk sediments of Integrated Ocean Drilling
Program (IODP) Site U1403 that records carbon-cycle fluctuations in the late Maastrichtian North Atlantic off
Newfoundland. Site U1403 provides an exceptional record of rhythmic and continuous sedimentation and
provides the northernmost high-resolution deep-ocean record to date. Our findings show a good match between
the carbon isotope dataset of Site U1403 with the high-resolution chemostratigraphic framework of the Zumaia 10 section (northern Spain; Batenburg et al., 2012, 2014). Furthermore, an orbital timescale for the Upper
Maastrichtian interval of Site U1403 based on high-resolution X-ray fluorescence (XRF) core scanning data
independently supports the presented carbon isotope stratigraphy through the identification of hierarchical
Milankovitch cycles. It correlates well to the available orbital age model for Zumaia (Batenburg et al., 2014).
2 Geological setting 15
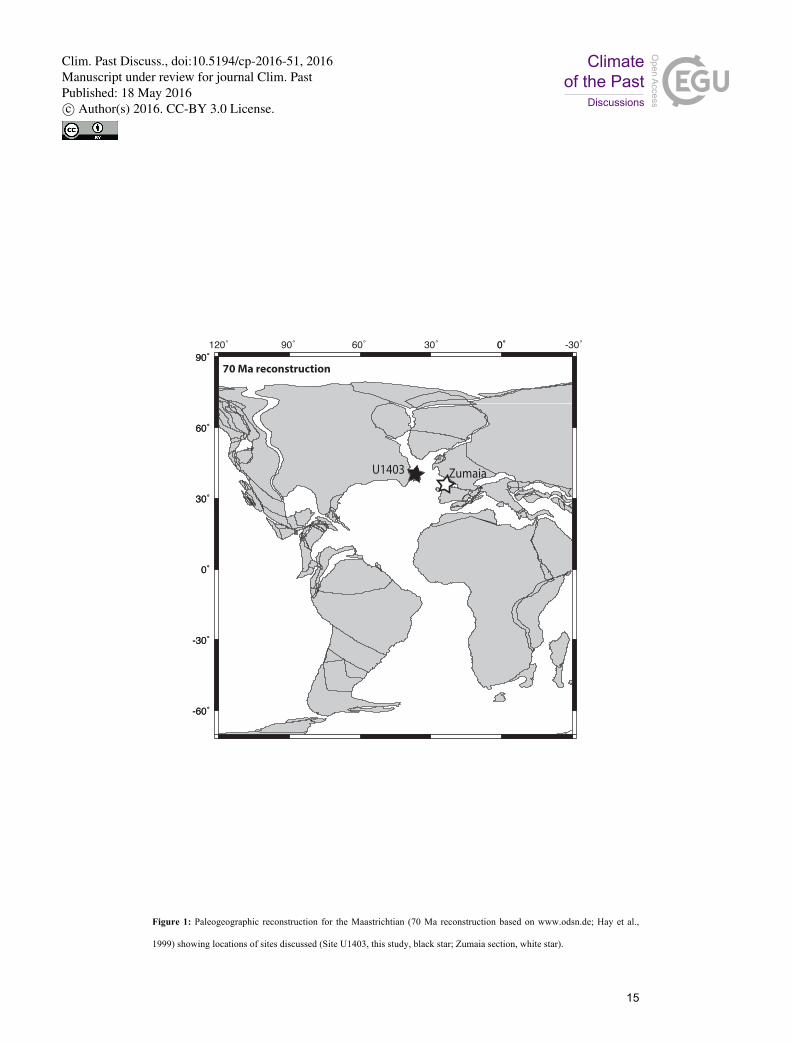
Integrated Ocean Drilling Program Site U1403 (39°56.60'N, 51°48.20'W) is positioned at the foot of the J
Anomaly Ridge off Newfoundland (Fig. 1). It was drilled in 2012 during IODP Expedition 342 in a present-day
water depth of 4949 m and is the deepest site that was drilled along the Newfoundland sediment drifts depth
transect (Expedition 342 Scientists, 2012).
Maastrichtian-aged sediments at Site U1403 are nannofossil chalks that show subtle, decimeter-scale rhythmic 20 color variations between pale yellow to very pale brown (lithological Unit Vb of Site U1403; see Expedition 342
Scientists (2012) for a detailed description of lithostratigraphic units). Calcium carbonate content of
Maastrichtian sediments ranges from 35 to 80 wt% (Norris et al., 2014), suggesting that Site U1403 was above
the CCD during the Late Cretaceous.
3 Materials and Methods 25
3.1 Stable isotopes
Site U1403 has been sampled at a resolution of ∼10 cm for stable carbon- and oxygen-isotope analyses on bulk
carbonates (for detailed description of cores and recovery see Expedition 342 Scientists, 2012). A total of 253
samples were taken from cores 26 to 28 of Hole A and cores 28 to 32 of Hole B, spanning 247.68–296.23 m core
composite depth below sea floor (CCSF; Fig. 2) After being dried and grounded, bulk samples were 30 alternatingly analyzed using either a Finnigan MAT 253 coupled online to a Gasbench II at Goethe-University
Frankfurt (Germany) or a Finnigan Delta V Advantage coupled with Gasbench II at Kanazawa-University
(Japan; for details see Moriya et al., 2012). All isotope values are reported in ‰ relative to the Vienna Peedee
belemnite standard (VPDB). For both systems, the analytical precision of replicates of standard measurements
was better than 0.06 and 0.08 ‰ for carbon and oxygen, respectively. Measuring the same samples on both 35 machines gave no difference outside the analytical error.
Clim. Past Discuss., doi:10.5194/cp-2016-51, 2016Manuscript under review for journal Clim. PastPublished: 18 May 2016c© Author(s) 2016. CC-BY 3.0 License.
4
3.2 XRF scanning
The Maastrichtian interval of Site U1403 was analyzed by XRF scanning (X-Ray Fluorescence) on the surface
of the core archive-halves in the Marum XRF Core Scanner Lab, University of Bremen, Germany. The
AVAATECH instrument, serial no.11, with an Oxford Instruments 100W Neptune Rh X-Ray tube and a
Canberra X-PIPS Silicon Drift Detector (SDD, Model SXD 15C-150-500) was set to a step-size of 15 mm, a slit 5 down-core of 10 mm, and a slit cross-core of 12 mm. A first run was applied with 10kV, 1.0 mA, for 20 s, and a
second run at 50 kV, 0.2 mA, for 20 s. The data were processed with WIN AXIL batch software using a
10kV_Cl-Rh model and a 50kV model, respectively. Outliers, likely resulting from uneven core surfaces or
micro cracks, were removed and not shown in Figure 3.
3.3 Time series analyses and astronomical calibration 10
To reduce noise, the natural logarithm of Fe over Ca was selected for further analyses (ln Fe/Ca), following the
approach of Weltje and Tjalingii (2008), as well as the shipboard magnetic susceptibility data (WRMSL-MS,
Expedition 342 scientists, 2012). The data were evenly sampled and periodicities larger than 5 m and 1 Myr
were removed as these periodicities are too long to be reliable detected in this dataset. A wavelet application for
Matlab (Grinsted et al. 2004) was applied on the records in the depth and time domain. 15 In the elemental records, particularly in those of Si and Fe, as well as ln Fe/Ca, a sharp peak occurs between
265.60 and 265.85 m CCSF. Also, high variability is observed in the interval directly beneath the K/Pg
boundary. The data records were cut at these levels and spectral analyses with Redfit 3.8 (Schulz & Mudelsee
2002) were performed on both the partial records as well as on the complete data series (Figure 5). Based on the
detected spectral peaks (see Sect. 4), band-pass filters were applied using AnalySeries (Paillard et al. 1996). The 20 filters were centered at 4.5 m (whole record), 4.3 m (upper partial record) and 3.3 m (lower partial record) for ln
Fe/Ca, and at 4.4 m for magnetic susceptibility (whole record), with a bandwidth of approximately one third of
the center frequency (Figure 4, see caption for filter details).
Consecutive minima in the ln Fe/Ca record that occur near minima in the band-pass filters (Figure 4) were
calibrated to successive minima in the 405-kyr component of eccentricity from the new La2011 (nominal) 25 solution (Laskar et al., 2011), based on a 405-kyr band-pass filter with a bandwidth of 300–623 kyr.
4 Results and discussion
4.1 XRF scanning results and splice correction of Site U1403
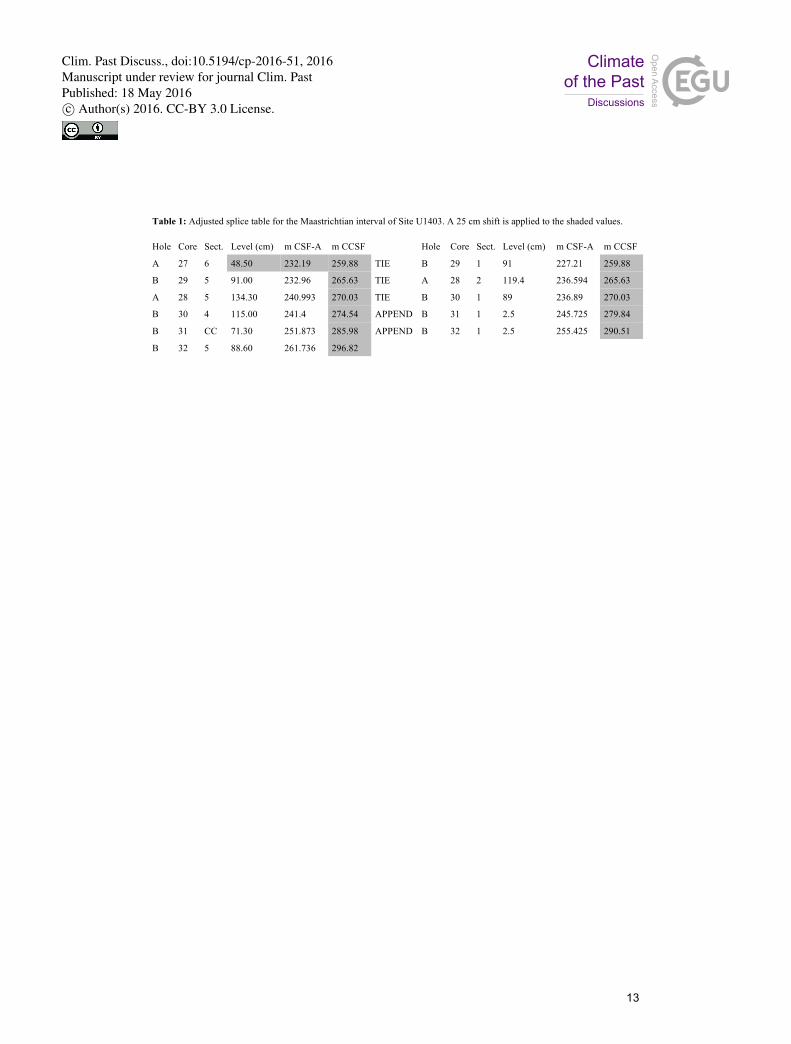
Based on the XRF scanning results, a small correction of the shipboard splice is suggested by shifting the tie-
point in Hole A, Core 27, Section 6, at 23.50 cm down-core by 25 cm, from originally 259.63 m CCSF to 259.88 30 m CCSF and adjusting all consecutive tie-points accordingly (Tab. 1). All depths bejond 259.63 m mentioned in
the manuscript are on the revised CCSF scale. The 25 cm shift leads to a better matching of peaks in, among
others, the Fe records of Holes A and B with high signal-to-noise-ratio in this interval but is also in agreement
with the magnetic susceptibility and color reflectance data from Site U1403 which are more variable (Expedition
342 Scientists, 2012). 35
Clim. Past Discuss., doi:10.5194/cp-2016-51, 2016Manuscript under review for journal Clim. PastPublished: 18 May 2016c© Author(s) 2016. CC-BY 3.0 License.
5
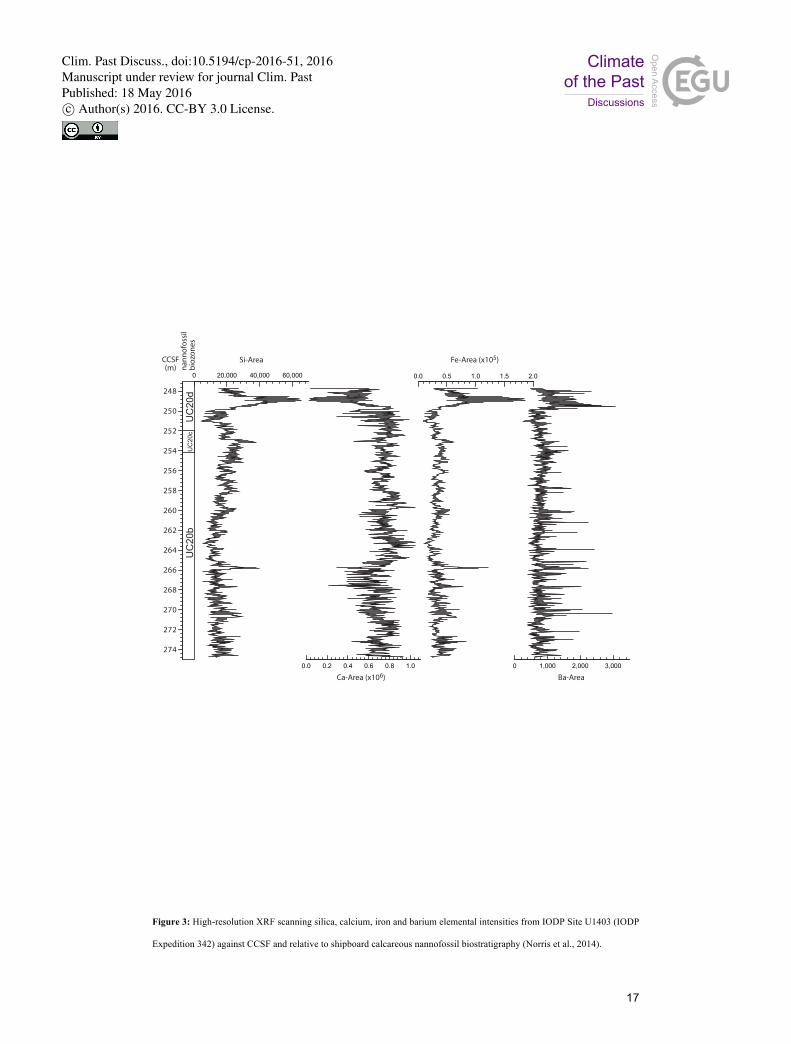
The elemental records of the different elements (supplementary information and data on www.pangaea.de) can
be divided in two groups. The elements Al, Si, K, Ti, Mn, Fe, and Zr are anticorrelated to carbonate-phase
elements Ca and Sr (Fig. 3). The element Ba (reported as total Ba analyzed) displays different behavior
characterized by intervals with high-frequency sharp peaks and relatively stable background values (Fig. 3). The
elemental records show a sharp peak between 265.60 and 265.82 m CCSF, indicated by blue shading in Figure 5 4. This peak coincides with a marked change in the visual appearance of the cores, with closely spaced dark
bands occurring below 265.60 m CCSF, and wider bands of lighter color occurring above (core images in left
panel of Fig. 4). These bands occur in groups or bundles throughout the studied interval.
4.2 Time series analyses and cyclostratigraphy
The magnetic susceptibility and elemental records show variability on different spatial scales, such as a marked 10 ~20 cm variability in the two meters below the K/Pg boundary and a ~1 m variability between 255 and 259 m
CCSF. The ln Fe/Ca and magnetic susceptibility datasets display many spectral peaks when the complete records
are analyzed (top panels Figure 4). Main periodicities in the ln Fe/Ca record, above 99% confidence are at are at
4.5 m, 21-22 cm and around 17 cm. Other prominent peaks, above 90% confidence, occur at 1.6 m, 1.1 m, 63
cm, 46 cm, 36 cm and 27 cm. For magnetic susceptibility, the main periodicities are at 4.4 m, 1.1 m, 54-60 cm, 15 35 cm, 26-28 cm, 22 cm, 20 cm and around 17 cm.
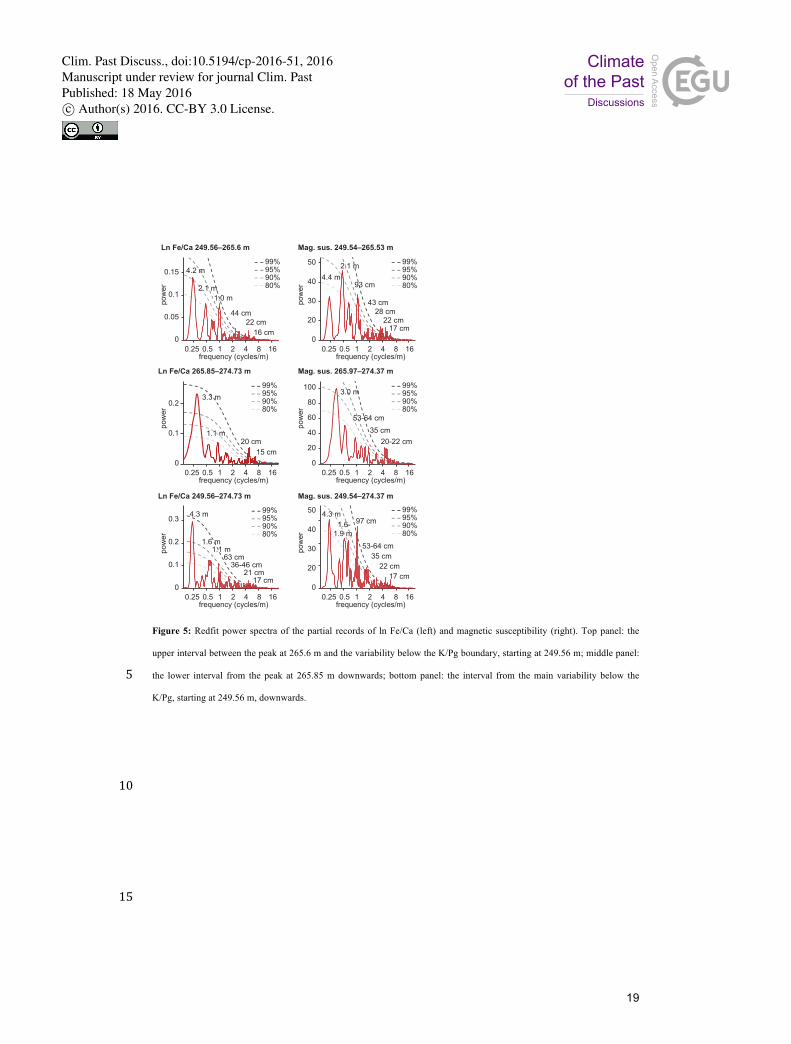
The partial records resulting from cutting the records at 249.56 m, 265.60 m and 265.85 m CCSF provide
cleaner spectra (Fig. 5). The periodicities above 99% confidence in the upper partial record of ln Fe/Ca are at 44
cm, 36 cm, 26 cm, 21- 22 cm and 16-17 cm, and above 90 % confidence periodicities of 4.2 m and 1.0 m are
detected. For the upper partial record of magnetic susceptibility, main periodicities occur at 25-29 cm, 22 cm, 20 20 cm and 16-18 cm, and other periodicities at 2.1 m, 95 cm, 43 cm and 36 cm. The lower partial record of ln Fe/Ca
has main periodicities at 22 cm and 15 cm, and other prominent periodicities at 3.3 m and 17 cm. The lower
partial record of magnetic susceptibility shows dominant periodicities around 20-22 cm, and other prominent
periodicities at 3 m, 53-64 cm and 35 cm. For completeness, also the spectral analyses of the records only cut at
249.56 are displayed (Figure 5, lower panels). 25 The strong periodicities in the upper part of the ln Fe/Ca and magnetic susceptibility records, at 4.2 m, at 1 m, at
44 and 36 cm and at 21-22 cm, have a ratio near that of the main periodicities of the orbital parameters of
eccentricity-modulated precession and obliquity (20:5:2:1, formed by the ratio of the 405 kyr, 100 kyr, 41 kyr
and 22 kyr components). The same holds true for the lower part of the record, with periodicities at 3.3 and 3.0 m,
64 cm, 22 cm and 15 cm, albeit less clear due to the shorter length of the partial record. The shift in periodicities 30 is likely caused by an increase in sedimentation rate at 265.60 m CCSF, which is supported by the changes in the
spacing of dark bands (Fig. 4).
During overall maxima of Fe and minima of Ca and corresponding maxima of ln Fe/Ca, the respective elemental
intensity records as well as the ln Fe/Ca record display maximal variability (Fig. 4). This pattern likely reflects
the sedimentary response to eccentricity-modulated precession, with high variability caused by large amplitude 35 of the precessional forcing during eccentricity maxima. The observed rhythmic pattern displays the combined
influence of variations in three main driving factors: carbonate productivity; dilution of carbonate content by
siliciclastic terrigenous input; and the potential effect of local dissolution. Maxima in Fe counts coincide with
minima in Ca counts (high ln Fe/Ca) and can be interpreted to reflect increasing terrigenous input, decreased
carbonate production and/or increased dissolution or a combination of all. We hypothesize that our data reflect 40
Clim. Past Discuss., doi:10.5194/cp-2016-51, 2016Manuscript under review for journal Clim. PastPublished: 18 May 2016c© Author(s) 2016. CC-BY 3.0 License.
6
highest terrigenous input and/or lowest carbonate production in times of maximal eccentricity. Increased
terrigenous input during eccentricity maxima may indicate more runoff potentially caused by an intensified
hydrological cycle whereas the increase in variability reflects the increasing influence of precessional forcing on
the hydrological regime. In this scenario, minima of Ca would primarily reflect dilution by terrigenous material.
The dark bands directly observed below the K/Pg boundary (see core pictures in Fig. 4) may reflect local short-5 lived dissolution events that led to additional Fe enrichment and Ca depletion.
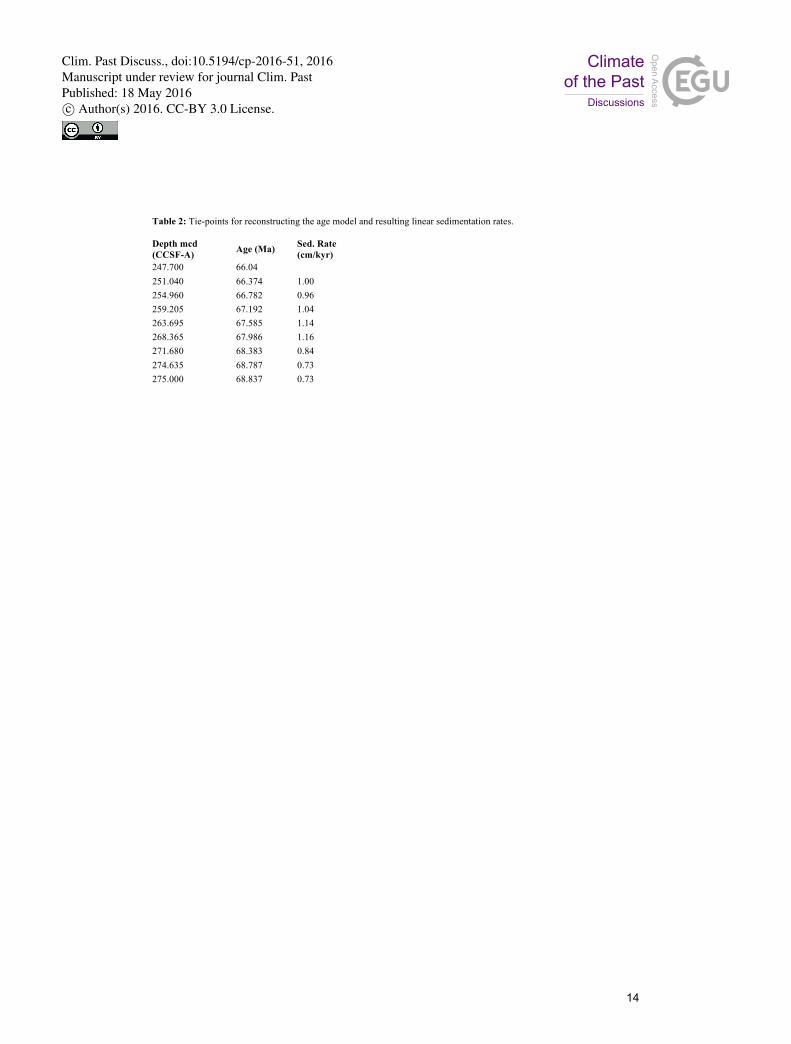
Based on the above-mentioned sedimentary response to eccentricity-modulated precession, minima in the ln
Fe/Ca record that occur near minima in the 4.5 m, 4.4 m and 3.3 m band-pass filters are assigned the ages of
minima in the 405-kyr component of eccentricity from the La2011 solution (Laskar et al, 2011) (Tab. 2). This
interpretation is supported by the occurrence of increased amplitude of 36-46 cm periodicities at five such levels, 10 which likely corresponds to more prominent obliquity forcing during 405-kyr eccentricity minima. Astronomic
calibration uses the K/Pg boundary as starting point with an age of 66.04 Ma based on new bentonite ages from
coals near the K/Pg boundary of 66.04 Ma (Renne et al., 2013). After assigning ages to the consecutive 405-kyr
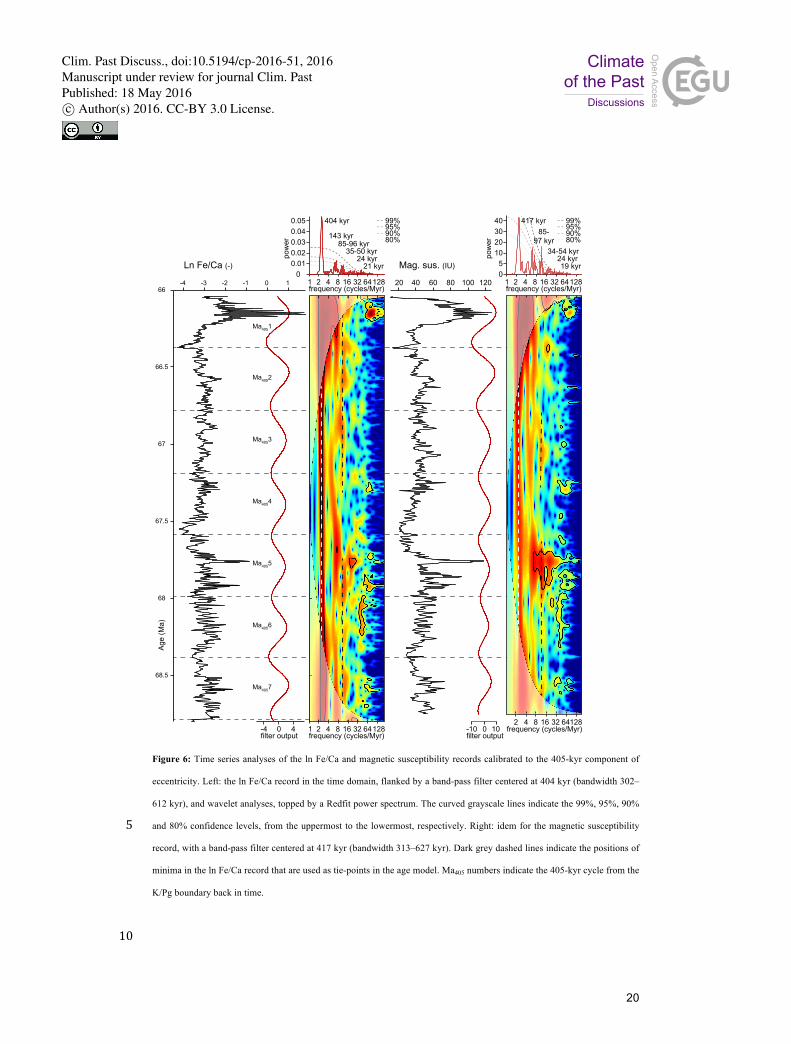
minima, the main periodicities of the calibrated ln Fe/Ca record are at 404, 143, 24 and 22 kyr (above 99%
confidence), with other periodicities (above 90% confidence) at 96, 85, 51 and 38 kyr. For the calibrated 15 magnetic susceptibility record, main periodicities are at 417, 85, 46, 34, 24 and 19 kyr, with other periodicities at
143 and 97 kyr (Fig. 6). These periodicities broadly correspond to the periodicities of obliquity and eccentricity-
modulated precession, and display a regular behavior throughout the record (wavelet panels, Fig. 6).
The investigated interval of Site U1403 encompasses seven 405-kyr cycles (Ma4051 to Ma4057, Husson et al.,
2011 following the nomenclature of Westerhold et al., 2008; Fig. 6) in total and spans 2.8 Myr (68.8 to 66.04 20 Ma). This highlights the potential of Site U1403 to serve as a latest Maastrichtian reference section in the
Atlantic Ocean. It provides the possibility to investigate the timing and duration of underlying causes and trigger
mechanisms of climatic and oceanographic events and fluctuations like the MME or the K/Pg boundary as well
as the time interval in-between. Especially, Site U1403 is located within the pathway of a potential Northern
Component water mass which is suggested to have been a source of deep water in the North Atlantic Ocean (e.g., 25 MacLeod et al., 2011; Robinson and Vance, 2012; Voigt et al., 2013).
4.3 Stable oxygen isotope signal
Carbonates of the studied nannofossil oozes consist mainly of coccoliths and benthic and planktic foraminifera
(Expedition 342 Scientists, 2012). Bulk oxygen isotope values therefore predominantly represent a surface-water
signal. The δ18O-composition of bulk carbonate can be significantly altered by diagenetic processes like low-30 temperature exchange with pore fluids or burial diagenesis (e.g., Marshall, 1992; Schrag et al., 1995). Therefore,
we refrain from calculating absolute temperatures based on oxygen isotope values. Variations in bulk oxygen
isotope records, however, are often considered to reflect relative changes in temperature (e.g., Jenkyns et al.,
1994; Voigt and Wiese, 2000; Friedrich et al., 2003; Kuhnt et al., 2011).
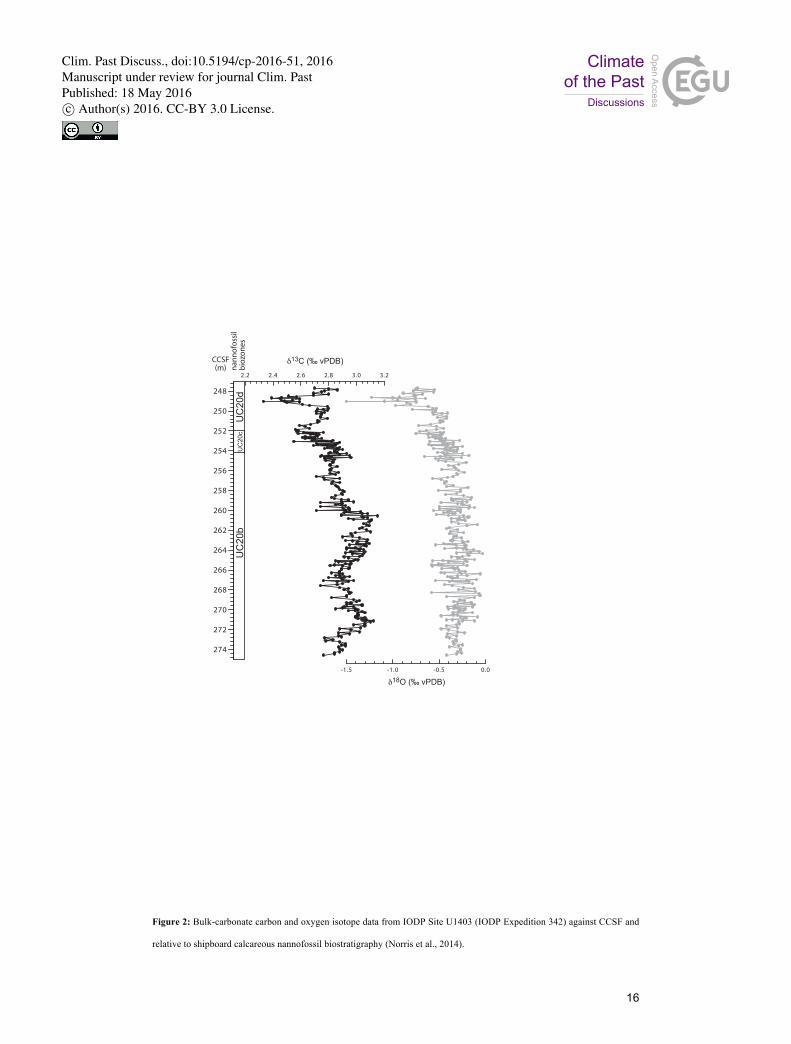
The bulk carbonate oxygen isotope record from Site U1403 is characterized by relatively stable values between 35 253 and 275 m CCSF which vary between 0 and -0.6 ‰ (Fig. 2). Above 253 m CCSF, δ18O values decrease
slightly, followed by a pronounced negative excursion between 249 and 248 m CCSF with minimum values of -
1.5 ‰ within nannofossil zone UC20d (Fig. 2). This decrease in oxygen isotope values suggests a significant
increase in surface-water temperatures directly preceding the K/Pg boundary, as has been described in previous
studies (e.g., Barrera, 1994; Li and Keller, 1998). 40
Clim. Past Discuss., doi:10.5194/cp-2016-51, 2016Manuscript under review for journal Clim. PastPublished: 18 May 2016c© Author(s) 2016. CC-BY 3.0 License.
7
4.4 Carbon isotope stratigraphy and comparison to the Zumaia record
Carbon isotope values of carbonates are less prone to diagenetic alterations than oxygen isotope values (e.g.,
Anderson and Arthur, 1983; Marshall, 1992) and are a reliable recorder of changes in the global carbon cycle
(e.g., Weissert et al., 2008). Especially for pelagic carbonate successions the method of carbon isotope
stratigraphy has been successfully applied for stratigraphic correlation on a global scale and across different 5 depositional settings (e.g., Voigt et al., 2010, 2012; Batenburg et al., 2012; Jung et al., 2012; Thibault et al.,
2012a, b).
The bulk carbon isotope record of Site U1403 shows variability on long and short timescales. While δ13C values
increase in the lower half of the record (275 to 260 m CCSF, Fig. 2) to maximum values of 3.15 ‰, they
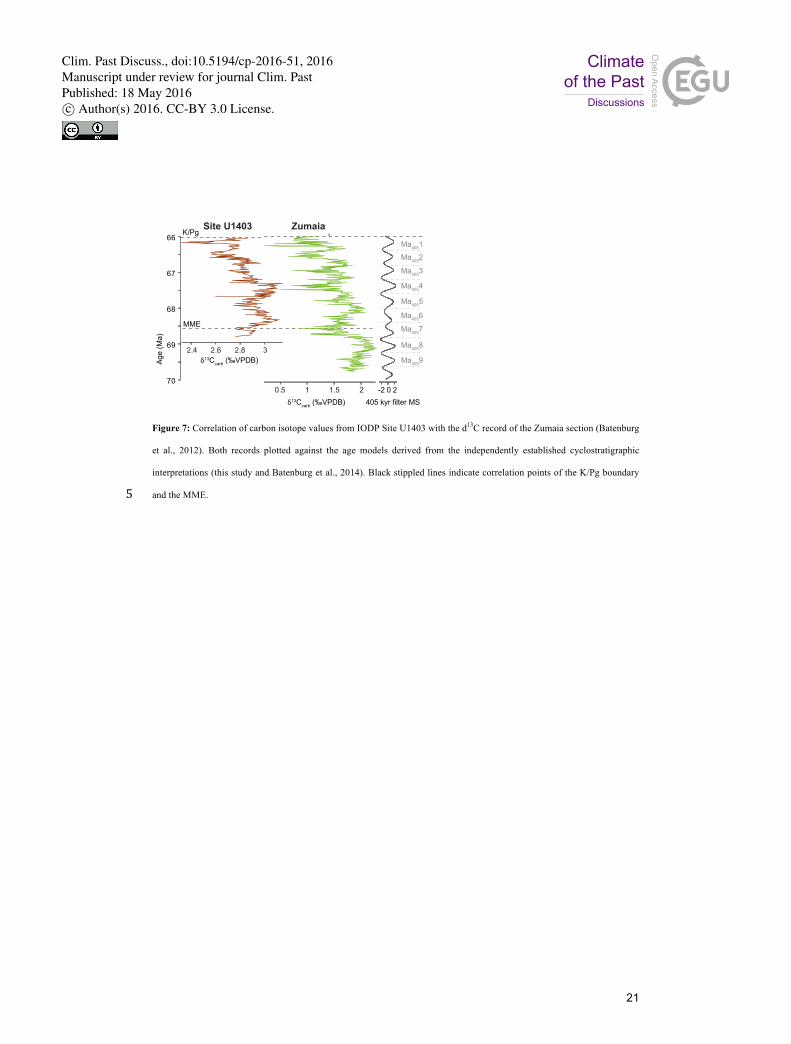
decrease towards the top of the studied interval, resulting in minimum values of 2.3 ‰. 10 The pattern of δ13C values found in Site U1403 can be compared to the trends in bulk carbonate δ13C values
from the Zumaia section in northern Spain (Batenburg et al., 2012), which has an independent astrochronology
(Fig. 7). For the Zumaia succession, rhythmic lithological alternations form the basis of a cyclostratigraphic
framework, tested by statistical analyses of high-resolution magnetic susceptibility and color reflectance data. A
405-kyr band-pass filter of magnetic susceptibility is displayed at the right hand side of Figure 7. Compared to 15 the carbon isotope data of Site U1403, the Zumaia record shows variations with a larger amplitude (up to 1 ‰;
Fig. 7). This reflects the influence of regional processes such as weathering, runoff and productivity, which may
have changed the carbon inventory of the relatively restricted Basque-Cantabric basin, and caused short-term
variations superimposed on long-term global trends. The relatively low amplitude variations of bulk carbon
isotope values from Site U1403 (up to 0.4 ‰; Figs 2, 7) are typical for open ocean settings like the Tethys 20 (Voigt et al., 2012; Sprovieri et al., 2013), the tropical Pacific (Sites 305 and 1210; Voigt et al., 2010; Jung et al.,
2012) or the Indian Ocean (Site 762; Thibault et al., 2012a).
Both carbon isotope records show an overall decreasing trend through the late Maastrichtian. Markedly negative
values near the base of the U1403 record coincide with the Mid-Maastrichtian Event at 68.6 Ma. Distinct
oscillations can be observed in both records over a million-year interval prior to the K/Pg boundary. In between 25 these coeval shifts, the Zumaia record displays a negative shift around 67.5 Ma, which may be related to a
relative drop in sea level (Batenburg et al., 2012). The behavior of the carbon isotope record of Site U1403 is
likely more representative of changes in the global carbon cycle. This interpretation is supported by a
comparison of available nannofossil marker species. At Site U1403, shipboard calcareous nannofossil
biostratigraphy indicates zones UC20b to UC20d (Norris et al., 2014). Boundaries between these zones are at 30 ~66.68 Ma (base Ceratolithoides kamptneri) and ~66.47 Ma (base Micula prinsii) if the herein established age
model is applied. These estimated ages are somewhat older than compared to the same events at Zumaia
(Batenburg et al., 2014). However, diachroneity has been noted in M. prinsii, with later Boreal appearances (see
Gradstein et al., 2012, notes). At ODP Site 762C, Thibault et al. (2012a) reported Base M. prinsii towards the
base of 29r (66.39 Ma) and Thibault et al. (2015) report a range of M. prinsii ages from 66.2-67 Ma, but mostly 35 towards the younger end of the range, which is generally in good agreement with the estimated age of this study.
Although Site U1403 and the Zumaia section represent completely different depositional settings, the carbon
isotope curves display similar broad trends when presented on independent age models. Differences between the
curves can be used to identify global versus regional controls on recorded δ13C. This highlights the usefulness of
Clim. Past Discuss., doi:10.5194/cp-2016-51, 2016Manuscript under review for journal Clim. PastPublished: 18 May 2016c© Author(s) 2016. CC-BY 3.0 License.
8
carbon isotopes for stratigraphic purposes in the latest Cretaceous and their potential to unravel the underlying
causes and trigger mechanisms of paleoclimatic and paleoceanographic events.
5 Conclusions
Based on our high-resolution XRF core scanning data, we identify a small correction of the shipboard splice and
establish an orbital chronology for the late Maastrichtian interval of Site U1403. The investigated interval 5 encompasses seven 405-kyr cycles (Ma4051 to Ma4057), spanning 2.8 Myr from 68.8 to 66.0 Ma. Our new high-
resolution stable carbon isotope record from Site U1403 (IODP Expedition 342, Newfoundland Margin) shows
distinct variations, including the Mid-Maastrichtian Event and the oscillations prior to the K/Pg boundary. These
trends can be correlated to carbon isotope records elsewhere, e.g. the Zumaia section in northern Spain.
Comparison of carbon isotope stratigraphies from open-ocean and shelf settings not only provides a dating tool, 10 but also adds insights in regional versus global drivers of the Earth’s carbon cycle. Amplitudes of the carbon
isotope variations at Zumaia are significantly higher than at U1403, indicating a strong influence of regional
processes in the narrow Basque-Cantabric basin on the carbon isotope signal. The U1403 record displays typical
open ocean values when compared to other records. In the future, Site U1403 might serve as a potential
reference section for paleoclimatic and paleoceanographic events and fluctuations during the latest Cretaceous. 15
Acknowledgements. This research used samples provided by the Integrated Ocean Drilling Program (IODP),
which is sponsored by the U.S. National Science Foundation and participating countries under management of
Joint Oceanographic Institutions, Inc. This research used data acquired at the XRF Core Scanner Lab at the
MARUM – Center for Marine Environmental Sciences, University of Bremen, Germany. Sven Hofmann is
thanked for laboratory assistance. Dominik Leonhardt helped with processing of sediment samples. Funding for 20 this study was provided by the DFG to O.F. (Emmy Noether research group “Meso- and Cenozoic
paleoceanography”; grant FR2544/2-1 and grant FR2544/5) and to S.V. (DFG grant VO 687/14-1).
References
Anderson, T. F., and Arthur, M. A.: Stable isotopes of oxygen and carbon and their application to
sedimentologic and paleoenvironmental problems. In: Arthur, M. A., Anderson, T. F., Kaplan, I. R. V. J., 25 Land, L. S. (Eds.): Stable Isotopes in Sedimentary Geology. Society of Economic Paleontologists and
Mineralogists, Dallas, pp. 1–151. 1983.
Barrera, E.: Global environmental changes preceding the Cretaceous-Tertiary boundary: Early-Late
Maastrichtian transition, Geology, 22, 877-880, 1994.
Barrera, E., and Savin, S. M.: Evolution of late Campanian-Maastrichtian marine climates and oceans, Spec. Pap. 30 Geol. Soc. Am., 332, 245-282, 1999.
Barrera, E., Savin, S. E., Thomas, E., and Jones, C. E.: Evidence for thermohaline-circulation reversals
controlled by sea-level change in the latest Cretaceous, Geology, 25, 715-718, 1997.
Batenburg, S. J., Sprovieri, M., Gale, A. S., Hilgen, F. J., Hüsing, S., Laskar, J., Liebrand, D., Lirer, F., Orue-
Etxebarria, X., Pelosi, N., and Smit, J.: Cyclostratigraphy and astronomical tuning of the Late 35 Maastrichtian at Zumaia (Basque country, Northern Spain), Earth Planet. Sci. Let., 359-360, 264-278,
Clim. Past Discuss., doi:10.5194/cp-2016-51, 2016Manuscript under review for journal Clim. PastPublished: 18 May 2016c© Author(s) 2016. CC-BY 3.0 License.
9
2012.
Batenburg, S. J., Gale, A. S., Sprovieri, M., Hilgen, F. J., Thibault, N., Boussaha, M., and Orue-Etxebarria, X.:
An astronomical time scale for the Maastrichtian based on the Zumaia and Sopelana sections (Basque
country, northern Spain), J. Geol. Soc., 171, 165-180, 2014.
Bornemann, A., Norris, R. D.,Friedrich, O., Beckmann, B., Schouten, S., Sinninghe Damsté, J. Vogel, J., Hofmann, 5 P., and Wagner, T.: Isotopic evidence for glaciation during the Cretaceous supergreenhouse, Science, 319,
189–192, 2008.
Burnett, J. A.: Upper Cretaceous, in Calcareous nannofossil biostratigraphy. In: Bown, P.R. (Eds.). Chapman
and Hall, London, pp. 132–199, 1998.
Clarke, L. J., and Jenkyns, H. C.: New oxygen-isotope evidence for long-term Cretaceous climate change in the 10 Southern Hemisphere, Geology, 27, 699–702, 1999.
Expedition 342 Scientists 2012.: Paleogene Newfoundland sediment drifts. IODP Prel. Rept., 342.
doi:10.2204/iodp.pr.342.2012, 2012.
Forster, A., Schouten, S., Baas, M., and Sinninghe Damsté, J.: Mid-Cretaceous (Albian-Santonian) sea surface
temperature record of the tropical Atlantic Ocean, Geology, 35, 919-922, 2007. 15 Frank, T. D., and Arthur, M. A.: Tectonic Forcings of Maastrichtian Ocean-Climate Evolution,
Paleoceanography, 14, 103-117, 1999.
Frank, T.D., Thomas, D.J., Leckie, R.M., Arthur, M.A., Bown, P.R., Jones, K., and Lees, J.A.: The
Maastrichtian record from Shatsky Rise (northwest Pacific): A tropical perspective on global ecological
and oceanographic changes, Paleoceanography, 20, doi:10.1029/2004PA001052, 2005. 20
Friedrich, O., and Hemleben, C.: Early Maastrichtian benthic foraminiferal assemblages from the western North
Atlantic (Blake Nose) and their relation to paleoenvironmental changes, Mar. Micropaleontol., 62, 31–44,
2007.
Friedrich, O., Reichelt, K., Herrle, J.O., Lehmann, J., Pross, J., and Hemleben, C.: Formation of the Late Aptian
Niveau Fallot black shales in the Vocontian Basin (SE France): evidence from foraminifera, 25 palynomorphs, and stable isotopes. Mar. Micropaleontol., 49, 65-85, 2003.
Friedrich, O., Herrle, J. O., Kößler, P., and Hemleben, C.: Early Maastrichtian stable isotopes: changing deep
water sources in the North Atlantic?, Palaeogeogr. Palaeoclimatol Palaeoecol., 211, 171-184, 2004.
Friedrich, O., Erbacher, J., Moriya, K., Wilson, P. A., and Kuhnert, H.: Warm saline intermediate waters in the
Cretaceous tropical Atlantic Ocean, Nature Geosci., 1, 453-457, 2008. 30
Friedrich, O., Herrle, J. O., Wilson, P. A., Cooper, M. J., Erbacher, J., and Hemleben, C.: Early Maastrichtian
carbon cycle perturbation and cooling event: Implications from the South Atlantic Ocean,
Paleoceanography, 24, PA2211, doi: 10.1029/2008PA001654, 2009.
Friedrich, O., Norris, R. D., and Erbacher, J.: Evolution of middle to Late Cretaceous oceans-A 55 m.y. record of
Earth's temperature and carbon cycle, Geology, 40, 107-110, 2012. 35
Gradstein, F. M., Ogg, J. G., Schmitz, M. D., and Ogg, G. M. (coordinators): The Geologic Time Scale 2012.
Boston, USA: Elsevier, 2 volumes plus chart, 1176 pp., 2012.
Grinsted, A., Moore, J. C., and Jevrejeva, S.: Application of the cross wavelet transform and wavelet coherence
to geophysical time series, Nonlinear Processes in Geophysics, 11, 561–566, 2004.
Clim. Past Discuss., doi:10.5194/cp-2016-51, 2016Manuscript under review for journal Clim. PastPublished: 18 May 2016c© Author(s) 2016. CC-BY 3.0 License.
10
Huber, B. T., and Watkins, D. K.: Biogeography of Campanian-Maastrichtian calcareous plankton in the region
of the Southern Ocean: paleogeographic and paleoclimatic implications, Antarct. Res. Ser., 56, 31-60,
1992.
Huber, B. T., Norris, R. D., and MacLeod, K. G.: Deep-sea paleotemperature record of extreme warmth during the
Cretaceous, Geology, 30, 123–126, 2002. 5 Husson, D., Galbrun, B., Laskar, J., Hinnov, L.A., Thibault, N., Gardin, S., and Locklair, R.E.: Astronomical
calibration of the Maastrictian (Late Cretaceous), Earth Planet. Sci. Let., 305, 328-340, 2011.
Jenkyns, H.C., Gale, A.S., and Corfield, R.M.: Carbon- isotope and oxygen- isotope stratigraphy of the English
Chalk and Italian Scaglia and its palaeoclimatic significance, Geol. Mag., 131, 1–34, 1994.
Jung, C., Voigt, S., and Friedrich, O.: High-resolution carbon-isotope stratigraphy across the Campanian-10 Maastrichtian boundary at Shatsky Rise (tropical Pacific), Cret. Res., 37, 177-185, 2012.
Jung, C., Voigt, S., Friedrich, O., Koch, M.C., and Frank, M.: Campanian-Maastrichtian ocean circulation in the
tropical Pacific, Paleoceanography, 28, 562-573, 2013.
Kuhnt, W., Holbourn, A., and Moullade, M.: Transient global cooling at the onset of early Aptian oceanic anoxic
event (OAE) 1a, Geology, 39, 323–326, 2011. 15 Kuiper, K. F., Deino, A., Hilgen, F. J., Krijgsman, W., Renne, P. R., and Wijbrans J. R.: Synchronizing Rock
Clocks of Earth History, Science, 320, 500-504, 2008.
Laskar, J., Gastineau, M., Delisle, J.-B., Farrés, A., and Fienga, A.: Strong chaos induced by close encounters
with Ceres and Vesta, Astronomy and Astrophys., 532, L4, 2011.
Lees, J.A.: Calcareous nannofossil biogeography illustrates palaeoclimate change in the Late Cretaceous Indian 20 Ocean, Cret. Res., 23, 537-634, 2002.
Lees, J.A., and Bown, P.R.: Upper Cretaceous calcareous nannofossil biostratigraphy, ODP Leg 198 (Shatsky
Rise, northwest Pacific Ocean), Proc. ODP, 198, 1-60, 2005.
Li, L., and Keller, G.: Maastrichtian climate, productivity and fauna1 turnovers in planktic foraminifera in South
Atlantic DSDP sites 525A and 21, Mar. Micropaleontol., 33, 55-86, 1998. 25 MacLeod, K.G.: Bioturbation, inoceramid extinction and mid Maastrichtian ecological change, Geology, 22,
139-142, 1994.
MacLeod, K. G., Huber, B. T., and Ward, P. D.: The biostratigraphy and paleobiogeography of Maastrichtian
inoceramids, Spec. Pap. Geol. Soc. Am., 307, 361-373, 1996.
MacLeod, K. G., Londono, C. I., Martin, E. E., Berrocoso, A. J., and Basak, C.: Changes in North Atlantic 30 circulation at the end of the Cretaceous greenhouse interval, Nature Geosci., 4, 779-782, 2011.
Marshall, J. D.: Climatic and oceanographic isotopic signals from the carbonate rock record and their
preservation, Geol. Mag., 129, 143–160, 1992.
Moriya, K., Goto, A. S., and Hasegawa, T.: Stable carbon and oxygen isotope analyses of carbonate using a
continuous flow isotope ratio mass spectrometry. The science reports of the Kanazawa University, 56, 45-35 58, 2012.
Norris, R.D., Wilson, P.A, Blum, P., and the Expedition 342 Scientists: Proc. IODP, 342, College
Station, TX (Integrated Ocean Drilling Program), doi:10.2204/iodp.proc.342.2014, 2014.
Paillard, D., Labeyrie, L., and Yiou, P.: Macintosh program performs timeseries analysis. EOS Transactions, 77,
379–397, 1996. 40
Clim. Past Discuss., doi:10.5194/cp-2016-51, 2016Manuscript under review for journal Clim. PastPublished: 18 May 2016c© Author(s) 2016. CC-BY 3.0 License.
11
Premoli Silva, I., and Sliter, W. V.: Cretaceous planktonic foraminiferal stratigraphy and evolutionary trends
from the Bottacione section, Gubbio, Italy, Paleontogr. Ital., 82, 1-89, 1994.
Renne, P. R., Deino, A. L., Hilgen, F. J., Kuiper, K. F., Mark, D. F., Mitchell, W. S., Morgan, L. E., Mundil, R.,
and Smit, J.: Time scale of critical events around the Cretaceous-Paleogene boundary, Science, 339, 684-
687, 2013. 5
Robinson, S. A., and Vance, D.: Widespread and synchronous change in deep-ocean circulation in the North and
South Atlantic during the Late Cretaceous, Paleoceanography, 27, PA1102, doi:10.1029/2011PA002240,
2012.
Schrag, D. P., DePaolo, D. J., and Richter, F. M.: Reconstructing past sea surface temperatures: Correcting for
diagenesis of bulk marine carbonate, Geochim. Cosmochim. Acta, 59, 2265–2278, 1995. 10 Schulz, M., and Mudelsee, M.: REDFIT: estimating red-noise spectra directly from unevenly spaced
paleoclimatic time series, Comp. Geosci., 28, 421–426, 2002.
Sprovieri, M., Sabatino, N.; Pelosi, N., Batenburg, S.J., Coccioni, R., Iavarone, M., and Mazzola, S.: Late
Cretaceous orbitally-paced carbon isotope stratigraphy from the Bottaccione Gorge (Italy), Palaeogeogr.
Palaeoclimatol. Palaeoecol., 379, 81–94, 2013. 15 Thibault, N., Husson, D., Harlou, R., Gardin, S., Galbrun, B., Huret, E., and Minoletti, F.: Astronomical
calibration of upper Campanian–Maastrichtian carbon isotope events and calcareous plankton
biostratigraphy in the Indian Ocean (ODP Hole 762C): Implication for the age of the Campanian–
Maastrichtian boundary, Palaeogeogr. Palaeoclimatol. Palaeoecol., 337-338, 52-71, 2012a.
Thibault, N., Harlou, R., Schovsbo, N., Schioler, P., Lauridsen, B. W., Sheldon, E., Stemmerik, L., and Surlyk, 20 F.: Upper Campanian - Maastrichtian carbon-isotope stratigraphy of the Danish Basin: calibration with
calcareous nannofossil and dinoflagellate events in the Boreal Realm, Cret. Res., 33, 72-90, 2012b.
Thibault, N., Anderskouv, K., Bjerager, M., Boldreel, L. O., Jelby, M. E., Stemmerik, L., and Surlyk, F.: Upper
Campanian-Maastrichtian chronostratigraphy of the Skaelskor-1 core, Denmark: correlation at the basinal
and global scale and implications for changes in sea-surface temperatures, Lethaia, 48, 549-560, 2015. 25 Voigt, S., and Wiese, F.: Evidence for Late Cretaceous (late Turonian) climate cooling from oxygen-isotope
variations and palaeobiogeographic changes in Western and Central Europe, J. Geol. Soc., 157, 737–744,
2000.
Voigt, S., Friedrich, O., Norris, R. D., and Schönfeld, J.: Campanian – Maastrichtian carbon isotope stratigraphy:
shelf-ocean correlation between the European shelf sea and the tropical Pacific Ocean, Newsl. Stratigr., 30 44, 57-72, 2010.
Voigt, S., Gale, A. S., Jung, C., and Jenkyns, H. C.: Global correlation of Upper Campanian - Maastrichtian
successions using carbon-isotope stratigraphy: development of a new Maastrichtian timescale, Newsl.
Stratigr., 45, 25-53, 2012.
Voigt, S., Jung, C., Friedrich, O., Frank, M., Teschner, C., and Hoffmann, J.: Tectonically restricted deep-ocean 35 circulation at the end of the Cretaceous greenhouse, Earth Planet. Sci. Let., 369-370, 169-177, 2013.
Weissert, H., Joachimski, J., and Sarnthein, M.: Chemostratigraphy. Newsl. Stratigr., 42, 145-179, 2008.
Weltje, G. J., and Tjallingii, R.: Calibration of XRF core scanners for quantitative geochemical logging of
sediment cores: theory and application, Earth Planet. Sci. Let., 274, 423–438, 2008.
Westerhold, T., Röhl, U., Raffi, I., Fornaciari, E.,Monechi, S., Reale, V., Bowles, J., Evans, H.F.: Astronomical 40
Clim. Past Discuss., doi:10.5194/cp-2016-51, 2016Manuscript under review for journal Clim. PastPublished: 18 May 2016c© Author(s) 2016. CC-BY 3.0 License.
12
calibration of the Paleocene time. Palaeogeogr. Palaeoclimatol. Palaeoecol., 257, 377–403, 2008.
Wilson, P. A., Norris, R. D., and Cooper, M. J.: Testing the Cretaceous greenhouse hypothesis using glassy
foraminiferal calcite from the core of the Turonian tropics on Demerara Rise, Geology, 30, 607-610, 2002.
5
Clim. Past Discuss., doi:10.5194/cp-2016-51, 2016Manuscript under review for journal Clim. PastPublished: 18 May 2016c© Author(s) 2016. CC-BY 3.0 License.
13
Table 1: Adjusted splice table for the Maastrichtian interval of Site U1403. A 25 cm shift is applied to the shaded values.
Hole Core Sect. Level (cm) m CSF-A m CCSF Hole Core Sect. Level (cm) m CSF-A m CCSF
A 27 6 48.50 232.19 259.88 TIE B 29 1 91 227.21 259.88
B 29 5 91.00 232.96 265.63 TIE A 28 2 119.4 236.594 265.63
A 28 5 134.30 240.993 270.03 TIE B 30 1 89 236.89 270.03
B 30 4 115.00 241.4 274.54 APPEND B 31 1 2.5 245.725 279.84
B 31 CC 71.30 251.873 285.98 APPEND B 32 1 2.5 255.425 290.51
B 32 5 88.60 261.736 296.82
Clim. Past Discuss., doi:10.5194/cp-2016-51, 2016Manuscript under review for journal Clim. PastPublished: 18 May 2016c© Author(s) 2016. CC-BY 3.0 License.
14
Table 2: Tie-points for reconstructing the age model and resulting linear sedimentation rates.
Depth mcd (CCSF-A) Age (Ma) Sed. Rate
(cm/kyr) 247.700 66.04 251.040 66.374 1.00 254.960 66.782 0.96 259.205 67.192 1.04 263.695 67.585 1.14 268.365 67.986 1.16 271.680 68.383 0.84 274.635 68.787 0.73 275.000 68.837 0.73
Clim. Past Discuss., doi:10.5194/cp-2016-51, 2016Manuscript under review for journal Clim. PastPublished: 18 May 2016c© Author(s) 2016. CC-BY 3.0 License.
15
Figure 1: Paleogeographic reconstruction for the Maastrichtian (70 Ma reconstruction based on www.odsn.de; Hay et al.,
1999) showing locations of sites discussed (Site U1403, this study, black star; Zumaia section, white star).
���Ý ��Ý ��Ý ��Ý �Ý ���Ý
���Ý
���Ý
�Ý
��Ý
��Ý
��Ý�Ý
���Ý
���Ý
�Ý
��Ý
��Ý
��Ý
U1403 Zumaia
70 Ma reconstruction
Clim. Past Discuss., doi:10.5194/cp-2016-51, 2016Manuscript under review for journal Clim. PastPublished: 18 May 2016c© Author(s) 2016. CC-BY 3.0 License.
16
Figure 2: Bulk-carbonate carbon and oxygen isotope data from IODP Site U1403 (IODP Expedition 342) against CCSF and
relative to shipboard calcareous nannofossil biostratigraphy (Norris et al., 2014).
2.2 2.4 2.6 2.8 3.0 3.2
274
272
270
268
266
264
262
260
258
256
254
252
250
248
-1.5 -1.0 -0.5 0.0
CCSF(m)
b13C (‰ vPDB)
b18O (‰ vPDB)
nann
ofossil
biozon
esU
C20b
UC
20d
UC
20c
Clim. Past Discuss., doi:10.5194/cp-2016-51, 2016Manuscript under review for journal Clim. PastPublished: 18 May 2016c© Author(s) 2016. CC-BY 3.0 License.
17
Figure 3: High-resolution XRF scanning silica, calcium, iron and barium elemental intensities from IODP Site U1403 (IODP
Expedition 342) against CCSF and relative to shipboard calcareous nannofossil biostratigraphy (Norris et al., 2014).
274
272
270
268
266
264
262
260
258
256
254
252
250
248
CCSF(m) na
nnof
ossil
bioz
ones
UC20b
UC20d
UC20c
0 1,000 2,000 3,000
0.0 0.5 1.0 1.5 2.0
0.0 0.2 0.4 0.6 0.8 1.0
0 20,000 40,000 60,000
Si-Area Fe-Area (x105)
Ba-AreaCa-Area (x106)
Clim. Past Discuss., doi:10.5194/cp-2016-51, 2016Manuscript under review for journal Clim. PastPublished: 18 May 2016c© Author(s) 2016. CC-BY 3.0 License.
18
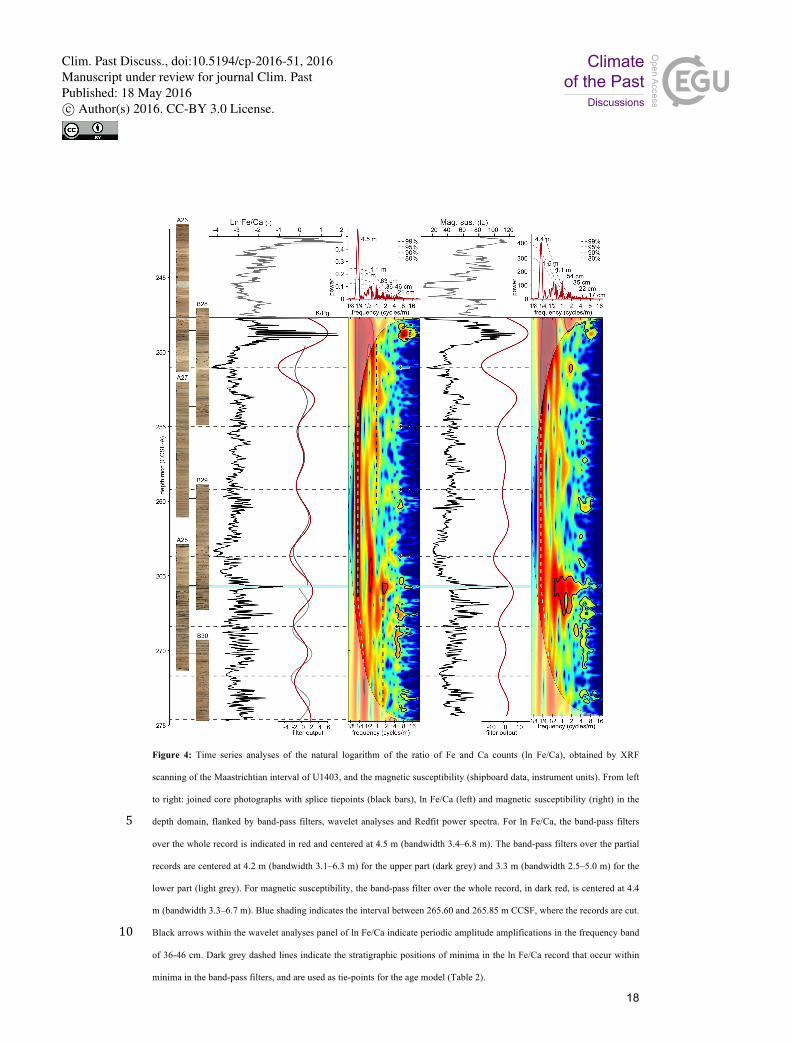
Figure 4: Time series analyses of the natural logarithm of the ratio of Fe and Ca counts (ln Fe/Ca), obtained by XRF
scanning of the Maastrichtian interval of U1403, and the magnetic susceptibility (shipboard data, instrument units). From left
to right: joined core photographs with splice tiepoints (black bars), ln Fe/Ca (left) and magnetic susceptibility (right) in the
depth domain, flanked by band-pass filters, wavelet analyses and Redfit power spectra. For ln Fe/Ca, the band-pass filters 5
over the whole record is indicated in red and centered at 4.5 m (bandwidth 3.4–6.8 m). The band-pass filters over the partial
records are centered at 4.2 m (bandwidth 3.1–6.3 m) for the upper part (dark grey) and 3.3 m (bandwidth 2.5–5.0 m) for the
lower part (light grey). For magnetic susceptibility, the band-pass filter over the whole record, in dark red, is centered at 4.4
m (bandwidth 3.3–6.7 m). Blue shading indicates the interval between 265.60 and 265.85 m CCSF, where the records are cut.
Black arrows within the wavelet analyses panel of ln Fe/Ca indicate periodic amplitude amplifications in the frequency band 10
of 36-46 cm. Dark grey dashed lines indicate the stratigraphic positions of minima in the ln Fe/Ca record that occur within
minima in the band-pass filters, and are used as tie-points for the age model (Table 2).
Clim. Past Discuss., doi:10.5194/cp-2016-51, 2016Manuscript under review for journal Clim. PastPublished: 18 May 2016c© Author(s) 2016. CC-BY 3.0 License.
19
Figure 5: Redfit power spectra of the partial records of ln Fe/Ca (left) and magnetic susceptibility (right). Top panel: the
upper interval between the peak at 265.6 m and the variability below the K/Pg boundary, starting at 249.56 m; middle panel:
the lower interval from the peak at 265.85 m downwards; bottom panel: the interval from the main variability below the 5
K/Pg, starting at 249.56 m, downwards.
10
15
99%95%90%80%
16840.25 0.5 1 2frequency (cycles/m)
pow
er
0
0.05
0.15
0.1
4.2 m
2.1 m1.0 m
44 cm22 cm
16 cm
Ln Fe/Ca 249.56–265.6 m
99%95%90%80%
16840.25 0.5 1 2frequency (cycles/m)
pow
er
0
0.2
0.1
Ln Fe/Ca 265.85–274.73 m
3.3 m
1.1 m20 cm
15 cm
pow
er
99%95%90%80%
16840.25 0.5 1 2frequency (cycles/m)
0
0.1
0.2
0.3
Ln Fe/Ca 249.56–274.73 m
4.3 m
1.6 m
21 cm17 cm
36-46 cm63 cm
1.1 m
Mag. sus. 249.54–265.53 m
99%95%90%80%
16840.25 0.5 1 2frequency (cycles/m)
pow
er
0
20
40
50
30
4.4 m2.1 m
93 cm
43 cm28 cm
22 cm17 cm
Mag. sus. 265.97–274.37 m
99%95%90%80%
16840.25 0.5 1 2frequency (cycles/m)
pow
er
0
20
80
100
60
40
53-64 cm35 cm
20-22 cm
3.0 m
Mag. sus. 249.54–274.37 m
99%95%90%80%
16840.25 0.5 1 2frequency (cycles/m)
pow
er
0
20
40
50
30
4.3 m 1.6-1.9 m
97 cm
53-64 cm35 cm
22 cm17 cm
Clim. Past Discuss., doi:10.5194/cp-2016-51, 2016Manuscript under review for journal Clim. PastPublished: 18 May 2016c© Author(s) 2016. CC-BY 3.0 License.
20
Figure 6: Time series analyses of the ln Fe/Ca and magnetic susceptibility records calibrated to the 405-kyr component of
eccentricity. Left: the ln Fe/Ca record in the time domain, flanked by a band-pass filter centered at 404 kyr (bandwidth 302–
612 kyr), and wavelet analyses, topped by a Redfit power spectrum. The curved grayscale lines indicate the 99%, 95%, 90%
and 80% confidence levels, from the uppermost to the lowermost, respectively. Right: idem for the magnetic susceptibility 5
record, with a band-pass filter centered at 417 kyr (bandwidth 313–627 kyr). Dark grey dashed lines indicate the positions of
minima in the ln Fe/Ca record that are used as tie-points in the age model. Ma405 numbers indicate the 405-kyr cycle from the
K/Pg boundary back in time.
10
-4 0 4¿OWHU�RXWSXW
-10 0 10¿OWHU�RXWSXW
0 1
66.5
67
67.5
68
68.5
-4 -3 -2 -166
/Q�)H�&D�(-)
21 4 32168 64128IUHTXHQF\��F\FOHV�0\U�
21 4 32168 64128IUHTXHQF\��F\FOHV�0\U�
21 4 32168 64128IUHTXHQF\��F\FOHV�0\U�
$JH��0
D�
SRZHU
0
0.02
0.040.03
0.01
0.05
SRZHU
0
10
3020
5
40 ����N\U99%95%90%80%
99%95%90%80%
����N\U
����N\U������N\U������N\U
���N\U���N\U 0DJ��VXV��(IU)
80 12010020 6040
���N\U������N\U
85-���N\U
���N\U
2 4 32168 64128IUHTXHQF\��F\FOHV�0\U�
0D4051
0D4052
0D4053
0D4054
0D4055
0D4056
0D4057
Clim. Past Discuss., doi:10.5194/cp-2016-51, 2016Manuscript under review for journal Clim. PastPublished: 18 May 2016c© Author(s) 2016. CC-BY 3.0 License.
21
Figure 7: Correlation of carbon isotope values from IODP Site U1403 with the d13C record of the Zumaia section (Batenburg
et al., 2012). Both records plotted against the age models derived from the independently established cyclostratigraphic
interpretations (this study and Batenburg et al., 2014). Black stippled lines indicate correlation points of the K/Pg boundary
and the MME. 5
66
67
68
69
70
Age
(Ma)
K/Pg
2.4 2.6 2.8 3
Site U1403
0.5 1 1.5 2
Zumaia
-2 20
Ma4051
Ma4052
Ma4053
Ma4054
Ma4055
Ma4056
Ma4057
Ma4058
Ma4059
405 kyr filter MS
ɷ13Ccarb (‰VPDB)
ɷ13Ccarb (‰VPDB)
MME
Clim. Past Discuss., doi:10.5194/cp-2016-51, 2016Manuscript under review for journal Clim. PastPublished: 18 May 2016c© Author(s) 2016. CC-BY 3.0 License.