m1209 water sewer mapping success - long beach...
TRANSCRIPT

December 2009
WATER &SEWER
M U N I C I P A L
TM
FOR SANITARY, STORM AND WATER SYSTEM MAINTENANCE PROFESSIONALS
www.mswmag.com
TECHNOLOGY TEST DRIVE: VACTOR 2100PLUS
COMBINATION TRUCKPAGE 40
HUMAN SIDE: EARNING LOYALTY FOR LIFE
PAGE 44
BETTER MOUSETRAPS:PRECHLORINATED PIPE BURSTING
PAGE 36
GIS and mapping technologieshelp the City of Long Beachchart a true coursePAGE 20
MAPPINGSUCCESS

COVER:The Long Beach Water Department has an ongoingsewer inspection program that covers the entiresewer system on a 5-year cycle. The city uses GIS andmapping systems to organize its water and wastewatersystem maintenance programs. From left are DanGalaz, water utility mechanic II; Walter Trujillo, waterutility supervisor I; Albert Lin, GIS officer; and RayPamintuan, GIS analyst. (Photography by Paul Kiler)
FIELD AND OFFICE TECHNOLOGY
TMWATER &SEWER
M U N I C I P A L
TM
FEATURES8 LETTERS TO THE EDITOR
14 SEWER: Training, Technology, TeamworkThe City of Santa Barbara creates an exemplary sewer maintenance program by putting the latest tools in the hands of an empowered and highly capable staff.By Suzan Marie Chin
20 WATER/SEWER: Mapping SuccessGIS and mapping technology help the City of Long Beach chart a course for water system maintenance, capital improvement, and community outreach.By Suzan Marie Chin
26 2010 EXPO: Worth Celebrating30th Pumper & Cleaner Environmental Expo International adds a new-product display, interactive floor plan, and Women in the Industry seminar to its proven mix of exhibits and education.By Ted J. Rulseh
32 STORM: Getting AggressiveAthens-Clarke County Stormwater makes inroads against pollution by building public support for innovative water-quality and flood-control features.By Scottie Dayton
36 BETTER MOUSETRAPS: Clean as a WhistlePipe bursting with prechlorinated HDPE pipe replaces 27,110 feet of water mains in Big Spring, Texas, with minimal disruption to property or businesses.By Scottie Dayton
40 TECHNOLOGY TEST DRIVE: Leap ForwardThe Vactor 2100Plus combination truck brings current technology and operator-friendly design to pipe cleaning and hydroexcavation.By Erik Gunn
COLUMNS10 FROM THE EDITOR: A Cure for (Institutional)
Memory LossTechnology isn’t a substitute for the knowledge of experienced people, but it can help raise everyone’s performance and offset effects of a wave of retirements.By Ted J. Rulseh
38 Association NewsPeople/Awards, Learning Opportunities, Calendar
44 THE HUMAN SIDE: Earn Loyalty for LifeHere is how you can protect your personal leadership brand by avoiding five behaviors that can damage you in the eyes of your team members.By Brenda Bence
46 NASSCO CORNER: Seals of ApprovalNASSCO certification programs are key components of QA/QC programs that ensure proper performance in pipeline rehabilitation projects.By Irvin Gemora
48 Product NewsProduct Spotlight: Integrated system provides complete pipe condition data.By Ken Wysocky
49 Industry News
DECEMBER 2009
COMING IN JANUARY 2010
Water System Maintenance and Rehabilitation
� Water: El Paso (Texas) Water Utilities� Storm: Sound approaches to BMP maintenance � Water: Consolidated Utility District of Rutherford County, Tenn.� Technology Test Drive: Panoramo SI manhole inspection system, RapidView LLC
20
14
32
36
INSIDE:
40
t’s an understatementto say the City of LongBeach Water Departmentis passionate about Geographic Information
Systems (GIS). The department, responsible for
the potable water and reclaimedwater distribution and wastewatercollection for a California city of493,000, has incorporated GIS andmethods that go well beyond thetechnology’s original purpose. Thedepartment has created a dynamic,organization-wide system that helpsthe staff manage day-to-day mainte-nance, scheduling, long-range capital improvement planning,and the tracking of all assets’ healthand performance.
Blazing a trailThe department was quick to
jump on board with GIS in itsinfancy: It began integrating thetechnology in 1994. Although GIS
was new then, the EngineeringBureau quickly saw its long-rangepotential and championed its usethroughout the organization.
When selecting the GIS plat-form, the Engineering Bureaufound it critical to have as manypeople as possible from all bureausinvolved in developing the needsassessment documentation. Selec-tion criteria included:
• Ease of use.• Ability to customize.• Compatibility with other soft-
ware and operating systems.• Product reputation and indus-
try acceptance.• After-sales technical support.• Overall cost of ownership. The department chose ESRI
Inc. and adopted the ArcMap,ArcView, ArcInfo, ArcIMS, ArcGISPublisher, SDE, EDN and SpatialAnalyst software components andmade a major investment in hard-ware, including servers with 100
networked PCs and 20 field-usecomputers.
“During the early transitionfrom our paper-based system,many employees were not enthusi-astic about using GIS because itwas new and complicated,” saysAlbert Lin, GIS officer for thedepartment. “They had been doingtheir work with a manual, paper-based system for so many years,and it was comfortable. Most hadto learn basic computer skills first before even beginning to usethe GIS.
“We overcame their objectionsby getting users involved at everylevel — motivating them, provid-ing management support, promot-ing communication, and workingtogether to create a user-friendlyapplication. Because we did this,GIS is now a common tool essen-tial to all employees’ daily work.”
The department had numer-ous goals for its GIS and took the
FOCUS: WATER/SEWER
GIS and mapping technology help the City of Long Beach chart a course foreffective water system maintenance, capital improvement, and community outreach By Suzan Marie Chin
PROFILE: Water Department,City of Long Beach,Calif. FOUNDED:1911
POPULATION SERVED:493,000
EMPLOYEES:220
INFRASTRUCTURE:910 miles of water mains,712 miles of sanitary sewermains, 33 miles of reclaimedwater mains
OPERATIONS BUDGET:$112 million
WEB SITE:www.lbwater.org
I
MAPPINGSUCCESS
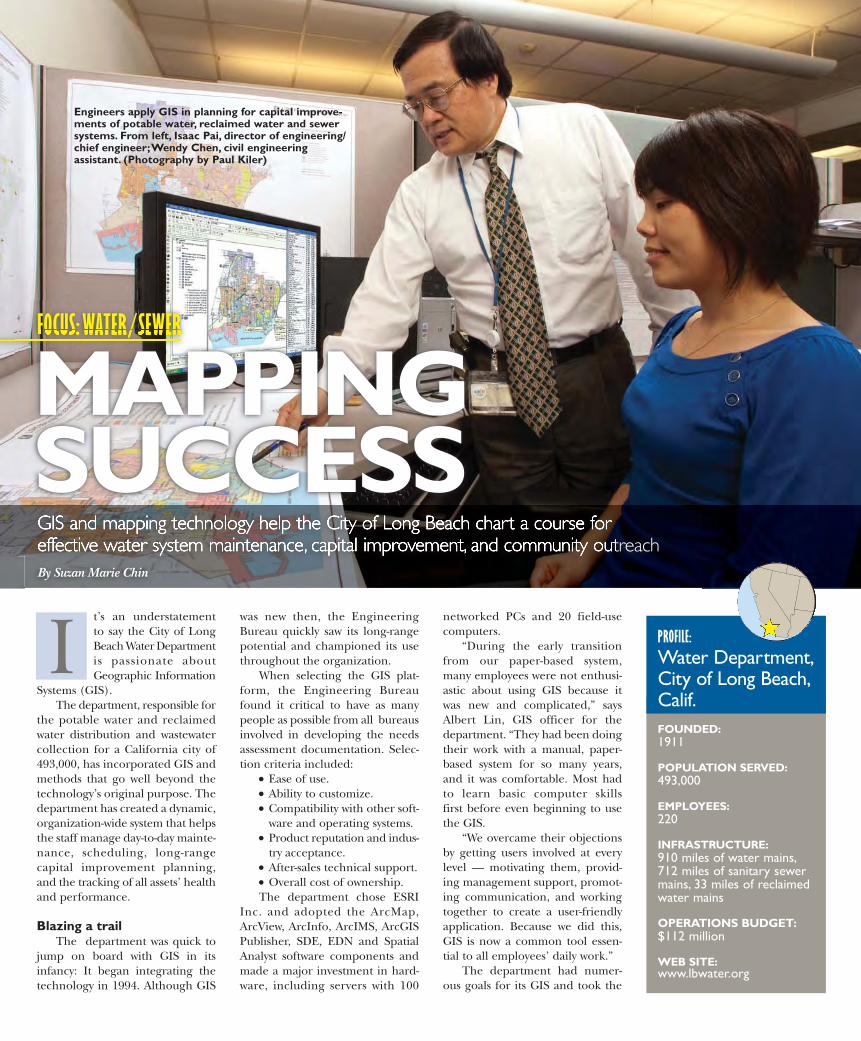
Engineers apply GIS in planning for capital improve-ments of potable water, reclaimed water and sewersystems. From left, Isaac Pai, director of engineering/chief engineer; Wendy Chen, civil engineering assistant. (Photography by Paul Kiler)

time necessary to implement themmethodically and to convert itspaper data accurately to the computerized system. The entireprocess took about two years tocomplete, with the assistance of anoutside consulting firm, Geonex,which digitized the hard-copywater and sewer system maps withcomprehensive attribute databases.About 30 staff members wereinvolved in the GIS databasedesign, as-built record drawingsresearch, and data quality assur-ance/quality control (QA/QC) dur-ing the GIS data conversion.
Evolution of purposeAt present, the department has
80 GIS users — managers, engi-neers, field crews and administra-tive analysts. All use the system toquery and analyze informationsuch as water and sewer system data,
locations, conditions, trends andpatterns. The information helpsthem to explore alternatives andcreate strategies for facility manage-ment and specific bureau needs.
To help keep the GIS data cur-rent, the department draws froman aggressive, ongoing CCTVinspection and cleaning program,which covers the entire wastewatercollection system — a five-yearcycle for inspection and a two-yearcycle for cleaning. Five PearpointCCTV inspection vehicles carryonboard computers using flexidatapipe survey software by PipeLogixInc. The crews perform mainline,lateral and manhole inspectionusing the NASSCO PACP (PipelineAssessment and Certification Pro-gram), LACP (Lateral Assessmentand Certification Program) andMACP (Manhole Assessment andCertification Program) standards.
Each installation of the surveysoftware also includes a GIS mod-ule that gives the CCTV operatorsa visual aid in selecting the pipe tosurvey and imports the asset detailsdirectly from the GIS databases. As the crews progress with inspec-tions, surveyed pipes are auto-selected and highlighted to letteam members know which pipeshave been completed.
THE BIG PICTURE
In keeping with its commitment to provide the highest quality ofwater and wastewater services, the Long Beach Water Departmentdecided to share the benefits of its GIS in an innovative way.
The department has installed a free public access computer in itslobby, equipped with a 48-inch LCD screen connected to the GIS data-base and a color printer. Customers can use the system to get detailedinformation about their water services, meters, or sewer laterals andgenerate paper map printouts in color or black-and-white.
The system can also provide overlay information that shows adja-cent utilities, easements and other data customers may need whenconsidering a repair or improvement to their property.
The information helps customers interact with staff easily and under-stand how their water and sewer services integrate with the city systems.
It helps for homeowners and contractors to see the big picture sothat if they need permits for a property improvement or repair, theycan get all the required paperwork at the same time. That makes thepermitting process more streamlined and efficient.
“We overcame their objections by getting
users involved at every level — motivating them, providing management
support, promoting com-munication, and working
with them to create a user-friendly application. Because we did this, GIS
is now a common tool essential to all employees’
daily work.”Albert Lin
Field crews use GIS to access the latest water and wastewatersystems data for routine facilitymaintenance and emergencyresponse. Shown flushing ahydrant are Vicente Robles (left),water utility mechanic III, andHans Herchert, water utilitysupervisor II.
The Long Beach Water Departmentprovides online GIS access to its latestwater and sewer mains and lateral services information at its DevelopmentService Counter, which enhancesLBWD’s excellent customer services.Shown with a customer is Dennis Santos(right), civil engineering assistant.

“Out in the field, having GISincorporated into the survey processhas made my life a lot easier,” saysChris Blevins, water utility mechanicIII in the CCTV Group, SewerOperations. “With the map systemon the truck, I can go directly tothe GIS map through software,highlight the pipe I’m about totelevise, and create my survey. Itwill automatically populate themanhole names, their numbers,the depths, what material it is and any other information that isavailable.”
“Once I’ve completed the sur-vey, I can download that to ourserver. Then anybody can take itand, at their fingertips, click to
select that pipe and retrieve myinformation. Then they can gothrough and highlight that line asa grease problem, as a root prob-lem, or for cracks and otherdefects. That helps them create aplan of action for maintenance orrehabilitation.”
As the department performsvarious inspections, maintenancetasks and repairs, all the informa-tion is fed to the GIS. This led to aGIS system that contains more than100 data layers. For its potablewater and reclaimed systems, itemssuch as mains, valves, hydrants,meters, cathodic protection andvaults are recorded. Wastewatercollection system layers includemains, flow direction, manholes,cleanouts, pump stations, greasetraps, as-built drawings, sewer spillhistory, laterals and others. Otherlayers, such as lots, assessor parcels,flood zones, gas pipelines, censusdata and aerial photos, round outthe data elements.
Charting the courseAll this data helps the Engineer-
ing Bureau chart the utility’s course
for capital improvements, mainte-nance scheduling, and operationalimprovements of the systems.
“The GIS system has created a common platform,” says ChrisWilkerson, sewer operations super-intendent. “By using standardizedcoding like PACP and then havingall of that data in one area, in a single format and platform, theCCTV crews and EngineeringBureau can review the data together,communicate and have a commonunderstanding of the condition ofthe system. Then we can worktogether to prioritize what assetsneed to be maintained, rehabilitat-ed or replaced, how they should bedealt with and when.”
The system also maps preven-tive maintenance tasks and aids inscheduling. For example, maps arehighlighted in special colors frommanhole to manhole, indicatingwhich lines have experienced sani-tary sewer overflows (SSOs) orneed cleaning more frequently.These highlights help in creating90-, 120- or 180-day repeat lists forthe cleaning crews.
Highlights are also created forthe system’s inverted siphons. “Ourcrews are able to look up the high-lights and go straight to theminstead of fumbling around, tryingto locate these points on a regularhard map,” says Wilkerson. “Bybeing able to get to this informa-tion easily, we can extract specificmaps, create a ‘book’ for the crew.Then they can deploy to exactlywhere they need to be in the cityquickly.”
Eventually, all of the field crewsand trucks will be equipped withportable computers and the GISdata. The goal is to create a paper-less field process. “There was someresistance to this idea at first, butnow that some of the crews havetried it, they really like it, especial-ly not having to refer to the heavy,hard-copy maps in their trucks any-more,” says Wilkerson.
Special programs and usesThe GIS has made a significant
contribution to the success of thedepartment’s capital improvementprogram. During the past 10 years,the department has invested nearly$90 million to replace its cast-ironwater mains (as much as 107,000linear feet per year) with ductile-iron mains. The Engineering
Bureau has been using GIS totrack and analyze main breaks. To identify and prioritize mainreplacements, engineers captureand analyze data on main breaksover a 20-year period.
A special GIS application calcu-lates main-break frequency on anindividual pipe and then lists thepipes in descending order fromhigh- to low-break frequency. Thislist helps the engineer formulateand define more specific criteria to locate the mains with highestbreak tendencies and outline pipereplacement schedules for the
coming five years. As a result, mainbreaks have been reduced from160-180 per year (in the early1990s) to 20-30 per year.
Never one to rest on its laurels,the department is developing anew FOG prevention program.Using its GIS, the staff has createdspecial databases to track sewagespills by location, cause, estimatedsize, sewer manhole number, andother criteria, along with citywidefood businesses and grease inter-ceptor locations.
Engineering Bureau and SewerOperations staff members use the
“There was some
resistance to this idea
at first, but now that
some of the crew have
tried it, they really like
it, especially not having
to refer to the heavy,
hard-copy maps in their
trucks anymore.”
Chris Wilkerson
A GIS map (upper left) highlights CCTV-surveyed sanitary sewer mains.CCTV digital video is at the lower left. A flexidata CCTV data table is onthe right.
A map shows Proposed Capital Improvements Program projects (potablewater, reclaimed water, sanitary sewer systems and facilities) overlaid onstreets and the Council Districts.

GIS to identify all food businesseswith or without grease intercep-tors. After a SSO, the detailedinformation in the FOG databaseis available to the CCTV crews sothey can use an incident follow-upinspection to pinpoint the sourceof the FOG that contributed to theoverflow. Armed with this detailedinformation, the department cantake the proper enforcement meas-ures and minimize future mainte-nance costs caused by FOG.
The technology also helps ona more personal level. “GIS is anextremely useful tool for us in newemployee training,” says Isaac Pai,director of engineering/chief engi-neer. “When an engineer or fieldcrew member comes on board, weuse GIS to help them learn andunderstand our systems. The sim-ple access and unified visual for-mat provides them an easy way tosee the entire water and wastewatersystems — how they are laid outand how all the components worktogether.”
Coming full circleIn many cities similar in size to
Long Beach, GIS is just one com-ponent of a larger asset manage-ment system. In Long Beach, GISis the asset management program.By involving staff from all bureausand levels of expertise, the Engin-eering Bureau and GIS staff has
taken the technology beyond itsoriginal purpose, eliminating theneed for an additional costly pro-gram.
The system is constantly beingimproved and expanded to offerall bureaus ways to increase pro-ductivity, improve decision-making,and expand capabilities to performlarge tasks previously thoughtimpractical. Like an asset manage-ment program, it has also improvedrecords management and accessi-
bility, reduced redundant data,and saved time and money.
By being unafraid to push theboundaries of GIS technology, theLong Beach Water Departmenthas created a showcase for GIS pro-fessionals around the world andshows how technology can pointthe way to successful data manage-ment and high-performing waterand wastewater systems. �
MORE INFO:220
8
37
ESRI Inc.800/447-9778www.esri.com
Pearpoint Inc.800/688-8094www.radiodetection.com
PipeLogix Inc.866/299-3150www.flexi-data.com
Field personnel use GIS to plan their work in the Water OperationsService Center. From left, Bobby Jones, water utility supervisor II; PeteYbarra, water utility supervisor I; Hans Herchert, water utility supervisorII; Vicente Robles, water utility mechanic III; Robert Katzenberger, wateroperations superintendent; and Travis Colton, water utility mechanic II.
Reprinted with permission from Municipal Sewer & Water™ / December 2009 / © 2009, COLE Publishing Inc., P.O. Box 220, Three Lakes, WI 54562 / 800-257-7222 / www.mswmag.com