m aking s cheduling Òc oolÓ: t em perature-a w are w
TRANSCRIPT

Making Scheduling “Cool”:Temperature-Aware Workload Placement in Data Centers∗
Justin Moore† Jeff Chase† Parthasarathy Ranganathan‡ Ratnesh Sharma‡
†Department of Computer ScienceDuke University
{justin,chase}@duke.edu
‡Internet Systems and Storage LabHewlett Packard Labs
{partha.ranganathan, ratnesh.sharma}@hp.com
Abstract
Trends towards consolidation and higher-density comput-ing configurations make the problem of heat managementone of the critical challenges in emerging data centers.Conventional approaches to addressing this problem havefocused at the facilities level to develop new cooling tech-nologies or optimize the delivery of cooling. In contrast tothese approaches, our paper explores an alternate dimen-sion to address this problem, namely a systems-level so-lution to control the heat generation through temperature-aware workload placement.
We first examine a theoretic thermodynamic formulationthat uses information about steady state hot spots and coldspots in the data center and develop real-world schedulingalgorithms. Based on the insights from these results, wedevelop an alternate approach. Our new approach lever-ages the non-intuitive observation that the source of cool-ing inefficiencies can often be in locations spatially un-correlated with its manifested consequences; this enablesadditional energy savings. Overall, our results demon-strate up to a factor of two reduction in annual data cen-ter cooling costs over location-agnostic workload distri-bution, purely through software optimizations without theneed for any costly capital investment.
1 Introduction
The last few years have seen a dramatic increase in thenumber, size, and uses of data centers. Large data cen-ters contain up to tens of thousands of servers and supporthundreds or thousands of users. For such data centers, inaddition to traditional IT infrastructure issues, designersincreasingly need to deal with issues of power consump-tion, heat dissipation, and cooling provisioning.
∗This work is supported in part by HP Labs, and the U.S. NationalScience Foundation (EIA-9972879, ANI-0330658, and ANI-0126231).
These issues, though traditionally the domain of facili-ties management, have become important to address atthe IT level because of their implications on cost, relia-bility, and dynamic response to data center events. Forexample, the total cooling costs for large data centers(30,000 ft2) can run into the tens of millions of dollars.Similarly, brownouts or cooling failures can lead to a re-duced mean time between failure and service outages, asservers that overheat will automatically shut down. Fur-thermore, increases in server utilization [7, 16] or the fail-ure of a CRAC unit can upset the current environment ina matter of minutes or even seconds, requiring rapid re-sponse strategies, often faster than what is possible at afacilities level. These conditions will accelerate as proces-sor densities increase, administrators replace 1U serverswith blades, and organizations consolidate multiple clus-ters into larger data centers.
Current work in the field of thermal management exploresefficient methods of extracting heat from the data cen-ter [23, 27]. In contrast, our work explores temperature-aware workload placement algorithms. This approach fo-cuses on scheduling workloads in a data center — andthe resulting heat the servers generate — in a manner thatminimizes the energy expended by the cooling infrastruc-ture, leading to lower cooling costs and increased hard-ware reliability.
We develop temperature-aware workload placement algo-rithms and present the first comprehensive exploration ofthe benefits from these policies. Using simple methods ofobserving hot air flow within a data center, we formulatetwo workload placement policies: zone-based discretiza-tion (ZBD) and minimize-heat-recirculation (MINHR).These algorithms establish a prioritized list of serverswithin the data center, simplifying the task of applyingthese algorithms to real-work systems.
The first policy leverages a theoretic thermodynamic for-mulation based on steady-state hot spots and cold spots in
the data center [27]. The second policy uses a new formu-lation based on the observation that often the measuredeffects of cooling inefficiencies are not located near theoriginal source of the heat; in other words, heat may travelseveral meters through the data center before arriving at atemperature sensor. In both cases, our algorithms achievethe theoretical heat distribution recommendations, givendiscrete power states imposed by real-world constraints.We show how these algorithms can nearly halve coolingcosts over the worst-case placement for a simple data cen-ter, and achieve an additional 18% in cooling savings be-yond previous work. Based on these improvements wecan eliminate more than 25% of the total cooling costs.Such savings in the 30,000 ft2 data center mentioned ear-lier translate to a a $1 – $2 million annual cost reduction.Furthermore, our work is complementary to current ap-proaches; given a fixed cooling configuration, we quantifythe cost of adding load to specific servers. A data centerowner can use these costs to maximize the utilization perWatt of their compute and cooling infrastructure.
The rest of this paper is organized as follows. Sec-tion 2 elaborates the motivation for this work and dis-cusses the limitations of conventional facilities-only ap-proaches. Section 3 describes the goals of temperature-aware workload placement and discusses the algorithmsthat we propose — ZBD and MINHR — as well as threebaseline algorithms provided for comparison. Sections 4and 5 present our results and discuss their implications.Section 6 concludes the paper.
2 Motivation
As yesterday’s clusters grow into today’s data centers, in-frastructure traditionally maintained by a facilities man-agement team — such as cooling and the room’s powergrid — are becoming an integral part of data center de-sign. No longer can data center operators focus solely onIT-level performance considerations, such as selecting theappropriate interconnect fiber or amount of memory pernode. They now need to additionally evaluate issues deal-ing with power consumption and heat extraction.
For example, current-generation 1U servers consume over350 Watts at peak utilization, releasing much of this en-ergy as heat; a standard 42U rack of such servers con-sumes over 8 kW. Barroso et al estimate that the powerdensity of the Google data center is three to ten timesthat of typical commercial data centers [10]. Their datacenter uses commodity mid-range servers; that density islikely to be higher with newer, more power-hungry serverchoices. As data centers migrate to bladed servers overthe next few years, these numbers could potentially in-crease to 55 kW per rack [21].
2.1 Thermal Management Benefits
A thermal management policy that considers facilitiescomponents, such as CRAC units and the physical layoutof the data center, and temperature-aware IT components,can:
Decrease cooling costs. In a 30,000 ft2 data center with1000 standard computing racks, each consuming 10 kW,the initial cost of purchasing and installing the computerroom air conditioning (CRAC) units is $2 – $5 million;with an average electricity cost of $100/MWhr, the an-nual costs for cooling alone are $4 – $8 million [23]. Adata center that can run the same computational workloadand cooling configuration, but maintain an ambient roomtemperature that is 5◦C cooler, through intelligent ther-mal management can lower CRAC power consumptionby 20% – 40% for a $1 – $3 million savings in annualcooling costs.
Increase hardware reliability. A recent study [28] indi-cated that in order to avoid thermal redlining, a typicalserver needs to have the air temperature at its front inletsbe in the range of 20◦C – 30◦C. Every 10◦C increase over21◦C decreases the reliability of long-term electronics by50%. Other studies show that a 15◦C rise increases harddisk drive failure rates by a factor of two [6, 13].
Decrease response times to transients and emergencies.Data center conditions can change rapidly. Sharp transientspikes in server utilization [7, 16] or the failure of a CRACunit can upset the current environment in a matter of min-utes or even seconds. With aggressive heat densities in thedata center, such events can result in potentially disruptivedowntimes due to the slow response times possible withthe mechanical components at the facilities level.
Increase compaction and improve operational efficien-cies. A high ratio of cooling power to compute power lim-its the compaction and consolidation possible in data cen-ters, correspondingly increasing the management costs.
2.2 Existing Approaches
Data centers seek to provision the cooling adequately toextract the heat produced by servers, switches, and otherhardware. Current approaches to data centers cooling pro-visioning are done at the facilities level. Typically, a datacenter operator will add the nameplate power ratings ofall the servers in the data center — often with some ad-ditional slack for risk tolerance — and design a coolinginfrastructure based on that number. This can lead to anexcessive, inefficient cooling solution. This problem isexacerbated by the fact that the compute infrastructure inmost data centers are provisioned for the peak (bursty)load requirement. It is estimated that typical operationsof the data center often use only a fraction of the servers,
leading to overall low server utilization [18]. The com-pounded overprovisioning of compute and cooling infras-tructure drives up initial and recurring costs. For everyWatt of power consumed by the compute infrastructure, amodern data center expends another one-half to one Wattto power the cooling infrastructure [23, 28].
In addition, the granularity of control provided in currentcooling solutions makes it difficult to identify and elim-inate the specific sources of cooling inefficiencies. Airflow within a data center is complex, nonintuitive, andeasy to disrupt [23]. Changes to the heating system —servers and other hardware — or the CRAC units will takeminutes to propagate through the room, complicating theprocess of characterizing air flow within the room.
Past work on data center thermal management falls intoone of two categories. First, optimizing the flow of hotand cold air in the data center. Second, minimizingglobal power consumption and heat generation. The for-mer approaches evaluate layout of the computing equip-ment in the data center to minimize air flow inefficien-cies (e.g., hot aisles and cold aisles) [28] or design intelli-gent system controllers to improve cold air delivery [23].The latter approaches focus on location-oblivious, globalsystem power consumption (total heat load) through theuse of global power management [12, 25], load balanc-ing [11, 24], and power reduction features in individualservers [14].
2.3 Temperature-aware Workload Placement
However, these approaches do not address the potentialbenefits from controlling the workload (and hence heatplacement) from the point of view of minimizing the cool-ing costs. Addressing thermal and power issues at the ITlevel — by incorporating temperature-related metrics inprovisioning and assignment decisions — is complemen-tary to existing solutions. The last few years have seen apush to treat energy as a first-class resource in hardwareand operating system design, from low-power processorsto OS schedulers [29, 31]. A facilities-aware IT compo-nent operates at a finer granularity than CRAC units. Itcan not only react to the heat servers generate, but controlwhen and where the heat arrives. During normal opera-tions, a temperature-aware IT component can maintain anefficient thermal profile within the data center, resultingin reduced annual cooling costs. In the event of a thermalemergency, IT-level actions include scaling back on serverCPU utilization, scaling CPU voltages [14], migrating orshifting workload [22, 11], and performing a clean shut-down of selected servers.
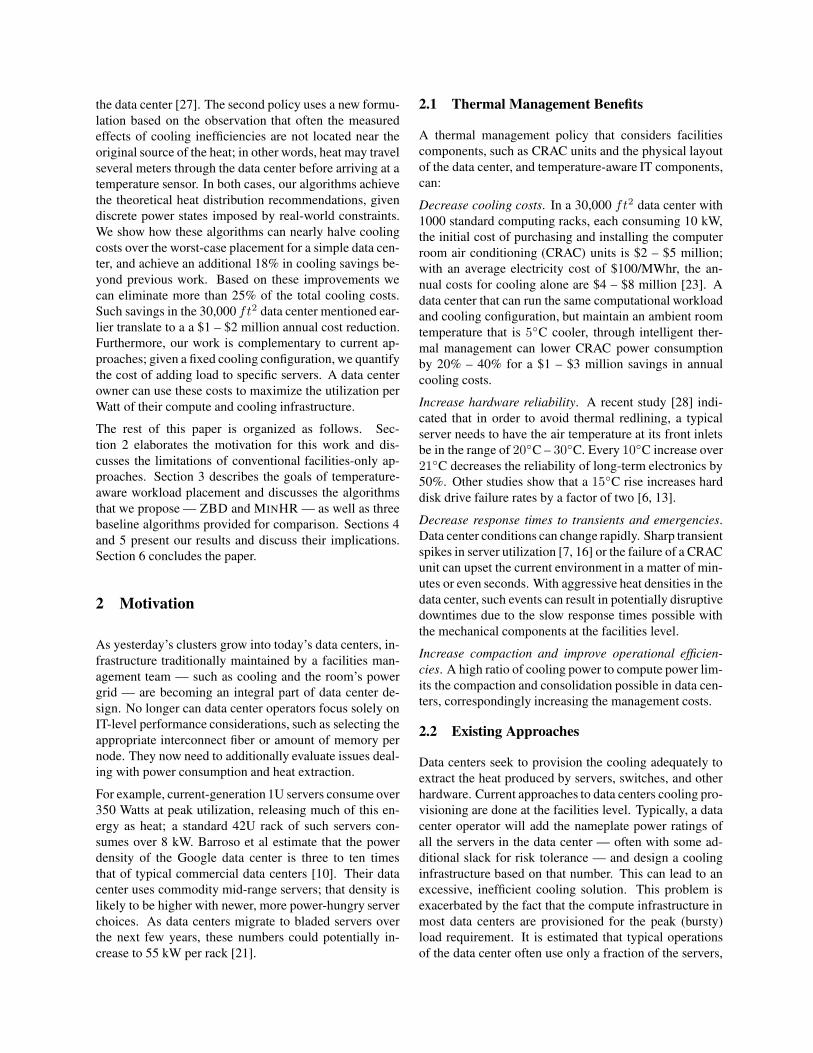
Figure 1 presents an informal sketch to illustrate the po-tential of this approach. The cooling costs of a data centerare plotted as a function of the data center utilization —increased utilization produces larger heat loads, resulting
Coo
ling
Cos
ts
Percent Data Center Utilization
Best PlacementWorst Placement
Figure 1: Approximate trends in cooling costs as a data cen-ter’s utilization increases. Workload placement algorithms af-fect cooling costs by the assignment choices they make. At theextreme ends — all servers idle and all servers used — there areno choices. However, at all other times there exists a best and aworst workload placement strategy.
in higher cooling costs. At any given data center utiliza-tion, there is a best and worst workload placement strat-egy. The difference between the two lines indicate thepotential benefits from our approach.
As Figure 1 indicates, the benefits of our approach arelimited at the two end points — a data center at “0%”utilization or at “100%” utilization does not offer muchscope for workload placement to reduce cooling costs. Inthe former, all servers are idle; in the latter, all servers arein use. In neither case do we have any choice in how todeploy workload. The benefits from temperature-awareworkload placement exist at intermediate utilization lev-els when we can choose how we place our workload. Typ-ical data centers do not maintain 100% utilization for ex-tended periods of time, instead operating at mid-level uti-lizations where we can leverage temperature-aware work-load placement algorithms [18].
The slope and “knee” of each curve is different for eachdata center, and reflects the quality of the physical layoutof the data center. For example, a “best placement” curvewith a knee at high utilization indicates a well laid-outdata center with good air flow. However, given the ineffi-ciencies resulting from the coarse granularity of control inpure facilities-based approach, we expect most data cen-ters to exhibit a significant difference between the worst-case and best-case curves.
3 Workload Placement Policies
At a high level, the goals of any temperature-aware work-load placement policy are to

• Prevent server inlet temperatures from crossing apre-defined “safe” threshold.
• Maximize the temperature of the air the CRAC unitspump into the data center, increasing their operatingefficiency.
This section provides a brief overview of the thermody-namics of cooling, how intelligent workload placementreduces CRAC unit power consumption, and describesour placement policies.
3.1 Thermodynamics
The cooling cycle of a typical data center operates in thefollowing way. CRAC units operate by extracting heatfrom the data center and pumping cold air into the room,usually through a pressurized floor plenum. The pressureforces the cold air upward through vented tiles, enteringthe room in front of the hardware. Fans draw the cold airinward and through the server; hot air exits through therear of the server. The hot air rises — sometimes with theaid of fans and a ceiling plenum — and is sucked backto the CRAC units. The CRAC units force the hot airpast pipes containing cold air or water. The heat fromthe returning air transfers through the pipes to the coldsubstance. The now-heated substance leaves the room andgoes to a chiller, and CRAC fans force the now-cold airback into the floor plenum.
The efficiency of this cycle depends on several factors, in-cluding the conductive substance and the air flow velocity,but is quantified by a Coefficient of Performance (COP).The COP is the ratio of heat removed (Q) to the amountof work necessary (W ) to remove that heat:
COP =Q
W
W =Q
COP
Therefore, the work necessary to remove heat is inverselyproportional to the COP. A higher COP indicates a moreefficient process, requiring less work to remove a constantamount of heat. For example, a cooling cycle with a COPof two will consume 50 kW to remove 100 kW of heat,whereas a cycle with a COP of five will consume 20 kWto remove 100 kW.
However, the COP for a cooling cycle is not constant, in-creasing with the temperature of the air the CRAC unitpushes into the plenum. We achieve cost savings by rais-ing the plenum supply temperature, moving the CRACunits into a more efficient operating range. Figure 2 showshow the COP increases with higher supply temperaturesfor a typical water-chilled CRAC unit; this curve is froma water-chilled CRAC unit in the HP Utility Data Center.For example, if air returns to the CRAC unit at 20◦C and
0
1
2
3
4
5
6
7
8
10 12 14 16 18 20 22 24 26 28 30
Coe
ffici
ent o
f Per
form
ance
(Hea
t Rem
oved
/ W
ork)
CRAC Supply Temperature (C)
COP = (0.0068*T2 + 0.0008*T + 0.458)
Figure 2: The Coefficient of Performance (COP) curve for thechilled-water CRAC units at the HP Labs Utility Data Center.As the target temperature of the air the CRAC pumps into thefloor plenum increases, the COP increases, and the CRAC ex-pends less energy to remove the same amount of heat.
we remove 10 kW of heat, cooling that air to 15◦C, weexpend 5.26 kW. However, if we raise the plenum supplytemperature to 20◦C, everything in the data center warmsby 5◦C. Cooling the same volume of air, now returning at25◦C, to 20◦C removes the same 10 kW of heat, but onlyexpends 3.23 kW. This is a power savings of almost 40%.
Consequently, our scheduling policies attempt to maxi-mize cooling efficiency by raising the maximum temper-ature of the air coming from the CRAC units and flowinginto the plenum. Obviously, this has to be done in a man-ner that maintains prevents the server inlet temperaturesfrom crossing their redlining thermal threshold.
3.2 Terminology
At a fundamental level, we categorize power allocationalgorithms as either analog or digital. “Analog” algo-rithms specify per-server power budgets from the contin-uous range of real numbers [ Poff , Pmax ]. While analogalgorithms provide a detailed per-server budget, they arehard to implement in practice. It may be possible to meetthese goals — a data center operator may deploy fine-grained load balancing in a web farm [8], utilize CPUvoltage scaling [14], or leverage virtual machines [1, 9]for batch workloads — but in practice it is difficult to meetand maintain precise targets for power consumption.
“Digital” algorithms assign one of several pre-determineddiscrete power states to each server. They select whichmachines should be off, idle, or in use, particularly forworkloads that fully utilize the processors. They couldalso leverage the detailed relationship between server uti-lization and power consumption to allow few discrete uti-lization states. Additionally, a well-ordered digital al-
gorithm will create a list of servers sorted by their “de-sirability”; the list ordering is fixed for a given coolingconfiguration, but does not change for different data cen-ter utilization levels. Therefore, if data center utilizationjumps from 50% to 60%, the servers selected for use at50% are a proper subset of those selected at 60% uti-lization. Well-ordered algorithms simplify the process ofintegrating cooling-aware features with existing compo-nents such as SGE [4] or LSF [3], allowing us to usecommon mechanisms such as scheduling priorities. Forexample, SGE allows the administrator to define arbitrary“consumable” resources and simple formulas to force thescheduler to consider these resources when performingworkload placement; modifying these resource settings isonly necessary after a calibration run.
In this paper, we focus on algorithms that address theproblem of discrete power states. We specifically focuson compute-intensive batch jobs such as multimedia ren-dering workloads, simulations, or distributed computationrun for several hours [5]. These jobs tend to use all avail-able CPU on a server, transforming the per-server powerbudgets available to a data center scheduler from a con-tinuous range of [ Poff , Pmax ] to a discrete set of powerstates: { Poff , Pidle, P1, . . ., PN }, where Pj is the powerconsumed by a server fully utilizing j CPUs. Addition-ally, they also provide sufficient time for the thermal con-ditions in the room to reach steady-state. If additionalpower states are considered, Section 5 discusses how ouralgorithms scale in a straightforward manner.
3.3 Baseline Algorithms
We use three reference algorithms as a basis for compari-son.
UniformWorkload and CoolestInletsThe first algorithm is UNIFORMWORKLOAD, an “intu-itive” analog algorithm that calculates the total powerconsumed by the data center and distributes it evenly toeach of the servers. We chose this algorithm because, overtime, an algorithm that places workload randomly willapproach the behavior of UNIFORMWORKLOAD. Eachserver in our data center consumes 150 Watts when idleand 285 Watts when at peak utilization. Thus, a 40% UNI-FORMWORKLOAD will place ((285−150)·0.40)+150 =204 Watts on each server.
The second baseline algorithm is COOLESTINLETS, adigital algorithm that sorts the list of unused servers bytheir inlet temperatures. This intuitive policy simplyplaces workload on servers in the coldest part of the datacenter. Such an algorithm is trivial to deploy, given aninstrumentation infrastructure that reports current servertemperatures.
OnePassAnalog
0
0.1
0.2
0.3
0.4
0.5
0.6
0.7
0.8
0.9
1
24 26 28 30 32 34 36 38 40
Per
cent
of S
erve
rs
Server Outlet Temperature (C)
UniformWorkloadCoolestInlets
OnePassAnalog
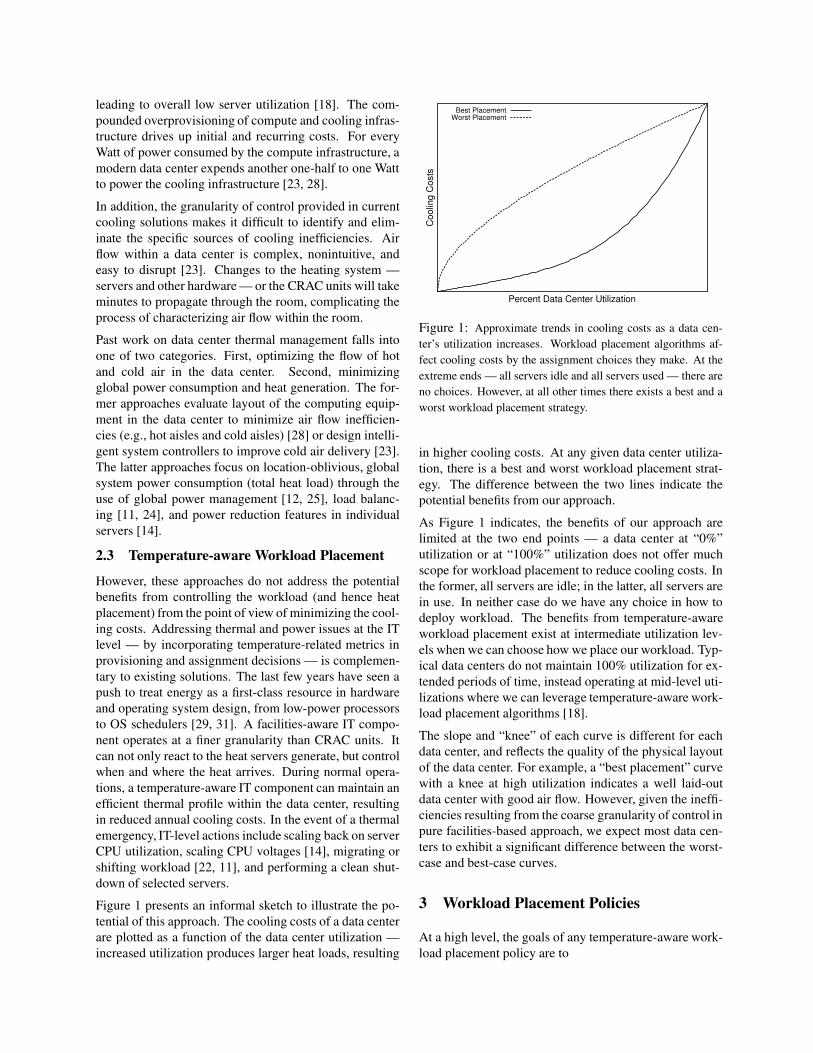
Figure 3: CDF of server exhaust temperatures for the three ref-erence workload placement algorithms at 60% utilization. BothCOOLESTINLETS and ONEPASSANALOG base workload place-ment decisions on data center conditions. However, ONEPAS-SANALOG has the least variance in server exhaust temperatures(4◦C) leading to fewer heat buildups in the data center. Lessvariance allows us to raise CRAC supply temperatures further,increasing the COP, without causing thermal redlining.
The last policy is ONEPASSANALOG, an analog repro-visioning algorithm based on the theoretical thermody-namic formulation by Sharma et al [27], modified withthe help of the original authors to allocate power on a per-server basis. The algorithm works by assigning powerbudgets in a way that attempts to create a uniform exhaustprofile, avoiding the formation of any heat imbalances or“hot spots”. A data center administrator runs one calibra-tion phase, in which they place a uniform workload oneach server and observe each server’s inlet temperature.The administrator selects a reference { power, outlet tem-perature } tuple, { Pref , T out
ref }; this reference point canbe one server, or the average server power consumptionand outlet temperature within a row or throughout the datacenter. With this tuple, we calculate the power budget foreach server:
Pi =T out
ref
T outi
· Pref
A server’s power budget, Pi, is inversely proportional toits outlet temperature, T out
i . Intuitively, we want to addheat to cool areas and remove it from warm areas.
It is important to note that ONEPASSANALOG respondsto heat buildup by changing the power budget at the lo-cation of the observed increase. Intuitively, this is similarto other approaches — including the motherboard’s ther-mal kill switch — in that it addresses the observed effectrather than the cause.
Figure 3 shows the CDF of server exhaust temperaturesfor the three reference workload placement algorithms in
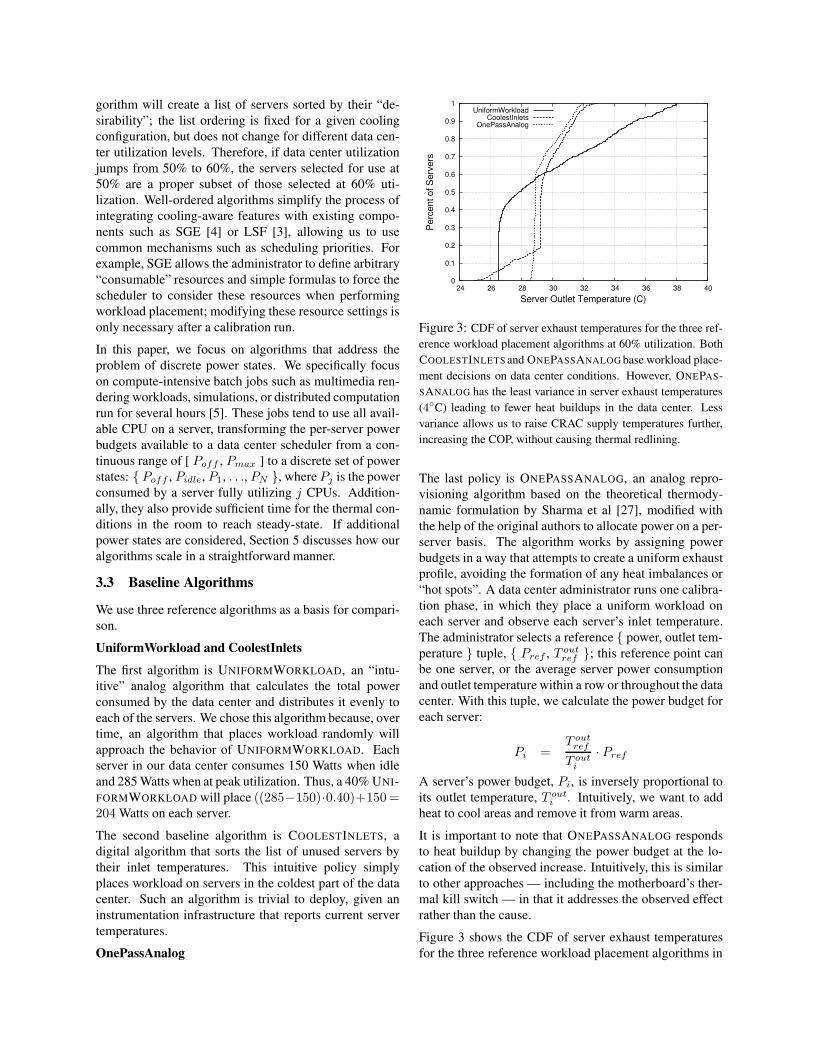
ZONEBASEDDISCRETIZATION(n, V , H , α) {while selected less than n servers {
Get Si, idle server with max power budgetPneed = Prun − PSi
WeightNeighbors = α·size(V ) + size(H)Pshare = Pneed/WeightNeighbors
Poach Pshare from each of the H horizontal neighbors,(α · Pshare) from each of the V vertical neighbors
}}
Figure 4: The core of the ZBD algorithm. n is the numberof servers we want, V is the set of neighbors along the verticalaxis, H is the set of neighbors along the horizontal axis, and α
is the ratio of power borrowed per-vertical to power borrowedper-horizontal. Prun is the amount of power necessary to runone server at 100% utilization; PSi is the amount of power theONEPASSANALOG algorithm allocates to server i. In general,Prun ≥ PSi .
a data center at 60% utilization. A data center that em-ploys ONEPASSANALOG scheduling has less variance inits server’s exhaust temperatures; UNIFORMWORKLOADand COOLESTINLETS have server exhaust temperaturesthat vary by as much as 9◦C – 12◦C, whereas ONEPAS-SANALOG varies by less than 4◦C; this indicates fewerlocalized “hot spots” and heat imbalances.
3.4 Zone-Based Discretization (ZBD)
Our first approach is based on the theoretical formulationbehind ONEPASSANALOG [27]. This formulation assignsheat inversely proportional to the server’s inlet tempera-ture. However, it suffers from the drawback that it is ana-log; it does not factor in the specific discrete power statesof current servers: { Pidle, . . ., PN }. Therefore, the chal-lenge is to discretize the recommended analog distribu-tion to the available discrete power states. Our researchshowed that conventional discretization approaches —ones that are agnostic to the notion of heat distributionand transfer — that simply minimize the absolute error,can result in worse cooling costs.
The key contribution of ZBD is that, in addition to min-imizing the discretization error over the entire data cen-ter, it minimizes the differences between its power distri-bution and ONEPASSANALOG at coarse granularities, orgeographic zones.
ZBD chooses servers by using the notions of proximity-based heat distributions and poaching. When selectinga server on which to place workload, the chosen serverborrows, or “poaches” power from its zone of immediateneighbors whose power budget is not already committed.
Within these two-dimensional zones, the heat producedby ZBD is similar to that produced by ONEPASSANA-LOG. Therefore, ZBD is an effective discretization ofONEPASSANALOG by explicitly capturing the underlyinggoal of ONEPASSANALOG: creating a uniform exhaustprofile that reduces localized hot spots. A discretizationapproach that does not take this goal into account losesthe benefits of ONEPASSANALOG.
Figure 4 describes the core of the ZBD discretization al-gorithm. ZBD allows us to define a variable-sized setof neighbors along the horizontal and vertical axes — Hand V — and α, the ratio of power taken from the ver-tical to horizontal directions. These parameters enableus to mimic the physics of heat flow, as heat is morelikely to rise than move horizontally. Consequently, “re-alistic” poaching runs set α larger than zero, borrowingmore heavily vertically from servers in their rack.
Table 1 shows the operation of ZBD at a micro level, bor-rowing power from four vertical and two horizontal neigh-bors, giving the center server enough of a power budgetto operate. The total amount of power and heat withinthe fifteen-server group remains the same, only shiftedaround slightly.
3.5 Minimizing Heat Recirculation (MinHR)
Our second approach is a new power provisioning policythat minimizes the amount of heat that recirculates withina data center: MINHR. Heat recirculation occurs for sev-eral reasons. For example, if there is not enough cold aircoming up from the floor, a server fan can suck in air fromother sources, usually hot air from over the top or aroundthe side of racks. Similarly, if the air conditioning unitsdo not pull the hot air back to the return vents or if thereare obstructions to the air flow, hot air will mix with theincoming cold air supply. In all these cases, heat recircu-lation leads to increases in cooling energy.
Interestingly, some of these recirculation effects can leadto situations where the observed consequence of the inef-ficiency is spatially uncorrelated with its cause; in otherwords, the heat vented by one machine may travel sev-eral meters before arriving at the inlet of another server.We assert that an algorithm that minimizes hot air recir-culation at the data center level will lead to lower coolingcosts. Unlike ZBD, which reacts to inefficiencies by low-ering the power budget at the site where heat recirculationis observed, MINHR focuses on the cause of inefficien-cies. That is, it may not know how to lower the inlettemperature on a given server, but it will lower the totalamount of heat that recirculates within the data center.
Therefore, unlike ZBD, we make no effort to create a uni-form exhaust profile. The goals are to
• minimize the total amount heat that recirculates be-
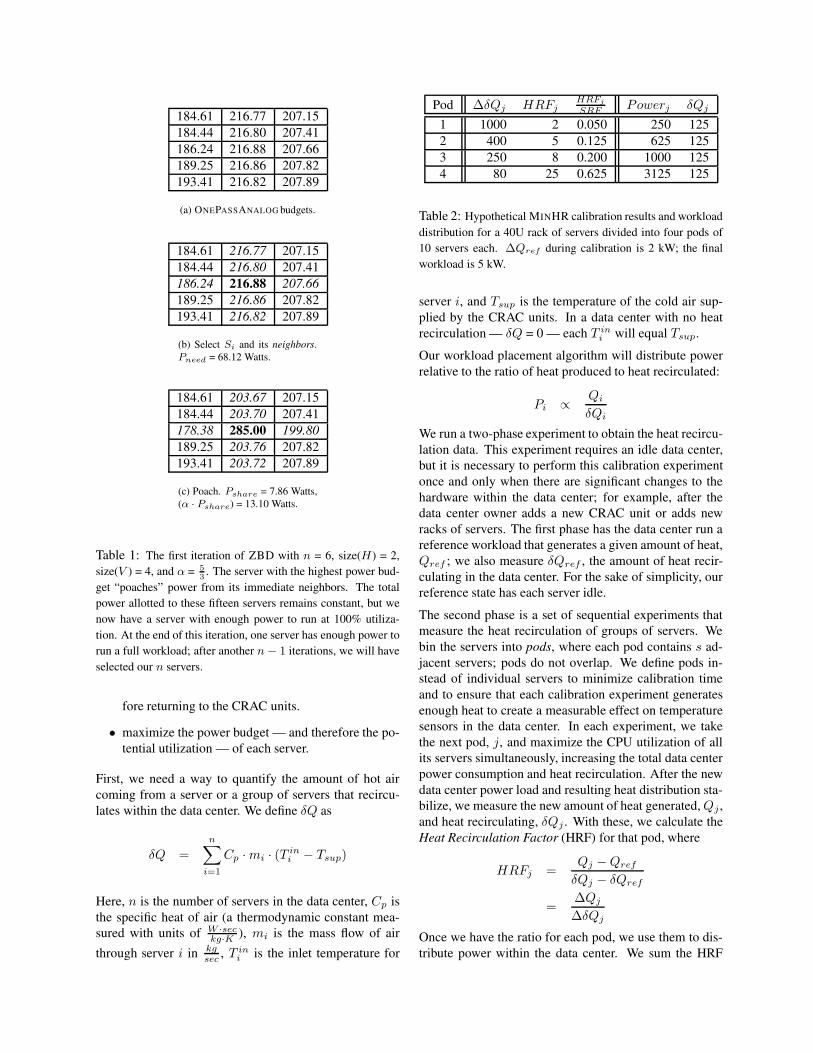
184.61 216.77 207.15184.44 216.80 207.41186.24 216.88 207.66189.25 216.86 207.82193.41 216.82 207.89
(a) ONEPASSANALOG budgets.
184.61 216.77 207.15184.44 216.80 207.41186.24 216.88 207.66189.25 216.86 207.82193.41 216.82 207.89
(b) Select Si and its neighbors.Pneed = 68.12 Watts.
184.61 203.67 207.15184.44 203.70 207.41178.38 285.00 199.80189.25 203.76 207.82193.41 203.72 207.89
(c) Poach. Pshare = 7.86 Watts,(α · Pshare) = 13.10 Watts.
Table 1: The first iteration of ZBD with n = 6, size(H) = 2,size(V ) = 4, and α = 5
3 . The server with the highest power bud-get “poaches” power from its immediate neighbors. The totalpower allotted to these fifteen servers remains constant, but wenow have a server with enough power to run at 100% utiliza-tion. At the end of this iteration, one server has enough power torun a full workload; after another n − 1 iterations, we will haveselected our n servers.
fore returning to the CRAC units.
• maximize the power budget — and therefore the po-tential utilization — of each server.
First, we need a way to quantify the amount of hot aircoming from a server or a group of servers that recircu-lates within the data center. We define δQ as
δQ =n∑
i=1
Cp · mi · (T ini − Tsup)
Here, n is the number of servers in the data center, Cp isthe specific heat of air (a thermodynamic constant mea-sured with units of W ·sec
kg·K ), mi is the mass flow of airthrough server i in kg
sec , T ini is the inlet temperature for
Pod ∆δQj HRFjHRFj
SRF Powerj δQj
1 1000 2 0.050 250 1252 400 5 0.125 625 1253 250 8 0.200 1000 1254 80 25 0.625 3125 125
Table 2: Hypothetical MINHR calibration results and workloaddistribution for a 40U rack of servers divided into four pods of10 servers each. ∆Qref during calibration is 2 kW; the finalworkload is 5 kW.
server i, and Tsup is the temperature of the cold air sup-plied by the CRAC units. In a data center with no heatrecirculation — δQ = 0 — each T in
i will equal Tsup.
Our workload placement algorithm will distribute powerrelative to the ratio of heat produced to heat recirculated:
Pi ∝ Qi
δQi
We run a two-phase experiment to obtain the heat recircu-lation data. This experiment requires an idle data center,but it is necessary to perform this calibration experimentonce and only when there are significant changes to thehardware within the data center; for example, after thedata center owner adds a new CRAC unit or adds newracks of servers. The first phase has the data center run areference workload that generates a given amount of heat,Qref ; we also measure δQref , the amount of heat recir-culating in the data center. For the sake of simplicity, ourreference state has each server idle.
The second phase is a set of sequential experiments thatmeasure the heat recirculation of groups of servers. Webin the servers into pods, where each pod contains s ad-jacent servers; pods do not overlap. We define pods in-stead of individual servers to minimize calibration timeand to ensure that each calibration experiment generatesenough heat to create a measurable effect on temperaturesensors in the data center. In each experiment, we takethe next pod, j, and maximize the CPU utilization of allits servers simultaneously, increasing the total data centerpower consumption and heat recirculation. After the newdata center power load and resulting heat distribution sta-bilize, we measure the new amount of heat generated, Qj ,and heat recirculating, δQj . With these, we calculate theHeat Recirculation Factor (HRF) for that pod, where
HRFj =Qj − Qref
δQj − δQref
=∆Qj
∆δQj
Once we have the ratio for each pod, we use them to dis-tribute power within the data center. We sum the HRF
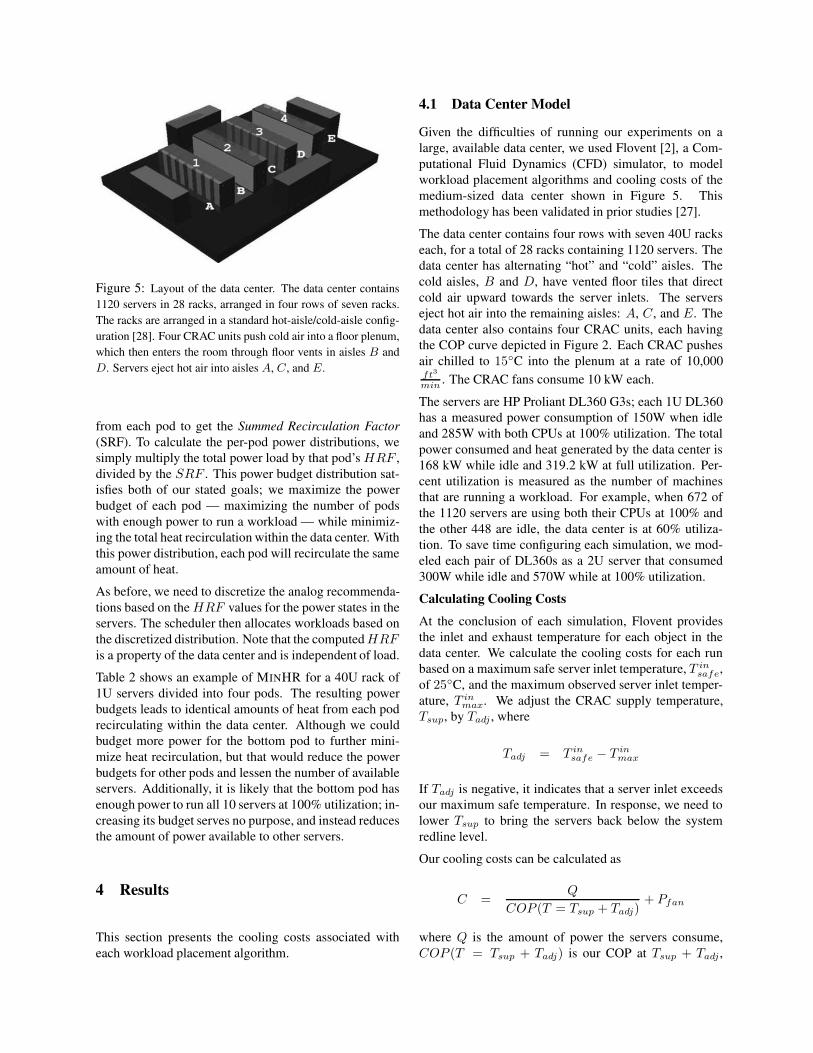
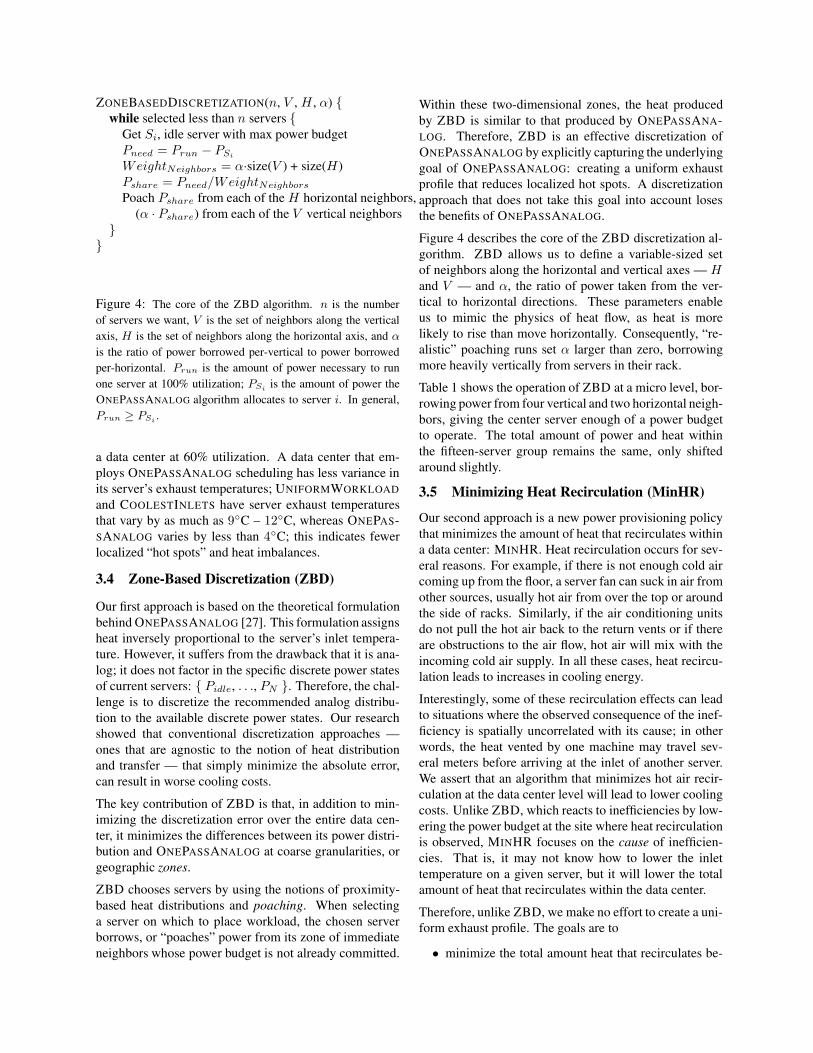
Figure 5: Layout of the data center. The data center contains1120 servers in 28 racks, arranged in four rows of seven racks.The racks are arranged in a standard hot-aisle/cold-aisle config-uration [28]. Four CRAC units push cold air into a floor plenum,which then enters the room through floor vents in aisles B andD. Servers eject hot air into aisles A, C, and E.
from each pod to get the Summed Recirculation Factor(SRF). To calculate the per-pod power distributions, wesimply multiply the total power load by that pod’s HRF ,divided by the SRF . This power budget distribution sat-isfies both of our stated goals; we maximize the powerbudget of each pod — maximizing the number of podswith enough power to run a workload — while minimiz-ing the total heat recirculation within the data center. Withthis power distribution, each pod will recirculate the sameamount of heat.
As before, we need to discretize the analog recommenda-tions based on the HRF values for the power states in theservers. The scheduler then allocates workloads based onthe discretized distribution. Note that the computed HRFis a property of the data center and is independent of load.
Table 2 shows an example of MINHR for a 40U rack of1U servers divided into four pods. The resulting powerbudgets leads to identical amounts of heat from each podrecirculating within the data center. Although we couldbudget more power for the bottom pod to further mini-mize heat recirculation, but that would reduce the powerbudgets for other pods and lessen the number of availableservers. Additionally, it is likely that the bottom pod hasenough power to run all 10 servers at 100% utilization; in-creasing its budget serves no purpose, and instead reducesthe amount of power available to other servers.
4 Results
This section presents the cooling costs associated witheach workload placement algorithm.
4.1 Data Center Model
Given the difficulties of running our experiments on alarge, available data center, we used Flovent [2], a Com-putational Fluid Dynamics (CFD) simulator, to modelworkload placement algorithms and cooling costs of themedium-sized data center shown in Figure 5. Thismethodology has been validated in prior studies [27].
The data center contains four rows with seven 40U rackseach, for a total of 28 racks containing 1120 servers. Thedata center has alternating “hot” and “cold” aisles. Thecold aisles, B and D, have vented floor tiles that directcold air upward towards the server inlets. The serverseject hot air into the remaining aisles: A, C, and E. Thedata center also contains four CRAC units, each havingthe COP curve depicted in Figure 2. Each CRAC pushesair chilled to 15◦C into the plenum at a rate of 10,000ft3
min . The CRAC fans consume 10 kW each.
The servers are HP Proliant DL360 G3s; each 1U DL360has a measured power consumption of 150W when idleand 285W with both CPUs at 100% utilization. The totalpower consumed and heat generated by the data center is168 kW while idle and 319.2 kW at full utilization. Per-cent utilization is measured as the number of machinesthat are running a workload. For example, when 672 ofthe 1120 servers are using both their CPUs at 100% andthe other 448 are idle, the data center is at 60% utiliza-tion. To save time configuring each simulation, we mod-eled each pair of DL360s as a 2U server that consumed300W while idle and 570W while at 100% utilization.
Calculating Cooling CostsAt the conclusion of each simulation, Flovent providesthe inlet and exhaust temperature for each object in thedata center. We calculate the cooling costs for each runbased on a maximum safe server inlet temperature, T in
safe,of 25◦C, and the maximum observed server inlet temper-ature, T in
max. We adjust the CRAC supply temperature,Tsup, by Tadj , where
Tadj = T insafe − T in
max
If Tadj is negative, it indicates that a server inlet exceedsour maximum safe temperature. In response, we need tolower Tsup to bring the servers back below the systemredline level.
Our cooling costs can be calculated as
C =Q
COP (T = Tsup + Tadj)+ Pfan
where Q is the amount of power the servers consume,COP (T = Tsup + Tadj) is our COP at Tsup + Tadj ,
60
100
140
180
220
260
300
0 10 20 30 40 50 60 70 80 90 100
Coo
ling
cost
s (k
W)
Percent Data Center Utilization
UniformWorkloadCoolestInlets
OnePassAnalog
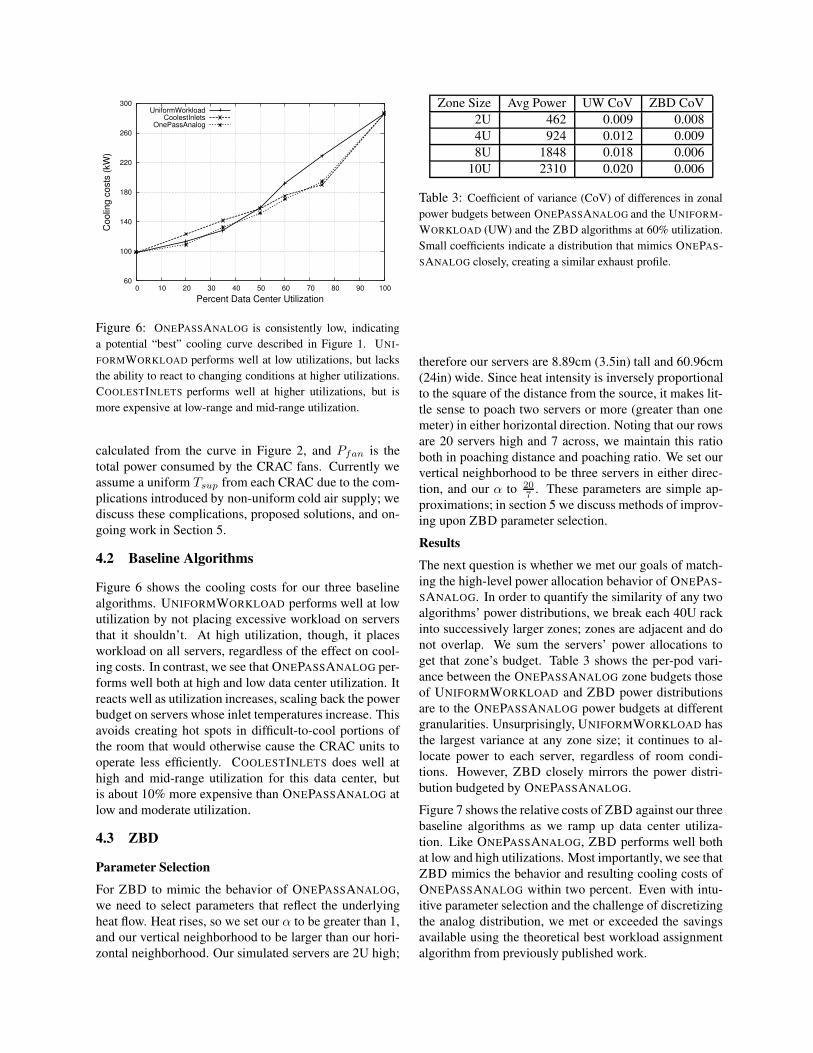
Figure 6: ONEPASSANALOG is consistently low, indicatinga potential “best” cooling curve described in Figure 1. UNI-FORMWORKLOAD performs well at low utilizations, but lacksthe ability to react to changing conditions at higher utilizations.COOLESTINLETS performs well at higher utilizations, but ismore expensive at low-range and mid-range utilization.
calculated from the curve in Figure 2, and Pfan is thetotal power consumed by the CRAC fans. Currently weassume a uniform Tsup from each CRAC due to the com-plications introduced by non-uniform cold air supply; wediscuss these complications, proposed solutions, and on-going work in Section 5.
4.2 Baseline Algorithms
Figure 6 shows the cooling costs for our three baselinealgorithms. UNIFORMWORKLOAD performs well at lowutilization by not placing excessive workload on serversthat it shouldn’t. At high utilization, though, it placesworkload on all servers, regardless of the effect on cool-ing costs. In contrast, we see that ONEPASSANALOG per-forms well both at high and low data center utilization. Itreacts well as utilization increases, scaling back the powerbudget on servers whose inlet temperatures increase. Thisavoids creating hot spots in difficult-to-cool portions ofthe room that would otherwise cause the CRAC units tooperate less efficiently. COOLESTINLETS does well athigh and mid-range utilization for this data center, butis about 10% more expensive than ONEPASSANALOG atlow and moderate utilization.
4.3 ZBD
Parameter SelectionFor ZBD to mimic the behavior of ONEPASSANALOG,we need to select parameters that reflect the underlyingheat flow. Heat rises, so we set our α to be greater than 1,and our vertical neighborhood to be larger than our hori-zontal neighborhood. Our simulated servers are 2U high;
Zone Size Avg Power UW CoV ZBD CoV2U 462 0.009 0.0084U 924 0.012 0.0098U 1848 0.018 0.006
10U 2310 0.020 0.006
Table 3: Coefficient of variance (CoV) of differences in zonalpower budgets between ONEPASSANALOG and the UNIFORM-WORKLOAD (UW) and the ZBD algorithms at 60% utilization.Small coefficients indicate a distribution that mimics ONEPAS-SANALOG closely, creating a similar exhaust profile.
therefore our servers are 8.89cm (3.5in) tall and 60.96cm(24in) wide. Since heat intensity is inversely proportionalto the square of the distance from the source, it makes lit-tle sense to poach two servers or more (greater than onemeter) in either horizontal direction. Noting that our rowsare 20 servers high and 7 across, we maintain this ratioboth in poaching distance and poaching ratio. We set ourvertical neighborhood to be three servers in either direc-tion, and our α to 20
7 . These parameters are simple ap-proximations; in section 5 we discuss methods of improv-ing upon ZBD parameter selection.
ResultsThe next question is whether we met our goals of match-ing the high-level power allocation behavior of ONEPAS-SANALOG. In order to quantify the similarity of any twoalgorithms’ power distributions, we break each 40U rackinto successively larger zones; zones are adjacent and donot overlap. We sum the servers’ power allocations toget that zone’s budget. Table 3 shows the per-pod vari-ance between the ONEPASSANALOG zone budgets thoseof UNIFORMWORKLOAD and ZBD power distributionsare to the ONEPASSANALOG power budgets at differentgranularities. Unsurprisingly, UNIFORMWORKLOAD hasthe largest variance at any zone size; it continues to al-locate power to each server, regardless of room condi-tions. However, ZBD closely mirrors the power distri-bution budgeted by ONEPASSANALOG.
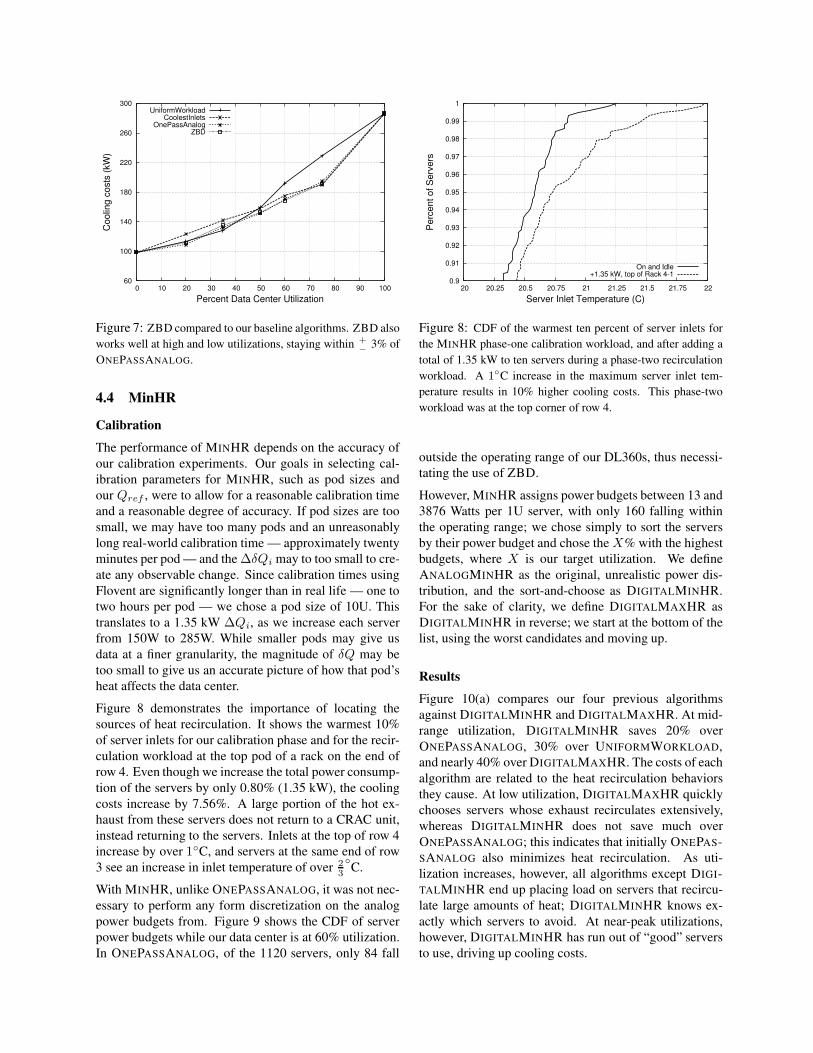
Figure 7 shows the relative costs of ZBD against our threebaseline algorithms as we ramp up data center utiliza-tion. Like ONEPASSANALOG, ZBD performs well bothat low and high utilizations. Most importantly, we see thatZBD mimics the behavior and resulting cooling costs ofONEPASSANALOG within two percent. Even with intu-itive parameter selection and the challenge of discretizingthe analog distribution, we met or exceeded the savingsavailable using the theoretical best workload assignmentalgorithm from previously published work.
60
100
140
180
220
260
300
0 10 20 30 40 50 60 70 80 90 100
Coo
ling
cost
s (k
W)
Percent Data Center Utilization
UniformWorkloadCoolestInlets
OnePassAnalogZBD
Figure 7: ZBD compared to our baseline algorithms. ZBD alsoworks well at high and low utilizations, staying within +
− 3% ofONEPASSANALOG.
4.4 MinHR
CalibrationThe performance of MINHR depends on the accuracy ofour calibration experiments. Our goals in selecting cal-ibration parameters for MINHR, such as pod sizes andour Qref , were to allow for a reasonable calibration timeand a reasonable degree of accuracy. If pod sizes are toosmall, we may have too many pods and an unreasonablylong real-world calibration time — approximately twentyminutes per pod — and the ∆δQi may to too small to cre-ate any observable change. Since calibration times usingFlovent are significantly longer than in real life — one totwo hours per pod — we chose a pod size of 10U. Thistranslates to a 1.35 kW ∆Qi, as we increase each serverfrom 150W to 285W. While smaller pods may give usdata at a finer granularity, the magnitude of δQ may betoo small to give us an accurate picture of how that pod’sheat affects the data center.
Figure 8 demonstrates the importance of locating thesources of heat recirculation. It shows the warmest 10%of server inlets for our calibration phase and for the recir-culation workload at the top pod of a rack on the end ofrow 4. Even though we increase the total power consump-tion of the servers by only 0.80% (1.35 kW), the coolingcosts increase by 7.56%. A large portion of the hot ex-haust from these servers does not return to a CRAC unit,instead returning to the servers. Inlets at the top of row 4increase by over 1◦C, and servers at the same end of row3 see an increase in inlet temperature of over 2
3
◦C.
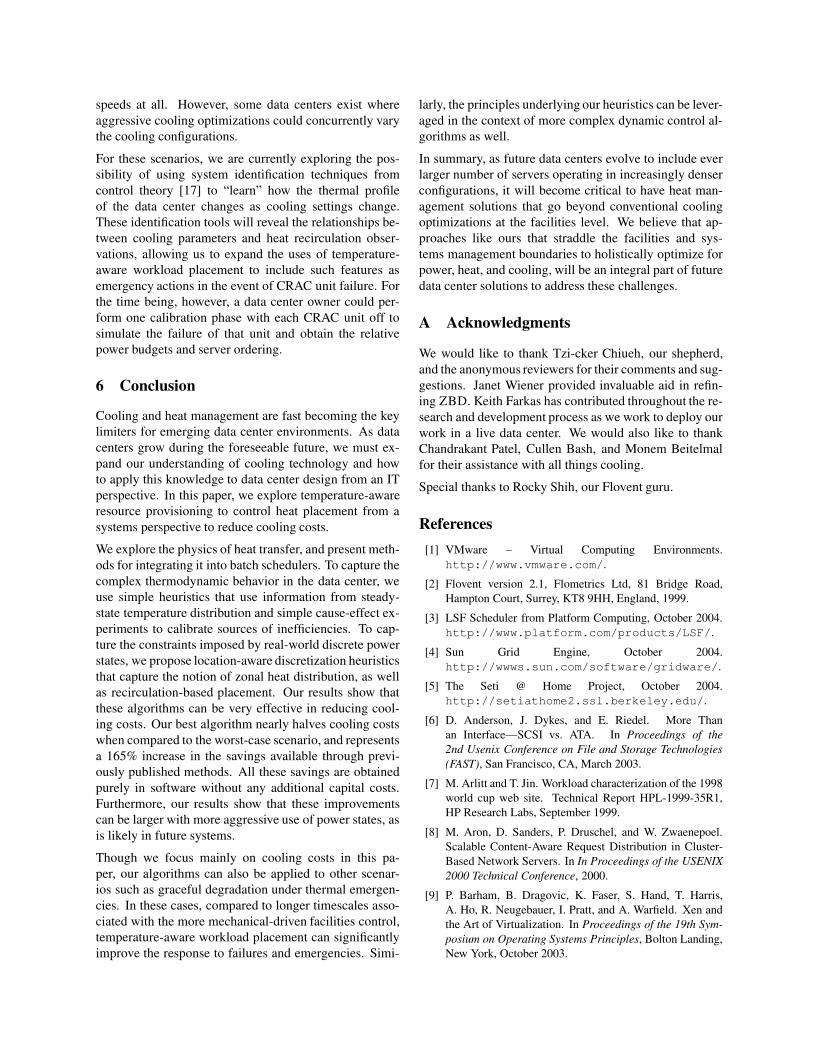
With MINHR, unlike ONEPASSANALOG, it was not nec-essary to perform any form discretization on the analogpower budgets from. Figure 9 shows the CDF of serverpower budgets while our data center is at 60% utilization.In ONEPASSANALOG, of the 1120 servers, only 84 fall
0.9
0.91
0.92
0.93
0.94
0.95
0.96
0.97
0.98
0.99
1
20 20.25 20.5 20.75 21 21.25 21.5 21.75 22
Per
cent
of S
erve
rs
Server Inlet Temperature (C)
On and Idle+1.35 kW, top of Rack 4-1
Figure 8: CDF of the warmest ten percent of server inlets forthe MINHR phase-one calibration workload, and after adding atotal of 1.35 kW to ten servers during a phase-two recirculationworkload. A 1◦C increase in the maximum server inlet tem-perature results in 10% higher cooling costs. This phase-twoworkload was at the top corner of row 4.
outside the operating range of our DL360s, thus necessi-tating the use of ZBD.
However, MINHR assigns power budgets between 13 and3876 Watts per 1U server, with only 160 falling withinthe operating range; we chose simply to sort the serversby their power budget and chose the X% with the highestbudgets, where X is our target utilization. We defineANALOGMINHR as the original, unrealistic power dis-tribution, and the sort-and-choose as DIGITALMINHR.For the sake of clarity, we define DIGITALMAXHR asDIGITALMINHR in reverse; we start at the bottom of thelist, using the worst candidates and moving up.
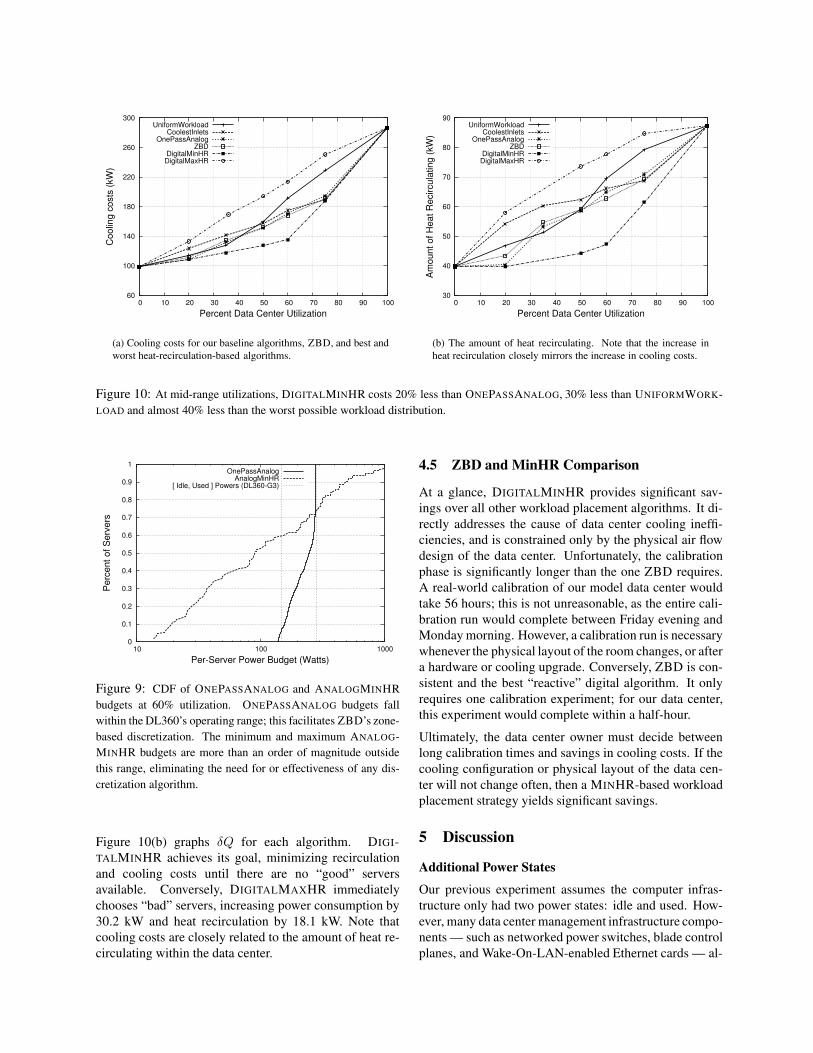
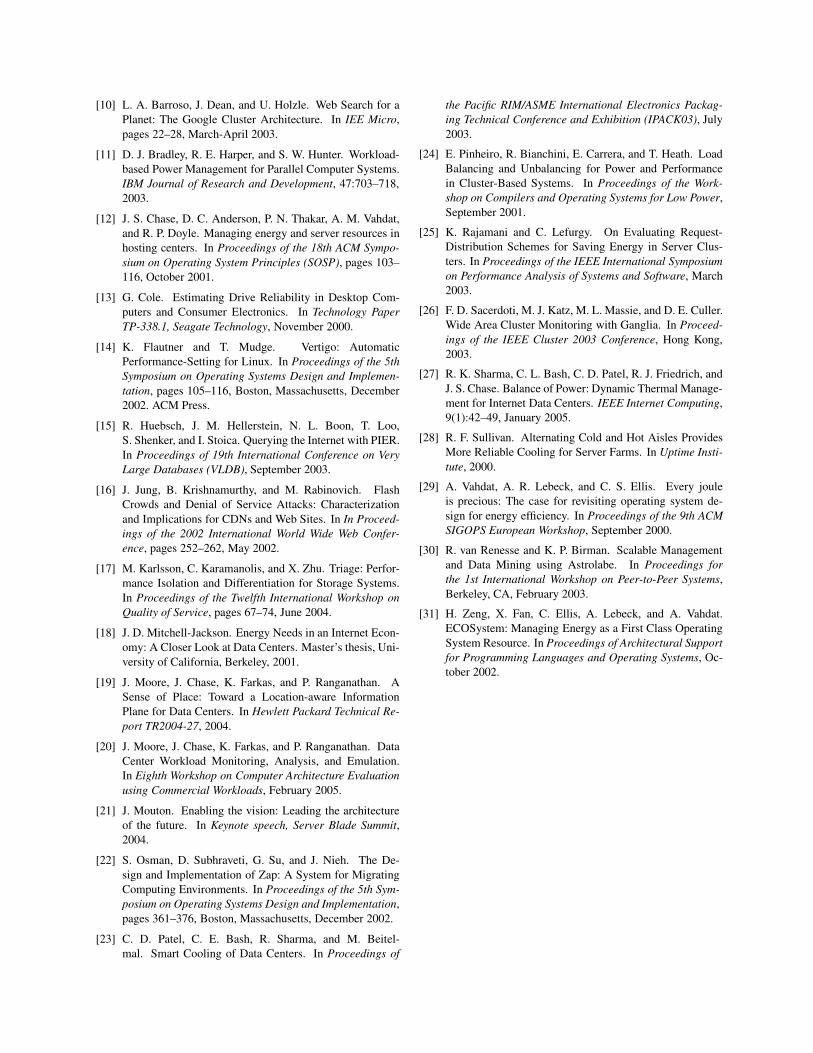
ResultsFigure 10(a) compares our four previous algorithmsagainst DIGITALMINHR and DIGITALMAXHR. At mid-range utilization, DIGITALMINHR saves 20% overONEPASSANALOG, 30% over UNIFORMWORKLOAD,and nearly 40% over DIGITALMAXHR. The costs of eachalgorithm are related to the heat recirculation behaviorsthey cause. At low utilization, DIGITALMAXHR quicklychooses servers whose exhaust recirculates extensively,whereas DIGITALMINHR does not save much overONEPASSANALOG; this indicates that initially ONEPAS-SANALOG also minimizes heat recirculation. As uti-lization increases, however, all algorithms except DIGI-TALMINHR end up placing load on servers that recircu-late large amounts of heat; DIGITALMINHR knows ex-actly which servers to avoid. At near-peak utilizations,however, DIGITALMINHR has run out of “good” serversto use, driving up cooling costs.
60
100
140
180
220
260
300
0 10 20 30 40 50 60 70 80 90 100
Coo
ling
cost
s (k
W)
Percent Data Center Utilization
UniformWorkloadCoolestInlets
OnePassAnalogZBD
DigitalMinHRDigitalMaxHR
(a) Cooling costs for our baseline algorithms, ZBD, and best andworst heat-recirculation-based algorithms.
30
40
50
60
70
80
90
0 10 20 30 40 50 60 70 80 90 100
Am
ount
of H
eat R
ecirc
ulat
ing
(kW
)
Percent Data Center Utilization
UniformWorkloadCoolestInlets
OnePassAnalogZBD
DigitalMinHRDigitalMaxHR
(b) The amount of heat recirculating. Note that the increase inheat recirculation closely mirrors the increase in cooling costs.
Figure 10: At mid-range utilizations, DIGITALMINHR costs 20% less than ONEPASSANALOG, 30% less than UNIFORMWORK-LOAD and almost 40% less than the worst possible workload distribution.
0
0.1
0.2
0.3
0.4
0.5
0.6
0.7
0.8
0.9
1
10 100 1000
Per
cent
of S
erve
rs
Per-Server Power Budget (Watts)
OnePassAnalogAnalogMinHR
[ Idle, Used ] Powers (DL360-G3)
Figure 9: CDF of ONEPASSANALOG and ANALOGMINHRbudgets at 60% utilization. ONEPASSANALOG budgets fallwithin the DL360’s operating range; this facilitates ZBD’s zone-based discretization. The minimum and maximum ANALOG-MINHR budgets are more than an order of magnitude outsidethis range, eliminating the need for or effectiveness of any dis-cretization algorithm.
Figure 10(b) graphs δQ for each algorithm. DIGI-TALMINHR achieves its goal, minimizing recirculationand cooling costs until there are no “good” serversavailable. Conversely, DIGITALMAXHR immediatelychooses “bad” servers, increasing power consumption by30.2 kW and heat recirculation by 18.1 kW. Note thatcooling costs are closely related to the amount of heat re-circulating within the data center.
4.5 ZBD and MinHR Comparison
At a glance, DIGITALMINHR provides significant sav-ings over all other workload placement algorithms. It di-rectly addresses the cause of data center cooling ineffi-ciencies, and is constrained only by the physical air flowdesign of the data center. Unfortunately, the calibrationphase is significantly longer than the one ZBD requires.A real-world calibration of our model data center wouldtake 56 hours; this is not unreasonable, as the entire cali-bration run would complete between Friday evening andMonday morning. However, a calibration run is necessarywhenever the physical layout of the room changes, or aftera hardware or cooling upgrade. Conversely, ZBD is con-sistent and the best “reactive” digital algorithm. It onlyrequires one calibration experiment; for our data center,this experiment would complete within a half-hour.
Ultimately, the data center owner must decide betweenlong calibration times and savings in cooling costs. If thecooling configuration or physical layout of the data cen-ter will not change often, then a MINHR-based workloadplacement strategy yields significant savings.
5 Discussion
Additional Power StatesOur previous experiment assumes the computer infras-tructure only had two power states: idle and used. How-ever, many data center management infrastructure compo-nents — such as networked power switches, blade controlplanes, and Wake-On-LAN-enabled Ethernet cards — al-

# Off Power (kW) Cooling (kW) % Savings56 273.0 156.9 16.54
112 264.6 142.9 23.96168 256.2 134.4 28.51224 247.8 126.00 32.96
Table 4: We leverage MINHR’s sorted list of server “desir-ability” to select servers to turn off during 75% utilization. Wereduce the power consumed by the computer infrastructure by12%, yet reduce cooling costs by nearly one-third.
low us to consider “off” as another power state. Both thealgorithms can leverage additional power states to allowthem to more closely match the analog power budgets.
To demonstrate the potential for increased improvements,we focus on some experiments using the best algorithmfrom the last section. DIGITALMINHR’s per-pod HRFvalues allow us to sort servers by heat recirculation andpower down or fully turn off the “worst” servers. Ta-ble 4 presents the results of turning 5, 10, and 15% ofthe “worst” servers off during 75% utilization while usingthe DIGITALMINHR placement algorithm. Initially thecomputer infrastructure was consuming 281.4 kW, andexpending 187.9 kW to remove this heat. Turning off only56 servers, 8.4 kW of compute power, reduces coolingcosts by nearly one-sixth. MINHR with an “off’ optionreduces cooling costs by nearly another third by turningoff 20% of the servers.
When compared to the savings achieved by ONEPAS-SANALOG over UNIFORMWORKLOAD, this approachrepresents a factor of three increase in those cooling sav-ings, reducing UNIFORMWORKLOAD cooling costs bynearly 60%. These long-term savings may be reduced,however, by the decreased hardware reliability caused bypower-cycling servers.
How far to perfection?In this section, we compare our results to the absolutetheoretical minimum cost of heat removal, as defined byphysics. It is possible to calculate the absolute mini-mum cooling costs possible, given the COP curve of ourCRAC units. Assume we formulate the perfect workloadplacement algorithm, one that eliminates hot air recircula-tion. In that case, we have the situation described in Sec-tion 3.5: CRAC supply temperatures equal the maximumsafe server inlet temperatures. Plugging the data from theCOP curve in figure 2, we obtain Woptimal = Q
4.728 .
Figure 11 compares all our workload placement algo-rithms against the absolute minimum costs, as governedby the above equation. It should be noted that the absoluteminimum represents a realistically unobtainable point asis evident from the benefits it can obtain even at the 100%
60
100
140
180
220
260
300
0 10 20 30 40 50 60 70 80 90 100
Coo
ling
cost
s (k
W)
Percent Data Center Utilization
UniformWorkloadCoolestInlets
OnePassAnalogZBD
DigitalMinHRDigitalMaxHRAnalogMinHR
Thermodynamic Optimal
Figure 11: Cooling costs for all workload placement algo-rithms, ANALOGMINHR, and the absolute minimum costs forour data center.
data point where there is no slack in workload place-ment. However, in spite of this, for our simple data cen-ter at mid-range workloads, DIGITALMINHR achievesover half the possible savings as compared to UNIFORM-WORKLOAD. These savings are through changes a datacenter administrator can make entirely at the IT level insoftware, such as modifying a batch queue or other serverassignment scheduler. Furthermore, as discussed earlier,these changes are complementary to other facilities ap-proaches, including improved rack locations and coolingconfigurations.
Instrumentation and Dynamic ControlThe work discussed in this paper assumes an instrumen-tation infrastructure in the data center such as Splice [19]that provides current temperature and power readings toour algorithms. Related work in the data instrumenta-tion space includes PIER [15], Ganglia [26] and Astro-labe [30]. Additionally, algorithms such as ONEPAS-SANALOG, ZBD, and MINHR include calibration phasesbased on past history. These phases could poten-tially be sped by systematic thermal profile evaluationsthrough a synthetic workload generation tool such assstress [20]. A moderately-sized data center of 1000nodes will take about two days to calibrate fully. At theend of the calibration phase, however, which we will havethe power budgets for that data center. These budgets areconstant unless the cooling or computational configura-tion changes, such as by adding or removing servers.
Further, the work discussed in this paper pertains to staticworkload assignment in a batch scheduler to reduce cool-ing costs from a heat distribution perspective. We as-sume that the cooling configuration is not being optimizedconcurrently; in other words, CRAC units may not varytheir supply temperatures individually, or change their fan
speeds at all. However, some data centers exist whereaggressive cooling optimizations could concurrently varythe cooling configurations.
For these scenarios, we are currently exploring the pos-sibility of using system identification techniques fromcontrol theory [17] to “learn” how the thermal profileof the data center changes as cooling settings change.These identification tools will reveal the relationships be-tween cooling parameters and heat recirculation obser-vations, allowing us to expand the uses of temperature-aware workload placement to include such features asemergency actions in the event of CRAC unit failure. Forthe time being, however, a data center owner could per-form one calibration phase with each CRAC unit off tosimulate the failure of that unit and obtain the relativepower budgets and server ordering.
6 Conclusion
Cooling and heat management are fast becoming the keylimiters for emerging data center environments. As datacenters grow during the foreseeable future, we must ex-pand our understanding of cooling technology and howto apply this knowledge to data center design from an ITperspective. In this paper, we explore temperature-awareresource provisioning to control heat placement from asystems perspective to reduce cooling costs.
We explore the physics of heat transfer, and present meth-ods for integrating it into batch schedulers. To capture thecomplex thermodynamic behavior in the data center, weuse simple heuristics that use information from steady-state temperature distribution and simple cause-effect ex-periments to calibrate sources of inefficiencies. To cap-ture the constraints imposed by real-world discrete powerstates, we propose location-aware discretization heuristicsthat capture the notion of zonal heat distribution, as wellas recirculation-based placement. Our results show thatthese algorithms can be very effective in reducing cool-ing costs. Our best algorithm nearly halves cooling costswhen compared to the worst-case scenario, and representsa 165% increase in the savings available through previ-ously published methods. All these savings are obtainedpurely in software without any additional capital costs.Furthermore, our results show that these improvementscan be larger with more aggressive use of power states, asis likely in future systems.
Though we focus mainly on cooling costs in this pa-per, our algorithms can also be applied to other scenar-ios such as graceful degradation under thermal emergen-cies. In these cases, compared to longer timescales asso-ciated with the more mechanical-driven facilities control,temperature-aware workload placement can significantlyimprove the response to failures and emergencies. Simi-
larly, the principles underlying our heuristics can be lever-aged in the context of more complex dynamic control al-gorithms as well.
In summary, as future data centers evolve to include everlarger number of servers operating in increasingly denserconfigurations, it will become critical to have heat man-agement solutions that go beyond conventional coolingoptimizations at the facilities level. We believe that ap-proaches like ours that straddle the facilities and sys-tems management boundaries to holistically optimize forpower, heat, and cooling, will be an integral part of futuredata center solutions to address these challenges.
A Acknowledgments
We would like to thank Tzi-cker Chiueh, our shepherd,and the anonymous reviewers for their comments and sug-gestions. Janet Wiener provided invaluable aid in refin-ing ZBD. Keith Farkas has contributed throughout the re-search and development process as we work to deploy ourwork in a live data center. We would also like to thankChandrakant Patel, Cullen Bash, and Monem Beitelmalfor their assistance with all things cooling.
Special thanks to Rocky Shih, our Flovent guru.
References[1] VMware – Virtual Computing Environments.
http://www.vmware.com/.
[2] Flovent version 2.1, Flometrics Ltd, 81 Bridge Road,Hampton Court, Surrey, KT8 9HH, England, 1999.
[3] LSF Scheduler from Platform Computing, October 2004.http://www.platform.com/products/LSF/.
[4] Sun Grid Engine, October 2004.http://wwws.sun.com/software/gridware/.
[5] The Seti @ Home Project, October 2004.http://setiathome2.ssl.berkeley.edu/.
[6] D. Anderson, J. Dykes, and E. Riedel. More Thanan Interface—SCSI vs. ATA. In Proceedings of the2nd Usenix Conference on File and Storage Technologies(FAST), San Francisco, CA, March 2003.
[7] M. Arlitt and T. Jin. Workload characterization of the 1998world cup web site. Technical Report HPL-1999-35R1,HP Research Labs, September 1999.
[8] M. Aron, D. Sanders, P. Druschel, and W. Zwaenepoel.Scalable Content-Aware Request Distribution in Cluster-Based Network Servers. In In Proceedings of the USENIX2000 Technical Conference, 2000.
[9] P. Barham, B. Dragovic, K. Faser, S. Hand, T. Harris,A. Ho, R. Neugebauer, I. Pratt, and A. Warfield. Xen andthe Art of Virtualization. In Proceedings of the 19th Sym-posium on Operating Systems Principles, Bolton Landing,New York, October 2003.
[10] L. A. Barroso, J. Dean, and U. Holzle. Web Search for aPlanet: The Google Cluster Architecture. In IEE Micro,pages 22–28, March-April 2003.
[11] D. J. Bradley, R. E. Harper, and S. W. Hunter. Workload-based Power Management for Parallel Computer Systems.IBM Journal of Research and Development, 47:703–718,2003.
[12] J. S. Chase, D. C. Anderson, P. N. Thakar, A. M. Vahdat,and R. P. Doyle. Managing energy and server resources inhosting centers. In Proceedings of the 18th ACM Sympo-sium on Operating System Principles (SOSP), pages 103–116, October 2001.
[13] G. Cole. Estimating Drive Reliability in Desktop Com-puters and Consumer Electronics. In Technology PaperTP-338.1, Seagate Technology, November 2000.
[14] K. Flautner and T. Mudge. Vertigo: AutomaticPerformance-Setting for Linux. In Proceedings of the 5thSymposium on Operating Systems Design and Implemen-tation, pages 105–116, Boston, Massachusetts, December2002. ACM Press.
[15] R. Huebsch, J. M. Hellerstein, N. L. Boon, T. Loo,S. Shenker, and I. Stoica. Querying the Internet with PIER.In Proceedings of 19th International Conference on VeryLarge Databases (VLDB), September 2003.
[16] J. Jung, B. Krishnamurthy, and M. Rabinovich. FlashCrowds and Denial of Service Attacks: Characterizationand Implications for CDNs and Web Sites. In In Proceed-ings of the 2002 International World Wide Web Confer-ence, pages 252–262, May 2002.
[17] M. Karlsson, C. Karamanolis, and X. Zhu. Triage: Perfor-mance Isolation and Differentiation for Storage Systems.In Proceedings of the Twelfth International Workshop onQuality of Service, pages 67–74, June 2004.
[18] J. D. Mitchell-Jackson. Energy Needs in an Internet Econ-omy: A Closer Look at Data Centers. Master’s thesis, Uni-versity of California, Berkeley, 2001.
[19] J. Moore, J. Chase, K. Farkas, and P. Ranganathan. ASense of Place: Toward a Location-aware InformationPlane for Data Centers. In Hewlett Packard Technical Re-port TR2004-27, 2004.
[20] J. Moore, J. Chase, K. Farkas, and P. Ranganathan. DataCenter Workload Monitoring, Analysis, and Emulation.In Eighth Workshop on Computer Architecture Evaluationusing Commercial Workloads, February 2005.
[21] J. Mouton. Enabling the vision: Leading the architectureof the future. In Keynote speech, Server Blade Summit,2004.
[22] S. Osman, D. Subhraveti, G. Su, and J. Nieh. The De-sign and Implementation of Zap: A System for MigratingComputing Environments. In Proceedings of the 5th Sym-posium on Operating Systems Design and Implementation,pages 361–376, Boston, Massachusetts, December 2002.
[23] C. D. Patel, C. E. Bash, R. Sharma, and M. Beitel-mal. Smart Cooling of Data Centers. In Proceedings of
the Pacific RIM/ASME International Electronics Packag-ing Technical Conference and Exhibition (IPACK03), July2003.
[24] E. Pinheiro, R. Bianchini, E. Carrera, and T. Heath. LoadBalancing and Unbalancing for Power and Performancein Cluster-Based Systems. In Proceedings of the Work-shop on Compilers and Operating Systems for Low Power,September 2001.
[25] K. Rajamani and C. Lefurgy. On Evaluating Request-Distribution Schemes for Saving Energy in Server Clus-ters. In Proceedings of the IEEE International Symposiumon Performance Analysis of Systems and Software, March2003.
[26] F. D. Sacerdoti, M. J. Katz, M. L. Massie, and D. E. Culler.Wide Area Cluster Monitoring with Ganglia. In Proceed-ings of the IEEE Cluster 2003 Conference, Hong Kong,2003.
[27] R. K. Sharma, C. L. Bash, C. D. Patel, R. J. Friedrich, andJ. S. Chase. Balance of Power: Dynamic Thermal Manage-ment for Internet Data Centers. IEEE Internet Computing,9(1):42–49, January 2005.
[28] R. F. Sullivan. Alternating Cold and Hot Aisles ProvidesMore Reliable Cooling for Server Farms. In Uptime Insti-tute, 2000.
[29] A. Vahdat, A. R. Lebeck, and C. S. Ellis. Every jouleis precious: The case for revisiting operating system de-sign for energy efficiency. In Proceedings of the 9th ACMSIGOPS European Workshop, September 2000.
[30] R. van Renesse and K. P. Birman. Scalable Managementand Data Mining using Astrolabe. In Proceedings forthe 1st International Workshop on Peer-to-Peer Systems,Berkeley, CA, February 2003.
[31] H. Zeng, X. Fan, C. Ellis, A. Lebeck, and A. Vahdat.ECOSystem: Managing Energy as a First Class OperatingSystem Resource. In Proceedings of Architectural Supportfor Programming Languages and Operating Systems, Oc-tober 2002.