lyon county economic overview - diversifynevada · lyon county economic modeling specialists...
TRANSCRIPT

Economy Overview
Lyon County, NV
Emsi Q3 2018 Data Set | www.economicmodeling.com
Economy Overview
Emsi Q3 2018 Data Set | www.economicmodeling.com

As of 2017 the region's popula on increased by 4.8%since 2012, growing by 2,446. Popula on is expected toincrease by 4.4% between 2017 and 2022, adding2,341.
From 2012 to 2017, jobs increased by 4.6% in LyonCounty, NV from 12,840 to 13,428. This change fellshort of the na onal growth rate of 8.2% by 3.6%. Asthe number of jobs increased, the labor forcepar cipa on rate decreased from 54.0% to 50.0%between 2012 and 2017.
Concerning educa onal a ainment, 11.2% of LyonCounty, NV residents possess a Bachelor's Degree(7.2% below the na onal average), and 9.1% hold anAssociate's Degree (1.2% above the na onal average).
The top three industries in 2017 are Educa on andHospitals (Local Government), Local Government,Excluding Educa on and Hospitals, and Restaurants andOther Ea ng Places.
Economy Overview53,533 13,428 $49.0K
Popula on (2017) Jobs (2017) Median Household Income (2016)Popula on grew by 2,446 overthe last 5 years and is projectedto grow by 2,341 over the next 5
years.
Jobs grew by 588 over the last 5years and are projected to growby 1,522 over the next 5 years.
Median household income is$6.3K below the na onal median
household income of $55.3K.
Popula on(2017)LaborForce(2017) Jobs (2017) Cost ofLiving GRP Imports Exports
Region 53,533 22,013 13,428 102.8 $1.47B $2.73B $1.76BRural Nevada 331,389 150,534 150,937 108.1 $20.45B $25.73B $32.47BWashoe County, NV 458,678 243,306 234,312 111.6 $25.11B $23.49B $23.15BClark County, NV 2,191,693 1,082,372 1,050,364 111.5 $110.50B $92.71B $98.38B
Economy Overview
Emsi Q3 2018 Data Set | www.economicmodeling.com 1

2017 Labor Force Breakdown
Popula on53,533
Educa onal A ainmentConcerning educa onal a ainment, 11.2% of Lyon County, NV residents possess a Bachelor's Degree (7.2% below the na onalaverage), and 9.1% hold an Associate's Degree (1.2% above the na onal average).
Popula onA Total Working Age Popula on 44,019A Not in Labor Force (15+) 22,006A Labor Force 22,013A Employed 20,790A Unemployed 1,223A Under 15 9,514
% of Popula on Popula onA Less Than 9th Grade 6.0% 2,302A 9th Grade to 12th Grade 7.7% 2,963A High School Diploma 33.9% 13,006A Some College 27.6% 10,596A Associate's Degree 9.1% 3,513A Bachelor's Degree 11.2% 4,306A Graduate Degree and Higher 4.5% 1,725
Economy Overview
Emsi Q3 2018 Data Set | www.economicmodeling.com 2

Historic & Projected TrendsPopula on TrendsAs of 2017 the region's popula on increased by 4.8% since 2012, growing by 2,446. Popula on is expected to increase by4.4% between 2017 and 2022, adding 2,341.
Timeframe Popula on2012 51,0872013 51,2672014 51,6132015 52,3392016 53,1792017 53,5332018 54,0832019 54,5892020 55,0552021 55,4822022 55,874
Economy Overview
Emsi Q3 2018 Data Set | www.economicmodeling.com 3

Historic & Projected Trends - Cont.Job TrendsFrom 2012 to 2017, jobs increased by 4.6% in Lyon County, NV from 12,840 to 13,428. This change fell short of the na onalgrowth rate of 8.2% by 3.6%.
Timeframe Jobs2012 12,8402013 13,0822014 13,8012015 13,1222016 13,1202017 13,4282018 13,8232019 14,1662020 14,4722021 14,7462022 14,950
Economy Overview
Emsi Q3 2018 Data Set | www.economicmodeling.com 4

Historic & Projected Trends - Cont.Labor Force Par cipa on Rate Trends
Timeframe Labor Force Par cipa on Rate2013 54.60%2014 54.23%2015 51.04%2016 50.00%2017 50.18%January 2018 49.04%February 2018 49.37%March 2018 50.07%April 2018 49.14%
Economy Overview
Emsi Q3 2018 Data Set | www.economicmodeling.com 5

Historic & Projected Trends - Cont.Unemployment Rate TrendsLyon County, NV had an April 2018 unemployment rate of 5.96%, decreasing from 12.53% 5 years before.
Timeframe Unemployment Rate2013 12.53%2014 10.21%2015 9.31%2016 7.36%2017 5.96%January 2018 6.74%February 2018 6.42%March 2018 6.41%April 2018 5.96%
Economy Overview
Emsi Q3 2018 Data Set | www.economicmodeling.com 6
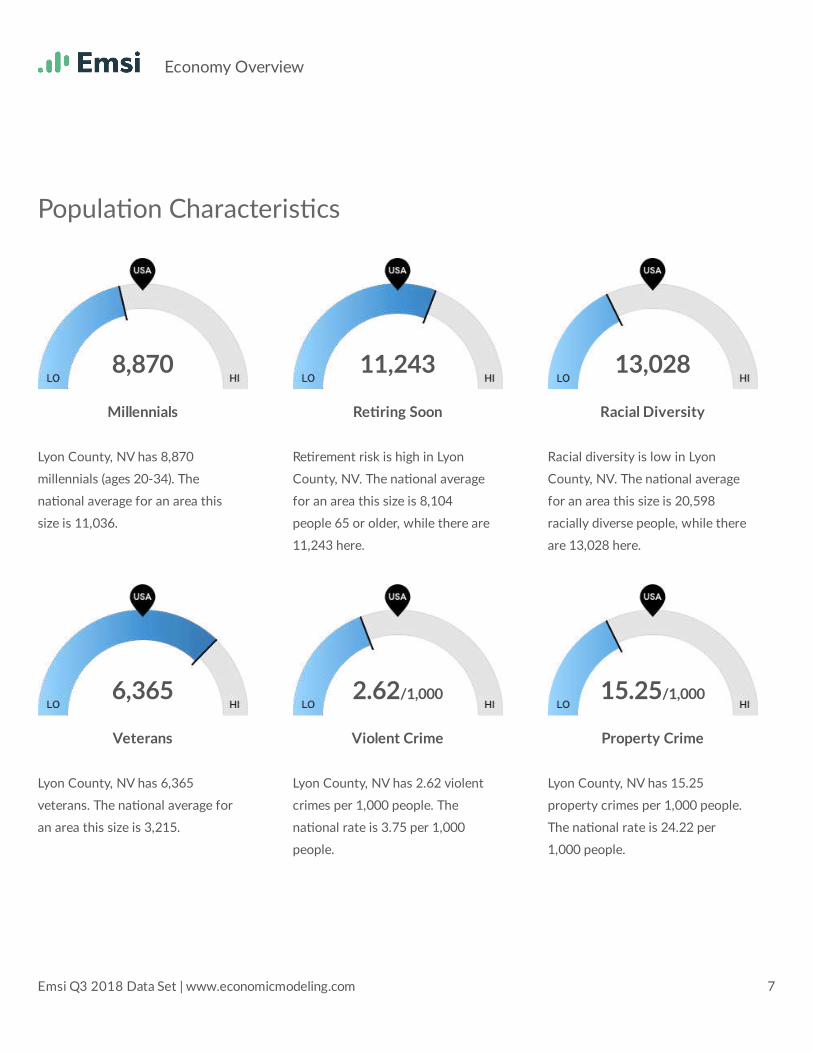
Lyon County, NV has 8,870millennials (ages 20-34). Thena onal average for an area thissize is 11,036.
Re rement risk is high in LyonCounty, NV. The na onal averagefor an area this size is 8,104people 65 or older, while there are11,243 here.
Racial diversity is low in LyonCounty, NV. The na onal averagefor an area this size is 20,598racially diverse people, while thereare 13,028 here.
Lyon County, NV has 6,365veterans. The na onal average foran area this size is 3,215.
Lyon County, NV has 2.62 violentcrimes per 1,000 people. Thena onal rate is 3.75 per 1,000people.
Lyon County, NV has 15.25property crimes per 1,000 people.The na onal rate is 24.22 per1,000 people.
Popula on Characteris cs
8,870Millennials
11,243Re ring Soon
13,028Racial Diversity
6,365Veterans
2.62/1,000
Violent Crime
15.25/1,000
Property Crime
Economy Overview
Emsi Q3 2018 Data Set | www.economicmodeling.com 7
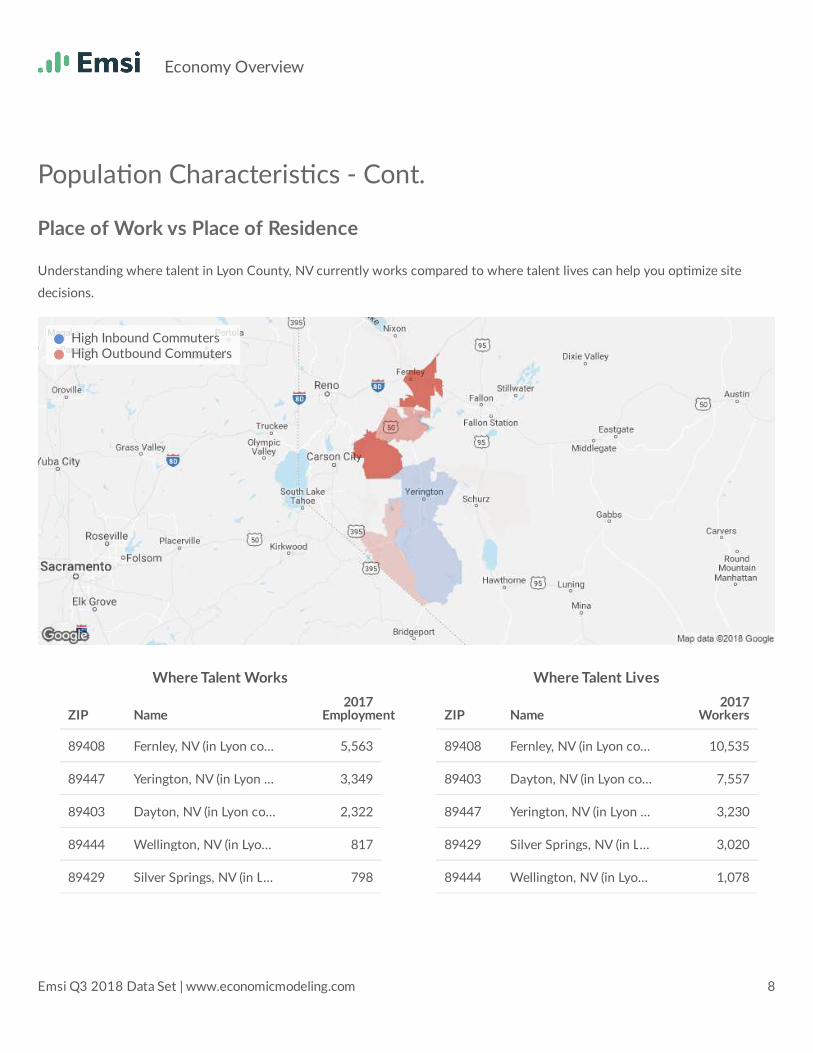
Where Talent Works Where Talent Lives
Popula on Characteris cs - Cont.Place of Work vs Place of ResidenceUnderstanding where talent in Lyon County, NV currently works compared to where talent lives can help you op mize sitedecisions.
High Inbound Commuters High Outbound Commuters
ZIP Name 2017Employment89408 Fernley, NV (in Lyon county)… 5,56389447 Yerington, NV (in Lyon county)… 3,34989403 Dayton, NV (in Lyon county)… 2,32289444 Wellington, NV (in Lyon county)… 81789429 Silver Springs, NV (in Lyon county)… 798
ZIP Name 2017Workers89408 Fernley, NV (in Lyon county)… 10,53589403 Dayton, NV (in Lyon county)… 7,55789447 Yerington, NV (in Lyon county)… 3,23089429 Silver Springs, NV (in Lyon county)… 3,02089444 Wellington, NV (in Lyon county)… 1,078
Economy Overview
Emsi Q3 2018 Data Set | www.economicmodeling.com 8
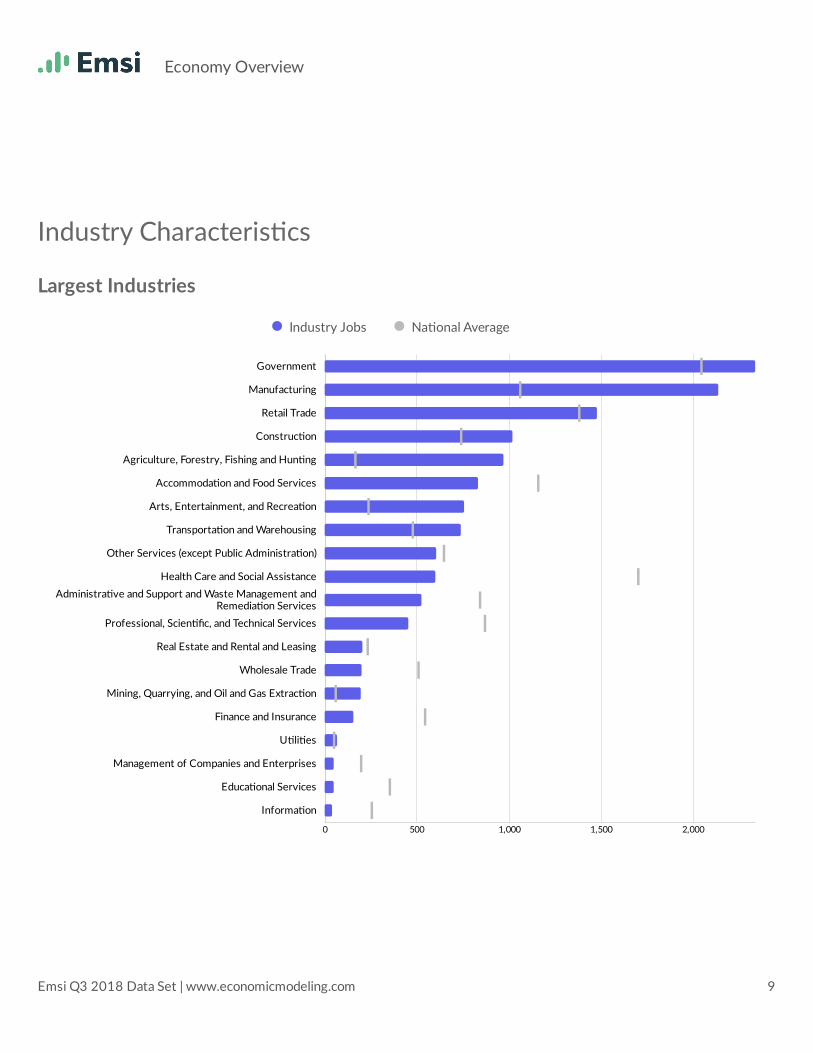
Industry Characteris csLargest Industries
Industry Jobs Na onal Average
0 500 1,000 1,500 2,000Informa on
Educa onal ServicesManagement of Companies and Enterprises
U li esFinance and Insurance
Mining, Quarrying, and Oil and Gas Extrac onWholesale Trade
Real Estate and Rental and LeasingProfessional, Scien fic, and Technical Services
Administra ve and Support and Waste Management andRemedia on Services
Health Care and Social AssistanceOther Services (except Public Administra on)
Transporta on and WarehousingArts, Entertainment, and Recrea on
Accommoda on and Food ServicesAgriculture, Forestry, Fishing and Hun ng
Construc onRetail Trade
ManufacturingGovernment
Economy Overview
Emsi Q3 2018 Data Set | www.economicmodeling.com 9

Industry Characteris cs - Cont.Top Growing Industries
Industry Jobs Growth
0 50 100 150 200 250 300Informa on
U li esManagement of Companies and Enterprises
Educa onal ServicesReal Estate and Rental and Leasing
Arts, Entertainment, and Recrea onHealth Care and Social Assistance
Other Services (except Public Administra on)Professional, Scien fic, and Technical Services
ManufacturingAdministra ve and Support and Waste Management and Remedia on Services
GovernmentTransporta on and Warehousing
Agriculture, Forestry, Fishing and Hun ngAccommoda on and Food Services
Construc on
Economy Overview
Emsi Q3 2018 Data Set | www.economicmodeling.com 10

Industry Characteris cs - Cont.Top Industry LQ
Industry LQ
0.00 1.00 2.00 3.00 4.00 5.00 6.00Educa onal Services
Informa onManagement of Companies and Enterprises
Finance and InsuranceHealth Care and Social Assistance
Wholesale TradeProfessional, Scien fic, and Technical Services
Administra ve and Support and Waste Management and Remedia on ServicesAccommoda on and Food ServicesReal Estate and Rental and Leasing
Other Services (except Public Administra on)Retail Trade
GovernmentConstruc on
U li esTransporta on and Warehousing
ManufacturingArts, Entertainment, and Recrea on
Mining, Quarrying, and Oil and Gas Extrac onAgriculture, Forestry, Fishing and Hun ng
Economy Overview
Emsi Q3 2018 Data Set | www.economicmodeling.com 11

Industry Characteris cs - Cont.Top Industry GRP
2017 Gross Regional Product
$0.000 $50.00M $100.0M $150.0M $200.0M $250.0MEduca onal Services
Management of Companies and EnterprisesInforma on
Finance and InsuranceOther Services (except Public Administra on)
Administra ve and Support and Waste Management and Remedia on ServicesU li es
Health Care and Social AssistanceAccommoda on and Food Services
Wholesale TradeProfessional, Scien fic, and Technical Services
Real Estate and Rental and LeasingTransporta on and Warehousing
Agriculture, Forestry, Fishing and Hun ngArts, Entertainment, and Recrea on
Construc onRetail Trade
Mining, Quarrying, and Oil and Gas Extrac onGovernment
Manufacturing
Economy Overview
Emsi Q3 2018 Data Set | www.economicmodeling.com 12

Industry Characteris cs - Cont.Top Industry Earnings
2017 Earnings Per Worker
$0 $20,000 $40,000 $60,000 $80,000 $100,000 $120,000Accommoda on and Food Services
Other Services (except Public Administra on)Arts, Entertainment, and Recrea on
Retail TradeAdministra ve and Support and Waste Management and Remedia on Services
Real Estate and Rental and LeasingEduca onal Services
Agriculture, Forestry, Fishing and Hun ngHealth Care and Social Assistance
Finance and InsuranceTransporta on and Warehousing
Construc onProfessional, Scien fic, and Technical Services
Wholesale TradeGovernment
ManufacturingInforma on
Mining, Quarrying, and Oil and Gas Extrac onManagement of Companies and Enterprises
U li es
Economy Overview
Emsi Q3 2018 Data Set | www.economicmodeling.com 13
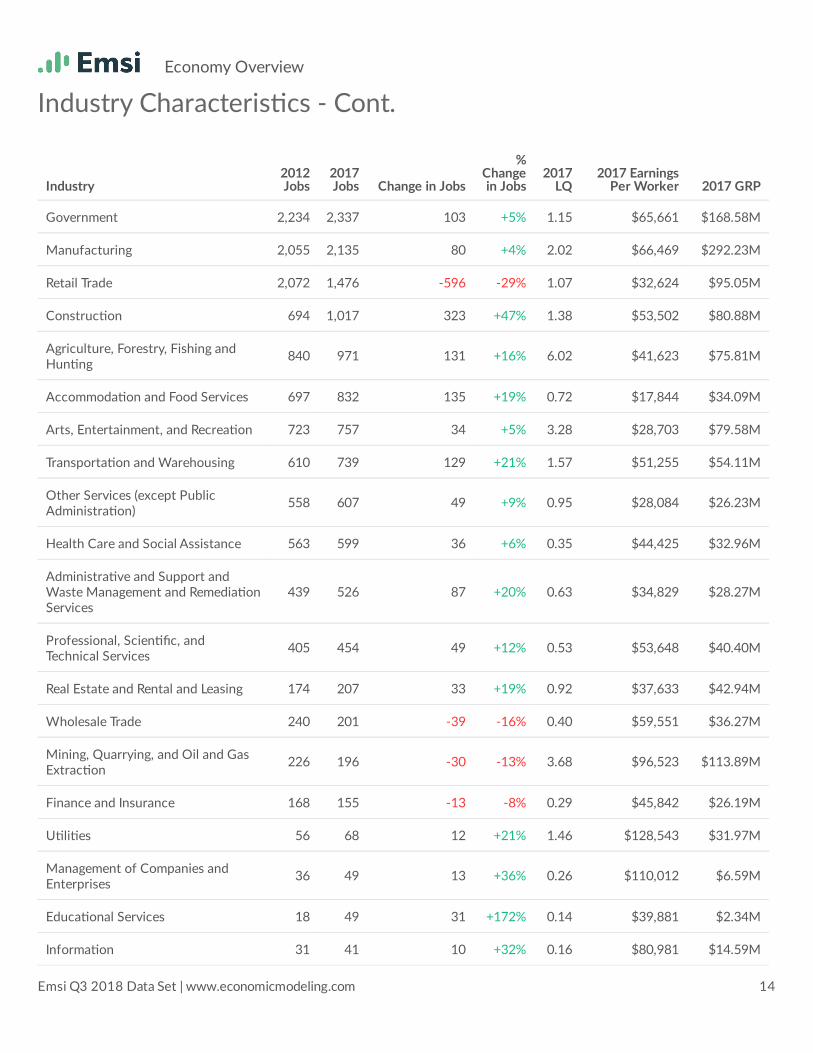
Industry Characteris cs - Cont.
Industry 2012Jobs 2017Jobs Change in Jobs%Changein Jobs 2017LQ 2017 EarningsPer Worker 2017 GRP
Government 2,234 2,337 103 +5% 1.15 $65,661 $168.58MManufacturing 2,055 2,135 80 +4% 2.02 $66,469 $292.23MRetail Trade 2,072 1,476 -596 -29% 1.07 $32,624 $95.05MConstruc on 694 1,017 323 +47% 1.38 $53,502 $80.88MAgriculture, Forestry, Fishing andHun ng 840 971 131 +16% 6.02 $41,623 $75.81M
Accommoda on and Food Services 697 832 135 +19% 0.72 $17,844 $34.09MArts, Entertainment, and Recrea on 723 757 34 +5% 3.28 $28,703 $79.58MTransporta on and Warehousing 610 739 129 +21% 1.57 $51,255 $54.11MOther Services (except PublicAdministra on) 558 607 49 +9% 0.95 $28,084 $26.23M
Health Care and Social Assistance 563 599 36 +6% 0.35 $44,425 $32.96MAdministra ve and Support andWaste Management and Remedia onServices
439 526 87 +20% 0.63 $34,829 $28.27M
Professional, Scien fic, andTechnical Services 405 454 49 +12% 0.53 $53,648 $40.40M
Real Estate and Rental and Leasing 174 207 33 +19% 0.92 $37,633 $42.94MWholesale Trade 240 201 -39 -16% 0.40 $59,551 $36.27MMining, Quarrying, and Oil and GasExtrac on 226 196 -30 -13% 3.68 $96,523 $113.89M
Finance and Insurance 168 155 -13 -8% 0.29 $45,842 $26.19MU li es 56 68 12 +21% 1.46 $128,543 $31.97MManagement of Companies andEnterprises 36 49 13 +36% 0.26 $110,012 $6.59M
Educa onal Services 18 49 31 +172% 0.14 $39,881 $2.34MInforma on 31 41 10 +32% 0.16 $80,981 $14.59M
Economy Overview
Emsi Q3 2018 Data Set | www.economicmodeling.com 14

Business Characteris cs522 Companies Employ Your WorkersOnline profiles for your workers men on 522 companies as employers, with the top 10 appearing below. In the last 12 months,630 companies in Lyon County, NV posted job pos ngs, with the top 10 appearing below.
Top Companies ProfilesChewy.com, LLC 11State of Nevada 10Trex Company, Inc. 8Amazon.com, Inc. 6United States Department of the Navy… 6Zulily, Inc. 6MSC Industrial Direct Co., Inc. 5PANASONIC CORPORATION 5Tesla, Inc. 5Wells Fargo & Company 5
Top Companies Pos ng Unique Pos ngsTravel Nurse Inc 591C.R. England, Inc. 205Swi Transporta on Company 191HealthCare Employment Network… 188Pilot Flying J 156Avon Products, Inc. 129Co-Alliance, LLP 117The Webstaurant Store Inc 90MSC Industrial Direct Co., Inc. 85United States Department of the Air Force… 78
Economy Overview
Emsi Q3 2018 Data Set | www.economicmodeling.com 15

Business Characteris cs - Cont.Business Size
*Business Data by DatabaseUSA.com is third-party data provided by Emsi to its customers as a convenience, and Emsi does not endorse or warrant itsaccuracy or consistency with other published Emsi data. In most cases, the Business Count will not match total companies with profiles on the summary tab.
Percentage Business CountA 1 to 4 employees 51.4% 667A 5 to 9 employees 22.3% 289A 10 to 19 employees 14.3% 185A 20 to 49 employees 8.4% 109A 50 to 99 employees 2.8% 36A 100 to 249 employees 0.6% 8A 250 to 499 employees 0.3% 4
Economy Overview
Emsi Q3 2018 Data Set | www.economicmodeling.com 16

Workforce Characteris csLargest Occupa ons
Occupa on Jobs Na onal Average
0 500 1,000 1,500Legal
Military-onlyComputer and Mathema cal
Life, Physical, and Social ScienceArts, Design, Entertainment, Sports, and Media
Healthcare SupportArchitecture and Engineering
Community and Social ServiceProtec ve Service
Healthcare Prac oners and TechnicalBusiness and Financial Opera ons
Building and Grounds Cleaning and MaintenancePersonal Care and Service
Farming, Fishing, and ForestryInstalla on, Maintenance, and Repair
Construc on and Extrac onManagement
Educa on, Training, and LibraryTransporta on and Material Moving
Sales and RelatedFood Prepara on and Serving Related
Produc onOffice and Administra ve Support
Economy Overview
Emsi Q3 2018 Data Set | www.economicmodeling.com 17
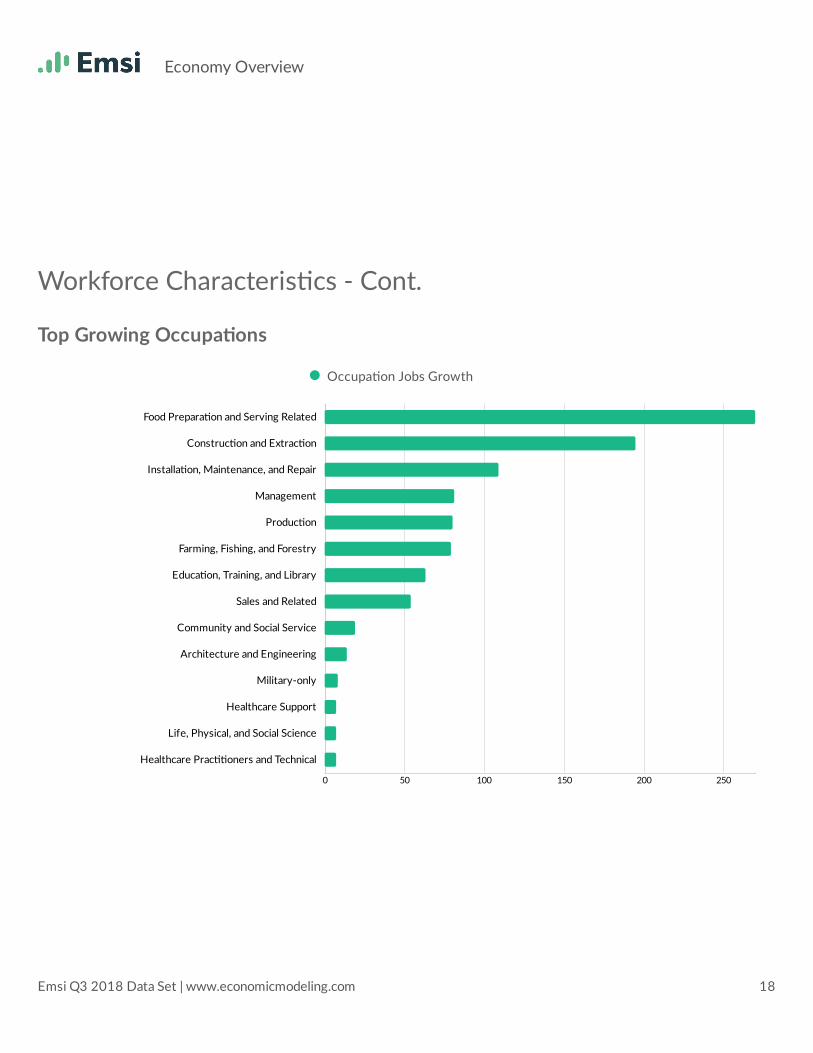
Workforce Characteris cs - Cont.Top Growing Occupa ons
Occupa on Jobs Growth
0 50 100 150 200 250Healthcare Prac oners and Technical
Life, Physical, and Social ScienceHealthcare Support
Military-onlyArchitecture and Engineering
Community and Social ServiceSales and Related
Educa on, Training, and LibraryFarming, Fishing, and Forestry
Produc onManagement
Installa on, Maintenance, and RepairConstruc on and Extrac on
Food Prepara on and Serving Related
Economy Overview
Emsi Q3 2018 Data Set | www.economicmodeling.com 18
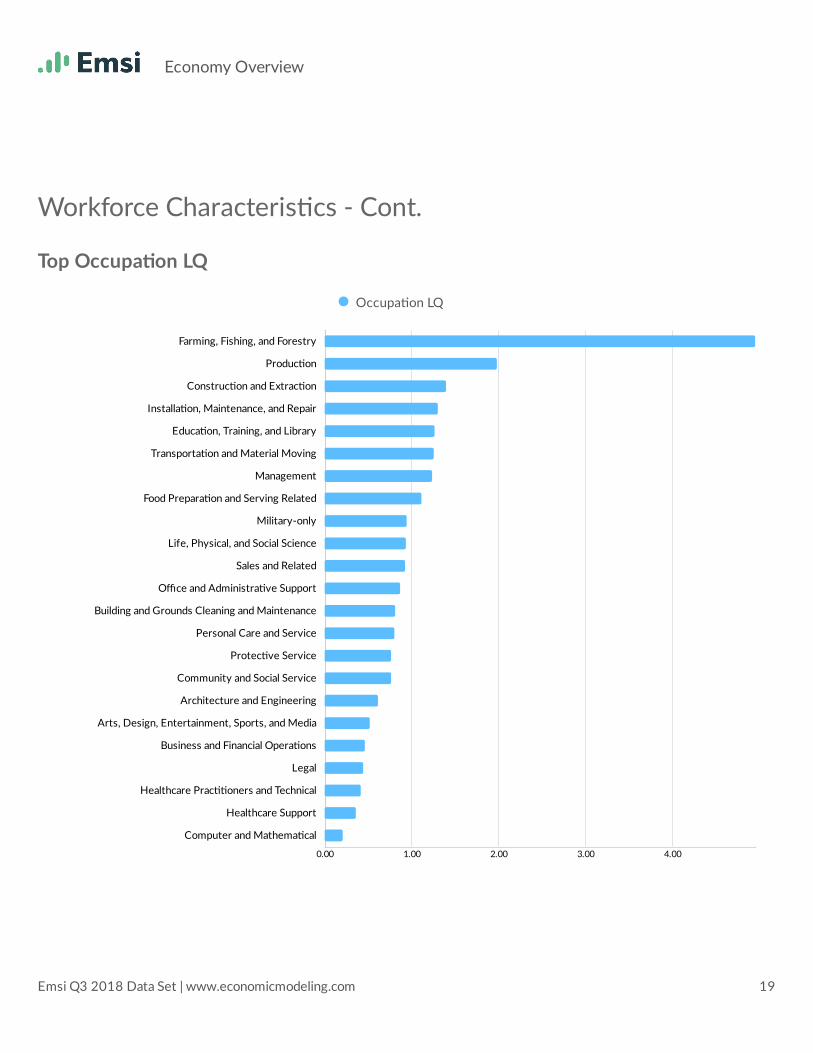
Workforce Characteris cs - Cont.Top Occupa on LQ
Occupa on LQ
0.00 1.00 2.00 3.00 4.00Computer and Mathema cal
Healthcare SupportHealthcare Prac oners and Technical
LegalBusiness and Financial Opera ons
Arts, Design, Entertainment, Sports, and MediaArchitecture and Engineering
Community and Social ServiceProtec ve Service
Personal Care and ServiceBuilding and Grounds Cleaning and Maintenance
Office and Administra ve SupportSales and Related
Life, Physical, and Social ScienceMilitary-only
Food Prepara on and Serving RelatedManagement
Transporta on and Material MovingEduca on, Training, and Library
Installa on, Maintenance, and RepairConstruc on and Extrac on
Produc onFarming, Fishing, and Forestry
Economy Overview
Emsi Q3 2018 Data Set | www.economicmodeling.com 19

Workforce Characteris cs - Cont.Top Occupa on Earnings
2017 Avg. Hourly Earnings
$0.00 $10.00 $20.00 $30.00 $40.00Food Prepara on and Serving Related
Personal Care and ServiceBuilding and Grounds Cleaning and Maintenance
Healthcare SupportSales and Related
Office and Administra ve SupportFarming, Fishing, and Forestry
Transporta on and Material MovingProduc on
Military-onlyArts, Design, Entertainment, Sports, and Media
Educa on, Training, and LibraryConstruc on and Extrac on
Installa on, Maintenance, and RepairProtec ve Service
Community and Social ServiceBusiness and Financial Opera ons
Life, Physical, and Social ScienceManagement
Computer and Mathema calArchitecture and Engineering
LegalHealthcare Prac oners and Technical
Economy Overview
Emsi Q3 2018 Data Set | www.economicmodeling.com 20
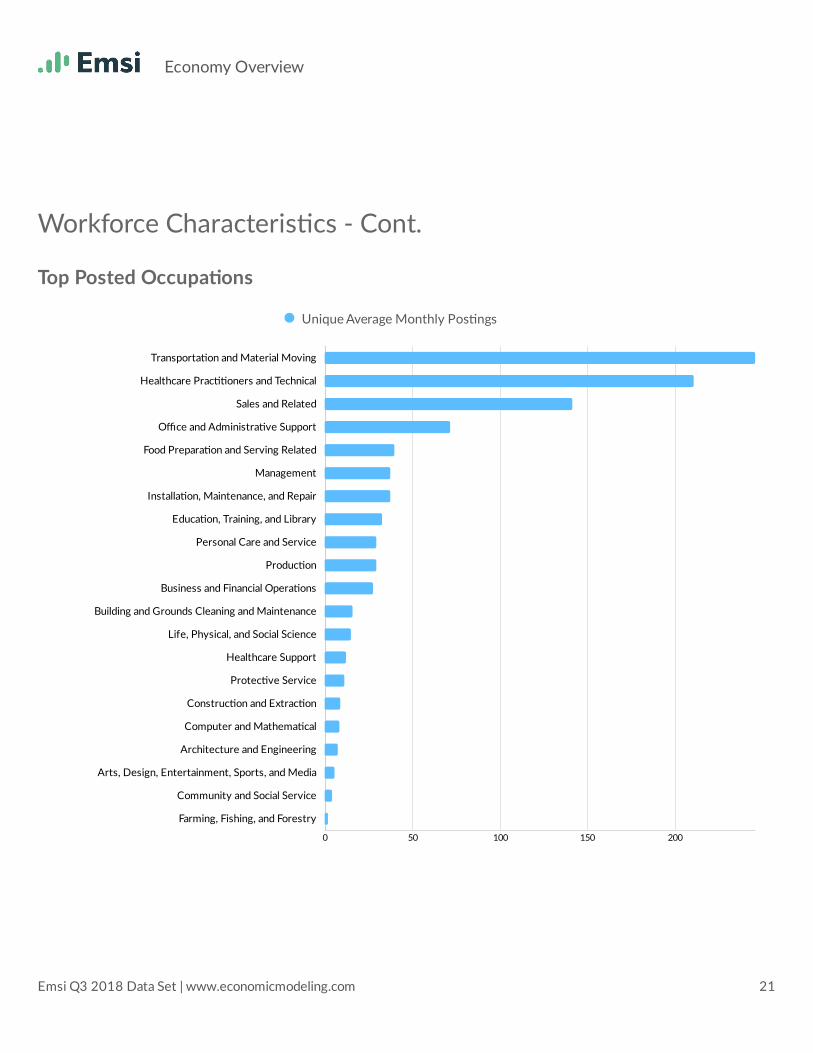
Workforce Characteris cs - Cont.Top Posted Occupa ons
Unique Average Monthly Pos ngs
0 50 100 150 200Farming, Fishing, and ForestryCommunity and Social Service
Arts, Design, Entertainment, Sports, and MediaArchitecture and EngineeringComputer and Mathema calConstruc on and Extrac on
Protec ve ServiceHealthcare Support
Life, Physical, and Social ScienceBuilding and Grounds Cleaning and Maintenance
Business and Financial Opera onsProduc on
Personal Care and ServiceEduca on, Training, and Library
Installa on, Maintenance, and RepairManagement
Food Prepara on and Serving RelatedOffice and Administra ve Support
Sales and RelatedHealthcare Prac oners and Technical
Transporta on and Material Moving
Economy Overview
Emsi Q3 2018 Data Set | www.economicmodeling.com 21

Workforce Characteris cs - Cont.
Occupa on 2012Jobs 2017Jobs Change in Jobs%Changein Jobs 2017LQ
2017 Avg.HourlyEarningsAug 2017 - Jul 2018Unique AverageMonthly Pos ngs
Office andAdministra ve Support 1,964 1,730 -234 -12% 0.87 $16.43 72
Produc on 1,472 1,552 80 +5% 1.98 $18.55 30Food Prepara on andServing Related 984 1,254 270 +27% 1.11 $11.06 40
Sales and Related 1,197 1,251 54 +5% 0.93 $16.05 142Transporta on andMaterial Moving 1,129 1,129 0 0% 1.26 $18.03 246
Educa on, Training, andLibrary 900 963 63 +7% 1.26 $20.43 33
Management 844 925 81 +10% 1.24 $32.89 37Construc on andExtrac on 652 847 195 +30% 1.39 $22.76 9
Installa on,Maintenance, and Repair 574 683 109 +19% 1.30 $22.87 37
Farming, Fishing, andForestry 428 507 79 +18% 4.96 $17.33 2
Personal Care andService 530 461 -69 -13% 0.80 $12.41 30
Building and GroundsCleaning andMaintenance
434 404 -30 -7% 0.82 $12.95 16
Business and FinancialOpera ons 333 323 -10 -3% 0.47 $28.22 27
Healthcare Prac onersand Technical 300 307 7 +2% 0.41 $41.00 211
Protec ve Service 238 231 -7 -3% 0.76 $23.04 11Community and SocialService 150 169 19 +13% 0.76 $23.19 4
Architecture andEngineering 124 138 14 +11% 0.61 $34.68 8
Economy Overview
Emsi Q3 2018 Data Set | www.economicmodeling.com 22

Workforce Characteris cs - Cont.
Occupa on 2012Jobs 2017Jobs Change in Jobs%Changein Jobs 2017LQ
2017 Avg.HourlyEarningsAug 2017 - Jul 2018Unique Average MonthlyPos ngs
Healthcare Support 123 130 7 +6% 0.36 $13.66 12Arts, Design,Entertainment, Sports,and Media
133 128 -5 -4% 0.52 $19.43 6
Life, Physical, andSocial Science 94 101 7 +7% 0.94 $32.63 15
Computer andMathema cal 127 79 -48 -38% 0.21 $34.44 8
Military-only 59 67 8 +14% 0.95 $19.16 0Legal 51 50 -1 -2% 0.45 $36.49 1
Economy Overview
Emsi Q3 2018 Data Set | www.economicmodeling.com 23