lymmo brt: 15 years later - transit.dot.gov · does not endorse products of manufacturers. ......
TRANSCRIPT

LYMMO BRT: 15 Years Later JUNE 2013
FTA Report No. 0042 Federal Transit Administration
PREPARED BY
Brian Pessaro, AICP Martin Catalá
National Bus Rapid Transit Institute Center for Urban Transportation Research
University of South Florida

COVER PHOTO Courtesy of LYNX
DISCLAIMER This document is disseminated under the sponsorship of the U.S. Department of Transportation in the interest of information exchange. The United States Government assumes no liability for its contents or use thereof. The United States Government does not endorse products of manufacturers. Trade or manufacturers’ names appear herein solely because they are considered essential to the objective of this report.

FEDERAL TRANSIT ADMINISTRATION i
LYMMO BRT: 15 Years Later
JUNE 2013 FTA Report No. 0042
PREPARED BY
Brian Pessaro, AICP Martin Catalá
National Bus Rapid Transit Institute Center for Urban Transportation Research University of South Florida
SPONSORED BY
Federal Transit Administration Office of Research, Demonstration and Innovation U.S. Department of Transportation 1200 New Jersey Avenue, SE Washington, DC 20590
AVAILABLE ONLINE
http://www.fta.dot.gov/research

Metric Conversion Table
FEDERAL TRANSIT ADMINISTRATION ii
Metric Conversion Table
Metric Conversion Table
SYMBOL WHEN YOU KNOW
in inches
ft feet
yd yards
mi miles
MULTIPLY BY
LENGTH
25.4
0.305
0.914
1.61
VOLUME
TO FIND
millimeters
meters
meters
kilometers
SYMBOL
mm
m
m
km
fl oz fluid ounces 29.57 milliliters mL
gal gallons 3.785 liters L
3ft3 cubic feet 0.028 cubic meters m
yd3 cubic yards 0.765 cubic meters m 3
NOTE: volumes greater than 1000 L shall be shown in m3
MASS
oz ounces 28.35 grams g
lb pounds 0.454 kilograms kg
megagrams T short tons (2000 lb) 0.907 Mg (or "t")
(or "metric ton")
TEMPERATURE (exact degrees)
5 (F-32)/9 oF Fahrenheit Celsius oCor (F-32)/1.8
FEDERAL TRANSIT ADMINISTRATION ii
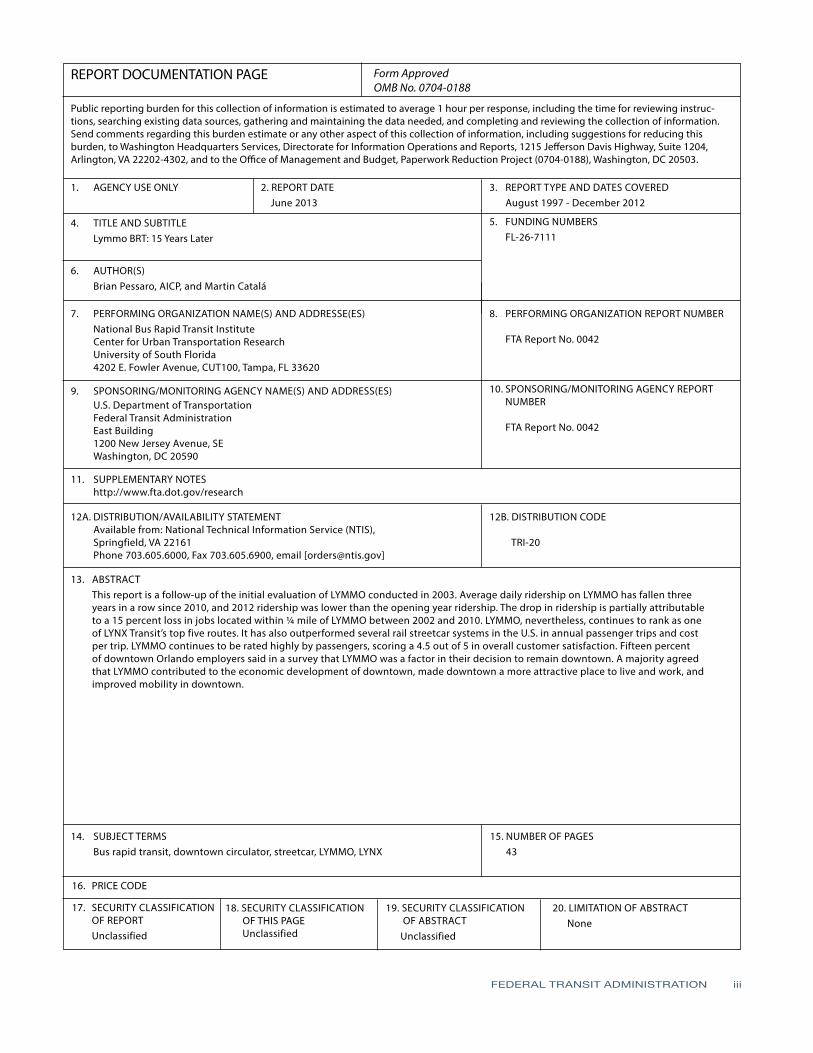
REPORT DOCUMENTATION PAGE Form Approved OMB No. 0704-0188
Public reporting burden for this collection of information is estimated to average 1 hour per response, including the time for reviewing instructions, searching existing data sources, gathering and maintaining the data needed, and completing and reviewing the collection of information. Send comments regarding this burden estimate or any other aspect of this collection of information, including suggestions for reducing this burden, to Washington Headquarters Services, Directorate for Information Operations and Reports, 1215 Jefferson Davis Highway, Suite 1204, Arlington, VA 22202-4302, and to the Office of Management and Budget, Paperwork Reduction Project (0704-0188), Washington, DC 20503.
1. AGENCY USE ONLY 2. REPORT DATE June 2013
3. REPORT TYPE AND DATES COVERED August 1997 - December 2012
4. TITLE AND SUBTITLE Lymmo BRT: 15 Years Later
5. FUNDING NUMBERS FL-26-7111
6. AUTHOR(S) Brian Pessaro, AICP, and Martin Catalá
7. PERFORMING ORGANIZATION NAME(S) AND ADDRESSE(ES) National Bus Rapid Transit Institute Center for Urban Transportation Research University of South Florida 4202 E. Fowler Avenue, CUT100, Tampa, FL 33620
8. PERFORMING ORGANIZATION REPORT NUMBER
FTA Report No. 0042
9. SPONSORING/MONITORING AGENCY NAME(S) AND ADDRESS(ES) U.S. Department of Transportation Federal Transit Administration East Building 1200 New Jersey Avenue, SE Washington, DC 20590
10. SPONSORING/MONITORING AGENCY REPORT NUMBER
FTA Report No. 0042
11. SUPPLEMENTARY NOTES http://www.fta.dot.gov/research
12A. DISTRIBUTION/AVAILABILITY STATEMENT Available from: National Technical Information Service (NTIS), Springfield, VA 22161 Phone 703.605.6000, Fax 703.605.6900, email [[email protected]]
12B. DISTRIBUTION CODE
TRI-20
13. ABSTRACT This report is a follow-up of the initial evaluation of LYMMO conducted in 2003. Average daily ridership on LYMMO has fallen three years in a row since 2010, and 2012 ridership was lower than the opening year ridership. The drop in ridership is partially attributable to a 15 percent loss in jobs located within ¼ mile of LYMMO between 2002 and 2010. LYMMO, nevertheless, continues to rank as one of LYNX Transit’s top five routes. It has also outperformed several rail streetcar systems in the U.S. in annual passenger trips and cost per trip. LYMMO continues to be rated highly by passengers, scoring a 4.5 out of 5 in overall customer satisfaction. Fifteen percent of downtown Orlando employers said in a survey that LYMMO was a factor in their decision to remain downtown. A majority agreed that LYMMO contributed to the economic development of downtown, made downtown a more attractive place to live and work, and improved mobility in downtown.
14. SUBJECT TERMS Bus rapid transit, downtown circulator, streetcar, LYMMO, LYNX
15. NUMBER OF PAGES 43
16. PRICE CODE
17. SECURITY CLASSIFICATION OF REPORT Unclassified
18. SECURITY CLASSIFICATION OF THIS PAGE
Unclassified
19. SECURITY CLASSIFICATION OF ABSTRACT
Unclassified
20. LIMITATION OF ABSTRACT None
FEDERAL TRANSIT ADMINISTRATION iii

TABLE OF CONTENTS
1 Executive Summary
3 Section 1: Background
5 Section 2: Operational Expenses
6 Section 3: Ridership
9 Section 4: Boardings and Alightings
11 Section 5: Employment Data
15 Section 6: Rider Survey
20 Section 7: Employer Survey
24 Section 8: Future Plans
26 Appendix A: LYMMO Ridership Data, August 1997–December 2012
31 Appendix B: LYMMO Boarding and Alighting Data, 2003 and 2012
32 Appendix C: LYMMO Rider Survey, 2012
33 Appendix D: Employer Survey, 2012
FEDERAL TRANSIT ADMINISTRATION iv

LIST OF FIGURES
4 Figure 1-1: LYMMO Route 6 Figure 3-1: LYMMO Average Weekday Riders, 1997 to 2012 7 Figure 3-2: Percent Change in Annual Riders LYMMO vs. LYNX
10 Figure 4-1: LYMMO Boardings and Alightings 12 Figure 5-1: Jobs within ¼ Mile of LYMMO, 2002 13 Figure 5-2: Jobs within ¼ Mile of LYMMO, 2010 17 Figure 6-1: 35-Foot Gillig Hybrid Bus 19 Figure 6-2: LYNX Central Station 20 Figure 7-1: LYMMO Employer Survey Boundary 24 Figure 8-1: New LYMMO Corridors
LIST OF TABLES
5 Table 2-1: LYMMO Operational Costs 5 Table 2-2: Operational Cost Comparison, 2011 6 Table 3-1: LYMMO Average Weekday Riders, 1997–2012 8 Table 3-2: LYNX Fixed-Route Performance Statistics 8 Table 3-3: Comparison of LYMMO to Rail Streetcar Systems
11 Table 5-1: Industries within ¼ Mile of LYMMO Route 14 Table 5-2: Industries within Orlando Urbanized Area 15 Table 6-1: Primary Trip Purpose 16 Table 6-2: Frequency of Use 16 Table 6-3: Service Ratings 17 Table 6-4: Riders’ Favorite Features of LYMMO, 2001 Survey 17 Table 6-5: Riders' Favorite Features of LYMMO, 2012 Survey 18 Table 6-6: LYMMO has reduced congestion in downtown Orlando 18 Table 6-7: LYMMO has made downtown Orlando a more attractive place
to live/work 18 Table 6-8: Do you use any other LYNX services? 2001 Survey 19 Table 6-9: Do you use any other LYNX services? 2012 Survey 21 Table 7-1: Did your company locate in downtown before or after LYMMO
began? 21 Table 7-2: Was LYMMO a factor in your company’s decision to locate and
remain downtown? 22 Table 7-3: Employer Perceptions of LYMMO's Impact 22 Table 7-4: How many employees are at this location? 23 Table 7-5: Which best describes your business?
FEDERAL TRANSIT ADMINISTRATION v

ACKNOWLEDGMENTS
The authors would like to thank Laura Minns and Ola Adelekan at LYNX Transit and Claudia Korobkoff at the City of Orlando for their valuable help in the development of this report.
ABSTRACT
LYMMO bus rapid transit (BRT) service began in August 1997 in Orlando, Florida, as one of the first bus-based premium downtown circulators in the United States. This report is a follow-up of the initial evaluation conducted in 2003. Average daily ridership on LYMMO has fallen three years in a row since 2010, and 2012 ridership was lower than the opening year ridership. The drop in ridership is partially attributable to a 15 percent loss in jobs located within a ¼ mile of LYMMO between 2002 and 2010. LYMMO, nevertheless, continues to rank as one of LYNX Transit’s top five routes. It has also outperformed several rail streetcar systems in the U.S. in annual passenger trips and cost per trip. LYMMO continues to be rated highly by passengers, scoring a 4.5 out of 5 in overall customer satisfaction. Fifteen percent of downtown Orlando employers said in a survey that LYMMO was a factor in their decision to remain downtown. A majority agreed that LYMMO contributed to the economic development of downtown, made downtown a more attractive place to live and work, and improved mobility in downtown.
FEDERAL TRANSIT ADMINISTRATION vi

EXECUTIVE SUMMARY
FEDERAL TRANSIT ADMINISTRATION 1
EXECUTIVE SUMMARY
LYMMO bus rapid transit service began in August 1997 in Orlando, Florida, as one of the first bus-based premium downtown circulators in the U.S. Its construction was funded, in part, by the Federal Transit Administration’s (FTA’s) Bus Rapid Transit (BRT) Demonstration Program. It is operated by LYNX Transit. The National Bus Rapid Transit Institute at the University of South Florida’s Center for Urban Transportation Research evaluated LYMMO in 2003. This 2013 report revisits some of the measures from the 2003 report to see how LYMMO is faring today.
At its opening in 1997, LYMMO’s average weekday ridership exceeded the projections. On average, it carried 3,091 riders each weekday in 1997. The projection was 2,680 riders. However, the ridership plateaued by 1998 and remained fairly constant until 2010 when it began to drop. Average weekday ridership fell in 2010, 2011, and 2012. Average weekday ridership in 2012 was 3,017 riders, which is lower than the first year of operation. The ridership trend on LYMMO does not match the trend on the rest of LYNX’s service, on which annual boardings have been increasing steadily since 1997. Nevertheless, LYMMO is still one of the LYNX’s highest ridership routes, ranking 5th out of 55 fixed routes. LYMMO also outperforms several rail streetcar systems in the U.S. that are of similar length in terms of both annual passengers and cost per passenger trip (see Table 3-3).
Several things may have contributed to the drop in ridership that began in 2010. In 2010, the Amway Arena, which housed the Orlando Magic NBA basketball team, closed, thereby eliminating riders for special events. Also in 2010, the Orange County Courthouse stopped validating parking for jurors using the CentroPlex parking garage, which is also the terminus for LYMMO. Jurors at that time comprised nine percent of riders; in the most recent survey, they comprise only one percent. The economic recession has likely had a negative impact on LYMMO ridership as well. From 2002 to 2010, there was an 18 percent drop in the total number of jobs within the ¼-mile buffer of the LYMMO route. This contrasts with a 5 percent increase in jobs in the Orlando Urbanized Area as a whole. The drop in ridership since 2010 has led to higher operational and maintenance (O&M) costs per passenger trip. Although the annual O&M cost increased only two percent between 1998 and 2012, the O&M cost per passenger trip increased 30 percent.
The location distribution of boardings and alightings has shifted since the 2003 report. In 2003, the boardings and alightings were fairly evenly distributed along the route, and they generally dropped off in number once the bus was south of E. Central Boulevard. In 2012, LYNX Central Station and the Orange County Public Library were the top two boarding and alighting locations, accounting respectively for 27 and 24 percent of all boardings and alightings.

FEDERAL TRANSIT ADMINISTRATION 2
EXECUTIVE SUMMARY
In the latest 2012 survey of LYMMO riders, a smaller percentage use LYMMO to get to work compared to the previous (2001) survey. However, more riders now are using it for lunch, errands, and shopping. The percentage of riders that use LYMMO to get to/from jury duty fell from nine percent to one percent. In both the 2001 and 2012 surveys, 54 percent said they use LYMMO at least twice a day. The percentage of riders who use it four or more times a day has increased from 13 to 21 percent. Overall rider satisfaction remains high. On a scale of 1 to 5, the mean score for rider satisfaction was 4.5 (satisfied). More than 76 percent of riders think LYMMO has reduced congestion in downtown Orlando, and nearly 80 percent think LYMMO has made downtown Orlando a more attractive place to live and work.
In a mailed survey of employers located near LYMMO, only 34 out of 711 responded; the response rate (5%) is too small to be statistically conclusive. Therefore, the responses are provided only for illustrative purposes. Three of the 34 employers (9%) said LYMMO was a factor in their decision to locate downtown. Five of the employers (15%) said LYMMO is a factor in their decision to remain downtown. A total of 53 percent agreed or strongly agreed with the survey statement that LYMMO has contributed to the economic development of downtown, and 59 percent agreed or strongly agreed that LYMMO made downtown a more attractive place to live and work. A wider margin (73%) agreed or strongly agreed with the statement that LYMMO has improved mobility in downtown.
LYNX Transit is planning to expand LYMMO into several new corridors, with two new LYMMO lines expected to open in Spring 2014. All of the new LYMMO lines will connect with the existing LYMMO line and the SunRail commuter rail line, which is scheduled to open in early 2014. The new LYMMO lines will tap new ridership by serving new destinations such as the planned Creative Village, the Amway Center, Florida A&M College of Law, the State of Florida Office Complex, the U.S. Courthouse, Florida Hospital, and the Orlando Regional Medical Center. Given the fact that the ridership on LYMMO plateaued soon after opening, expanding LYMMO into new corridors to tap new riders appears to be timely.

SECTION
1
SECTION Background 1 LYMMO bus rapid transit (BRT) service began in August 1997 as one of the first bus-based premium downtown circulators in the U.S. The transit operator is LYNX Transit. Prior to LYMMO, the Orlando Central Business District was served by two other bus circulators. The Meter Eater was introduced in 1983 and charged a fare of $0.25. It was replaced in 1984 by the FreeBee, which was free to riders; its operations were funded through city parking revenues. In 1989, the City of Orlando purchased a vintage 1907 streetcar and renovated it in anticipation of developing a streetcar system. The Orlando Streetcar, dubbed OSCAR for short, never materialized as a system because the initial cost estimates skyrocketed from $12 million to $50 million.1 Consequently, the City of Orlando and LYNX switched plans from rail to a bus-based alternative, and what resulted was LYMMO. When LYMMO opened in 1997, it was characterized by many features that distinguished it from the rest of LYNX’s buses—a separate lane with extensive signage and pavement painting, specialized paving and hardscape, extensive landscaping, specialized paint scheme and shelters, a separate logo for signs and stops, free service, and very short headways.
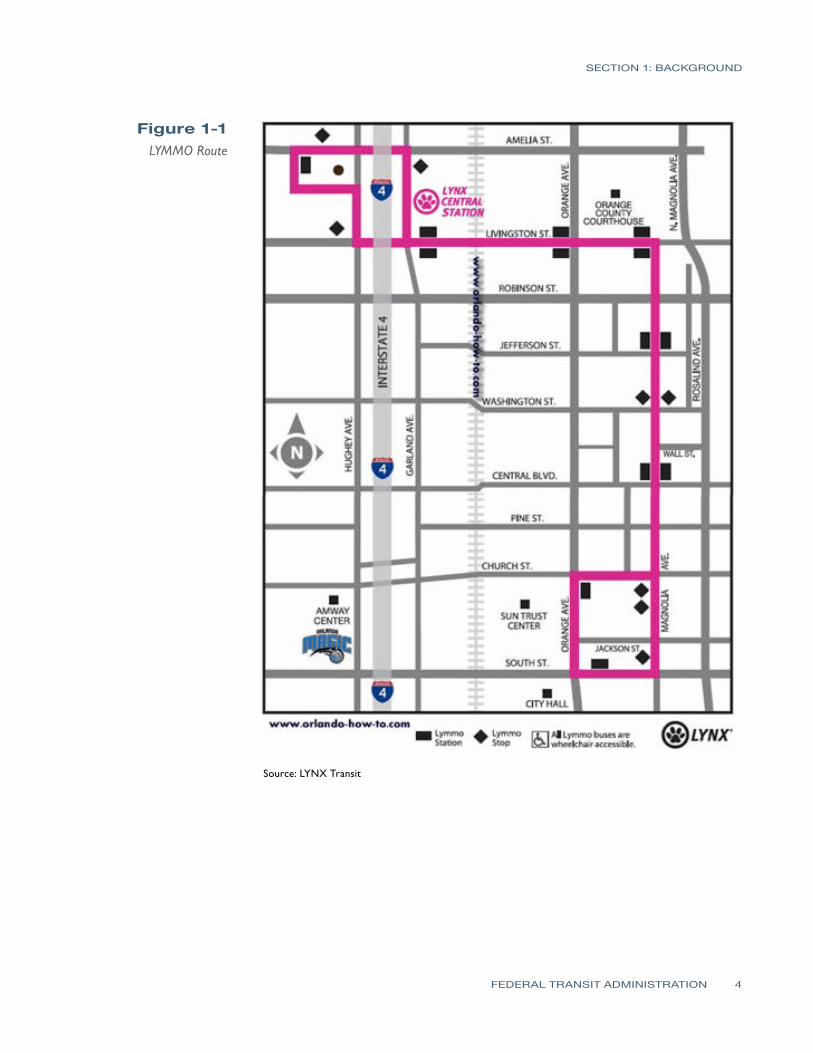
LYMMO operates in a dedicated bus lane on a 2½-mile loop. A map of the route is shown in Figure 1-1. There are 13 stations and 8 signed stops, and service is every 5 minutes throughout most of the day and every 10 minutes in the evenings. LYMMO operates 185 trips (loops) Monday–Thursday, 200 trips Friday, 85 trips Saturday, and 65 trips Sunday, with service hours of 6:00 AM to 10:00 PM Monday–Thursday, 6:00 AM to 12:00 midnight Friday, 10:00 AM to 12:00 midnight Saturday, and 10:00 AM to 10:00 PM Sunday. The LYMMO fleet consists of nine 35-foot hybrid electric Gillig buses.
1 “Oscar, The Electric Streetcar that came from Brazil,” Orlando Sentinel, August 17, 1997, http://articles.orlandosentinel.com/1997-08-17/news/9708150220_1_streetcardowntown-orlando-oscar.
FEDERAL TRANSIT ADMINISTRATION 3
SECTION 1: BACKGROUND
Figure 1-1 LYMMO Route
Source: LYNX Transit
FEDERAL TRANSIT ADMINISTRATION 4

SECTION
2
Operational Expenses
Revenue for the operations and maintenance of LYMMO comes from the City of Orlando’s Parking and Enterprise Fund. The operations and maintenance (O&M) costs of LYMMO have remained steady over the years, at about $1.2 million annually. However, since ridership began falling in 2010, O&M costs per passenger trip have been rising. Although LYMMO’s annual O&M cost has risen PM 2 percent between 1998 (the first full year of operation) and 2012, the cost per passenger trip has risen 30 percent.
Table 2-1 LYMMO Operational
Costs
1998 $1,209,867 1,137,938 $1.06
1999 $1,237,389 1,135,736 $1.09
2000 $1,076,318 1,134,275 $0.95
2001 $1,221,121 1,068,781 $1.14
2002 $1,113,535 1,055,589 $1.05
2003 $1,089,135 1,118,268 $0.97
2004 $1,207,562 1,041,093 $1.16
2005 $1,366,136 1,184,090 $1.15
2006 $1,231,434 1,198,417 $1.03
2007 $1,267,583 1,170,189 $1.08
2008 $1,181,126 1,152,670 $1.02
2009 $1,150,674 1,256,074 $0.92
2010 $1,192,358 1,190,029 $1.00
2011 $1,283,248 950,941 $1.35
2012 $1,233,671 894,340 $1.38
Nevertheless, the operational expense per passenger trip on LYMMO is low compared to the operational expense per passenger trip system-wide on LYNX. Using the most recent data from the National Transit Database (NTD)(2011), the cost per passenger trip system-wide on LYNX was $3.12 (see Table 2-2).
Table 2-2 Operational Cost
Comparison, 2011
Service Total O&M Cost Cost per Trip
LYMMO $1,283,248 $1.35
LYNX System-wide $84,196,278 $3.12
Note: System-wide data does not include demand response or vanpool.
Year Total O&M Cost Passenger Trips O&M Cost per Passenger Trip
FEDERAL TRANSIT ADMINISTRATION 5

SECTION
3
Ridership
At the time of the 2003 evaluation, average weekday ridership on LYMMO was just over 4,000 riders. It peaked in 2009 at just over 4,300 riders. Ridership began to drop in 2010. Average weekday ridership in 2012 was 3,017 riders, which is lower than what it was in 1997. Table 3-1 shows the average weekday ridership from 1997–2012. Figure 3-1 shows the same data in graph form. A more detailed table of the ridership (average weekday, Saturday, Sunday, and monthly totals) can be found in Appendix A.
Table 3-1 LYMMO Average Weekday Riders,
1997–2012
Figure 3-1 LYMMO Average Weekday Riders,
1997–2012
Year Average Weekday Riders
1997 3,091
1998 4,092
1999 4,112
2000 4,101
2001 3,876
2002 3,869
2003 4,097
2004 3,763
2005 4,192
2006 4,246
2007 4,096
2008 4,261
2009 4,352
2010 4,067
2011 3,228
2012 3,017
FEDERAL TRANSIT ADMINISTRATION 6

SECTION 3: RIDERSHIP
The drop in ridership in 2004 was likely due to service interruptions caused by the construction of LYNX Central Station. In regards to the drop in ridership that has occurred since 2010, there are two probable contributing factors. In 2010, the Orange County Courthouse stopped paying for juror parking at the CentroPlex garage; jurors now park in the garage immediately adjacent to the courthouse. This led to a drop in the number of juror trips on LYMMO. The latest passenger survey data confirms this. In the 2001 survey, nine percent of LYMMO riders said their trip purpose was jury duty; in the 2012 survey, it was 1 percent. The other change that occurred in 2010 was the closing of the Amway Arena, the home of the Orlando Magic NBA basketball team, and the subsequent opening of the Amway Center further to the south and away from LYMMO’s route. This resulted in a loss of riders for special events. It should be pointed out that the new East-West LYMMO, which is expected to open in the fall of 2013, will provide service to Amway Center.
LYMMO ridership was compared to system-wide ridership on all of LYNX’s directly-operated bus service to see if the trends were the same or different. Figure 3-2 compares the percent change in annual riders since the time of the last evaluation in 2003 to 2011. The figure shows that the trends are not the same. Although LYNX registered percentage gains each year except one (2009), LYMMO registered percentage gains in only four of the nine years. In the 2011, the number of annual riders on LYNX system-wide was up 9 percent and on LYMMO it was down 20 percent.
Figure 3-2 Percent Change in
Annual Riders, LYMMO vs. LYNX
Despite the drop in ridership, LYMMO still ranks in the top five of LYNX’s fixed routes. According to LYNX’s 2013 Transit Development Plan (TDP), LYMMO had the 5th highest ridership of 55 fixed-route links.
FEDERAL TRANSIT ADMINISTRATION 7

SECTION 3: RIDERSHIP
Table 3-2 LYNX Fixed-Route
Performance Statistics
Rank Link # Description Total Passengers, FY 2011
1 8 W. Oak Ridge Road/International Drive 2,353,273
2 4 S. US 441/Kissimmee 1,919,355
3 41 SR 436 Crosstown 1,829,884
4 37 Park Promenade Plaza/Florida Mall 1,076,565
5 31 LYMMO 1,016,207
Source: LYNX Transit Development Plan 2013–2022
Although classified as a BRT system, LYMMO is more comparable to a downtown streetcar circulator. Table 3-3 compares LYMMO to several rail streetcars in the U.S. that are of similar length. LYMMO carried more passengers in 2011 than three of the four streetcar systems and had a lower cost per trip than all four rail streetcar systems.
Table 3-3 Comparison of LYMMO to Rail Streetcar Systems
Service Annual
Passenger Trips
Annual Operating Expense
Cost per Trip
Vehicles Available for Max Service
Vehicles Operating in Max Service
Route Miles
LYMMO 950,941 $1,283,248 $1.35 9 7 2.5
Memphis Streetcar 1,086,125 $4,796,905 $4.42 16 12 4.7
Seattle Streetcar 714,461 $2,396,642 $3.35 3 3 2.5
Tampa Streetcar 431,425 $2,209,652 $5.12 10 4 2.7
Kenosha Streetcar 43,249 $443,489 $10.25 5 1 1.7
Source: National Transit Database 2011
FEDERAL TRANSIT ADMINISTRATION 8

SECTION
4
Boardings and Alightings
Figure 4-1 compares the geographic distribution of LYMMO’s boardings and alightings for 2003 and 2012. The green circles represent 2003 data, and the purple circles represent 2012. The same data are provided in tabular format in Appendix B. In 2003, the boardings and alightings were fairly evenly distributed along the route, and they generally dropped off in number once the bus was south of E. Central Boulevard. In 2012, LYNX Central Station and the stop at Magnolia Avenue and E. Central Boulevard were the top two boarding and alighting locations, with the former accounting for 27 percent of all boardings and alightings and the latter for 24 percent. Magnolia Avenue and E. Central Boulevard is the site of the Orange County Public Library and is also the stop with quickest access to many lunch-time establishments just two blocks west on S. Orange Avenue. The percentage of boardings and alightings at the CentroPlex Parking Garage dropped from 14 percent to 11 percent. The percentage of boardings and alightings at the Orange County Courthouse remained roughly the same at 12 percent. This may be an indicator that although fewer jurors are using LYMMO to get to the courthouse from the CentroPlex Garage, they are still using it during midday for lunch and errands.
FEDERAL TRANSIT ADMINISTRATION 9

SECTION 4: BOARDINGS AND ALIGHTINGS
Figure 4-1 LYMMO Boardings
and Alightings
FEDERAL TRANSIT ADMINISTRATION 10

SECTION
5
Employment Data
Employment was examined using U.S. Census Longitudinal Employer Household Dynamics (LEHD) datasets for 2002 and 2010. The year 2002 was used as the baseline because it is the oldest available dataset. For the analysis, LEHD job data were retrieved for all census blocks located within a ¼-mile buffer of the LYMMO route. This was done for both the 2002 and 2010 datasets. Table 5-1 shows the results broken down by North American Industry Classification System (NAICS) Code. In both 2002 and 2010, 70 percent of the jobs located within ¼ mile of LYMMO came from three industries: Public Administration; Professional, Scientific, and Technical Services; and Administrative/Support/ Waste Management/Remediation Services.
As shown in Table 5-1, there was an 18 percent drop in the total number of jobs between 2002 and 2010. Every industry category lost jobs except three. Arts, Entertainment, and Recreation increased 581 percent. Other Services (Except Public Administration) increased 102 percent, and Retail Trade increased 82 percent. These changes are shown graphically in Figures 5-1 and 5-2. The most notable area where the decrease in jobs occurred was around Lake Eola.
Table 5-1 Industries within ¼ Mile of LYMMO Route
Industry No. of Jobs, 2002 No. of Jobs, 2010 Percent Change
Utilities 1,358 1,314 -3%
Construction 151 119 -21%
Manufacturing 323 79 -76%
Wholesale Trade 396 273 -31%
Retail Trade 348 632 82%
Transportation and Warehousing 196 81 -59%
Information 1,509 961 -36%
Finance and Insurance 2,838 2,474 -13%
Real Estate and Rental and Leasing 1,369 729 -47%
Professional, Scientific, and Technical Services 8,265 7,474 -10%
Management of Companies and Enterprises 522 201 -61%
Administrative/Support/Waste Mgt/Remediation Svcs 7,773 3,681 -53%
Educational Services 376 278 -26%
Health Care and Social Assistance 854 734 -14%
Arts, Entertainment, and Recreation 58 395 581%
Accommodation and Food Services 2,293 1,807 -21%
Other Services (Except Public Administration) 340 687 102%
Public Administration 14,640 13,888 -5%
Total Jobs 43,609 35,807 -18%
FEDERAL TRANSIT ADMINISTRATION 11

SECTION 5: EMPLOYMENT DATA
Figure 5-1 Jobs within ¼ Mile of
LYMMO, 2002
FEDERAL TRANSIT ADMINISTRATION 12

SECTION 5: EMPLOYMENT DATA
Figure 5-2 Jobs within ¼ Mile of
LYMMO, 2010
The 18 percent drop in jobs located within ¼ mile of LYMMO contrasts with a 5 percent growth in jobs experienced in the Orlando Urbanized Area as a whole (see Table 5-2). Five percent growth over an eight-year period is fairly weak and reflects the economic recession that began in 2007. It appears that the economic recession hit jobs in the downtown core of Orlando more than the urbanized area as a whole. This likely had a negative impact on LYMMO ridership.
FEDERAL TRANSIT ADMINISTRATION 13

SECTION 5: EMPLOYMENT DATA
Table 5-2 Industries within Orlando Urbanized Area
Industry No. of Jobs, 2002 No. of Jobs, 2010 Percent Change
Agriculture, Forestry, Fishing and Hunting 4,111 2,885 -30%
Mining, Quarrying, and Oil and Gas Extraction 27 68 152%
Utilities 3,449 2,938 -15%
Construction 41,987 34,592 -18%
Manufacturing 43,778 32,420 -26%
Wholesale Trade 36,572 34,693 -5%
Retail Trade 81,654 85,646 5%
Transportation and Warehousing 26,748 24,666 -8%
Information 22,789 21,441 -6%
Finance and Insurance 29,647 30,112 2%
Real Estate and Rental and Leasing 18,952 22,611 19%
Professional, Scientific, and Technical Services 50,501 57,572 14%
Management of Companies and Enterprises 8,918 11,831 33%
Administrative/Support/Waste Mgt/Remediation Svcs 75,358 75,542 0%
Educational Services 51,132 52,419 3%
Health Care and Social Assistance 75,563 91,882 22%
Arts, Entertainment, and Recreation 61,703 62,713 2%
Accommodation and Food Services 81,141 101,424 25%
Other Services (Except Public Administration) 21,613 23,232 7%
Public Administration 28,622 33,803 18%
Total Jobs 764,265 802,490 5%
FEDERAL TRANSIT ADMINISTRATION 14

SECTION
6
Rider Survey
Table 6-1 Primary Trip Purpose
An on-board survey of LYMMO riders was conducted on Tuesday, November 27, and Wednesday, November 28, 2012. On the 27th, the survey was conducted in the afternoon from 1:30–5:30 PM; on the 28th, the survey was conducted in the morning from 7:30 AM to 1:30 PM. Five surveyors from the Center for Urban Transportation Research (CUTR) rode five of the buses and distributed the surveys to all passengers as they boarded; a total of 1, 011 surveys were returned. Total LYMMO ridership on November 27 was 2,745, and total LYMMO ridership on November 28 was 2,326 for a two-day average of 2,536 riders. Using that figure yielded a response rate of 39.9 percent. The margin of error in the survey is + 2.4 at the 95% confidence level. The questionnaire used for the survey can be found in Appendix B. The questionnaire was kept to six questions because the passengers board and alight over short distances. The questionnaire used many of the same questions from the December 2001 survey that was included in the 2003 evaluation report. In the tables that follow, the 2012 survey results are expressed both in percentage and absolute numbers. For the 2001 survey results, only the percentages were available. The results are shown in the order they appeared on the questionnaire.
What is the primary purpose of this trip today? A greater percentage of riders now use LYMMO for errands, lunch, and shopping compared to 2001 (41% in 2012 vs. 17% in 2001), and a smaller percentage use it to go to work (36% in 2012 vs. 52% in 2001). There also has been a drop in the percentage of riders using LYMMO to get to jury duty (1% 2012 vs. 9% in 2001). In 2001, the Orange County Courthouse validated the parking for jurors who used the CentroPlex parking garage at the north end of LYMMO’s route. Jurors would park their cars at the garage and ride LYMMO to the courthouse. The Orange County Courthouse stopped validating juror parking at the CentroPlex garage in 2010 when jurors were able to park at the newly-constructed Courthouse Garage.
Trip Purpose 2001 Survey 2012 Survey
Work 52% 36%
Lunch/shop/errands 17% 41%
Jury duty 9% 1%
Event at Arena 2% n/a
School n/a 4%
Library n/a 3%
Other 21% 15%
Results may not add to 100% due to rounding.
FEDERAL TRANSIT ADMINISTRATION 15

SECTION 6: CASE STUDY OF HILLSBOROUGH AREA REGIONAL TRANSIT (HART), TAMPA
How often do you ride LYMMO? In both 2001 and 2012, 54 percent of the riders said they used LYMMO at least twice a day. The percentage of riders who use it four or more times a day increased, and the percentage of first time riders decreased.
Table 6-2 Frequency of Use
Response 2001 Survey 2012 Survey
4 or more times per day 13% 21%
2 or 3 times per day 41% 33%
Once a day 10% 10%
A few times per week 15% 20%
A few times per month 8% 9%
A few times per year 7% 4%
This is my first time riding 8% 2%
Total 100% 100%
Table 6-3 Service Ratings
Results may not add to 100% due to rounding.
Please rate your satisfaction of the following aspects of LYMMO service. Riders in 2001 and 2012 were asked to rate several aspects of LYMMO service on a scale of 1 to 5, with 1 being very dissatisfied and 5 being very satisfied. Customer satisfaction was high in 2001 and remained high in 2012. It was not possible to conduct a statistical comparison of means between the two datasets since the 2001 raw survey data are no longer available.
Aspect of Service 2001 Survey Mean 2012 Survey Mean
Travel time 4.48 4.52
Reliability 4.47 4.50
Comfort 4.41 4.44
Safety 4.41 4.42
Overall satisfaction 4.45 4.49
What are your three favorite features of LYMMO? In the 2001 survey, the top three LYMMO features according to riders were the low-floor vehicles, the vehicle interior, and the electronic information at the stations. In the 2012 survey, the top three features were that it is free to ride, it is easy to use, and the service is frequent. The results could mean two things— either the riders do not think the vehicles are as nice as they used to be or they have simply become more focused on other features. It is unlikely that it is the former. In 2010, LYNX updated the LYMMO fleet with new 35-foot Gillig hybrid electric buses. These buses include a distinctive green and gray color scheme; an example is shown in Figure 6-1. It seems more likely that bus riders in 2012 are
FEDERAL TRANSIT ADMINISTRATION 16

SECTION 6: CASE STUDY OF HILLSBOROUGH AREA REGIONAL TRANSIT (HART), TAMPA
Table 6-4 Riders’ Favorite
Features of LYMMO, 2001 Survey
Table 6-5 Riders' Favorite
Features of LYMMO, 2012 Survey
Figure 6-1 35-Foot Gillig
Hybrid Bus
not as impressed with low-floor buses because they are more common now than they were in 2001; consequently, their attention has shifted to the quality of the service—namely, that LYMMO is free, easy to use, and frequent. Another reason for the change in response between 2001 and 2012 is that the stations no longer offer electronic information.
Feature Percent
Low-floor vehicles 35%
Vehicle interior 15%
Electronic info at stations 11%
Environmentally-friendly vehicles 7%
Feature of stops/stations 8%
Frequency of vehicles 6%
On-board video info displays 5%
It’s easy to use 4%
It’s free to ride 4%
Fast travel time 4%
Public art and system design 2%
Results may not add to 100% due to rounding.
Feature Frequency Percent
It’s free to ride 729 28%
It’s easy to use 582 23%
Frequent service 558 22%
Dedicated bus lane 330 13%
Station design 119 5%
Vehicle interior 118 5%
Low floor vehicles 88 3%
Station kiosks 44 2%
Results may not add to 100% due to rounding.
FEDERAL TRANSIT ADMINISTRATION 17

SECTION 6: CASE STUDY OF HILLSBOROUGH AREA REGIONAL TRANSIT (HART), TAMPA
Table 6-6 LYMMO has reduced congestion in down
town Orlando
Perceptions regarding LYMMO’s influence on downtown traffic congestion Riders in the 2012 survey were asked the extent to which they agreed or disagreed with the statement that LYMMO reduces congestion in downtown Orlando. While it does not answer whether LYMMO does, in fact, do this, it does measure rider perceptions. The results show that 76 percent do think that LYMMO has reduced congestion in downtown Orlando.
Strongly Agree Agree No Opinion Disagree Strongly
Disagree
405 42% 327 34% 189 20% 23 2% 14 2%
Perceptions regarding LYMMO’s influence on quality of life in downtown A total of 79 percent of the riders think LYMMO has made downtown Orlando a more attractive place to live and work.
Table 6-7 LYMMO has made
Downtown Orlando a more attractive place
to live/work
Table 6-8 Do you use any other
LYNX services? 2001 Survey
Strongly Agree Agree No Opinion Disagree Strongly
Disagree
431 46% 311 33% 166 18% 23 2% 7 1%
Use of other LYNX services In the 2001 survey, 54 percent of LYMMO riders said they did not use other LYNX services. In the 2012 survey, that percentage fell to 25 percent, meaning more riders today are using other LYNX services. The survey results are shown in Tables 6-8 and 6-9. LYNX offers more services now than it did in 2001, which may explain some of the change. For example, FastLink, NeighborLink, and KnightLYNX are all new services. FastLink is a limited stop service. NeighborLink is a flex service for riders in the less populated parts of LYNX’s service area. KnightLYNX is a weekend service around the University of Central Florida campus.
LYNX Service Percent
Local bus 41%
No, I don’t use other LYNX services 54%
A+ Link 2%
Special event services 2%
LYNX vanpool/schoolpool/carpool 1%
Total 100%
FEDERAL TRANSIT ADMINISTRATION 18

SECTION 6: CASE STUDY OF HILLSBOROUGH AREA REGIONAL TRANSIT (HART), TAMPA
Table 6-9 Do you use any other
LYNX services? 2012 Survey
Figure 6-2 LYNX Central Station
LYNX Service Frequency Percent
Local bus 595 49%
No, I don’t use other LYNX services 298 25%
FastLink 89 7%
Access LYNX (formerly A+ Link) 75 6%
Xpress bus 65 5%
NeighborLink 52 4%
KnightLYNX 20 2%
LYNX vanpool 11 1%
Total 1,205 100.0%
Results may not add to 100% due to rounding.
The percentage of LYMMO riders that said they also use LYNX local bus service increased from 2001 to 2012 (from 41% to 49%). A likely contributor is the LYNX Central Station, which was constructed in 2004. Prior to that, there was no direct connection between the old downtown bus depot and LYMMO. LYNX Central Station provides a direct connection to LYMMO, services nearly 30 bus routes, and is also a future station for the SunRail commuter train. A photo of Central Station is shown in Figure 6-2.
Source: Orlando Sentinel
FEDERAL TRANSIT ADMINISTRATION 19

SECTION
7
Employer Survey
A short six-question survey was mailed at the end of January 2013 to 711 employers in downtown Orlando using addresses provided by the City of Orlando. The employers were selected based on their location within a boundary of four streets: Colonial Drive on the north, Summerlin Avenue on the east, Gore Street on the south, and Parramore Avenue on the west. A map of these boundaries is shown in Figure 7-1.
Figure 7-1 LYMMO Employer
Survey Boundary
FEDERAL TRANSIT ADMINISTRATION 20

SECTION 7: EMPLOYER SURVEY
Table 7-1 Did your company
locate in downtown before or after LYMMO began
service?
Table 7-2 Was LYMMO a factor
in your company’s decision to locate and
remain downtown?
A copy of the employer survey can be found in Appendix C. It included questions about whether LYMMO was a factor in a company’s decision to locate and/or stay in downtown. It also asked business owners whether they thought LYMMO contributed to the economic development of downtown, made downtown a more attractive place to live and work, and improved mobility in downtown.
Unfortunately, the response was low. Of the 711 employers surveyed, only 34 (5%) responded. Therefore, the results cannot be considered statistically conclusive. The responses are provided only for illustrative purposes.
Influence of LYMMO on employers’ decision to locate and/or remain downtown The first three survey questions asked employers whether they located in downtown before or after LYMMO began service, whether LYMMO was a factor in their decision to locate downtown, and whether LYMMO is a factor in their decision to remain in downtown. The percentage of responding employers that located downtown prior to LYMMO starting was slightly higher than the percentage of employers that located after it began (53% vs.47%; see Table 7-1). Only 3 of the 34 companies (9%) said LYMMO was a factor in their decision to locate downtown. Interestingly, one of those three located in downtown before LYMMO began service; perhaps this employer located in downtown in anticipation of LYMMO opening. Five of the 34 companies (15%) responded that LYMMO is a factor in their decision to remain downtown.
Frequency Percent
Before LYMMO began 18 53%
After LYMMO began 16 47%
Question Response Frequency Percent
Factor locating downtown? Yes 3 9%
No 30 91%
Factor remaining downtown? Yes 5 15%
No 28 85%
FEDERAL TRANSIT ADMINISTRATION 21

SECTION 7: EMPLOYER SURVEY
Employer perceptions of LYMMO Employers were presented with three statements regarding LYMMO and were asked to register their level of agreement or disagreement with them. The statements pertained to LYMMO’s contribution toward economic development, quality of life, and mobility in downtown Orlando. A majority of the employers agreed or strongly agreed that LYMMO has contributed to the economic development of downtown (53%) and made downtown a more attractive place to live and work (59%). There was even wider agreement that LYMMO has improved mobility in downtown (73%). Nevertheless, 6 of the 34 employers (18%) disagreed or strongly disagreed with these statements.
Table 7-3 Employer Perceptions of LYMMO's Impact
Statement Strongly
Agree Agree No Opinion Disagree Strongly Disagree
N % N % N % N % N %
LYMMO has contributed to the economic development of downtown. 7 21% 11 32% 10 29% 4 12% 2 6%
LYMMO has made downtown a more attractive place to live and work. 8 24% 12 35% 8 24% 4 12% 2 6%
LYMMO has improved mobility in downtown. 13 38% 12 35% 3 9% 4 12% 2 6%
Employer demographics The survey asked how many employees were located at the mailed location and what type of business it was. Table 7-4 shows that more than half (59%) of the employers that responded were small businesses, with only 1–9 employees at that location. About one-third (33%) were consulting or engineering firms; another 15 percent were law firms.
Table 7-4 How many employees
are at this location?
Number of Employees Frequency Percent
1–9 20 59%
10–19 4 12%
20–99 8 24%
100–499 2 6%
FEDERAL TRANSIT ADMINISTRATION 22

SECTION 7: EMPLOYER SURVEY
Table 7-5 Which best describes
your business?
Business Type Frequency Percent
Consulting 6 18%
Engineering/Consulting 5 15%
Law Office 5 15%
Real Estate 4 12%
Arts/Entertainment 2 6%
Restaurant 2 6%
Other 2 6%
Government 1 3%
Non Profit 1 3%
Financial 1 3%
Insurance 1 3%
IT Services 1 3%
Software 1 3%
Staffing 1 3%
Total 33 100%
FEDERAL TRANSIT ADMINISTRATION 23

SECTION
8
Future Plans
LYNX plans to expand its LYMMO service and has selected three new corridors. Two of the new corridors are shown in red and yellow in Figure 8-1; the existing LYMMO route is shown in purple.
The first new corridor is the East/West LYMMO, shown in red. Its route will be 3.7 miles and will have 7 stations and 12 signed stops. Service frequency will be every 10 minutes during the peak and every 15 minutes during the off-peak. Unlike the existing LYMMO, the East/West LYMMO will provide service only in a single direction and will operate in a combination of mixed traffic and dedicated lanes with conditional transit signal priority (TSP) at 22 intersections. The estimated capital cost is $9.9 million (2010 dollars), and the estimated operating cost is $1 million annually.
Figure 8-1 New LYMMO Corridors
FEDERAL TRANSIT ADMINISTRATION 24

SECTION 8: FUTURE PLANS
The second new corridor is the Parramore/Creative Village LYMMO, shown in yellow. Basically, this is a 2.53-mile extension of the existing LYMMO line. It will operate in exclusive bus lanes and have 4 stations and 3 signed stops. One station will be located under I-4 and be a transfer point to the East-West BRT line and provide access to the Amway Center. The Parramore BRT will also provide service to the planned Creative Village located on the site of the former Amway Arena. Creative Village is a planned mixed-use development that includes 500 units of mixed-income housing, 400,000 square feet of office space, 250,000 square feet of education space, and associated community and commercial facilities. Other destinations to be served include Florida A&M College of Law, the State of Florida Office Complex, the U.S. Courthouse, and LYNX Central Station. The estimated capital cost is $16 million (2011 dollars). The Parramore/ Creative Village LYMMO will intersect with the East/West LYMMO.
Both of these projects are expected to open in spring 2014. The new LYMMO lines and the existing LYMMO will connect with the SunRail commuter rail (shown in orange) that is anticipated to open in early 2014.
The third new LYMMO corridor (not shown) is a North/South BRT route that will provide service between Florida Hospital and the Orlando Regional Medical Center. It is basically an extension of the first LYMMO, connecting both hospitals and key neighborhoods adjacent to the downtown core. However, this corridor project does not currently have funding for operations or final design. The City, LYNX, and MetroPlan Orlando (the Metropolitan Planning Organization) adopted the North and South alignments as Locally Preferred Alternatives (LPA). Preliminary design is beginning on the South LPA, and LYNX is working with the City and the Florida Department of Transportation (FDOT) to begin establishing dedicated right-of-way and station areas at key locations. The South alignment is listed as the state’s first Strategic Intermodal System (SIS) connector facility.
FEDERAL TRANSIT ADMINISTRATION 25

APPENDIX
A
LYMMO Ridership Data August 1997–December 2012
Month Avg. Weekday Avg. Saturday Avg. Sunday Total Month
Aug-97 2,660 874 450 61,150
Sep-97 2,627 772 628 61,384
Oct-97 3,260 1,029 640 81,657
Nov-97 3,406 1,067 711 74,310
Dec-97 3,502 1,063 505 83,810
Jan-98 3,693 1,134 583 86,130
Feb-98 4,140 1,197 560 89,833
Mar-98 4,204 1,266 845 101,772
Apr-98 4,427 1,444 607 105,600
May-98 3,998 1,028 537 88,328
Jun-98 4,079 795 433 94,657
Jul-98 4,051 927 651 99,213
Aug-98 4,359 740 452 97,502
Sep-98 4,200 1,009 556 95,009
Oct-98 4,439 1,392 912 108,276
Nov-98 3,978 1,031 747 88,162
Dec-98 3,530 850 481 83,456
Jan-99 4,155 1,218 532 92,384
Feb-99 4,428 1,368 876 97,536
Mar-99 4,509 1,316 962 112,825
Apr-99 4,418 1,333 774 105,627
May-99 4,154 803 518 90,197
Jun-99 4,044 1,073 460 95,104
Jul-99 3,802 855 468 89,778
Aug-99 4,133 827 475 96,600
Sep-99 4,028 805 404 85,795
Oct-99 4,071 703 506 91,537
Nov-99 4,060 866 659 92,007
Dec-99 3,538 873 472 86,346
Jan-00 4,057 1,097 619 93,295
Feb-00 4,398 1,099 610 99,197
Mar-00 4,335 1,556 753 108,944
Apr-00 4,192 1,229 630 93,127
May-00 4,078 771 597 95,783
Jun-00 4,174 769 430 96,631
Jul-00 3,877 856 615 85,501
FEDERAL TRANSIT ADMINISTRATION 26

APPENDIX A: LYMMO RIDERSHIP DATA, AUGUST 1997–DECEMBER 2012
Month Avg. Weekday Avg. Saturday Avg. Sunday Total Month
Aug-00 4,182 692 771 102,034
Sep-00 4,332 944 436 93,548
Oct-00 4,147 955 720 98,640
Nov-00 4,028 1,012 683 92,042
Dec-00 3,407 911 472 75,533
Jan-01 3,735 1,281 500 89,790
Feb-01 3,976 1,145 757 87,118
Mar-01 3,810 1,251 658 92,709
Apr-01 3,984 1,360 679 92,498
May-01 3,800 1,007 530 90,267
Jun-01 3,896 656 465 86,953
Jul-01 3,771 794 601 85,977
Aug-01 3,949 767 540 96,056
Sep-01 4,138 757 490 85,340
Oct-01 4,183 750 460 101,046
Nov-01 3,843 1,044 420 86,980
Dec-01 3,427 649 378 74,047
Jan-02 3,740 924 482 88,393
Feb-02 3,890 853 539 83,365
Mar-02 3,753 747 476 84,921
Apr-02 3,997 765 496 92,968
May-02 3,912 882 499 92,081
Jun-02 3,632 744 438 78,540
Jul-02 3,447 765 595 81,857
Aug-02 4,080 516 577 94,640
Sep-02 4,137 709 439 88,213
Oct-02 4,215 766 445 101,793
Nov-02 4,013 825 584 87,311
Dec-02 3,616 707 458 81,507
Jan-03 3,757 785 411 83,857
Feb-03 4,360 1,036 651 93,946
Mar-03 4,374 1,063 544 99,896
Apr-03 3,972 828 641 93,262
May-03 4,319 1,066 651 99,285
Jun-03 4,184 867 568 94,171
Jul-03 4,231 782 642 99,408
Aug-03 4,182 822 541 94,631
Sep-03 4,136 829 511 92,732
Oct-03 4,183 819 641 102,052
Nov-03 3,999 877 455 83,104
Dec-03 3,472 848 430 81,924
FEDERAL TRANSIT ADMINISTRATION 27

APPENDIX A: LYMMO RIDERSHIP DATA, AUGUST 1997–DECEMBER 2012
Month Avg. Weekday Avg. Saturday Avg. Sunday Total Month
Jan-04 3,796 834 482 86,294
Feb-04 3,870 760 587 83,373
Mar-04 3,859 991 800 95,922
Apr-04 3,685 814 487 86,262
May-04 4,064 785 609 88,849
Jun-04 3,897 735 493 90,653
Jul-04 3,590 703 523 84,594
Aug-04 3,354 523 402 76,966
Sep-04 3,446 590 498 75,624
Oct-04 3,908 732 609 88,774
Nov-04 3,978 1,054 717 91,349
Dec-04 3,713 1,357 591 92,433
Jan-05 4,182 1,623 745 98,789
Feb-05 4,544 1,440 821 99,916
Mar-05 4,089 1,539 854 103,613
Apr-05 4,595 1,294 867 106,431
May-05 4,201 1,315 651 97,391
Jun-05 4,065 1,093 679 96,514
Jul-05 4,234 1,205 836 95,721
Aug-05 4,433 1,373 763 110,496
Sep-05 4,517 1,447 756 104,413
Oct-05 4,176 1,469 738 98,726
Nov-05 4,178 1,562 719 97,582
Dec-05 3,091 895 676 74,498
Jan-06 3,720 1,387 713 90,962
Feb-06 4,264 1,181 809 93,232
Mar-06 4,145 1,497 870 104,808
Apr-06 4,298 1,377 820 96,949
May-06 4,254 1,116 823 102,166
Jun-06 4,256 1,228 770 101,618
Jul-06 4,291 1,299 891 97,651
Aug-06 4,523 1,135 824 111,862
Sep-06 4,689 1,206 802 103,823
Oct-06 3,822 1,112 753 92,308
Nov-06 4,339 1,847 862 102,808
Dec-06 4,348 1,824 691 100,230
Jan-07 4,154 1,634 917 102,502
Feb-07 4,089 2,505 861 95,244
Mar-07 4,053 1,326 807 99,012
Apr-07 3,897 1,780 862 93,260
May-07 3,933 1,091 667 94,228
FEDERAL TRANSIT ADMINISTRATION 28

APPENDIX A: LYMMO RIDERSHIP DATA, AUGUST 1997–DECEMBER 2012
Month Avg. Weekday Avg. Saturday Avg. Sunday Total Month
Jun-07 3,800 984 704 87,540
Jul-07 3,756 1,158 818 88,422
Aug-07 4,384 1,139 1,023 109,469
Sep-07 4,554 1,341 989 99,154
Oct-07 4,579 1,391 979 114,798
Nov-07 3,958 1,686 964 94,685
Dec-07 3,994 1,349 873 91,875
Jan-08 7,164 3,055 2,166 99,272
Feb-08 4,279 1,144 958 98,266
Mar-08 4,283 1,791 1,015 103,967
Apr-08 4,251 1,267 1,000 102,589
May-08 4,125 1,495 822 98,204
Jun-08 3,905 1,148 847 90,840
Jul-08 3,933 1,059 920 98,374
Aug-08 3,469 1,097 972 83,201
Sep-08 3,863 1,264 1,033 94,166
Oct-08 4,235 1,141 817 105,234
Nov-08 3,948 1,519 850 87,718
Dec-08 3,674 1,175 1,063 90,839
Jan-09 4,112 1,199 829 96,493
Feb-09 4,734 1,222 1,157 104,201
Mar-09 4,448 1,318 1,139 108,814
Apr-09 4,869 1,219 1,205 116,807
May-09 5,051 1,631 1,324 117,118
Jun-09 4,433 1,634 1,726 110,958
Jul-09 4,285 1,260 1,019 107,677
Aug-09 4,636 1,849 1,464 113,928
Sep-09 4,083 1,112 782 97,397
Oct-09 4,382 1,137 836 105,428
Nov-09 3,742 1,258 787 87,542
Dec-09 3,445 1,674 942 89,711
Jan-10 4,111 1,965 999 98,032
Feb-10 3,546 1,442 1,376 82,188
Mar-10 3,985 2,524 1,710 108,593
Apr-10 4,515 2,416 1,374 114,484
May-10 4,486 2,109 999 106,254
Jun-10 3,971 1,853 780 97,892
Jul-10 3,969 1,997 987 101,257
Aug-10 4,036 1,394 768 98,219
Sep-10 3,925 859 1,050 91,112
Oct-10 4,404 1,439 882 104,083
FEDERAL TRANSIT ADMINISTRATION 29

APPENDIX A: LYMMO RIDERSHIP DATA, AUGUST 1997–DECEMBER 2012
Month Avg. Weekday Avg. Saturday Avg. Sunday Total Month
Nov-10 4,509 1,030 868 103,140
Dec-10 3,348 1,248 807 84,775
Jan-11 3,267 1,386 942 79,809
Feb-11 3,178 1,313 956 72,642
Mar-11 3,201 1,289 908 82,411
Apr-11 3,412 1,311 972 82,094
May-11 3,352 1,277 1,005 81,526
Jun-11 3,324 1,441 1,115 83,348
Jul-11 3,230 1,352 1,195 78,536
Aug-11 3,289 1,292 1,187 85,554
Sep-11 3,241 1,327 986 78,289
Oct-11 3,333 1,250 974 81,115
Nov-11 3,096 1,272 977 74,997
Dec-11 2,818 1,093 792 70,620
Jan-12 2,890 1,281 896 73,192
Feb-12 3,045 1,325 904 72,865
Mar-12 2,837 1,209 915 72,108
Apr-12 3,026 1,115 995 72,986
May-12 3,206 1,174 864 79,549
Jun-12 3,073 1,307 903 74,688
Jul-12 3,211 1,279 1,151 79,452
Aug-12 3,389 1,344 980 87,248
Sep-12 3,246 1,337 1,076 74,803
Oct-12 3,026 1,641 779 79,272
Nov-12 2,738 1,405 804 67,129
Dec-12 2,517 1,113 856 61,048
FEDERAL TRANSIT ADMINISTRATION 30

APPENDIX
B
LYMMO Boarding and Alighting Data 2003 and 2012
Destination Stop Number Stop Location
2003 2012
Total On/ Off Percent Total
On/Off Percent
CentroPlex Garage 6316 400 AMELIA ST 892 6% 838 11%
CentroPlex Garage 7196 400 HUGHEY AVE AND LIVING 1,193 8% 20 0%
LYNX Central Station 7197 100 LIVINGSTON ST AND N G n/a n/a 1,048 14%
LYNX Central Station 7198 100 LIVINGSTON ST AND N G 1,181 7% 905 12%
LYNX Central Station 7199 455 N GARLAND AVE AND AME 1,166 7% 49 1%
Bank of America 6299 LIVINGSTON ST AND ORANGE 1,184 7% 108 1%
Bank of America 6311 1 LIVINGSTON ST AND ORANG 1,131 7% 97 1%
Orange County Courthouse 5887 1 LIVINGSTON ST AND MAGNO 986 6% 439 6%
Orange County Courthouse 6298 LIVINGSTON ST AND ORANGE 1,135 7% 482 6%
St. Luke & St. James Cathedrals 6300 200 MAGNOLIA AVE AND JEFF 980 6% 302 4%
St. Luke & St. James Cathedrals 6301 200 MAGNOLIA AVE AND JEFF 872 6% 310 4%
Comerica Bank 6302 100 MAGNOLIA AVE AND WASH 915 6% 103 1%
Comerica Bank 6303 100 MAGNOLIA AVE AND WASH 874 6% 87 1%
Orange Public Library 6304 MAGNOLIA AVE AND CENTRAL 471 3% 911 12%
Orange Public Library 6305 MAGNOLIA AVE AND CENTRAL 841 5% 911 12%
Seaside Bank 6306 200 MAGNOLIA AVE AND CHUR 397 3% 142 2%
Seaside Bank 6307 CHURCH ST AND MAGNOLIA AV 462 3% 55 1%
First United Methodist 6308 300 MAGNOLIA AVE AND SOUT 405 3% 69 1%
Grand Bohemian Hotel 6309 SOUTH ST AND ORANGE AVE 368 2% 360 5%
Seaside Bank 6310 300 ORANGE AVE AND CHURCH 362 2% 454 6%
TOTAL ON/OFFS 15,815 100% 7,690 100%
FEDERAL TRANSIT ADMINISTRATION 31

APPENDIX
FEDERAL TRANSIT ADMINISTRATION 32
C
LYMMO Rider Survey 2013

APPENDIX
FEDERAL TRANSIT ADMINISTRATION 33
D
Employer Survey 2012

APPENDIX D: EMPLOYER SURVEY, 2012
1. Thet.rmmob-s1•Hl'VfuJn August 1097. Old your<~pariy ktcatt in downtown"'°" or after th•t d1M? 0 ,B<fo<e 0 ,Aftf•
2. WastheLYfllmO•f•<torinyourcontpany'tdeddon toloc.atedowntownl o,v~ D t'-o
l. I• the Lymmo • bctar in your company's decision to remain downtown? 0 1Yti 0 J"o 4. How much would rou agree cw dingr11e with thefolowin9 sutemenbl
'=t' ,,,,~ ~·~f' = :.=:=!!.~~:!!t~ o. o. o. 0, o,
o. o. o. o. 0. 0, o. o. 0, 0,
S. How many employrees .,e •t this location?
O .•-" 0 ,•"•9 0 ,Zo<l'I O .•oo-·1w 0,nw.~ 6. Which bat d..atba yourbvsi"""?
0 Nt\<t'.Jt"llWlmtfll Q.~11 0 &.••ln<J o ....... 0 1d-..i1J1 ri~O!TM o.c ... <IAI... o ......... O ,ll1!1'Ml'll1hljVNd'tlll\:DJ:4 O, tWl<1"u~
o -~ ... Or.Rt.ilt-s••~ 0 uflnl4 ... •• ·~ o .... ... 010thio1~--
FEDERAL TRANSIT ADMINISTRATION 34

U.S. Department of Transportation Federal Transit Administration
East Building 1200 New Jersey Avenue, SE
Washington, DC 20590 http://www.fta.dot.gov/research