lut_climate finance and carbon markets_lecture 6_kahra_110216
TRANSCRIPT

LECTURE 6. EMERGING CARBON
MARKETS, CLIMATE FINANCE AND
THE NEW CLIMATE AGREEMENT
Matti Kahra, Senior Officer, Carbon Markets
Ministry for Foreign Affairs of Finland
11.2.2016

Outline of the lecture
• Before We Begin: What is Carbon Pricing?
• Part 1: Life in a Top-Down World. Brief History of
the UNFCCC and its Kyoto Protocol
• Part 2: The Paris Agreement and Carbon Markets
• Part 3: Life in a Bottom-Up World. Carbon Pricing
systems Around The World
• Part 4: Future Global Carbon Market?
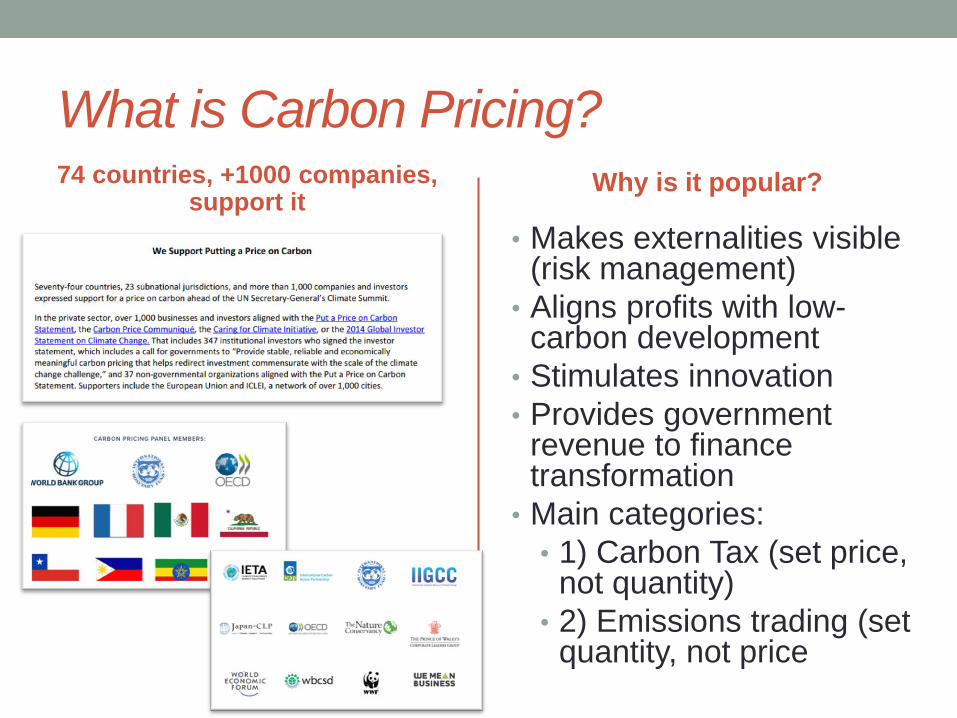
What is Carbon Pricing? 74 countries, +1000 companies,
support it
• Makes externalities visible (risk management)
• Aligns profits with low-carbon development
• Stimulates innovation
• Provides government revenue to finance transformation
• Main categories:
• 1) Carbon Tax (set price, not quantity)
• 2) Emissions trading (set quantity, not price
Why is it popular?

Part 1: Brief history of UNFCCC and its
Kyoto Protocol
1992 UNFCCC adopted
1994 UNFCCC in force
1997 Kyoto Protocol is
adopted
2001 Marrakech
Accords (KP rules)
2005 EU ETS
launch
2006 CDM launch
2008 Kyoto CP1 starts / JI
launch
2009 Copenhagen
COP-15
2012 Kyoto CP1 ends
2013 Kyoto CP2 starts
2015 Paris Agreement is
adopted
2020 Kyoto CP2 ends
2020 Paris Agreement
in force 2025 2030... ...2050

Carbon Market Instruments under Kyoto
• 1. International Emissions
Trading
• Exchange of units between
industrialized countries that have
a GHG reduction target (Assigned
Amount Unit, AAU)
• 2. Clean Development
Mechanism
• A project between an industrialized
country with a GHG reduction target
AND a developing country without
target (Certified Emission Reduction,
CER)
• 3. Joint Implementation
• A project between two
industrialized countries that have
a GHG reduction target (Emissions
Reduction Unit, ERU)
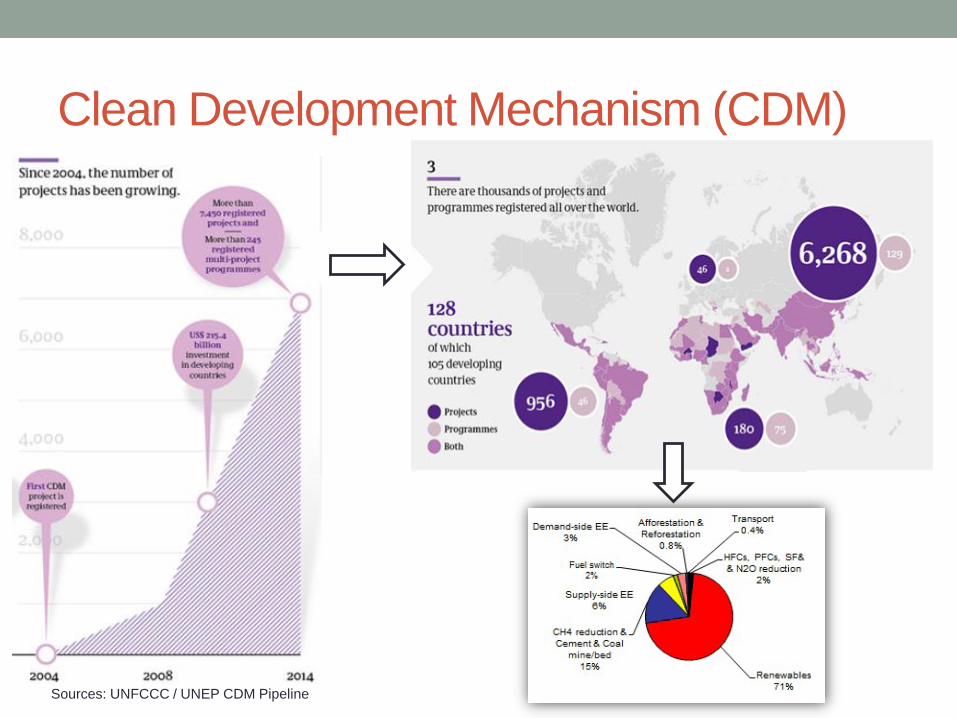
Clean Development Mechanism (CDM)
Sources: UNFCCC / UNEP CDM Pipeline

CDM Institutions

Joint Implementation (JI)
• JI less active than CDM
• Critized for lack of transparency
and weak additionality
• SEI: 80 % units with ”low or
questionable” environmental
integrity (2015)
Sources: World Bank and Carbon Market Watch

Market situation and outlook is depressed
Key reasons:
• 1. Lack of demand
• 2. Uncertainty of
future, Kyoto will
end in 2020
• 3. Complexity and
slow progress in
negotiations
• 4. Costs and
scalability issues

Finnish Carbon Market Programs
Fnland has been an active partner in carbon markets from the start
• Test Programme from 2000 to 2006
• Purchase Programme 2006 ->
• 2008 - 2012 CP1 Procurement Programme -> 6 Mt CERs
• 2013 - 2020 CP2 Procurement Programme -> 4-5 Mt CERs
• Current portfolio 33 M USD, two projects and three carbon funds
Developing new carbon market instruments:
• UNFCCC negotiations
• World Bank ”Partnership for Market Readiness” and Asian
Development Bank ”Carbon Market Program”

Part 1: Conclusions
• UNFCCC+Kyoto Protocol – many years of very difficult
negotiations (from optimism to pessimism)
• A top-down model was (too?) ambitious in its approach
and problems emerged quickly
• Compliance is imperfect since there is no way to impose and
enforce sovereign states (through international legislation)
• sovereign states will often act to protect the national self-interest
• External factors were not aligned at the time
• But overall Kyoto was an important test for the limits
of cooperation, it acted as a catalyst for climate action
(e.g. creation of global carbon markets)

Part 2: The Paris Agreement
• is universal, legally binding and durable
• sets ambitious goals on limiting warming to ”well below 2 C” and ”pursue efforts to limit to [...] 1,5 C”
• Peaking as soon as possible and net-zero emissions after 2050
• ratchet mechanism (five year interval) to evaluate and increase mitigation ambition
• Building blocks for cooperation (including trade with units), mentions carbon pricing
• ”This agreement
represents the best
chance we have to
save the one planet
that we’ve got.” –
Barack Obama

Practically all countries have targets to
reduce emissions...
Source: Carbon Brief

Country targets are a good start but more
ambition is needed

Targets are different...
Source: IETA

...but majority will use carbon markets
Source: IETA
Carbon Markets in the Paris Agreement
Article 6 of the Paris Agreement
• Negotiated at the very end, one of the final sticking points
• Has FOUR central elements:
• 1. voluntary cooperation between Parties as a part of
the implementation of mitigation targets (NDCs)
• 2. transfer of ”mitigation outcomes” (i.e. units) between
countries
• 3. Establishment of a ”Sustainable Development
Mechanism”
• 4. Definition of a ”Framework for non-market
approaches”
Carbon Markets in the Paris Agreement
Element No.1: ”voluntary cooperation between
Parties as a part of the implementation of
mitigation targets (NDCs)”
• covers all forms of cooperation between Parties
• ”Recognizes” it takes place - no oversight from
UNFCCC
• Sets out principles of ”higher ambition”,
”environmental integrity”, ”avoidance of double
counting” etc.
but does not define them!

Carbon Markets in the Paris Agreement
Element No.2: transfer of ”mitigation outcomes” i.e. units
between countries
• 100 % voluntary and based on agreement between two
countries, covers all outcomes which reduce emissions
• Applies only to international transfers
• ”Internationally Transferred Mitigation Outcome” is NOT a
unit (but could become one in the future)
• ”Shall be consistent with guidance” from UNFCCC
• Open questions: how to verify, track and account for
transfers to ensure ”avoidance of double counting”
• How to ensure the quality of units and a functioning
market for them?

Carbon Markets in the Paris Agreement
Element No.3: Establishment of a ”Sustainable
Development Mechanism”
• Hybrid of CDM+JI (projects in other countries with
mitigation target)
• To deliver overall mitigation in global emissions
• More than offsetting!
• To promote mitigation and foster sustainable development
• Can be used by ALL countries and public and private
entities
• Many types of approaches can be used

Carbon Markets in the Paris Agreement
Element No. 4: definition of a ”Framework for non-
market approaches”
• Mainly to appease those with ideological
opposition to markets
• What will this mean in practice? How will it be
operationalized?
• Overlaps with negotiations on adaptation,
finance, technology transfer etc.

Part 2: Conclusions
• Paris was a breakthrough and a small miracle considering
the history and complexity of the negotiations
• Countries´ emission reduction targets (NDCs) come in
many shapes and sizes
• Bottom-up development means that there will be a
heterogenous system in the future
• Positive that it enables increased cooperation in many
ways (including on carbon markets)
• Securing demand, predictability and giving confidence to
the markets is key!

Part 3: Carbon Pricing Systems Around
the World
• Since 2012:
• Number of systems has
doubled
• Emission coverage has
tripled
• Fast growth in the
Americas and Asia
• Price range 1 – 130 USD
• Revenue collected in
2014 - 15 billion USD
Source: World Bank ”State and Trends of Carbon Pricing 2015

Part 3: Carbon Pricing Systems Around
the World

Part 3: Carbon Pricing Systems Around
the World

Part 3: Carbon Pricing Systems Around
the World Steps for creating an ETS
• Step 1: Decide the scope
• Step 2: Set the cap
• Step 3: Distribute allowances
• Step 4: Create offsets
• Step 5: Set timeframes for compliance
• Step 6: Price predictability, cost containment, and market
management
• Step 7: Ensure oversight and compliance
• Step 8: Engage stakeholders, communicate and build capacities
• Step 9: Link
• Step 10: Implement, evaluate and improve
Source:World Bank ETS Handbook
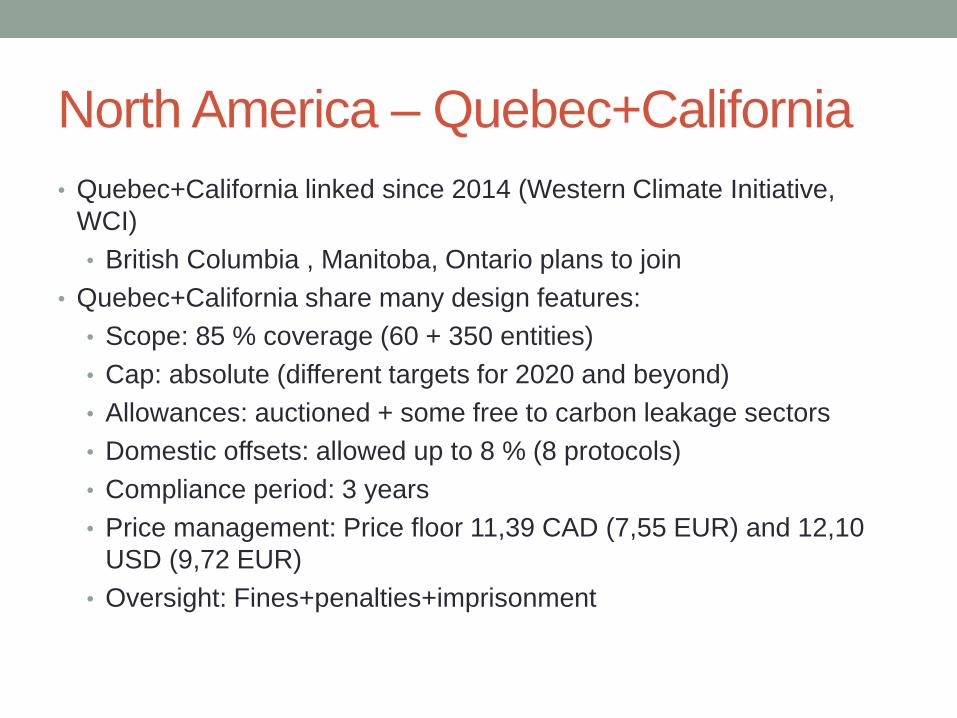
North America – Quebec+California
• Quebec+California linked since 2014 (Western Climate Initiative,
WCI)
• British Columbia , Manitoba, Ontario plans to join
• Quebec+California share many design features:
• Scope: 85 % coverage (60 + 350 entities)
• Cap: absolute (different targets for 2020 and beyond)
• Allowances: auctioned + some free to carbon leakage sectors
• Domestic offsets: allowed up to 8 % (8 protocols)
• Compliance period: 3 years
• Price management: Price floor 11,39 CAD (7,55 EUR) and 12,10
USD (9,72 EUR)
• Oversight: Fines+penalties+imprisonment

North America - Regional Greenhouse
Gas Initiative (RGGI) • First ETS in the U.S. (9 States:Connecticut, Delaware,
Maine, Maryland, Massachusetts, New Hampshire, NY,
Rhode Island, Vermont)
• Scope: 20 % coverage (60 + 350 entities)
• Cap: absolute (revised in 2012, 2,5 % / year)
• Allowances: auctioned + some free to carbon leakage sectors
• Domestic offsets: up to 3,3 % allowed (5 protocols, some common
with California)
• Compliance period: 3 years
• Price management: Price floor 2,05 USD (1,66 EUR), 2014 Cost
Containment Reserve created (CCR)
• Oversight: Penalties are set by each State

North America – systems under
development
• Washington (US): ETS in
2016?
• Manitoba (CAN) part of
WCI, no details yet
• Ontario (CAN): 13 April
announcement of ETS
and linkage with WCI
(details to be announced)
• British Columbia (CAN):
plans to introduce ETS
and link to WCI
Example: B.C. Carbon Tax 2008 -
• B.C. already has success in
carbon pricing
• Revenue neutral carbon tax in
place on fossil fuel use and
carbon emissions since 2008.
• Started from 10 $ -> risen to $30
per metric ton
• B.C.’s fuel use went down by 16
percent in the first five years
after the carbon tax shift.
• Taxes collected redirected to
reducing income/corporate taxes
(among the lowest in Canada
now)

South America
• No active ETS systems, several planned
• Mexico:
• clean energy certificates, carbon tax since 2014 (3,50 USD), allows
domestic CDM for compliance
• ETS transition planned, reporting system since 2014
• Chile:
• Roadmap for ETS in 2013 but shifted in priorities to carbon tax
• Carbon tax set in 2014 -> from 2017 power generators (5 USD)
• Active in voluntary carbon markets since 2009 (also forest credits)
• Brasil (Rio de Janeiro, Sao Paolo)
• ETS or carbon tax under consideration –> impact assessment and
then decisions in 2017
• Rio and Sao Paolo had plans for subnational ETS, but are now on
hold
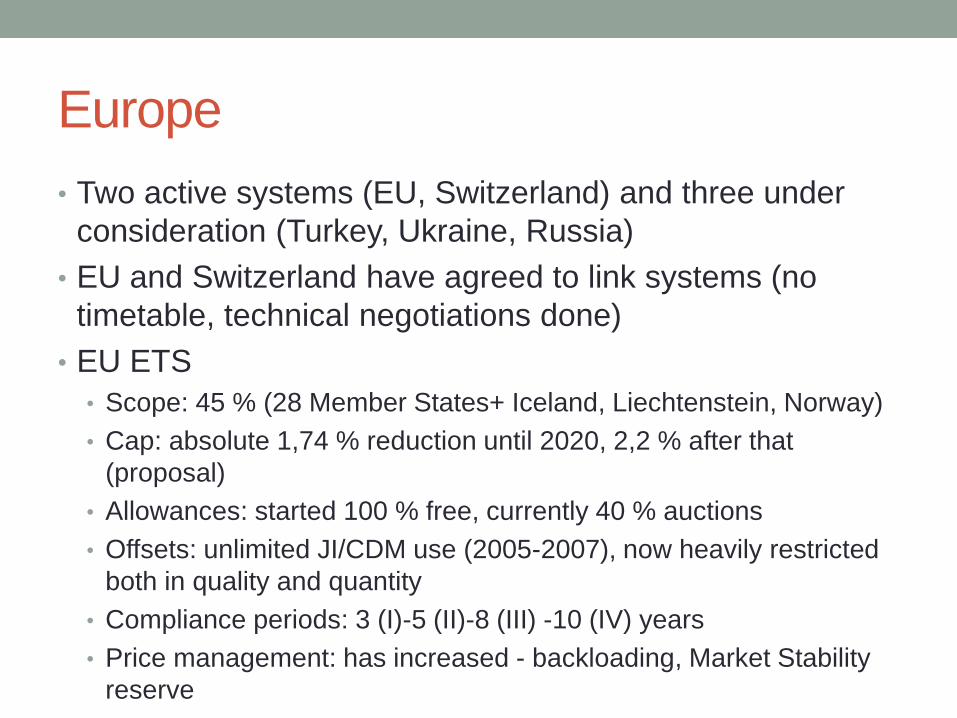
Europe
• Two active systems (EU, Switzerland) and three under
consideration (Turkey, Ukraine, Russia)
• EU and Switzerland have agreed to link systems (no
timetable, technical negotiations done)
• EU ETS
• Scope: 45 % (28 Member States+ Iceland, Liechtenstein, Norway)
• Cap: absolute 1,74 % reduction until 2020, 2,2 % after that
(proposal)
• Allowances: started 100 % free, currently 40 % auctions
• Offsets: unlimited JI/CDM use (2005-2007), now heavily restricted
both in quality and quantity
• Compliance periods: 3 (I)-5 (II)-8 (III) -10 (IV) years
• Price management: has increased - backloading, Market Stability
reserve

Europe • Turkey
• Considering carbon pricing, ETS for electricity sector
• Monitoring and Reporting 2015-2016
• EU design template? (due to EU accession plans)
• Ukraine
• Design an installation-level energy sector MRV; and
• Lay out a road map toward implementation of an ETS.
• EU design template?
• Russia
• MRV in place
• Presidential Decree : concept model for carbon emissions
regulation should be created by Sep. 2017. This could take the
form of either 1) a carbon tax, 2) ETS or 3) command-control
regulation.

Asia
• Kazakhstan
• ETS in force since 2013
• Scope: 55 % (energy, mining, chemicals industry)
• Cap: 0 & for 2014, -1,5 % for 2015
• Allowances: first free, then limited
• Offsets: Domestic allowed, international may be considered
• Compliance Period: 1 – 2 – 5 years
• Price management: no measures, 2014 price was 1,98 EUR
• Compliance oversight: 2013 nothing, currently 40 EUR per ton
penalty for non-compliance

China
• 7 pilot systems in
place
• Mainly free
allocation
• Domestic offsets
allowed (China
CERs)
• Price management:
exchange can take
measures
Souce: Carbon Market Watch
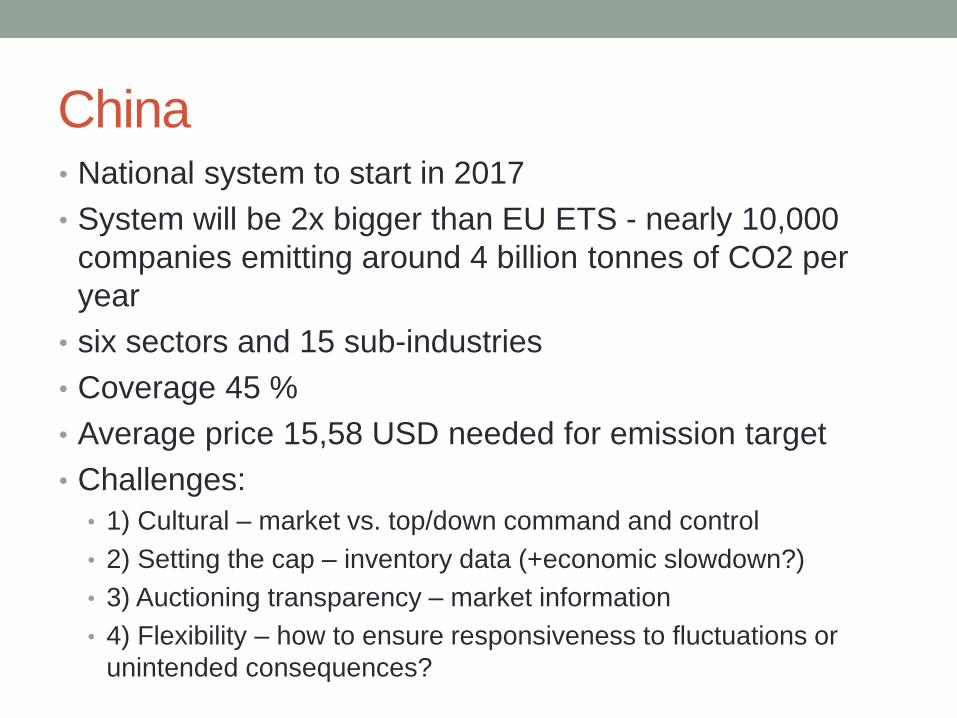
China • National system to start in 2017
• System will be 2x bigger than EU ETS - nearly 10,000
companies emitting around 4 billion tonnes of CO2 per
year
• six sectors and 15 sub-industries
• Coverage 45 %
• Average price 15,58 USD needed for emission target
• Challenges:
• 1) Cultural – market vs. top/down command and control
• 2) Setting the cap – inventory data (+economic slowdown?)
• 3) Auctioning transparency – market information
• 4) Flexibility – how to ensure responsiveness to fluctuations or
unintended consequences?

Asia-Pacific
• Japan-Saitama and Tokyo are linked
• Scope: 26 % / 20 %
• Cap: 6-8 & 1st phase / 13-15 % 2nd phase
• Allowances: free, grandfathering
• Offsets: 4-6 offset types (forest credits also)
• Compliance period: 4-5 years
• Price management: none
• Compliance oversight: none in Saitama, fines in
Tokyo

Asia-Pacific
• Korea ETS
• Launched in January 2015 (2nd largest after EU)
• Scope: 66 %
• Cap: 573 Mt 2015 – 551 Mt 2017
• Allowances: 100 % free for 1st phase, 2nd 3 % auctioning, 3rd 10
% auctioning
• Offsets: up to 10 % of compliance, CDMs converted to domestic
units, also forests and CCS.
• Compliance period: 3-3-5 years
• Price management: Allocation Committee to interfere if threshold 7
EUR is crossed (2015-2016)
• Compliance oversight: penalty fine up to 25 EUR/ton

Asia-Pacific
• New Zealand ETS
• Launched in 2008, forests 1st sector to be included,
agriculture is not (biggest emitter)
• Scope: 54 %
• Cap: TBD
• Allowances: no auctions yet, 90 % free for high emitters, 60 % free
for moderate emitters
• Offsets: Kyoto offsets with qualitative and quantitative limits.
• Compliance period: no phases, but year-on-year allocatons and
surrender obligations
• Price management: 16 EUR price ceiling
• Compliance oversight: no information yet

Asia-Pacific
• Taiwan
• ETS under consideration as ”key option”, no timeline for
implementation
• Vietnam
• Thailand
• Multiple trading systems under consideration
• Voluntary
• 1) target and trade for energy efficiency (Energy Performance
Certificates)
• 2) Thailand Voluntary ETS
• 3) Thailand VER - Emission Reduction Program to sell offsets to
companies and individuals

Part 3: Conclusions
• Carbon Markets are mushrooming on all continents
• They come in various shapes and sizes, often tailored to
meet spesific national circumstances and priorities
• They share some key design features but have also very
big differences
• Carbon Markets are often regional (WCI, RGGI, EU ETS)
and linking happens most naturally with neighbouring
jurisdictions
• Many countries have often overlapping instruments (ETS,
carbon tax, renewable subsidies, certificates, energy
efficiency etc.)
• This creates a challenge for price management

Part 4: Possible Future of A Global
Carbon Market?
• The emergence of regional carbon markets is organic and
tailored to meet spesific needs and circumstances of
different countries
• A Kyoto-style, top-down design with central allocation of
units does not seem to be realistic for ETS systems
• How would linking of systems then happen? In a way that:
• maximises benefits of broadening markets?
• Minimizes the risks of increasing the complexity of the markets?

Part 4: Possible Future of A Global
Carbon Market?
• Regional bilateral
linking already
taking place
• EU-Switzerland
• California – Quebec
• Complexity
increases with
increased linkages
(both direct and
indirect)
Source: Promethium Carbon 2013

Part 4: Possible Future of A Global
Carbon Market? Example: “Networked Carbon Markets” Initiative
• World Bank process for “Globally Networked Carbon
Markets”
• The proposal would introduce a risk-based carbon asset
rating process to ensure fungibility of mitigation efforts
and create a frame of reference for carbon value
• The resulting market would be facilitated by a set of
designated institutions serving as the common hub:
• An International Carbon Reserve (ICAR) that converts ratings into
exchange rates and can help address market shocks
• An International Settlement Platform to track cross-border trading
• One or more independent private rating agencies
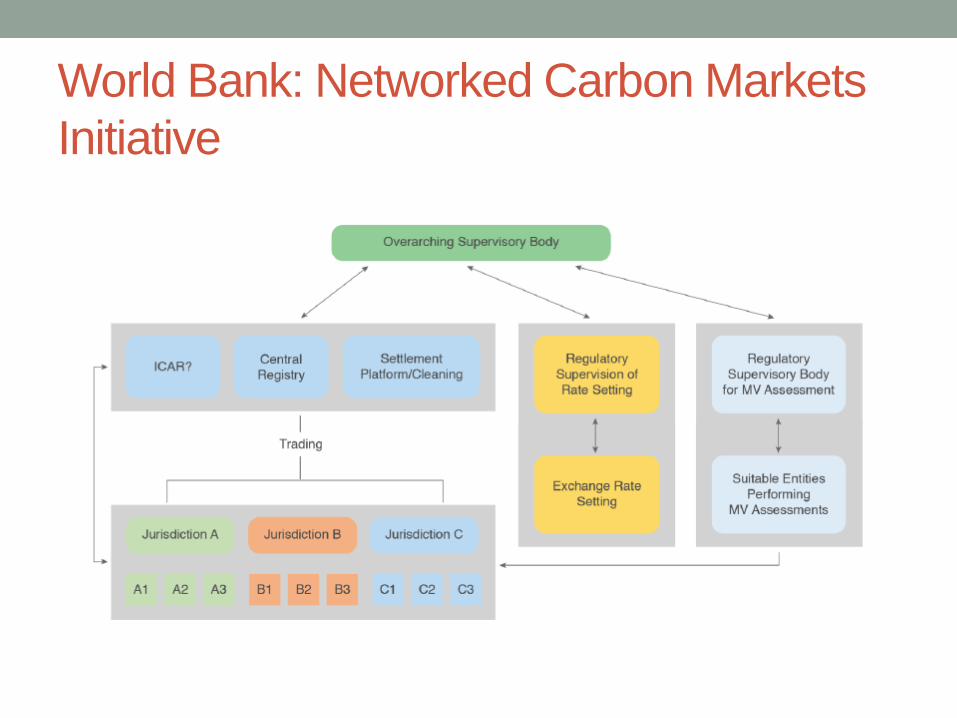
World Bank: Networked Carbon Markets
Initiative

Part 4. Conclusions.
• Systems are growing bottom-up around the world
• Bilateral linking already taking place
• Next step: multilateral linking? Global Carbon
Market?
• Many design features still need to be solved
• Political struggle: who gets to set the terms on
how linkage linking will take place?
• Asymmetric balance between big and small
systems – between supply and demand

THANK YOU!
QUESTIONS / COMMENTS?