luke thesis 2016 v3
TRANSCRIPT

DISCLAIMER:
This document does not meet the current format guidelines of
the Graduate School at The University of Texas at Austin.
It has been published for informational use only.

Copyright
by
Luke Robert Nicolini
2016
The Thesis committee for Luke Robert Nicolini
Certifies that this is the approved version of the following thesis:
Development and Analysis of Stretchable Electronics in
Biopotential Monitoring
Approved by
Supervising Committee:
_______________________________
Nanshu Lu, Supervisor
_______________________________
Dragan Djurdjanovic

Development and Analysis of Stretchable Electronics in Biopotential Monitoring
by
Luke Robert Nicolini, B.S.M.E.
Thesis
Presented to the Faculty of the Graduate School
of the University of Texas at Austin
in Partial Fulfillment
of the Requirements
for the Degree of
Master of Science in Engineering
The University of Texas at Austin
May 2016

Acknowledgements
I would like to thank the US Office of Naval Research, for the funding (ONR
N00014-16-1-2044) that has made this Thesis and my graduate education possible. I
would also like to thank my Advisor Dr Nanshu Lu, for her help and expertise from my
Undergraduate through my Masters career, and for her support both professionally and
emotionally which allowed me to undertake my research of interest. Thank you to my
Co-Supervisor Dr Dragan Djurdjanovic, whose expertise in modeling of systems was
crucial in the creation of new modeling techniques in this Thesis. I would also like to
thank my many colleagues in both the Lu Group and Djurdjanovic group, for their hard
work and cooperation which allowed for better and more thorough research.
On a personal note, I would like to thank my high school science teacher Mrs.
Kathy Celestine, whose enthusiasm for Science inspired me to pursue my degree in
Engineering. I would also like to thank my mother Paula Nicolini, who always pushes
me to achieve the best I can, and does everything to help me along the way. Thank you
to my father Andrew Nicolini, who works long hours and drives long commutes so that
my sisters and I are able to afford a good education and lifestyle. Finally, I would like to
thank my girlfriend Sara Benner, for supporting me on the days where it was difficult
and the desire to continue waned, and for always believing in me and my ability to
accomplish my Master’s program and beyond.

i
Abstract
Development and Analysis of Stretchable Electronics in
Biopotential Monitoring
Luke Nicolini, M.S.E.
The University of Texas at Austin, 2016
Supervisors: Nanshu Lu
In this Thesis, stretchable electronics are studied and developed, with a focus on the epidermal
monitoring of biopotentials for healthcare and other applications. Conventional manufacturing
processes for stretchable electronics are time and cost intensive. A novel manufacturing
method to create stretchable electronics is developed, in which a cutter plotter is used to
directly shape thin metal films, in order to produce stretchable designs. The limits of the
manufacturing process are investigated and recorded, both in terms of the cutter plotter
capabilities and in the use of different materials and substrates for the thin-film device. The
thin, stretchable devices are also tested in a wide variety of data collection situations, including
measuring of a variety of biopotentials including ECG, EMG, and EEG. The new Epidermal
Sensor Systems created with the Cut-and-Paste manufacturing method perform equal to or
better than conventional electrodes. Thus the cut-and-paste method is determined to be a
novel and more cost effective method to produce stretchable sensors.

ii
Stretchable sensors we produce can match the thickness and mechanical stiffness of human
epidermis, and can hence be laminated and fully conformed on human skin like a temporary
transfer tattoo for long-term biopotential monitoring including electrocardiogram (ECG),
electromyogram (EMG), and electroencephalogram (EEG). Such epidermal sensors have
enabled the investigation of muscle fatigue and recovery over time. An Autoregressive Moving
Average (ARMAX) model is developed in order to map between forearm flexor muscle EMG and
the grip force of the corresponding hand. The fit of this model is tracked over the course of
fatigue, and changes in the model are analyzed to provide useful trends with which to measure
and follow muscle fatigue patters. The epidermal sensor is found to be equivalent to
conventional electrodes for muscle fatigue monitoring, while being more comfortable and
durable. Further, the ARMAX modeling procedure is proven to have useful results in terms of
modeling of forearm muscle fatigue.
Overall, this research contributes to the field of stretchable electronics and their applications
for biopotential monitoring.
iii
Table of Contents List of Tables ................................................................................................................................................ iv
List of Figures ............................................................................................................................................... iv
Section 1: Introduction ................................................................................................................................. 1
Section 2: Wearable Electronics .................................................................................................................. 3
Section 2.1: Bendable Electronics ............................................................................................................. 3
Section 2.2: Stretchable Electronics .......................................................................................................... 6
Section 2.3: Biological Considerations & Constraints ............................................................................... 9
Section 3: “Cut-and-Paste” Manufacture of Multiparametric Epidermal Sensor Systems (ESS) ............ 17
Section 3.1: Cut-and-Paste Method ....................................................................................................... 17
Section 3.2: Sensor Design & Mechanical Properties ............................................................................. 22
Section 3.3: Physiological Measurement Capabilities ............................................................................ 29
Section 4: Quantification of Forearm-Hand Muscle Dynamics Over Time Using Stretchable Sensors ... 32
Section 4.1: Sensor Design ..................................................................................................................... 33
Section 4.2: Experimental Setup and Procedures .................................................................................. 35
Section 4.3: Results and Discussion ....................................................................................................... 39
Section 5: Conclusion ................................................................................................................................. 46
References .................................................................................................................................................. 48

iv
List of Tables
Table 1: Thickness and Young's Moduli of Materials and Designs ......................................... 24
List of Figures Figure 1: Example of Bendable Electronics in Bending ............................................................................... 4
Figure 2: Schematic of Bending .................................................................................................................... 5
Figure 3: Schematic of Linear Serpentine .................................................................................................... 8
Figure 4: Skin Layer Composition, Dermis and Epidermis ........................................................................ 10
Figure 5: Equivalent Electric Circuit of Human Skin .................................................................................. 11
Figure 6: Effect of Exfoliation of Skin Surface on Skin Impedance ........................................................... 11
Figure 7: Manufacturing Schematic for Cut-and-Paste Thin-Film Manufacturing ................................... 18
Figure 8: Resolution Test of Cut-and-Paste Method ................................................................................. 20
Figure 9: Ribbon-width Testing .................................................................................................................. 21
Figure 10: Effects of Blade Integrity on Cut Serpentines .......................................................................... 22
Figure 11: All-In-One Epidermal Stretchable Sensor Device ..................................................................... 23
Figure 12: Stretchability Tests of Sensor Designs ...................................................................................... 26
Figure 13: ESS on Different Substrates ...................................................................................................... 27
Figure 14: Deformation vs Reliability Testing ........................................................................................... 28
Figure 15: Example EP Measurements ...................................................................................................... 30
Figure 16: Sun-Type Electrode Design, Device and Deformation on Skin ................................................ 34
Figure 17: Sun-type Electrode on Arm with Hand Grip Device, with Example Measurements .............. 36
Figure 18: Fatigue and Recovery of Forearm Muscle with Sun-Type Electrodes ..................................... 39
Figure 19: Fatigue and Recovery of Forearm Muscle with Conventional Electrodes .............................. 40
Figure 20: Fatigue and Partial Recovery of Forearm Flexor Muscle ......................................................... 41
Figure 21: Repeated Fatigue and Recovery of Forearm Flexor Muscles .................................................. 42
Figure 22: Correlation Residuals for Sun-type and Conventional Electrode Measurements .................. 44

1
Section 1: Introduction
As technology continues to advance and electronic devices become smaller, there is
more and more of a focus on portability and ease of use when it comes to new devices.
As an example, phones have transitioned from wall-mounted devices to wireless
mounts to pocket phones, and now are so small and powerful they rival modern
computers while still fitting inside of a pocket. New technologies, especially electronics,
should be portable and easy-to-use, to make the experience greatest for the end user.
Personal health has also experienced a surge in interest, and new portable
technologies are making tracking one’s own health easier than ever. The popular FitBit
is one example: a wristband device that tracks the user’s steps and sleep patterns,
while also allowing for customization of goals and connecting with other users to create
both a helpful tool and a support group to encourage personal health. While the FitBit
and other similar devices have already proven popular, they are limited in the type and
accuracy of data they may collect, due to the fact that they cannot interface directly with
the skin surface in a reliable matter.
What this thesis will explore is the creation and application of an Epidermal Sensor
Systems (ESS’s). Pioneered by the John Rogers group at the University of Illinois,
epidermal stretchable electronics are ultra-thin devices which rest directly on the human
skin. The devices take advantage of special shapes that allow normally rigid metals to
be stretched further than human skin is capable. The principles behind these properties
will be explained in greater detail in Section 2. Furthermore, thanks to their intimate
contact with the human body, they can be used to measure a wide variety of different
health signals, such as Electrocardiograms (ECG), electromyograms (EMG), skin

2
hydration levels, breathing rates, and much more. The simple properties behind the
stretchability of the device also allowed us to invent a new manufacturing method much
faster than traditional nanomanufacturing. The design, manufacturing, and capabilities
of our new ESS device will be further explored in Section 3. Finally, a large advantage
the ESS has over traditional sensors, such as conventional electrodes, is durability
gained by the device’s conformability and non-invasive nature. The flexibility allows for
natural movement of the subject, allowing for more natural physiological signals to be
captured and analyzed. To confirm this hypothesis, we performed several tests to build
an accurate model between the EMG of the forearm and the associated Hand Grip
Force (HGF) and analyze the recovery of a muscle for after exhaustive workout. The
details and procedures of these experiments, as well as results comparing ESS and
conventional electrode measurements, are found in Section 4.
The following section will delve deeper into the research preceding current wearable
electronic technologies, as well as the current state-of-the-art. The section will also tie
all this together and explain the influence on our new technology, and where further
work may take it.

3
Section 2: Wearable Electronics
In this section, the history and concepts behind wearable electronics, both bendable
and stretchable, are covered. Section 2.1 will review bendable electronics, devices
which are able to curve and bend with motion without losing integrity or functionality.
Section 2.2 will cover the newer field of stretchable electronics, devices which are
capable of withstanding large strains without loss of functionality. Finally, Section 2.3
will cover Biological Considerations & Constraints needed when applying these two
types of technology to a living animal or person.
Section 2.1 Bendable Electronics
Bendable Electronics are devices manufactured in such a manner that they can
withstand high curvature without losing function or form. The earliest known bendable
electronic schematics were by Albert Hanson in an English patent in 1903, which
described printing flat metal conductors onto paraffin coated paper; these patents were
rediscovered by Dr. Ken Gilleo [1]. Since then, innumerable different patents and ideas
of bendable electronics have been invented and published, with nearly all of them
having a similar philosophy: placement of thin, rigid material on a flexible substrate.

4
Figure 1: Example of Bendable Electronics in Bending
Metals, the most common and arguably most effective conductors for electronics, are
capable of small-scale bending naturally [2,3]. However, the most commonly used
metals cannot survive under conditions of extreme bending, and as such new materials
or methods are required [2,4-8].
The mechanics of bending involve differing kinds of stress applied to the materials, both
tension and compression. As viewed in Figure 2, materials on one side of a bend are
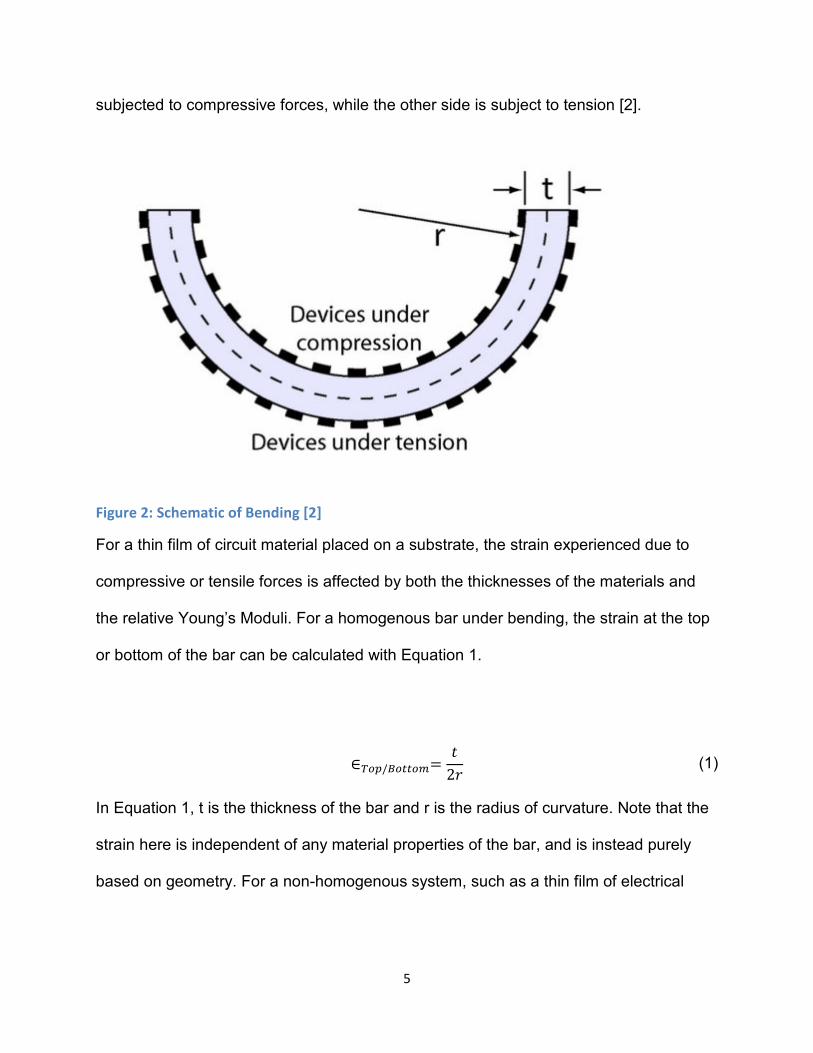
5
subjected to compressive forces, while the other side is subject to tension [2].
Figure 2: Schematic of Bending [2]
For a thin film of circuit material placed on a substrate, the strain experienced due to
compressive or tensile forces is affected by both the thicknesses of the materials and
the relative Young’s Moduli. For a homogenous bar under bending, the strain at the top
or bottom of the bar can be calculated with Equation 1.
∈���/������= 2� (1)
In Equation 1, t is the thickness of the bar and r is the radius of curvature. Note that the
strain here is independent of any material properties of the bar, and is instead purely
based on geometry. For a non-homogenous system, such as a thin film of electrical

6
material on a flexible substrate, the strain on the tensile surface of the film can be found
using Equation 2.
∈���= �� + ��2� � 1 + 2� + ���(1 + �)(1 + ��) (2)
In Equation 2, df is the thickness of the thin-film material, ds is the thickness of the
substrate, η = df/ds, and χ = Yf/Ys, the ratio of Young’s Moduli. Based on these
equations, a smaller Young’s modulus for the substrate, or a smaller thickness of the
film, will lead to smaller strain and higher possible curvature [9].
In order to reduce strain applied to the circuit even further, many bendable electronic
circuits aim to place the rigid electrical components at the neutral line between the two
surfaces, where the materials experience neither tension nor compression. A thin film of
circuitry material will lie of the neutral plane if, for substrate S and encapsulation layer E,
with Young’s Moduli and thicknesses YE, YS, dE, and dS, Equation 3 is true [9].
����� = ����� (3)
Sandwiched in this way, normally rigid electronic components can bend to incredibly
small radii, even to the point of folding over; the only constraint is the strain tolerance of
the substrate and encapsulating materials, rather than the circuit itself [9]. These
technologies allow for the creation and application of normally unbendable materials like
metals or silicon wafers to be adapted into flexible devices for use in research,
healthcare science, or elsewhere.
Section 2.2: Stretchable Electronics

7
Stretchable electronic devices are those in which the structure is able to withstand large
amounts of strain while maintaining functionality, including cyclic strains. As discussed
in section 2.1, the devices incorporated into bendable electronics do experience strains
due to bending mechanics, but stretchable electronics are distinct in that the amount of
strain induced is of a higher magnitude, from 30% to as high as several hundred
percent. In comparison to bendable electronics, stretchable electronics is a relatively
newer field. There are two main methods to create stretchable electronic devices: One
is top-down, in which normally rigid materials are patterned in such a way as to increase
stretchability, and the other is bottom-up, in which new materials are developed to have
favorable electrical properties while having larger strain tolerance [10]. The Rogers
group of the University of Illinois has pioneered stretchable electronics for the last
decade. One major breakthrough used in much of their, research as well as the devices
featured in Sections 3 and 4, is the development of a thin, serpentine pattern, whose
shape allows for large strains along the device axis thanks to buckling action of the
device [11]. Figure 3 shows an example of a linear serpentine structure, as well as its
relevant geometric variables, being Arc Radius (R), Arc Length (l), Arc Angle (a), and
Ribbon Width (w) [12].

8
Figure 3: Schematic of Linear Serpentine
Several methods are used to allow the materials to stretch to large strains. Patterning of
normally rigid materials, such as metals or silicon, into meandering shapes rather than
straight lines allow the material to deform and twist during stretch, rather than yield [2,
13]. Another method involves prestrain of the substrate, such that the material is
naturally buckled out of plane during rest, and “straightens out” during strain [10].
However, using this method limits the device to stretching which is less than the
substrate prestrain, or else further stretching will be applied to the rigid material’s
Young’s modulus [2]. A third method is to create special nanomaterials with properties
of both stretchability and desired electrical properties. One example is the dispersion of
conductive particles in a flexible matrix, to take advantage of the conductive nature of
the particles while allowing for strain tolerance of the matrix [10]. The stretchability of a
given design is difficult to calculate, and is normally found either through complex
computer modeling or real-world stretchability testing. Details on some testing methods
used will be given in Section 3, when discussing the design and parameters of the
patterned serpentine patch used in the experiments.

9
Section 2.3 Biological Considerations & Constraints
One of the main advantages of ultrathin stretchable electronics, the advantage
highlighted in this document, is the ability to be placed directly onto the surface of the
human skin (known as epidermal electronics). Because the device interfaces with and
gathers data directly from the human body, important parameters and functions of the
human skin must be considered. The first is most obviously the stretchability of human
skin during normal motion; as long as the device can stretch farther than the skin it is
placed on, there is no concern about device malfunction, as the skin would fail before
the device. Skin can withstand strains of up to 30% before failure [14]. Many stretchable
electronics are capable of far greater strains, including the devices featured in this
document, as will be demonstrated in Section 3.
When collecting certain data, such as biopotentials, the electrical properties of the skin
are important to proper device design and placement. The human skin is made of
multiple layers, which can be grouped into two main categories: the outer epidermis,
and the inner endodermis. The layers of the skin are displayed in Figure 4.

10
Figure 4: Skin Layer Composition, Dermis and Epidermis
The epidermis, or Stratum corneum, is made up of dead, dry skin cells, and serves as
the body’s shielding outer layer [15]. This layer has much larger impedance when
compared with the endodermis, which is composed of live cells and as a result has
higher levels of conductance. Figures 5 and 6, reproduced from a study by Yamamoto
et al in 1976, show an equivalent circuit diagram of the human skin, and the effect of
peeling away of the stratum corneum on impedance measurements (in Figure 6, the
number in parentheses is the number of times the skin has been peeled using ordinary
cellulose tape) [16].

11
Figure 5: Equivalent Electrical Circuit of Human Skin [16]
Figure 6: Effect of Exfoliation of Skin Surface on Skin Impedance [16]
Inspired by the properties shown in Figure 6, one method to reduce impedance during
measurement is to pretreat the skin, by abrading it with a rough material to remove the
stratum corneum. It is found that a simple alcohol wipe abrasion of the skin is sufficient
when measuring Electromyography (EMG) signals on the surface of the skin while
simple dry-electrodes on skin with no preparation were insufficient [17].

12
When placing the device to gather biopotentials, placement of the device must be
considered, especially when comparing two sets of data from experiments on different
subjects or using different electrodes. For electromyography (EMG) signals, the
electrodes should be placed on the muscle of interest; however, it has been found that
changing the relative positions on the muscle has no effect on the gathered EMG
signals [18]. Further testing of this result is done in Section 4, where two collection
setups are tested simultaneously in alternating positions to determine reliance on
position. For the purposes of electrocardiogram (ECG) measurement, the device shown
in Section 3 uses a similar design to that employed by the Rogers group, of placing the
measurement, reference, and ground electrodes axially with one another separated by
small distance, and placed directly above the heart [19]. Further details on its
construction are explained in the following sections.
For long-term measurements on the skin, biocompatibility must also be ensured such
that the device does not have any harmful effects on the end user. Gold has a proven
record of being safe for use with the human body [20], as well as desirable electric
properties; it has been selected as the conductor for our electrodes. Further testing on
the properties of gold for the purposes of biopotential acquisition is expanded in Section
3.
In the study of muscle fatigue, many different methods have been developed to quantify
the degradation of the muscle with exertion. One of the most basic methods is known as
the “mechanical manifestation of muscle fatigue”, which is defined as “failure to maintain
the required or expected force” [21]. This approach solely looks at outputs of muscle
activity, such as force generated, and a drop in expected baseline activity is taken as a

13
sign of fatigue. While this method is very simple and easy to implement, it suffers from a
lack of consistency, as output can be affected by non-physical factors such as
motivation [22]. Another method, commonly used in professional sports, is to estimate
fatigue by measuring the lactate concentration of blood at determined intervals during
an exercise. Due to the nature of collecting and analyzing blood samples, with this
method it is not possible to measure fatigue in real time. In addition, the collection of
blood samples is invasive and requires experienced caretakers to ensure safety for the
test subject. This method cannot target individual muscles, but rather gives an
estimation of overall body fatigue.
The most popular and useful strategy to measure muscle activity and fatigue has been
the use of surface Electromyography (sEMG). It has been shown that the biological and
physical characteristics of fatigue are also reflected in the properties of EMG signals
collected on the surface of the skin [23]. While this method is restricted to measurement
only of muscles just below the skin, it has numerous advantages which make it the
preferred method of monitoring muscle fatigue: non-invasiveness, applicability in situ,
real-time capability, ability to target a specific muscle, and correlation with biological and
physical factors [24].
The methods available to process gathered EMG data can be classified into two main
camps: time-domain methods and frequency domain methods [24]. Time-domain
methods aim to analyze the EMG signal itself. This is usually accomplished by
measuring either EMG amplitude or Zero-crossing rate. EMG amplitude consists of two
different parameters: the mean absolute value (MAV) and the Root-mean square value
(RMS), calculated as Equations 4 and 5, respectively.

14
(4)
(5)
In Equations 4 and 5, xi is the sample taken at time i, and N is the total number of
samples in the epoch. Tracking of these two values over time can lead to trends which
indicate fatigue of the muscle. While useful, these methods are prone to variation based
on types of machines used to collect the data, and as such these EMG amplitude
methods are usually combined with other methods, rather than used alone, to analyze
fatigue. Another commonly used method is the Zero-crossing rate (ZCR) of the signal,
defined as half the number of times the signal crosses the zero axis [25]. While this
method produces results close to those found in other time-domain methods, it is highly
dependent on the Signal-to-Noise ratio of the collected EMG, and as such has generally
been abandoned for the purposes of analyzing EMG.
Frequency domain methods are common in modern EMG analysis, particularly Fourier-
based spectral estimators. In these methods, EMG is assumed to be a zero mean wide
sense stationary (WSS) process. While this assumption is good for short-term muscle
movement, the change in muscle dynamics corresponding to fatigue is inherently non-
stationary, and as such these basic methods are limited. However, the Fourier-based
methods still provide useful analysis of muscle activity, and can detect the change in

15
muscle dynamics associated with fatigue, limited by the inability to quantify degree of
fatigue. For example, Roy et al. has demonstrated the ability of frequency analysis of
EMG to detect lower back pain problems in professional rowers [26].
Parametric based spectral estimators have also shown use in measurement of muscle
fatigue. Autoregressive (AR) modeling of the biceps brachii muscle during maximum
voluntary contraction has shown a clear change in model parameters, which is useful
for tracking of fatigue [27]. A focused study found the AR method to be a good indicator
of fatigue, with the limitation of needing a high-order AR model which could be
computationally heavy [28].
A combination approach of time domain and frequency domain has also been
investigated. Namely, this method measures both the amplitude of the EMG signal and
the shift in the frequency domain, and correlates the two with different muscle actions.
Four different cases are distinguished: 1) Amplitude increases and spectrum shifts right,
indicates muscle force increase, 2) Amplitude decreases and spectrum shifts left,
indicates muscle force decrease, 3) Amplitude increases and spectrum shifts left,
indicates muscle fatigue, and 4) Amplitude decreases and spectrum shifts right,
indicates recovery from fatigue [24]. This method has shown very useful for tracking of
fatigue, but provides no quantitative measure of fatigue severity.
Time-frequency modeling is another approach to EMG analysis, which attempts to lift
the restriction of traditional frequency modeling which assumes the input signal to be
stationary. Fatiguing of the muscle and movement of rigid electrodes relative to the
muscle body during exercise causes the signal to be noticeably non-stationary, and as a

16
result any method assuming otherwise is only valid for very short time frames. These
methods include Short-Time Fourier Transform (STFT), Wigner Distribution (WD), Time-
varying Autoregressive (TVAR), and Choi-Williams Distribution [24, 29, 30, 31]. Time-
frequency analysis is shown to have the most reliable methodology for measuring and
quantification of muscle activity and fatigue, as well as the best robustness versus
dynamic factors such as electrode movement. As a result, the Autoregressive method is
expanded upon in order to include measurement of output force as well, to investigate
the benefits for the modeling of muscle dynamics and fatigue. This analysis and results
are located in Section 4.

17
Section 3: “Cut-and-Paste” Manufacture of Multiparametric Epidermal Sensor
Systems (ESS)
The creation of epidermal electronics requires the precise shaping of ultrathin materials
in order to create patterns that are functional, stretchable, and conformable enough to
operate on the human skin. Traditional nanomanufacturing, the industry standard for the
creation of ultrathin devices, is labor and equipment intensive, usually involving many
different steps and the use of many different chemicals, all of which add up to a
significant cost in time and money. In this section, a new manufacturing method dubbed
“Cut-and-Paste” which uses entirely dry methods with countertop operation, allows for
the creation of epidermal electronics in only a few minutes. The method is applicable to
all types of thin metals and polymers, and creates devices which are shown to
accurately measure a wide array of signals, including biopotentials, skin hydration, and
surface temperature. Further applications of the technology as a strain sensor are also
investigated.
Section 3.1: Cut-and-Paste Method
The Cut-and-Paste method uses a programmable cutting blade to shape a thin metal on
thin polymer, followed by a series of transfers to an adhesive material to form the final
device. The schematic of cut-and-paste is shown as Figure 7.

18
Figure 7: Manufacturing Schematic for Cut-and-Paste Thin Film Manufacturing
The process begins with a thin metal on a stiff-polymer substrate. This setup is used
because it is found to always be more stretchable than simply freestanding metal sheets
[32]. Two different materials were cut: gold coated polyethylene terephthalate (PET) and
aluminum coated PET. The gold coated PET was created by thermal evaporation of Au
with a thickness of 100 nm onto 13 µm-thick transparent PET foil. The Aluminum on
PET was purchased commercially from Neptco (Pawtucket, RI), with dimensions of 9
µm-thick Al on 12 µm-thick PET laminate.
To manufacture the Au portions of the device, the Au on PET film was bonded to single-
sided Thermal Release Tape (TRT) (Semiconductor Equipment Corp, USA), with Au
side of the sheet contacting the TRT adhesive. The non-adhesive side of the TRT was
then applied to a tacky cutting mat, to hold it in place during the cutting procedure. The
cutting mat was fed into an electric cutter printer (Silhouette Cameo, USA), where

19
imported designs from AutoCAD allowed the printer to cut the Au on PET to desired
shapes and specifications. The TRT was then peeled from the adhesive mat and placed
on a hotplate set to 115 oF for 30 seconds, to allow the Au on PET film to debond
slightly from the TRT. Tweezers were then used to peel off the excess gold from the
design. Finally, the system was placed device-side onto an adhesive substrate, which
was successfully tested to be any of the following: water-soluble temporary tattoo
adhesive (Silhouette), 3M Tegaderm transparent dressing, or 3M kind removal silicon
tape (KRST). The TRT was peeled away, leaving the device bonded to the adhesive
substrate, with gold-side facing outwards. This creates a device which can then be
applied directly to the skin to gather biopotential and other data.
The cutting machine used in this method can pattern thin films up to 12 inches by 12
inches, much larger than traditional nanomanufacturing limits available to researchers.
The resulting devices can be transferred to tattoo or medical adhesives with a nearly
100% success rate, due to the support of Thermal Release Tape (TRT) during the
cutting process. The entire process requires very little space and no special climate
controls, while also completing in as little as 20 minutes per pass, which can yield a
dozen or more samples.
Figure 8 below details the limits of resolution of the cutting machine, tested from 600
µm to 50 µm width serpentines. The material used in this testing is 9-µm -thick Al on
12-µm -thick PET foil (NEPTAPE® by NEPTCO, Inc.). At a resolution above 200µm,
the machine successfully creates the desired shape with little loss of uniformity and no
compromised patterns. At 200µm, the device created remains uncompromised, but the

20
uniformity of the ribbons suffers. At 100µm and below, Figures 8e and 8f, the device
itself becomes compromised, and is insufficient for use. As a result of these tests,
400µm width ribbons were selected, to insure device integrity and uniformity.
Figure 8: Resolution Test of Cut and paste method. All resolutions are measured in ribbon
width.
Ribbon width uniformity tests were also performed, by measuring the median line of
serpentines at evenly spaced intervals along a cut device, as shown in Figure 9. The
material used in these tests is 25-µm-thick Kapton sheets (DuPont). With the cutting

21
machine set to produce serpentines with a width of 400 µm, the distribution of ribbon
was found to be centered at 340µm with a standard deviation of 87µm. Thickness
testing performed by profilometer found the edge of the ribbons to be less than 30µm
wide, indicating the majority of the ribbon is very flat.
Figure 9: Ribbon width testing. a) Image of network serpentines, with measured widths. b)
Plot of measured widths, with fitted normal curve. c) Location of 3 trials for ribbon thickness
tests. d) Ribbon thickness across width at locations 1, 2, and 3.
Blade quality is also of critical importance to the quality of the device produced. As
displayed in Figure 10, the cutting blade can become worn or destroyed, based on age
of the blade, extent of use, and materials cut. In addition, the cutting thickness, speed,
and sharpness parameters of the cutting machine affect the outcome of the device. As a

22
result of these and further studies, the ideal cutting parameters were set to
sharpness=5, cutting rate=2, and thickness=1, for the best quality cuts.
Figure 10: Effects of Blade Integrity on Cut Serpentines. a), d), g) correspond to a new blade.
b) e), h) correspond to a used blade. c), f), i) correspond to a "destroyed" blade. j), k), l)
display cutting quality of a new blade at different portions of network
Section 3.2: Sensor Design & Mechanical Properties
23
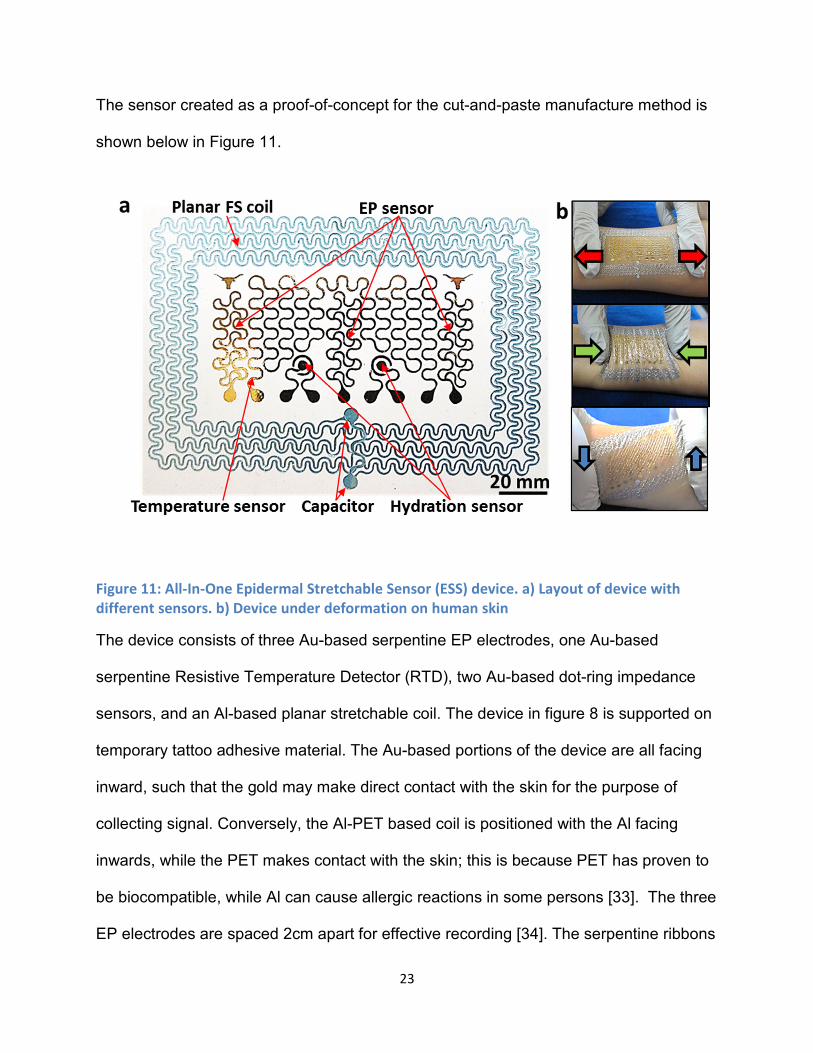
The sensor created as a proof-of-concept for the cut-and-paste manufacture method is
shown below in Figure 11.
Figure 11: All-In-One Epidermal Stretchable Sensor (ESS) device. a) Layout of device with
different sensors. b) Device under deformation on human skin
The device consists of three Au-based serpentine EP electrodes, one Au-based
serpentine Resistive Temperature Detector (RTD), two Au-based dot-ring impedance
sensors, and an Al-based planar stretchable coil. The device in figure 8 is supported on
temporary tattoo adhesive material. The Au-based portions of the device are all facing
inward, such that the gold may make direct contact with the skin for the purpose of
collecting signal. Conversely, the Al-PET based coil is positioned with the Al facing
inwards, while the PET makes contact with the skin; this is because PET has proven to
be biocompatible, while Al can cause allergic reactions in some persons [33]. The three
EP electrodes are spaced 2cm apart for effective recording [34]. The serpentine ribbons

24
are designed with a 1/5 ribbon width to arc radius ratio, to balance stretchability and
surface area [35]. Due to the size constraints of the Al-coil, the 1/5 ratio was not
possible, so instead a double-stranded serpentine design is used to maximize number
of turns in the device, while maintaining stretchability. The RTD is patterned to have as
long a path as possible while fitting within the device, in order to provide greatest total
resistance and thus greatest change in resistance when exposed to differing
temperatures; details of the importance of this parameter are located in Section 3.3. The
overall dimension of the device area is 7.5 cm x 5cm.
The Young’s moduli of all materials used in the ESS design, as well as the ESS devices
themselves, were tested using a RSA-G2 dynamic mechanical analyzer (TA
instruments). Each material used in either the device or the substrates were tested.
The materials were cut into rectangular strips with aspect ratio 10:1 and strained in the
longitudinal direction. Each material was tested five times with different specimens, and
the average Young’s Moduli are collected in Table 1.
Table 2: Thickness and Young's Moduli of Materials and Designs
Material Thickness (μm) Young’s Modulus (GPa)
PET (Goodfellow) 13 4.59
Kapton (Dupont) 12.7 3.59
KRST (3M) 200 0.228
Tattoo adhesive (Silhouette) 22 0.042
ESS on Tegaderm 60 0.011
Tegaderm (3M) 47 0.007
25
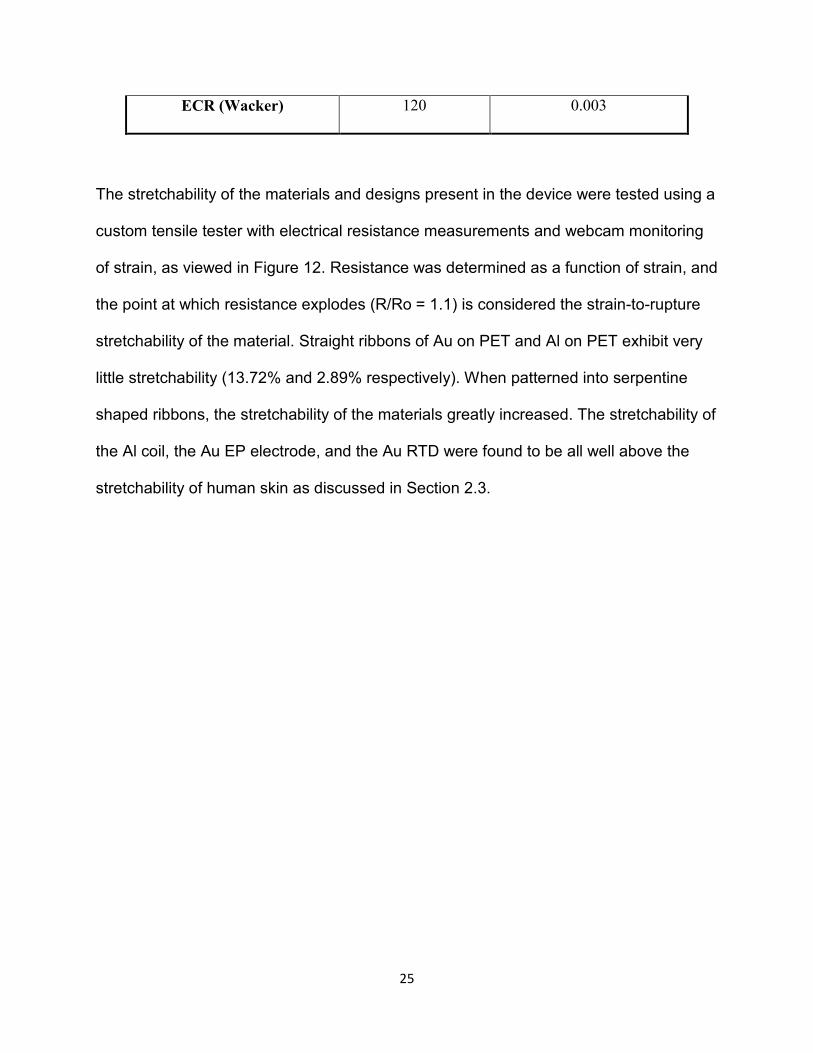
ECR (Wacker) 120 0.003
The stretchability of the materials and designs present in the device were tested using a
custom tensile tester with electrical resistance measurements and webcam monitoring
of strain, as viewed in Figure 12. Resistance was determined as a function of strain, and
the point at which resistance explodes (R/Ro = 1.1) is considered the strain-to-rupture
stretchability of the material. Straight ribbons of Au on PET and Al on PET exhibit very
little stretchability (13.72% and 2.89% respectively). When patterned into serpentine
shaped ribbons, the stretchability of the materials greatly increased. The stretchability of
the Al coil, the Au EP electrode, and the Au RTD were found to be all well above the
stretchability of human skin as discussed in Section 2.3.

26
Figure 12: Stretchability Tests of Sensor Designs. a-b) Applied Strain to Rupture of Different
Materials and sensor Designs. c-d) Stretchable Coil. e-f) EP sensor. g-h) Temperature Sensor
Three different substrates were tested for the purposes of supporting the ESS device,
and are shown in Figure 13. Tegaderm and tattoo paper are thin, transparent, and best
emulate skin-like behavior. KRST (“blue tape”) is relatively thicker, more similar to a
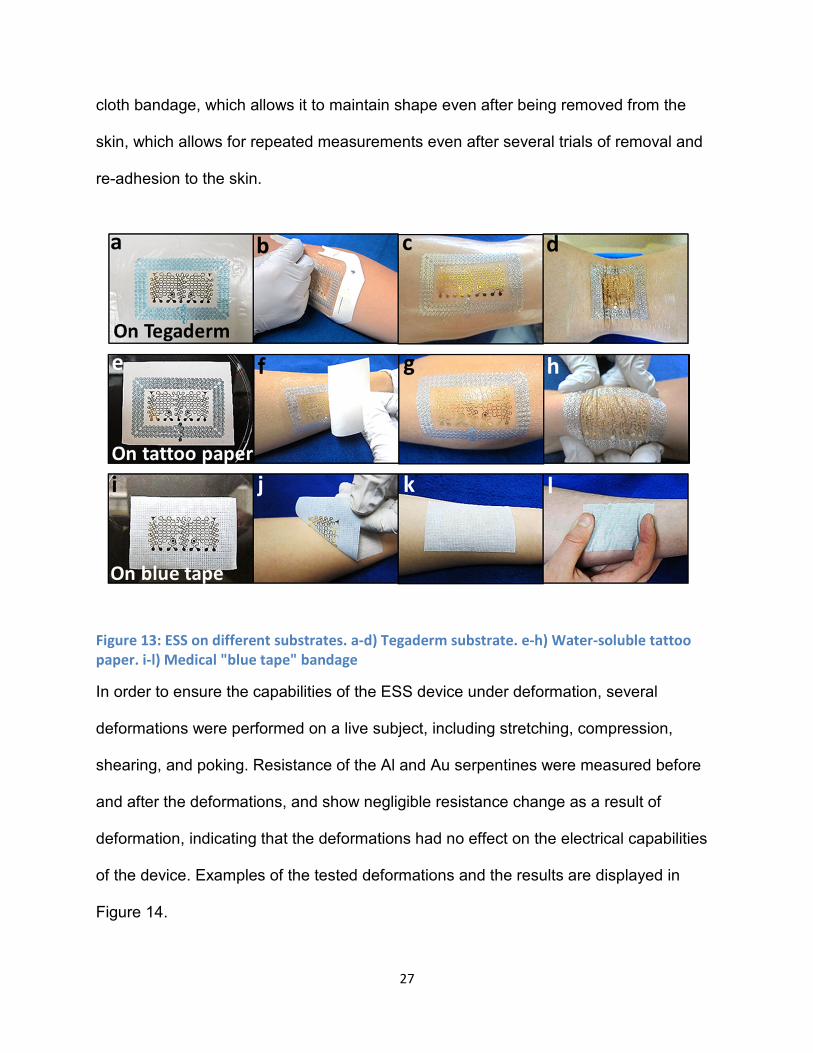
27
cloth bandage, which allows it to maintain shape even after being removed from the
skin, which allows for repeated measurements even after several trials of removal and
re-adhesion to the skin.
Figure 13: ESS on different substrates. a-d) Tegaderm substrate. e-h) Water-soluble tattoo
paper. i-l) Medical "blue tape" bandage
In order to ensure the capabilities of the ESS device under deformation, several
deformations were performed on a live subject, including stretching, compression,
shearing, and poking. Resistance of the Al and Au serpentines were measured before
and after the deformations, and show negligible resistance change as a result of
deformation, indicating that the deformations had no effect on the electrical capabilities
of the device. Examples of the tested deformations and the results are displayed in
Figure 14.

28
Figure 14: Deformation vs Reliability Testing. a-i) Different deformations performed on ESS
while adhered to skin. j) Before and after deformation measurements of total resistance for
Strain Gauge and Temperature Sensor Devices

29
Section 3.3 Physiological Measurement Capabilities
The multiparametric ESS design is able to successfully perform live and synchronized
measurement of EP signals, skin hydration, and skin temperature. The three different
types of EP measured in these trials are Electrocardiogram (ECG), Electromyogram
(EMG), and Electroencephalogram (EES). Placements of the ESS to measure each
type of signal, as well as example measurements, are displayed in Figure 15.

30
Figure 15: Example EP Measurements. a-b) EKG Measurement on the chest. c-d) EMG
measurements corresponding to different grip forces. e-f) EEG taken on the forehead.
In each experiment, both the ESS EP terminals and conventional Ag/AgCl electrodes
were connected to a small portable amplifier (AvatarEEG) with a common ground. For
the three terminals of the ESS, the middle terminal served as the ground, while the right
and left terminals served as the measurement and reference electrodes for bipolar
measurement, respectively. Signals recorded were processed using a Principle

31
Component Analysis based algorithm [36]. The measurement of ECG shows that both
ESS and conventional electrodes are able to capture the characteristic features used in
modern heart care. The measurement of EMG was performed at different levels of
exertion, specifically the grip force of the hand vs the flexor muscles of the forearm, and
was found to be able to differentiate between these two states with a corresponding
increase in amplitude of muscle EMG. Finally, EEG was measured by placing the ESS
and conventional electrodes on the forehead, with references placed behind the right
ear on the mastoid bone. The signals were high and low-pass filtered at 0.1Hz and 40
Hz respectively. Standard Fast Fourier transformations (FFT) were used to generate
frequency spectrums of the signal. Using this method, the matchup between the EEG
captured by the ESS and the conventional electrodes are virtually identical, proving the
new design’s ability to capture EEG while also being much softer and more conformable
than traditional electrodes.
Additional tests were performed to prove the effectiveness of the Resistance
Temperature Device (RTD), the dot-ring hydration sensors, and the aluminum coil. The
results of these tests are displayed in brief in Figure 15. Overall, the device proved
capable of measuring all parameters equal to or better than traditional methods. This
proves the cut-and-paste manufacturing process to be a novel and useful method for
manufacture of thin-film electronics for use in experimentation, with possible expansion
to market production.

32
Section 4: Quantification of Forearm-Hand Muscle Dynamics and Fatigue Using
Non-Restrictive Measurement Devices
The study of electromyography is a field of human biology that still harbors much
potential. The first successful measurement of EMG was made in 1850 by Étienne-
Jules Marey, and significant advances in the field have been made since. Yet compared
to ECG or EEG, EMG has proven significantly harder to quantify, due to its irregular
nature and variability from patient to patient. In this section, a new method is introduced
based on Autoregressive Moving Average modeling with exogenous inputs (ARMAX) to
quantify fatigue of a muscle by studying the relationship between the inputs and outputs
of a muscle system, specifically the interaction between the flexor muscles of the
forearm and the gripping force of the associated hand (referred to as Hand Grip Force
or HGF). By measuring how the relationship changes over time, it is possible to
accurately plot the change in muscle dynamics corresponding to fatigue, independent of
any errors caused by human interaction.
The primary motivation for using a model based analysis versus a traditional signal
based analysis is that a signal based analysis assumes that the inputs and outputs are
both stationary, which is not true during fatigue of the muscle. As detailed in Section
4.2, users are asked to perform maximum voluntary contraction (MVC) of the forearm
muscle during data gathering, both to induce fatigue and to serve as a baseline with
qualitatively obvious indication of fatigue. In an ideal scenario, the subject would be able
to provide MVC for the entirety of the experiment. In reality however, subject discomfort
during the experiment can cause the subject to loosen their grip, producing sub-MVC
EMG and HGF results. In the case of a traditional approach, a dip in HGF or a decrease

33
in EMG activity could be both improperly evaluated as a sign of fatigue, when actually it
is just due to the user input changing. The ARMAX model based approach to forearm
performance monitoring is robust to this problem, because it quantifies the change in
the relationship between the two signals, rather than the signals themselves. This
allows the model to self-correct when inputs are changed, because if no degradation or
fatiguing occurred the corresponding outputs will change as well but in a way that the
relationship between the two remains the same. Thus, we propose that the following
methods are a novel and robust method to use to measure fatigue in a muscle-force
system.
Section 4.1: Sensor Design
Due to the nature of muscles to move during contraction and extension, a stretchable
sensor was designed to capture EMG signals based on the Cut-and-Paste technology
described in Section 3. This new design is shown in Figure 16, both stand-alone and on
the target arm muscles under deformation.

34
Figure 16: Sun-type Electrode Design, device and deformation on skin.
The new design features two electrodes patterned in a radial “Sun” pattern, to increase
electrode surface area while maintaining stretchability and conformability. The
electrodes also each feature a snap-connector, which allows for easy connection of the
electrodes to a measurement device during data capture, either by snap-on wire
connectors or alligator clips. Tegaderm was chosen as the substrate for the device for
its skin-like qualities, good adhesion strength, and stretchability greater than needed for
muscle movement during testing. Testing done in Section 3 validates the stretchability
of our device, as it uses the same filamentary serpentine designs. The following
sections will demonstrate the importance of the electrode stretchability during capture of

35
muscle EMG. The stretchability allows both more conformal contact for truer EMG
measurements, and also does not constrain the muscle during movement in order to
capture the truest possible free muscle dynamics for study.
Section 4.2: Experimental Setup and Procedures
As stated previously, all experiments performed in this Section deal with the interaction
between the subject’s dominant hand, and the corresponding forearm flexor muscles.
Data for forearm EMG was collected by our Sun patch described in Section 4.1, with a
ground Ag/AgCl electrode placed elsewhere on the body. The electrodes are
connected to a portable amplifier (AvatarEEG) for data collection. The HGF data is
collected by a modular data collection device (Neulog) which has a bar-shaped hand
dynamometer, which is squeezed to perform the measurements. A signal generator was
used to produce pulse signals with frequency of 100 mHz, which were fed into both the
amplifier and the modular device to serve as timing signals for synchronization of the
two data sets. An example of the arm setup and a sample data set is displayed in
Figure 17.

36
Figure 17: Sun-type Electrode on Arm with Hand Grip Device, and Example Measurement
Outputs

37
During all tests, the subject was asked to perform Maximum Voluntary Contraction
(MVC) hand grips, to best induce fatigue and to provide a baseline force to produce. All
EMG samples were collected at a sampling rate of 1000 Hz, in order to fully capture the
dynamics of the muscle (which are between 50-400 Hz) [37]. All HGF samples are
collected at sampling rate of 100 Hz, then up-sampled using sync interpolation to create
an effective sampling rate of 1000 Hz, in order to synchronize with the EMG samples.
While no new information is created by up-sampling the data, it allows synchronization
without down-sampling EMG, which would cause loss of information in the muscle
signals. Subjects tested were all healthy adult males, ages 20-23.
The relationship between forearm EMG and HGF is modeled using ARMAX models. An
ARMAX model is a linear model of the form found in Equation 6.
X1t= Φ11X1t-1 + … + Φ1nX1t-n + a1t + θ11a1t-1+…+ θ1ma1t-m+ Φ22X2t-1+…+ Φ2kX2t-k (6)
In Equation 6, the X1(t-i) denotes the output at time t-i, X2(t-i) denotes an input at time t-i,
a1(t-i) denotes normally-distributed white noise associated with input X1, and Φab and θ
ab are constants. Solving for the coefficients of this model allows for prediction of output
at time t given the output values at time (t-1) to (t-m) and input values from time (t-1) to
(t-k), where m and k are lags set by the operator. Thus this method can be applied to a
data sample to return a “predicted” sample set, which is then compared to the real data
to track changes in system dynamics. In this Thesis, we use the Kullback-Leibler
divergence test to quantify the change in muscle dynamics as the muscle fatigues. In-
depth explanation of the algorithm used by this study can be found in the MS by Y. Xie
[38].

38
In all tests, the base ARMAX model was built using the first 10 seconds of the EMG –
HGF data, and then its modeling errors were evaluated in a series of successive non-
overlapping 10 second windows to gather the Fatigue Index values of each window.
Measurements in each test were of one of two different types: Fatiguing Measurements
(FM) and Recovery Measurements (RM). Fatiguing Measurements lasted 2 minutes,
producing a set of 12 windows. In addition, due to their lengths and the requirement to
maintain MVC, FM’s also had the effect of fatiguing the muscle involved, meaning no
additional exercise of the muscle is necessary to achieve fatigue state. Recovery
Measurements last 10 seconds each, producing a single window to evaluate the RM’s
performance relative to the original fatigue model. The reason for the brevity of these
experiments is to avoid additional fatiguing of the muscle; RM’s are utilized to track the
recovery of a previously-fatigued muscle over time, so avoidance of additional fatigue
that may affect results is critical.
Subjects are asked not to exercise or otherwise exert their arm for a full 24 hours prior
to testing. During experimental trials, subject is allowed to rest in between data
measurements and disconnected from data gathering devices, but both the Sun and
conventional electrodes remain on the arm for the duration of the testing period. Fresh
electrodes are placed directly over the forearm flexor muscles at the beginning of
testing. An additional conventional electrode is placed elsewhere on the body, usually
the opposite arm or the leg, to serve as a common ground. Each set of EMG data
produces its own ARMAX model, and is only compared to that ARMAX model to
determine fatigue. Thus, inherent differences in electrode design or placement would

39
not affect fatigue values within each measurement, as there is no cross-referencing of
models.
Section 4.3: Results and Discussion
In this section, various tests are performed to gauge the effectiveness of the ARMAX
modeling strategy for quantifying forearm flexor muscle fatigue, and also to compare the
results between Conventional and Sun type electrodes to determine if significant
differences in data quality and modeling is present between the two types.
The goal of the first test is to measure the process of fatigue, then track the recovery of
the arm back to its initial state. The test subject was asked to perform one Fatiguing
Measurement (FM), followed by a Recovery Measurement (RM) every 10 minutes until
all arm soreness had dissipated. The results are present in Figure 18.
Figure 18: Fatigue and Recovery of Forearm Muscle for Sun-type Electrodes
As can be seen in the figure, the Sun EKG produced an expected FM curve, which
begins at no fatigue and quickly rises as the experiment continues and the subject’s arm
2 10 20 30 40 50 60 70 80 90
Time (min)
40
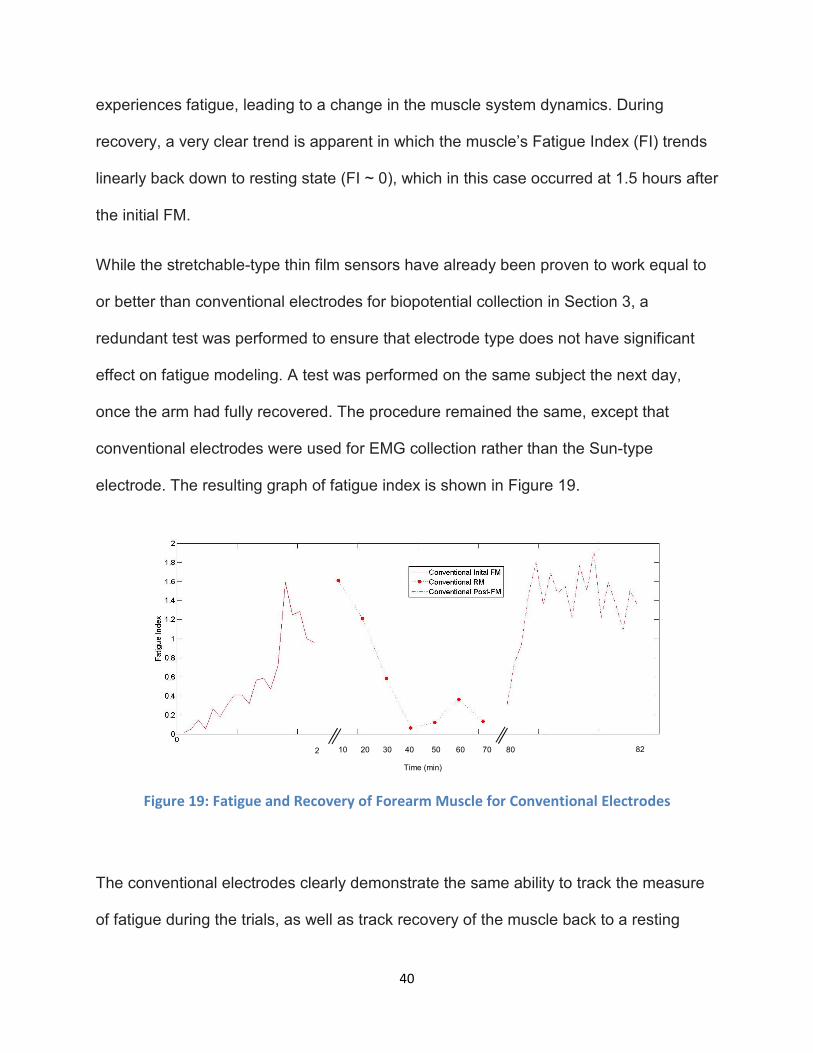
experiences fatigue, leading to a change in the muscle system dynamics. During
recovery, a very clear trend is apparent in which the muscle’s Fatigue Index (FI) trends
linearly back down to resting state (FI ~ 0), which in this case occurred at 1.5 hours after
the initial FM.
While the stretchable-type thin film sensors have already been proven to work equal to
or better than conventional electrodes for biopotential collection in Section 3, a
redundant test was performed to ensure that electrode type does not have significant
effect on fatigue modeling. A test was performed on the same subject the next day,
once the arm had fully recovered. The procedure remained the same, except that
conventional electrodes were used for EMG collection rather than the Sun-type
electrode. The resulting graph of fatigue index is shown in Figure 19.
Figure 19: Fatigue and Recovery of Forearm Muscle for Conventional Electrodes
The conventional electrodes clearly demonstrate the same ability to track the measure
of fatigue during the trials, as well as track recovery of the muscle back to a resting
2 10 20 30 40 50 60 70 80 82
Time (min)

41
state. Based on these data, we can justify that the Sun-Type stretchable sensor
performs comparably to conventional electrodes for fatigue monitoring. With this
knowledge, the Sun-Type was used for our remaining tests, as it provided better
durability and more comfort for the test subject when compared to conventional
electrodes. Further analysis between Sun-type and conventional electrodes pertaining
to modeling quality is pursued later in this section.
In order to observe the effects of muscle fatigue on a sustained trial, another experiment
is performed. The subject begins fully rested, and is then asked to perform an FM trial.
At 10 and 20 minutes afterwards, the subject performs one RM trial. Finally at 30
minutes after the initial FM, the subject performs another FM trial. This second FM
begins while they are still fatigued from the initial FM trial, based on previous
observations with the same subject and subjective confirmation by the subject on arm
soreness. The resulting data is contained in Figure 20.
Figure 20: Fatigue and Partial-Recovery of Forearm Flexor Muscle The results for this experiment follow the expected pattern set by our initial fatigue and
recovery trials. The arm begins at a rested state, and fatigues over the course of the
2 10 20 30 32
Time (min)

42
first FM. During recovery, we clearly visualize a steady downward trend, which if
continued would lead back to resting state, similar to the results of Figure 17. The
second FM measurement begins where the next RM would have been, validating its
initial state. However due to the exertion caused by the second RM, the fatigue quickly
explodes from that point to beyond the initial FM fatigue. These experimental trials
ensure that the FM measurements taken at the “rested” states are indeed distinct from
those taken during recovery, and as such can be used to measure and quantify rate of
fatigue during muscle exertion.
To test the repeatability of the recovery mechanism, a third series of testing is
performed. In this test, the subject begins fully rested. A single FM trial is then
performed. Every 10 minutes after the initial FM trial, an RM trial is performed, repeating
until the subject expresses no soreness in the testing muscles. At that point, another FM
is performed. Following this second FM, RM trials are performed every 10 minutes
similar to before, again until no soreness is felt within the muscle. Finally, a last FM trial
is performed. The results of this trial can be viewed in Figure 21.
Figure 21: Repeated Fatigue and Recovery of Forearm Flexor Muscles
2 92 94 184 186
Time (min)

43
The repeatability of the muscle is very apparent in the measurements, where each cycle
of FM begins at the same rested state, and increases up to a similar limit. as fatigue is
induced. This shows that the Fatigue Index method is reliable for long-term
measurements involving multiple fatigue states, and is not dependent on previous
results. To investigate further into any potential differences between Sun-Type and conventional
electrodes, the ARMAX models used in the fatigue modeling are analyzed.
Representative samples are selected and the ARMAX model used for each of the Sun
and Conventional data was extracted and tested versus its constituent data. The validity
of the model was determined using a correlation of residuals between the inputs and the
outputs, as well as an autocorrelation of the residuals of the output. In an ideal case for
ARMAX modeling, the residuals will be independent of one another, and the correlation
will be zero in all cases. Alpha was selected as 2%, and the residuals are plotted in
Figure 22.
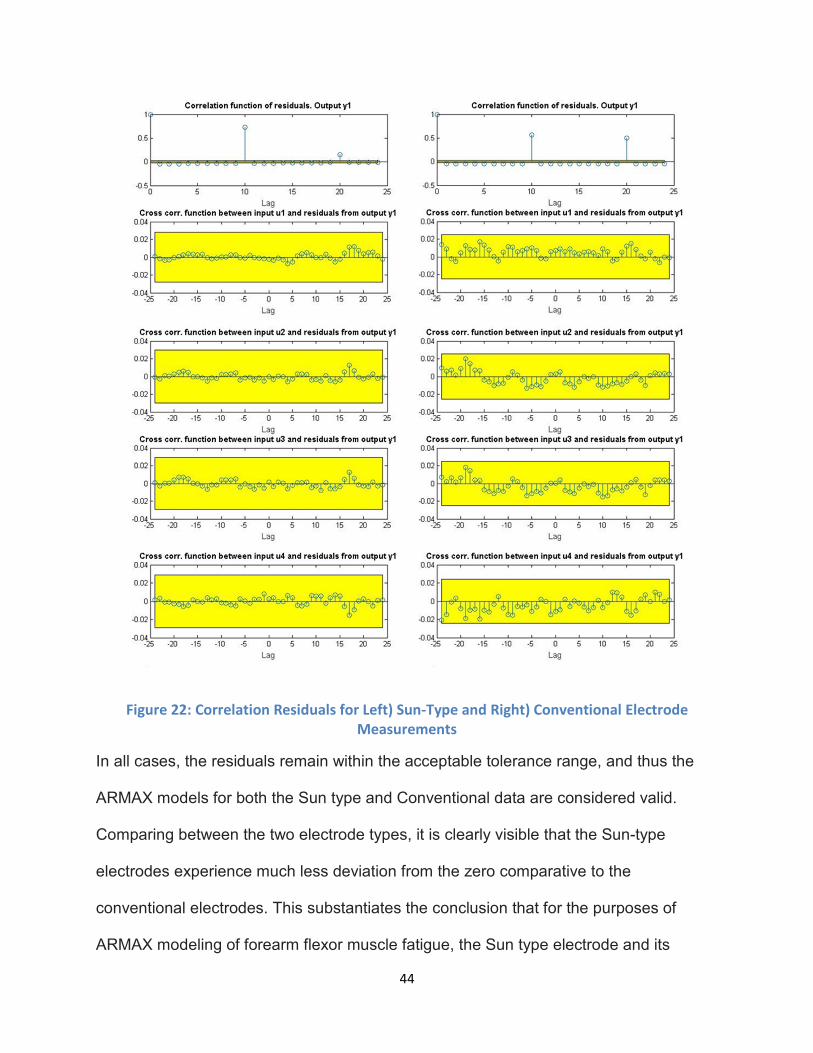
44
Figure 22: Correlation Residuals for Left) Sun-Type and Right) Conventional Electrode
Measurements
In all cases, the residuals remain within the acceptable tolerance range, and thus the
ARMAX models for both the Sun type and Conventional data are considered valid.
Comparing between the two electrode types, it is clearly visible that the Sun-type
electrodes experience much less deviation from the zero comparative to the
conventional electrodes. This substantiates the conclusion that for the purposes of
ARMAX modeling of forearm flexor muscle fatigue, the Sun type electrode and its

45
unique stretchability and conformability properties is superior to conventional Ag/AgCl
electrodes.

46
Section 5: Conclusion
In conclusion, the field of stretchable electronics has much room to grow and innovate,
and the methodology and results demonstrated in this paper have advanced the
capabilities of the field. This paper both introduces a new method of manufacturing
stretchable sensors, and a novel use for stretchable sensors in muscle monitoring.
A novel Cut-and-Paste manufacturing method has been developed and investigated for
the purpose of producing stretchable electronics. The limits of the manufacturing
process have been investigated and tested, including multiple different materials for
both the device and the substrate. The versatility of the manufacturing method is
demonstrated with the production of a wide variety of sensors, including EP, skin
temperature, skin hydration, and strain sensors. Ultimately, the devices produced from
the Cut-and-Paste manufacturing method are proven to operate as well or better than
conventional devices of the same kind, while also being much quicker and cheaper to
produce than traditional microfabrication. Overall the Cut-and-Paste manufacturing
method serves to improve research and industry when it comes to producing
stretchable sensors.
As a demonstration of the stretchable sensors we produced, the ability to quantify
muscle fatigue, particularly the forearm flexor muscles during hand gripping, was
investigated. Data of both forearm EMG and corresponding hand grip force were
collected and modeled using an ARMAX model system, in order to analyze the
relationship between the two parameters. Both a stretchable Sun design electrode and
conventional Ag/AgCl electrodes were used in order to compare the performance

47
between the two types of electrodes. The Kullback-Leibler Divergence test was used to
quantify the change in muscle-force dynamics indicating fatigue. Several tests were
performed, during which both fatigue and recovery of the muscle was tracked and
demonstrated. In all cases, the Sun electrode provided useful and obvious trends to
measure fatigue. Analysis of the ARMAX model was also performed by using
correlation of residuals, and found the Sun type model to be more valid than the
corresponding Conventional model.
In summary, stretchable electronics are a valid and useful tool in physiological research,
and the manufacturing and testing methods demonstrated in this paper provide a novel
and useful approach to using stretchable electronics in innovative research applications.

48
References
1. Gilleo, K. (1998). Handbook of Flexible Circuits (1992 ed.). New York, NY:
Springer.
2. Harris, K. D., Elias, A. L., & Chung, H. J. (2016). Flexible electronics under strain:
A review of mechanical characterization and durability
enhancement strategies. Journal of Materials Science, 51(6), 2771-
2805. http://dx.doi.org/10.1007/s10853-015-9643-3
3. Park, S., Vosguerichian, M., & Bao, Z. (2013). A review of fabrication
and applications of carbon nanotube film-based flexible
electronics. Nanoscale, 5(5), 1727-1752. http://dx.doi.org/10.1039/ c3nr33560g
Published:2013
4. Lipomi, D. J., & Bao, Z. (2011). Stretchable, elastic materials and devices
for solar energy conversion. Energy & Environmental Science, 4(9), 3314-
3328. http://dx.doi.org/10.1039/c1ee01881g
5. Sekitani, T., & Someya, T. (2010). Stretchable, large-area organic
electronics. Advanced Materials, 22(20), 2228-2246.
http://dx.doi.org/10.1002/adma.200904054
6. Benight, S. J., Wang, C., Tok, J. B. H., & Bao, Z. (2013). Stretchable and self-
healing polymers and devices for electronic skin. Progress in
Polymer Science, 38(12), 1961-1977.
http://dx.doi.org/10.1016/j.progpolymsci.2013.08.001

49
7. Xiang, Y., T, L., Suo, Z., & Vlassak, J. (2005). High ductility of a metal
film adherent on a polymer substrate. Applied Physics Letters, 87(16).
http://dx.doi.org/10.1063/1.2108110
8. Li, T., & Suo, Z. (2006). Deformability of thin metal films on elastomer
substrates. International Journal of Solids and Structures, 43(7-8), 2351-2363.
http://dx.doi.org/10.1016/j.ijsolstr.2005.04.034
9. Suo, Z., Ma, E., Gleskova, H., & Wagner, S. (1999). Mechanics of rollable and
foldable film-on-foil electronics. Applied Physics Letters, 74(8), 1177-1179.
http://dx.doi.org/10.1063/1.123478
10. Yao, S., & Zhu, Y. (2015). Nanomaterial-enabled stretchable conductors:
strategies, materials and devices. Advanced Materials, 27(9), 1480-1511.
http://dx.doi.org/10.1002/adma.201404446
11. Sun, Y., & Rogers, J. A. (2007). Structural forms of single crystal semiconductor
nanoribbons for high-performance stretchable electronics. Journal of Materials
Chemistry, 17(9), 832-840.
12. Lu, N., & Yang, S. (2015). Mechanics for stretchable sensors. Current Opinion in
Solid State & Materials Science, 19(3), 149-159.
http://dx.doi.org/10.1016/j.cossms.2014.12.007
13. Cheng, T., Zhang, Y., Lai, W.-Y., & Huang, W. (2015). Stretchable thin film
electrodes for flexible electronics with high deformability and
stretchability. Advanced Materials, 27(22), 3349-3376.
http://dx.doi.org/10.1002/adma.201405864

50
14. Arumugam, V., Naresh, M., & Sanjeevi, R. (1994). Effect of strain-rate on the
fracture-behavior of skin. Journal of Biosciences, 19(3), 307-313.
http://dx.doi.org/10.1007/BF02716820
15. McGrath, J. A., Eady, R. A., & Pope, F. M. (2004). Rook's textbook of
dermatology (7th ed.). Blackwell.
16. Yamamoto, T., & Yamamoto, Y. (1976). Electrical properties of the epidermal
stratum corneum. Medical and Biological Engineering, 14(2), 151-158.
http://dx.doi.org/10.1007/BF02478741
17. Cram, J., & Rommen, D. (1989). Effects of skin preparation on data collected
using an EMG muscle-scanning procedure. Biofeedback and Self-Regulation,
14(1), 75-82. http://dx.doi.org/10.1007/BF00999342
18. Smith, C. M., Housh, T. J., Herda, T. J., Zuniga, J. M., Ryan, E. D., Camic, C. L.,
...Johnson, G. O. (2015). Effects of the innervation zone on the time and
frequency domain parameters of the surface electromyographic signal. Journal of
Electromyography and Kinesiology, 25(4), 565-570.
19. Yeo, W.-H., Kim, Y.-S., Lee, J., Ameen, A., Shi, L., Li, M., . . . Rogers, J. A.
(2013). Multifunctional epidermal electronics printed directly onto the
skin. Advanced Materials, 25(20), 2773-2778.
http://dx.doi.org/10.1002/adma.201204426
20. Coupin, H. (1901). On the toxicity of compounds of silver, mercury, gold,
platinum and palladium. Comptes Rendus Des Seances De La Societe De
Biologie Et De Ses Filiales, 53, 509-510.

51
21. Edwards, R. H. T. (1981). Human muscle function and fatigue. Chichester, UK:
John Wiley & Sons. http://dx.doi.org/10.1002/9780470715420.ch1
22. Enoka, R. M., & Duchateau, J. (2008). Muscle fatigue: What, why and how it
influences muscle function. Journal of Physiology - London, 586(1), 11-23.
http://dx.doi.org/10.1113/jphysiol.2007.139477
23. De Luca, C. (1984). Myoelectrical manifestations of localized muscular fatigue in
humans. CRC Critical Reviews in Biomedical Engineering, 11(4), 251-279.
24. Cifrek, M., Medved, V., Tonkovic, S., & Ostojic, S. (2009). Surface EMG based
muscle fatigue evaluation in biomechanics. Clinical Biomechanics, 24(4), 327-
340. http://dx.doi.org/10.1016/j.clinbiomech.2009.01.010
25. Hagg, G. (1981). Electro-myographic fatigue analysis based on the number of
zero crossings. Pflugers Archiv-European Journal of Physiology, 391(1), 78-80.
http://dx.doi.org/10.1007/BF00580699
26. Roy, S., De Luca, C., Snydermackler, L., Emley, M., Crenshaw, R., & Lyons, J.
(1990). Fatigue, recovery, and low back pain in varsity rowers. Medicine and
Science in Sports and Excercise, 22(4), 463-469.
27. Paiss, O., & Inbar, G. (1987). Autoregressive modeling of surface EMG and its
spectrum with application to fatigue. IEEE Transactions on Biomedical
Engineering, 34(10), 761-770. http://dx.doi.org/10.1109/TBME.1987.325918
28. Merletti, R., & Loconte, L. (1995). Advances in processing of surface myoelectric
signals. Medical & Biological Engineering & Computing, 33(3), 362-372.

52
29. Cifrek, M., 1997. Myoelectric Signal Analysis during Dynamic Fatigue. Ph.D.
Dissertation. University of Zagreb, Faculty of Electrical Engineering and
Computing (in Croatian).
30. Korosec, D. (1999). Continuous time-varying autoregressive spectrum for
assessment of fatigue induced changes in SEMG signals. Engineering in
Medicine and Biology, 1.
31. Knaflitz, M., & Bonato, P. (1999). Time–frequency methods applied to muscle
fatigue assessment during dynamic contractions. Journal of Electromyography
and Kinesiology, 9(5), 337-350. http://dx.doi.org/10.1016/S1050-6411(99)00009-
7
32. Lu, N., Wang, X., Suo, Z., & Vlassak, J. (2007). Metal films on polymer
substrates stretched beyond 50%. Applied Physics Letters, 91(22).
http://dx.doi.org/10.1063/1.2817234
33. Seitz, H., Marlovits, S., Schwendenwein, I., Muller, E., & Vecsei, V. (1998).
Biocompatibility of polyethylene terephthalate (Trevira (R) hochfest)
augmentation device in repair of the anterior cruciate ligament.
Biomaterials, 19(1-3), 189-196. http://dx.doi.org/10.1016/S0142-9612(97)00201-
9
34. Jeong, J.-W., Yeo, W.-H., Akhtar, A., Norton, J. J. S., Kwack, Y.-J., Li, S.,
...Rogers, J. A. (2013). Materials and optimized designs for human-machine
interfaces via epidermal electronics. Advanced Materials, 25(47), 6839-6846.
http://dx.doi.org/10.1002/adma.201301921

53
35. Widlund, T., Yang, S., Hsu, Y.-Y., & Lu, N. (2014). Stretchability and compliance
of freestanding serpentine-shaped ribbons. International Journal of Solids and
Structures, 51(23-24), 4026-4037.
36. Miranda de Sa, A. M. F. L., de Seixas, J. M., Costa, J. D., Jr, Ferreira, D. D., &
Cerqueira, A. S. (2015). A principal component-based algorithm for denoising in
single channel data (PCA for denoising in single channel data).
Measurement, 60, 121-128.
http://dx.doi.org/10.1016/j.measurement.2014.09.079
37. Viitasalo, J., & Komi, P. (1977). Signal characteristics of EMG during fatigue.
European Journal of Applied Physiology and Occupational Physiology, 37(2),
111-121. http://dx.doi.org/10.1007/BF00421697
38. Xie, Y. (2016). A model based approach for evaluating human
neuromusculoskeletal system performance (Unpublished master's thesis).
University of Texas at Austin, Austin, TX.