ltl freight rate benchmarking finding certainty in ......cwt estimated market cwt total reported...
TRANSCRIPT
1 Confidential
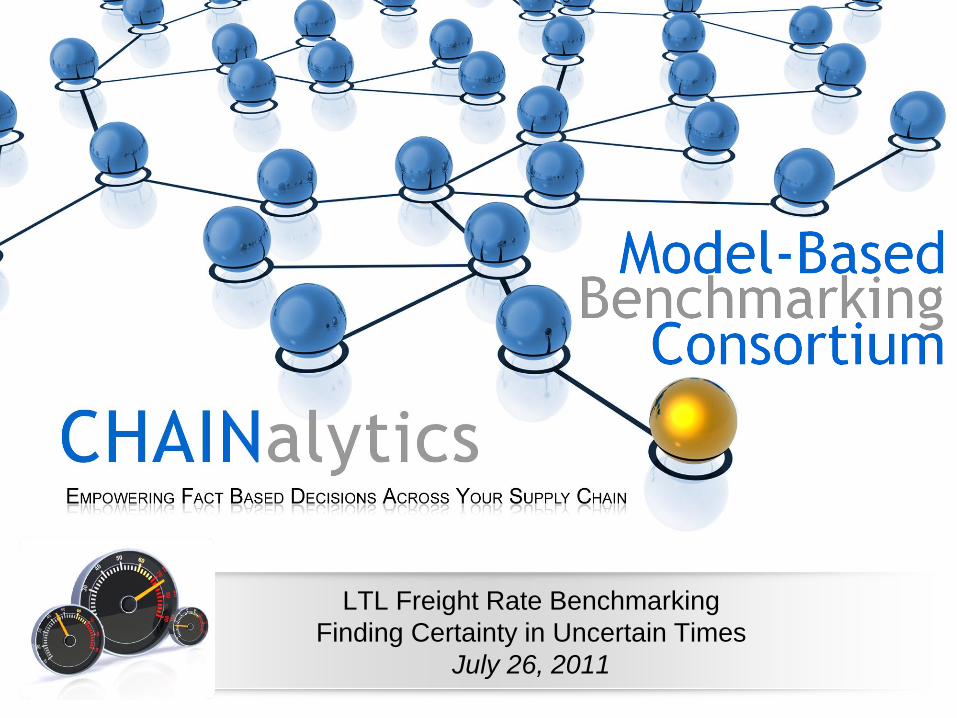
LTL Freight Rate Benchmarking
Finding Certainty in Uncertain Times
July 26, 2011

2 Confidential
Agenda
Opening Remarks and Chainalytics Overview
Model-Based Benchmarking – What we do
- Our approach to a complicated freight market
- Highlights from recent model
- Deliverables overview
LTL Benchmarking
Q&A
3 Confidential
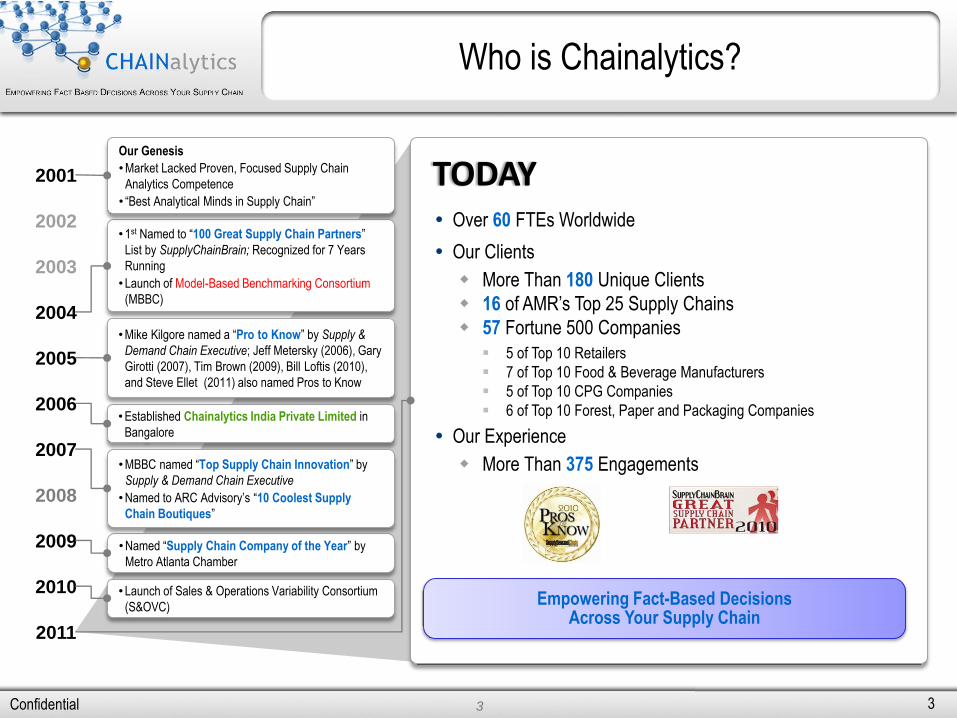
Who is Chainalytics?
3
Over 60 FTEs Worldwide
Our Clients
More Than 180 Unique Clients
16 of AMR’s Top 25 Supply Chains
57 Fortune 500 Companies
5 of Top 10 Retailers
7 of Top 10 Food & Beverage Manufacturers
5 of Top 10 CPG Companies
6 of Top 10 Forest, Paper and Packaging Companies
Our Experience
More Than 375 Engagements
TODAY
•1st Named to “100 Great Supply Chain Partners”
List by SupplyChainBrain; Recognized for 7 Years
Running
•Launch of Model-Based Benchmarking Consortium
(MBBC)
•Established Chainalytics India Private Limited in
Bangalore
•Named “Supply Chain Company of the Year” by
Metro Atlanta Chamber
2001
2002
2003
2004
2005
2006
2007
2009
2010
2011
•MBBC named “Top Supply Chain Innovation” by
Supply & Demand Chain Executive
•Named to ARC Advisory’s “10 Coolest Supply
Chain Boutiques”
2008
Our Genesis
•Market Lacked Proven, Focused Supply Chain
Analytics Competence
• “Best Analytical Minds in Supply Chain”
Empowering Fact-Based Decisions Across Your Supply Chain
•Launch of Sales & Operations Variability Consortium
(S&OVC)
•Mike Kilgore named a “Pro to Know” by Supply &
Demand Chain Executive; Jeff Metersky (2006), Gary
Girotti (2007), Tim Brown (2009), Bill Loftis (2010),
and Steve Ellet (2011) also named Pros to Know
4 Confidential
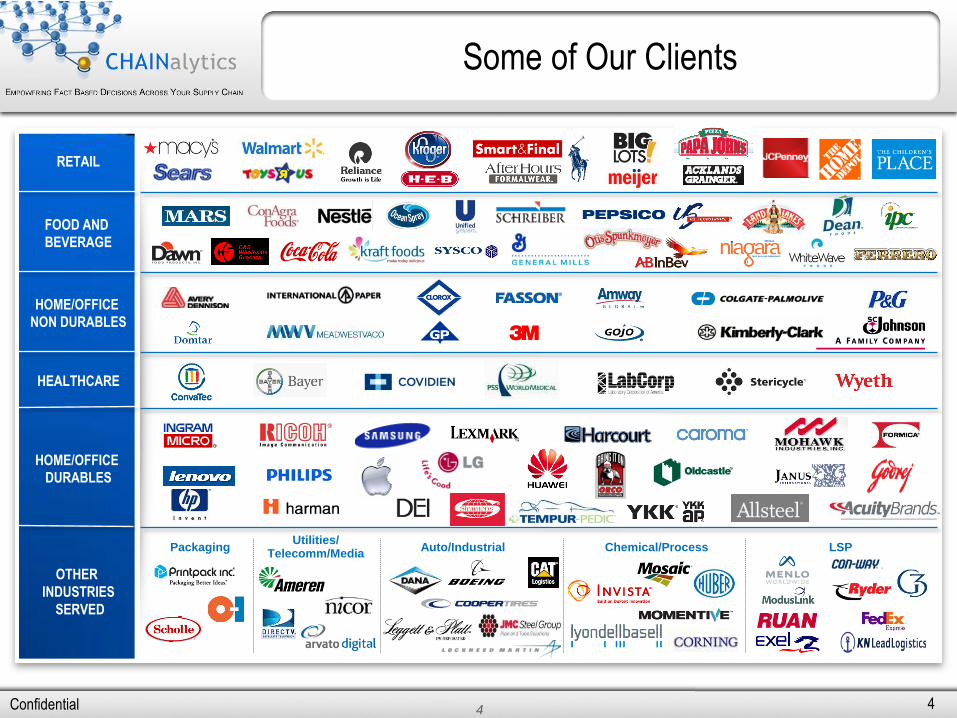
Some of Our Clients
4
FOOD AND
BEVERAGE
RETAIL
HOME/OFFICE
DURABLES
HEALTHCARE
HOME/OFFICE
NON DURABLES
LSP Chemical/Process Auto/Industrial Packaging Utilities/
Telecomm/Media
OTHER
INDUSTRIES
SERVED

5 Confidential
Demand (customer)
Transportation Distribution &
Inventory
Supply &
Manufacturing
How much
demand will we
generate?
At what service level can
we profitably satisfy
demand?
At what point in my
supply chain should I
decouple push vs..
pull? What is the
best flowpath?
How should we transport
product through the
supply chain?
What activities
should we
outsource?
How much and where
should inventory be
positioned in the supply
chain?
When should we buy or
make product to make
best use of capacity?
What infrastructure is
required for
manufacturing &
distribution?
Who is Chainalytics?
We Support Value-Driven Supply Chain Decisions
Model-Based
Benchmarking
Consortium:
100+ total members,
over $23B in global
freight spend.
6 Confidential
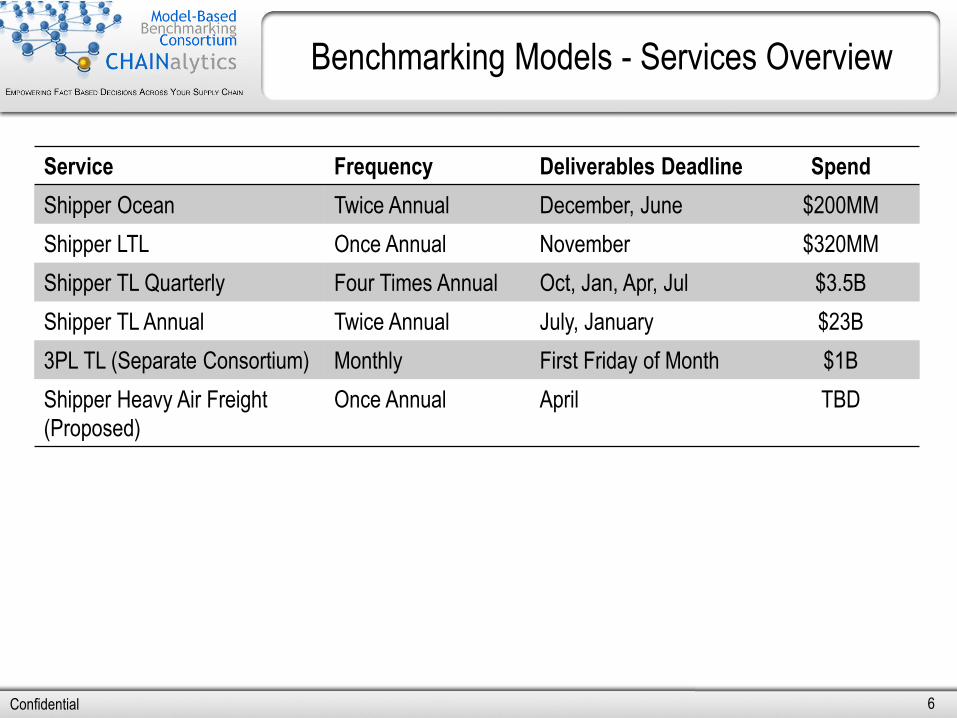
Benchmarking Models - Services Overview
Service Frequency Deliverables Deadline Spend
Shipper Ocean Twice Annual December, June $200MM
Shipper LTL Once Annual November $320MM
Shipper TL Quarterly Four Times Annual Oct, Jan, Apr, Jul $3.5B
Shipper TL Annual Twice Annual July, January $23B
3PL TL (Separate Consortium) Monthly First Friday of Month $1B
Shipper Heavy Air Freight
(Proposed)
Once Annual April TBD

7 Confidential
Opinion Poll
How Does Your Company Benchmark Transportation Costs?
(Choose one that best describes your company)
– Rely on carriers and service providers
– Compare with other shippers
– Measure against last year’s rates
– Research public information
– Don’t benchmark, or don’t know

8 Confidential
How do companies benchmark?
Chainalytics public webinar poll:
53%
14%
17%
8%
8%
13%
72%
9%
4%
2%
Measure against last year's rates
Compare with other shippers
Rely on carriers and serviceproviders
Research public information
Don't benchmark, or don't know
How Does Your Company Benchmark Transportation Costs?
MBBC Members Non-Members

9 Confidential
Why Benchmark?
• Comparing Year-over-year expenditures
internally
- Does not capture market movement
- Does not baseline for economic
environment
• Does not allow for uniqueness
• Shippers use Chainalytics MBBC to
measure against overall industry
- Validate uniqueness
- Validate process, procurement
- Understand market
- Understand consortium sentiment
10 Confidential
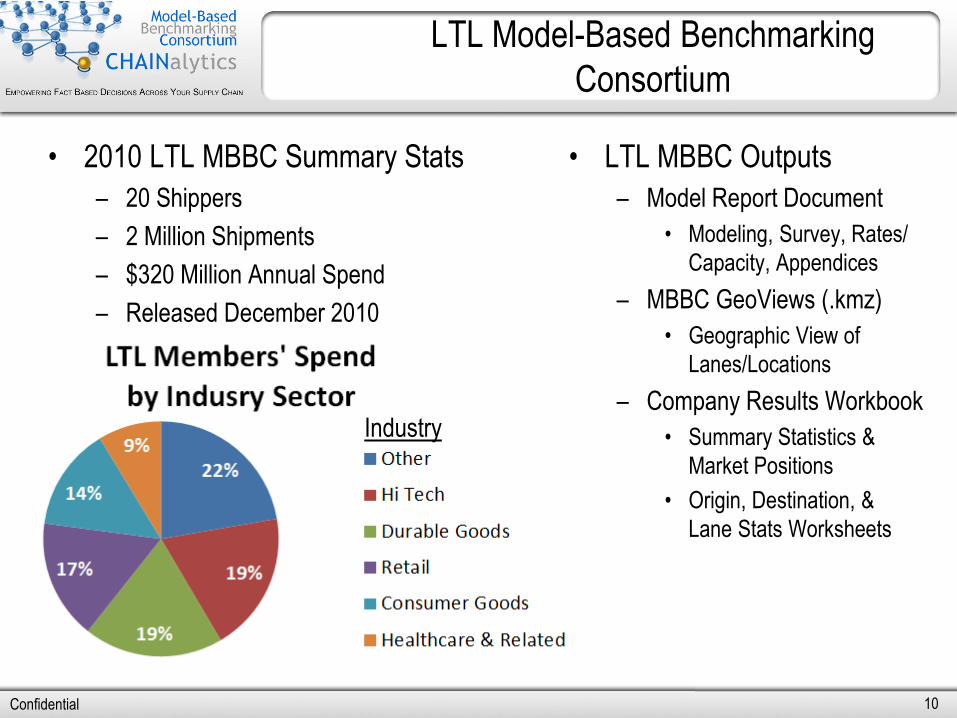
LTL Model-Based Benchmarking
Consortium
• 2010 LTL MBBC Summary Stats
– 20 Shippers
– 2 Million Shipments
– $320 Million Annual Spend
– Released December 2010
• LTL MBBC Outputs
– Model Report Document
• Modeling, Survey, Rates/
Capacity, Appendices
– MBBC GeoViews (.kmz)
• Geographic View of
Lanes/Locations
– Company Results Workbook
• Summary Statistics &
Market Positions
• Origin, Destination, &
Lane Stats Worksheets
Industry
11 Confidential
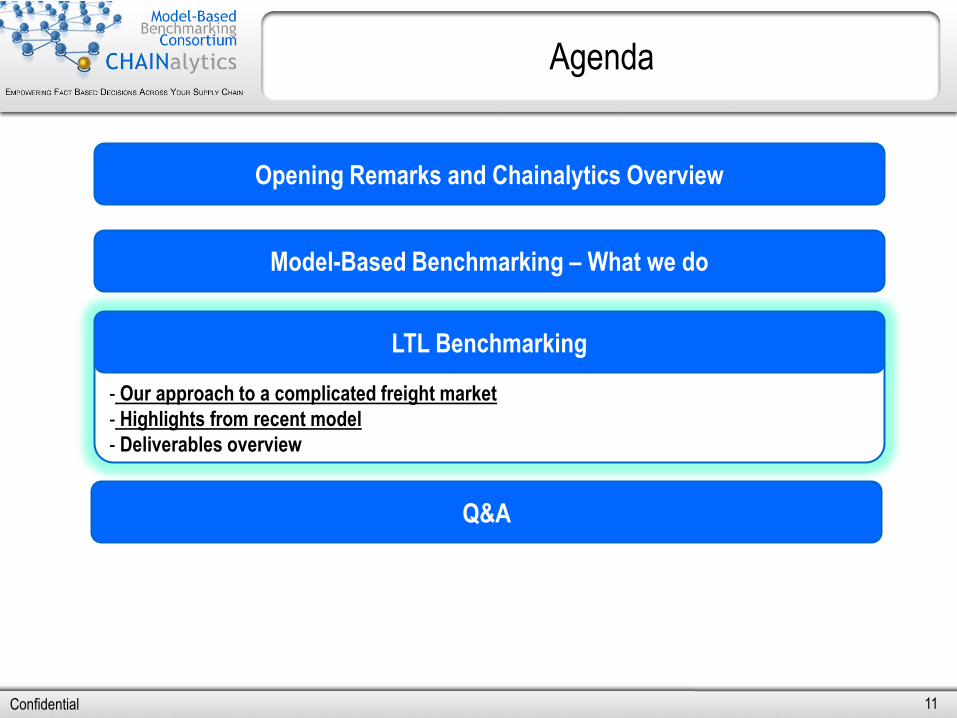
Agenda
Opening Remarks and Chainalytics Overview
Model-Based Benchmarking – What we do
- Our approach to a complicated freight market
- Highlights from recent model
- Deliverables overview
LTL Benchmarking
Q&A

12 Confidential
State of the Market
Operating ratio of largest 8 LTL carriers was 99.9 over the last 18 months
Similar drop in 2009 of revenues as TL – with growth in 2010 and early 2011.
Pricing per hundredweight rose between 2% and 8% among top carriers in 2010
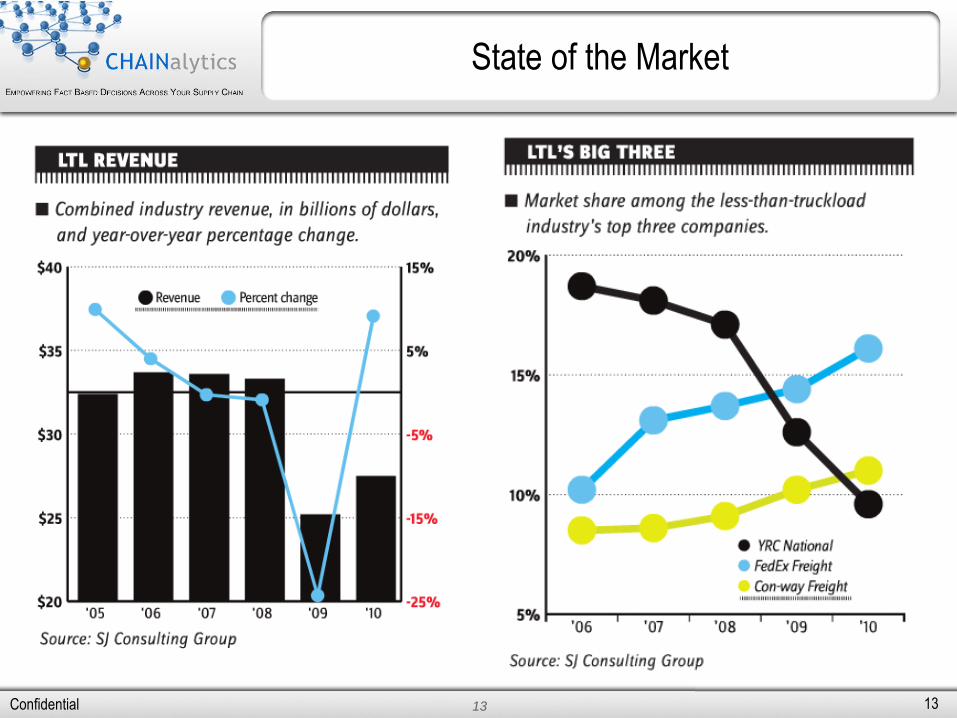
13 Confidential 13
State of the Market

14 Confidential
Why is LTL different than TL?
• The LTL market is much smaller than TL ($27B vs. ~$320B)
• LTL is a much more concentrated market than TL
– Top 25 LTL carriers = 88% of total LTL Revenues (top 6 = 50%)
– Top 25 TL carriers ≤ 10% of total TL Revenues
• While TL is mainly driven by distance, LTL is influenced by many factors that interact
with each other, such as:
– Freight Class
– Weight
– Distance
• Pricing is based off of different tariffs with a negotiated discount that can apply to all,
or portions, of a network
• Freight All Kinds (FAK) classification dominates and can obscure cost drivers

15 Confidential
• Historical shipment records from 20 firms
• Industries covered:
Retailers Construction & Materials
High Tech Healthcare / Medical Devices
CPG General Industrials
• Timeframe: July 2009 to June 2010
• Fuel Assumptions: $3.00 per gallon
– FSC median of 13.4% of linehaul
– Ranged from 6% to 23%
• Data Size (Tariff versus MinCharge)
2010 Model Approach & Results
Weight or Distance
Cos
t per
lb o
r m
ile
Min
Charge
Tariff
Rated
Shipments Weight Shipped Spend
Tariff Rated 1,622,726 2,361,485,545 $296,725,495
Minimum charge 420,959 123,603,564 $23,100,770
2,043,685 2,485,089,109 $319,826,264
16 Confidential
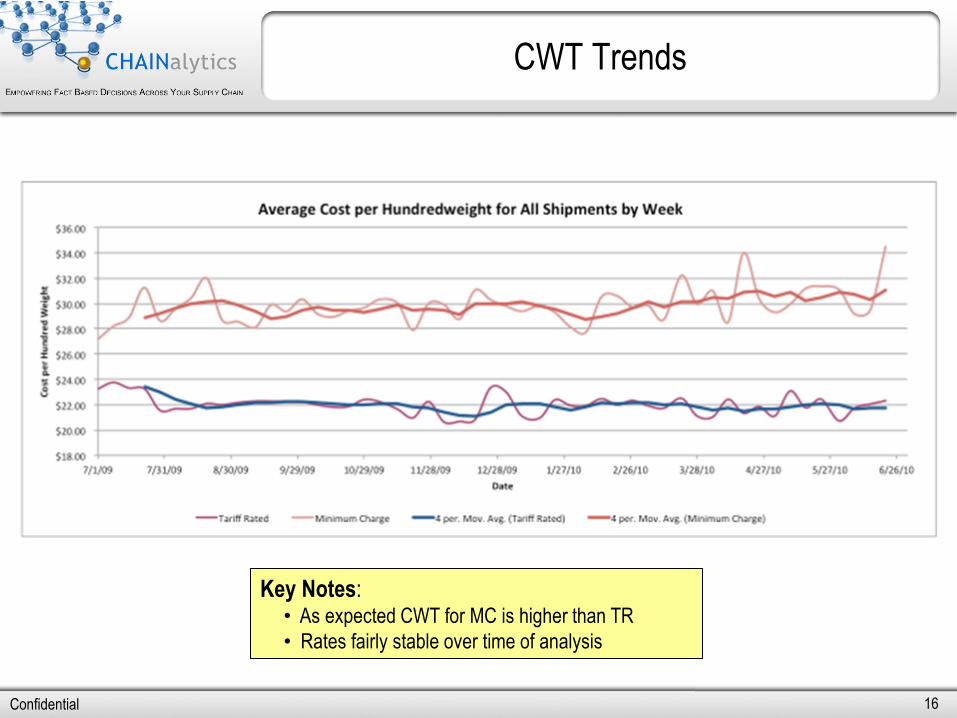
CWT Trends
Key Notes: • As expected CWT for MC is higher than TR
• Rates fairly stable over time of analysis

17 Confidential
LTL TR Model – Key Non-Linear Effects
$-
$5.00
$10.00
$15.00
$20.00
$25.00
- 500 1,000 1,500 2,000 2,500 3,000
Imp
act
on
Lin
eh
aul
($)
Distance in miles
Distance Effect
Distance Effect
$-
$50.00
$100.00
$150.00
$200.00
$250.00
- 1,000 2,000 3,000 4,000 5,000 6,000 7,000 8,000 9,000 10,000
Imp
act
on
Lin
eh
aul
($)
Weight in lbs
Weight Effect
Weight Effect
Key Notes: • Each factor tapers off at the extreme values
• Captures diminishing returns One more lb at 100 lbs is not same as one more lb at 1,000 lbs!

18 Confidential
Final LTL TR Model
Coefficients 95% Confidence Interval
Independent variables
B Std. Error t Sig. Lower Bound Upper Bound
(Constant) 42.360 .482 87.8 .000 41.415 43.306
distance .044 .000 125.3 .000 .043 .044
dist_sqr -1.32E-05 .000 -125.8 .000 -1.34E-05 -1.30E-05
weight .045 .000 317.2 .000 .045 .046
wgt_sqr -2.90E-06 .000 -509.1 .000 -2.91E-06 -2.89E-06
freight_class_actual .385 .005 81.0 .000 .375 .394
actclass_sqr -1.02E-03 .000 -92.1 .000 -1.04E-03 -9.97E-04
dist_wgt 2.98E-05 .000 222.3 .000 2.95E-05 3.00E-05
wgt_actclass 1.44E-04 .000 92.2 .000 1.41E-04 1.47E-04
dist_actclass -3.15E-05 .000 -15.8 .000 -3.54E-05 -2.76E-05
dist_wgt_actclass 4.47E-07 .000 283.2 .000 4.44E-07 4.50E-07
inv_ann_ib_vol_5dz 2.912 .378 7.7 .000 2.172 3.652
inv_ann_ob_vol_5dz 22.117 .694 31.8 .000 20.757 23.478
speed -.002 .000 -4.9 .000 -.002 -.001
Key Notes:
• Non-linear relationship for CPL and distance, weight, and freight class
• Interaction effects between distance, weight, and freight class
• Activity at the origin and destination has a slight impact on rates
• Speed of shipment has a slight impact on rates
• Geography has a very limited impact on LTL rates
Non-linear
(tapering) effects
for distance, weight,
and class
Interacting
(combined) effects
Between distance,
weight, and class
IB & OB
Volume effect
Speed (mi/day)
19 Confidential
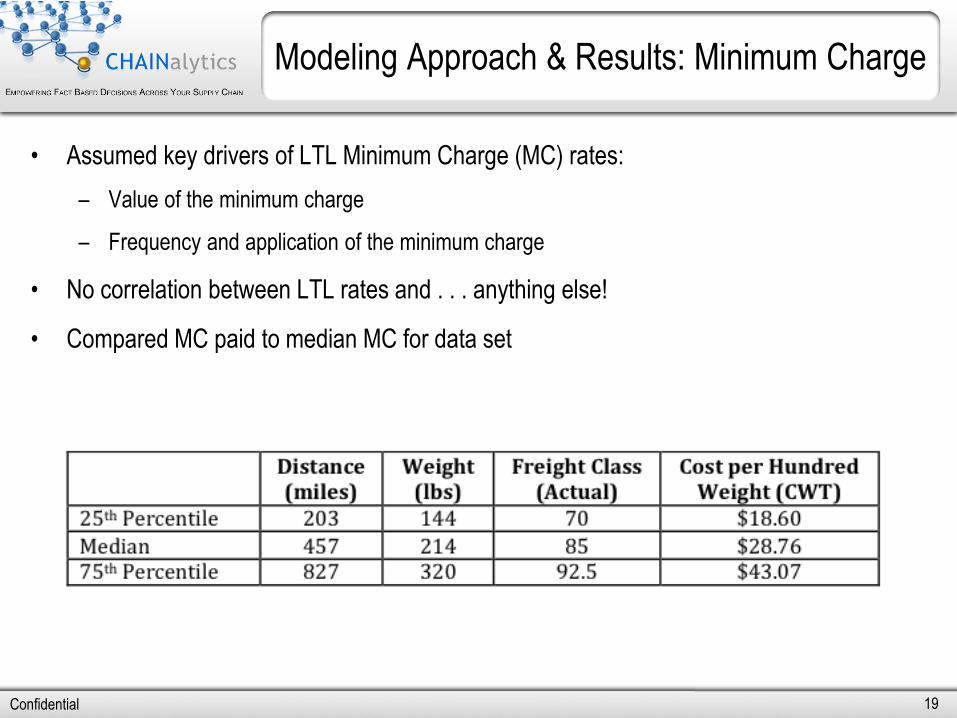
• Assumed key drivers of LTL Minimum Charge (MC) rates:
– Value of the minimum charge
– Frequency and application of the minimum charge
• No correlation between LTL rates and . . . anything else!
• Compared MC paid to median MC for data set
Modeling Approach & Results: Minimum Charge
20 Confidential
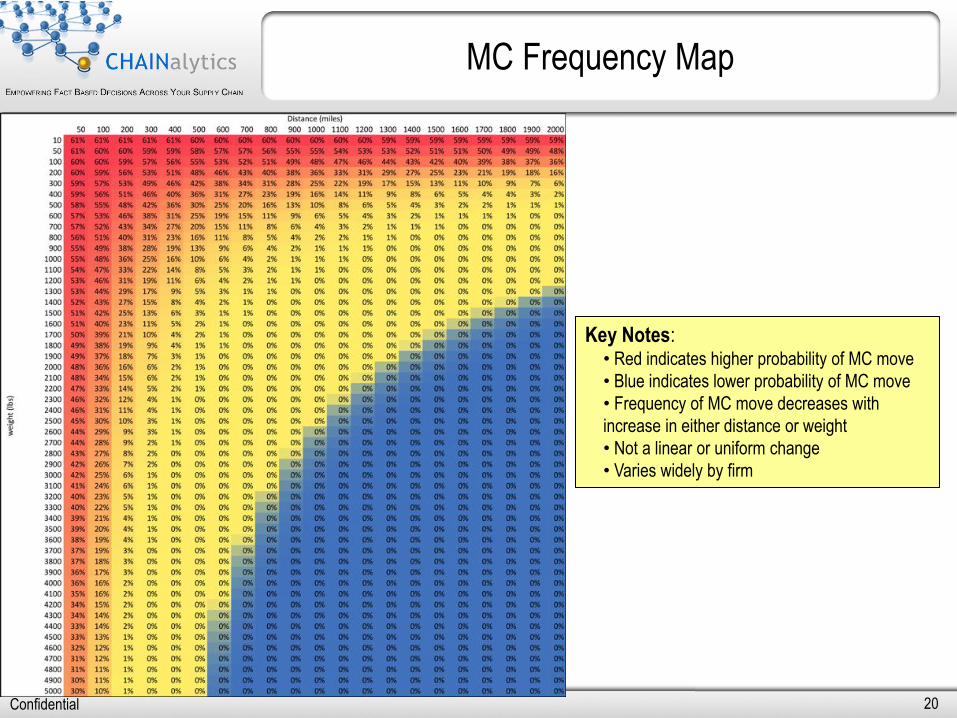
MC Frequency Map
Key Notes: • Red indicates higher probability of MC move
• Blue indicates lower probability of MC move
• Frequency of MC move decreases with
increase in either distance or weight
• Not a linear or uniform change
• Varies widely by firm
21 Confidential
Agenda
Opening Remarks and Chainalytics Overview
Model-Based Benchmarking – What we do
- Our approach to a complicated freight market
- Highlights from recent model
- Deliverables overview
LTL Benchmarking
Q&A

22 Confidential 22
Sample Summary Report

23 Confidential
Sample Detailed Lane Report
Firm_ID BU State
3 Digit
Zip
Number
Shipments
Total
Weight
Shipped
Average
Shipment
Weight
Average
Cost Per
Shipment
Less Than
77.5
Between 78
& 92.5
Between 93
& 100
Between 101
& 150Over 150
ACME ACME SYSTEMS TN 379 3,481 1,768,003 508 82$ 98% 1% 0% 0% 0%
ACME ACME SYSTEMS TX 751 2,918 3,509,524 1,203 134$ 100% 0% 0% 0% 0%
ACME ACME SYSTEMS TX 755 1,754 1,793,304 1,022 124$ 99% 0% 0% 1% 0%
ACME ACME SYSTEMS TX 760 1,509 2,219,784 1,471 134$ 99% 1% 0% 0% 0%
ACME ACME SYSTEMS TX 761 1,079 1,141,378 1,058 111$ 99% 0% 0% 0% 0%
ACME ACME SYSTEMS TX 765 303 108,145 357 66$ 100% 0% 0% 0% 0%
Actual Freight Class PercentagesShipment StatsOrigins
Reported
CWT
Estimated
Market CWT
Total
Reported
Cost
Estimated
Market Cost
Difference
(Rep-Mkt)
Percent
Difference
31.71$ 23.55$ 339,476$ 300,038$ 39,438$ 13.1%
26.54$ 16.51$ 465,149$ 405,017$ 60,132$ 14.8%
26.17$ 25.46$ 257,849$ 273,951$ (16,102)$ -5.9%
22.19$ 23.02$ 240,778$ 278,654$ (37,876)$ -13.6%
21.94$ 24.14$ 142,982$ 174,973$ (31,991)$ -18.3%
27.76$ 25.54$ 23,672$ 23,208$ 464$ 2.0%
Market PositionReported and Estimated Costs
Summarized at
Origin
Destination
State-State
24 Confidential
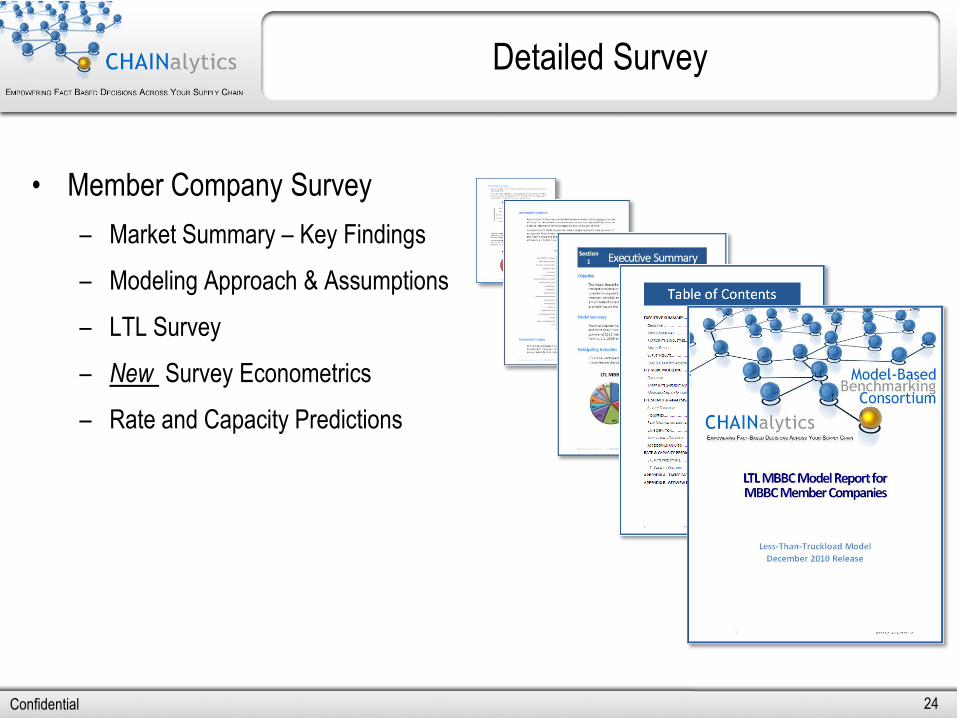
Detailed Survey
• Member Company Survey
– Market Summary – Key Findings
– Modeling Approach & Assumptions
– LTL Survey
– New Survey Econometrics
– Rate and Capacity Predictions

25 Confidential
• The LTL model is where the TL model was in 2008
– Fundamentally sound, critical mass achieved
– Relatively strong explanatory power
– Needs additional data to fill in the network
• Planned Improvements
– Collect and model important contractual elements at shipper level
• Will develop “what makes you unique” freeform in data template – followed by survey
– Value of shipment or insurance parameters
– Total volume in network
– Industry impacts
– Others . . .
• Will Apply Policy-centric Benchmarking
– Enhance the Minimum Charge analysis and integrate models into single model
Plans for 2011 Model

26 Confidential
John Schnorf
Director Business Dev.
Matthew Harding
Principal
Dr. Chris Caplice
Chief Scientist
Q&A
(603) 347-1250
(617) 258-7975
(678) 384-3577