lsu health sciences center at shreveport grad act …lsu health sciences center at shreveport ! grad...
TRANSCRIPT
LSU Health Sciences Center at Shreveport GRAD Act Annual Report – Year 2
Submitted: April 20, 2012 Updated: June 6, 2012

TABLE OF CONTENTS
PERFORMANCE OBJECTIVE 1: STUDENT SUCCESS .......................................................................... 2 Element 1a .............................................................................................................................................. 2 Element 1b .............................................................................................................................................. 3 Element 1c ............................................................................................................................................... 4 Element 1d .............................................................................................................................................. 4
PERFORMANCE OBJECTIVE 2: ARTICULATION AND TRANSFER ..................................................... 7 Element 2a .............................................................................................................................................. 7 Element 2b .............................................................................................................................................. 7 Element 2c ............................................................................................................................................... 7 Element 2d .............................................................................................................................................. 7
PERFORMANCE OBJECTIVE 3: WORKFORCE AND ECONOMIC DEVELOPMENT ........................... 8 Element 3a .............................................................................................................................................. 8 Element 3b ............................................................................................................................................ 10 Element 3c ............................................................................................................................................. 11 Element 3d ............................................................................................................................................ 14
PERFORMANCE OBJECTIVE 4: INSTITUTIONAL EFFICIENCY AND ACCOUNTABILITY ................ 15 Element 4a. ........................................................................................................................................... 15 Element 4b ............................................................................................................................................ 15 Element 4c ............................................................................................................................................. 15 Element 4d ............................................................................................................................................ 16
SECTION 5 ................................................................................................................................................ 17
APPENDIX 1. Grad Act Reporting System Report: School of Medicine 2. Grad Act Reporting System Report: School of Allied Health Professions 3. Grad Act Reporting System Report: School of Graduate Studies 4. Health Professional Shortage Area (HPSA) Map – Primary Care Designations 5. Association of American Medical Colleges (AAMC) Medical School Missions Management Tool –
Graduates Practicing in State and in Underserved Areas 6. Association of University Technology Managers (AUTM) U.S. Licensing Activity Survey FY2010 7. LSUHSC-S Organizational Chart
!LSU Health Sciences Center at Shreveport GRAD Act Annual Report – Year 2
2
PERFORMANCE OBJECTIVE 1: STUDENT SUCCESS Element 1a: Implement policies established by the institution’s management board to achieve cohort graduation rate and graduation productivity goals that are consistent with institutional peers. Narrative School of Graduate Studies Cohort sizes in the School of Graduate Studies are small; thus, each student greatly influences the retention rate calculation. The school requests an exemption in future years from reporting retention rates for cohorts less than 20. Alternatively, the school asks to use a three-year average for this measure to allow for an assessable count of students. Although the School of Graduate Studies established a 75% first to second year retention rate target for the entering class of 2010-11, only seven out of thirteen students were retained to second year from that class. Four of the non-retained students proved to be academically successful during their first year; however, exigent circumstances and personal decisions affected their continuation. The following reasons/observations explain the six students that were not retained:
• One student’s mentor accepted a faculty position at another university, and the student transferred to the same university to continue with mentor.
• Three students in good academic standing resigned for personal reasons. • One student developed a serious medical condition shortly after admission and requested a leave of
absence but eventually resigned from the school.
• One student did not maintain an adequate grade point average and resigned for personal reasons. Standards for acceptance into the School of Graduate Studies include satisfactory scores on the Graduate Record Exam (GRE), a minimum of 2.5 grade point average (GPA) for undergraduate work, satisfactory interviews, and excellent letters of recommendation. Students enrolled in the School of Graduate Studies are required to maintain at least an overall GPA of 3.0. Students who do not achieve a 3.0 GPA are placed on academic probation. Students who have not improved their GPA to at least a 3.0 within 1 year after being placed on academic probation are dismissed from the program. Some departments have developed academic support systems in which senior graduate students tutor first year graduate students who are “at risk” for academic probation. In addition, the Department of Pharmacology, Toxicology and Neuroscience has developed a review/refresher series of on-line tutorials and faculty generated quizzes in biochemistry targeted to students in the summer before their first year of Graduate School. Students who complete this series have proven to be more successful in passing their first year biochemistry courses than students who did not complete the series. Passing the biochemistry courses is essential in advancing from the first year to the second year of the program; thus, the review/refresher series is required for incoming students to the program. Efforts to improve the quality of applicants to the Graduate School include ongoing programs at the high school and undergraduate level. Several programs are active on the LSUHSC-S campus: 1.) The Department of Pharmacology, Toxicology and Neuroscience received funding in 2007 from the American Society for Pharmacology and Therapeutics for Summer Undergraduate Research Fellowships (SURF). In this program, senior undergraduates from around the country spend a summer performing basic research in a laboratory in the department. The great majority of these students continue their education in graduate school, medical school, or MD/PhD programs. 2.) The National Institutes of Health funds the BioStart Academy program, which is a partnership that began in 2006 between Southwood High School in Shreveport and LSUHSC-S. Students participating in this program obtain research experience in a lab at LSUHSC-S as part of their high school program. The majority

!LSU Health Sciences Center at Shreveport GRAD Act Annual Report – Year 2
3
of these students attend college, but because the program has only graduated two classes so far, data about additional education for these graduates is not yet available. 3.) The Science and Medicine Academic Research Training (SMART) program, initiated in 1997, is a partnership between LSUHSC-S and the Biomedical Research Foundation of Northwest Louisiana. The top 10-12 high school students in Caddo, Bossier, and DeSoto Parishes who are interested in science careers are chosen for this program. Students perform basic science research projects in the laboratories of LSUHSC-S faculty for a summer, and their entire senior year in high school. These students typically attend college and continue their education in medical school or graduate school. Of the SMART participants from 1997 to 2008, 18 out of 89 have enrolled in one of the schools at LSUHSC-S. In a recent survey of past SMART participants, 100% of the respondents indicated that they attend/attended college, and 99% specified that they graduated or intend to graduate college. Measures i. 1
st to 2
nd year retention rate by school
2010-11 Target
2010-11 Actual
School of Medicine 95% 96% (113/118)
School of Graduate Studies 75% 54% (7/13)
School of Allied Health Professions 86% 92% (139/151)†
†The majority of programs in the School of Allied Health Professions begins in the summer; thus, retention rate is based
on the summer term. In addition, the summer term falls at the end of the academic year. The actual retention rate for the 2010-11 entering class (in which summer 2011 is included) will not be available till summer 2012; however, estimated figures have been provided.
iv. Same institution graduation rate by school
Year 2 Target
Year 2 Actual
School of Medicine 90% 95% (97/102)
School of Graduate Studies n/a n/a
School of Allied Health Professions 85% 87% (103/118)
ix. Median professional school entrance exam score
Not applicable to LSUHSC-S; the schools do not have direct impact on entrance exam performance; applicants who meet admission requirements are considered.
Element 1b: Increase the percentage of program completers at all levels each year. Narrative School of Allied Health Professions In keeping with national standards, the Physical Therapy program in the School of Allied Health Professions transitioned from masters to doctorate (DPT) in summer 2006. As part of this transition, the program offered a part-time, post-professional track to previous graduates, allowing them to obtain the higher-level DPT degree. As a result, the number of program completers transiently increased, peaking in the baseline year 2008-09. Although the number of DPT graduates has gradually decreased since 2008-09, the number of full-time, entry-level DPT completers has remained stable and at capacity (approximately 30/year) from 2008-09 to 2010-11. Similarly, the Physician Assistant program transitioned from bachelor’s to master’s in summer 2010, and began offering a similar part-time track to previous graduates who desire to earn the higher degree. These program upgrades are expected to continue to produce an inflated number of degrees awarded, but at a diminishing rate, for several more years. As these transitions are accomplished, the part-time, post-professional tracks will be phased out, and the number of completers will stabilize at each

!LSU Health Sciences Center at Shreveport GRAD Act Annual Report – Year 2
4
program’s full-time, entry-level capacity. In addition, as the degree level shifts from bachelor’s to master’s for Physician Assistant, the number of degrees awarded will decrease at the lower level and increase at the higher level. Lastly, cohort sizes by award level are relatively small; thus, each student greatly influences percentage change. Measures School of Medicine i. Percentage change in completers by award level from baseline 2008-09
Baseline 2010-11 Target
2010-11 Actual
Professional baseline (110) 0% +2% (112) School of Graduate Studies i. Percentage change in completers by award level from baseline 2008-09
Baseline 2010-11 Target
2010-11 Actual
Master’s baseline (1) 0% 0% (1) Doctorates baseline (8) 0% +25% (10)
School of Allied Health Professions i. Percentage change in completers by award level from baseline 2008-09
Baseline 2010-11 Target
2010-11 Actual
Bachelor’s baseline (62) -15% -16% (52)*
Master’s baseline (27) -19% 15% (31) Professional baseline (62) -37% -40% (37)
†
*Actual within the allowable tolerance of target
†The number of full-time, entry-level physical therapy clinical doctorate graduates has remained stable and at capacity
(approximately 30/year) from 2008-09 to 2010-11. The Physical Therapy program transitioned from master’s to doctorate in summer 2006 and offered a part-time, post-professional track to previous graduates, allowing them to obtain the higher-level DPT degree. As a result, the number of completers at the professional level transiently increased, peaking in the baseline year. Cohort sizes by award level are relatively small; thus, each student greatly influences percentage change. Targets are met for all graduate levels combined.
Element 1c: Develop partnerships with high schools to prepare students for postsecondary education. Not applicable to LSUHSC-S.
Element 1d: Increase passage rates on licensure and certification exams and workforce foundational skills. Narrative School of Medicine The School of Medicine draws its applicants from Louisiana residents. Despite a smaller applicant pool, often with entry exam scores lower than the national median (school median MCAT: 28 vs. national median MCAT: 32), the institution’s licensure pass rates are consistently competitive with national pass rates.

!LSU Health Sciences Center at Shreveport GRAD Act Annual Report – Year 2
5
USMLE Step 1 Preparation In 2007, the School of Medicine formed a committee to develop and institute an action plan to improve USMLE Step 1 outcomes. An extensive review of academic performance data from past medical students who failed this exam on the first attempt was completed, and a formula was developed to identify students “at risk” for USMLE Step 1 failure. The formula was applied to student data from several previous classes and demonstrated an excellent predictive value for identifying students who had poor Step 1 performance. Since USMLE Step 1 must be passed prior to entry into the third year of medical school, the formula is applied to the academic performance data of all second year students. Students identified as “high-risk” are enrolled in an intensive study course designed to better prepare them for the Step 1 exam, while low-risk students are allowed to use a study method of their choosing. Each subsequent class is evaluated yearly to determine the number of students needing the intensive study course. USMLE Step 2 Preparation Curricular revision aimed at increasing the quality and breadth of clinical experience provided to students has been made with the intent of further improving the quality of graduating physicians. The third and fourth year curricula have been reviewed and modified to provide students with increased patient contact and faculty interaction. In addition, the incorporation of clinical curricula from the institution’s Clinical Skills Center (CSC) has provided an important way in which all medical students receive training in aspects of clinical medicine appropriate for their year and a means by which their performance of clinical skills can be evaluated. These efforts not only serve to improve the overall patient care performance of these future physicians but provide for them an enlarged foundation of clinical knowledge that directly impacts success with USMLE Step 2. High first-time pass rates, which have been comparable or better than the national average, for the two components of USMLE Step 2 reflect the successful implementation of the School of Medicine’s clinical curriculum enhancements. School of Allied Health Professions The School of Allied Health Professions has instituted various methods across all programs to increase passage rates on licensure and certification exams and improve workforce foundational skills. These include early identification of students needing remediation, individual student counseling, study groups, practice examinations, clinical practice skill development, and interactive teaching by faculty on clinical rotations. Examples of student success initiatives include the following:
• The Program in Physical Therapy offers a National Board Exam Preparation Course the month prior to graduation each year. In addition, all students take a mock-licensure exam in the semester prior to graduation in order to identify areas requiring additional review.
• The Physician Assistant (PA) program has taken several actions to improve pass rates on the PA certification exam. One such modification was the conversion from written course exams to electronic format exams, which exposes the students to the test format in which they will later take their actual certification exam. The Physician Assistant program also subscribes to a national peer-reviewed database of certification exam practice questions for students to use as a study aid.

!LSU Health Sciences Center at Shreveport GRAD Act Annual Report – Year 2
6
Measures School of Medicine i. Passage rates of licensure exams 2011 AY Graduates
School Pass Rate
National Pass Rate
School Pass Rate / National
Pass Rate Target
School Pass Rate / National
Pass Rate Actual
USMLE Step 1 95% (110/116) 93% 95% 102% USMLE Step 2 CK 95% (106/112) 97% 96% 98% USMLE Step 2 CS 97% (110/113) 98% 96% 99%
School of Allied Health Professions i. Passage rates of licensure exams 2011 AY Graduates
School Pass Rate
Target
School Pass Rate
Actual
National Pass Rate
Medical Technology 94% 100% (15/15) 84% Cardiopulmonary Science (CRT)
90% 100% (1/1) 57%
Physician Assistant 80% 100% (35/35) 91% Communication Disorders
98% 100% (13/13) 86%
Occupational Therapy
98% 100% (15/15) 84%
Physical Therapy 90% 89% (25/28)* 87%
*Actual within the allowable tolerance of target

!LSU Health Sciences Center at Shreveport GRAD Act Annual Report – Year 2
7
PERFORMANCE OBJECTIVE 2: ARTICULATION AND TRANSFER
Element 2a: Phase in increased admission standards and other necessary policies by the end of the 2012 Fiscal Year in order to increase student retention and graduation rates. Not applicable to LSUHSC-S.
Element 2b: Provide feedback to community colleges and technical college campuses on the performance of associate degree recipients enrolled at the institution. Not applicable to LSUHSC-S.
Element 2c: Develop referral agreements with community colleges and technical college campuses to redirect students who fail to qualify for admission into the institution. Not applicable to LSUHSC-S.
Element 2d: Demonstrate collaboration in implementing articulation and transfer requirements provided in R.S. 17:3161 through 3169. Not applicable to LSUHSC-S.

!LSU Health Sciences Center at Shreveport GRAD Act Annual Report – Year 2
8
PERFORMANCE OBJECTIVE 3: WORKFORCE AND ECONOMIC DEVELOPMENT
Element 3a: Eliminate academic program offerings that have low student completion rates as identified by the Board of Regents or are not aligned with current strategic workforce needs of the state, region, or both as identified by the Louisiana Workforce Commission and Louisiana Economic Development. Narrative Health care plays a vital role in the economic stability and well being of Louisiana. To assure that Louisiana has an adequate supply of health care professionals to fill present and future positions, LSUHSC-S educates and trains learners for careers in needed health care and health science occupations. All programs at LSUHSC-S are aligned with current or strategic workforce needs of the state and/or region as identified by the Louisiana Workforce Commission and Louisiana Economic Development, including the Fostering Innovation through Research in Science and Technology in Louisiana (FIRST Louisiana) core industry of health care. The Director of Institutional Planning serves on the State Council of Workforce and Economic Development Officers, which provides guidance, strategies, and policies to support workforce development efforts at Louisiana’s higher education institutions. In addition, the council facilitates dialogue among colleges and universities, business and industry, state and federal governmental representatives, Louisiana Economic Development, Louisiana Workforce Commission, etc. School of Allied Health Professions The Dean of the School of Allied Health Professions at LSUHSC-S serves as the LSU System representative on the Louisiana Health Works Commission, which functions directly with the Louisiana Workforce Commission to study and make recommendations on supply and demand issues related to the health professions. Using the knowledge gained from these commissions, LSUHSC-S strives to meet the projected demands by fostering programs best suited to the state’s needs. Recent data presented by the commissions on workforce growth in Louisiana indicate that all six academic programs in the LSUHSC-S School of Allied Health Professions (Physical Therapy, Occupational Therapy, Speech-language Pathology, Physician Assistant, Respiratory Therapy and Clinical Laboratory Science) are predicted to have high annual growth rates in the state ranging from 30% to 100%. Compelling evidence over the past several years indicates that additional graduates will be needed to fill high demand positions. Consequently, the School of Allied Health Professions has partnered with the Louisiana Health Works Commission and the Louisiana Board of Regents to increase enrollment in key programs that were functioning at capacity. This was accomplished through a capitation arrangement with the Board of Regents in which the School was provided with additional funding on a per student basis for each new student admitted over the baseline number to these key programs. This agreement allowed the school to increase the entering class size of the Physical Therapy Program and the Physician Assistant Program by six students each, and the Clinical Laboratory Science Program by twelve students. Recent state budgetary constraints have severely curtailed the capitation program, but the school remained committed to the students enrolled and has utilized funding from tuition increases to maintain the higher numbers. School of Graduate Studies The LSU Board of Supervisors and the University of Louisiana Board of Supervisors approved a proposal for a PhD program in Bioinformatics and Computational Biology as a cooperative effort among LSUHSC-S, LSU-S and Louisiana Tech in 2009. It currently awaits final approval by the Board of Regents. The U.S. Bureau of Labor Statistics includes bioinformatics biological scientist (doctoral degree) on the list of “fastest growing occupations” between 2008-2018 in its Occupational Outlook Handbook (2009-2010 edition), with an anticipated 19% growth nationwide and 11% growth for Louisiana.

!LSU Health Sciences Center at Shreveport GRAD Act Annual Report – Year 2
9
As part of the Board of Regents low-completer review in 2011, the School of Graduate Studies proposed to consolidate the five master’s programs in its five basic science departments into a single master’s program to be known as the Biomedical Sciences Master’s Program. Students would enroll in the currently offered core courses in their first year and complete laboratory rotations in three different laboratories of faculty in the five basic science departments. At the end of their first year, the students would choose a research advisor/mentor in one of the basic science departments. The students would then complete the additional course/program requirements for the master’s in that department and receive the Master’s in Biomedical Sciences. A track in Human Clinical Anatomy (that began in August 2010) provides another option for the students in the Master’s in Biomedical Sciences Program who choose a mentor in the Department of Cellular Biology and Anatomy. They will assist in teaching anatomy to medical students in their second year, thus, be trained to become anatomy instructors when they have completed the requirements of the master’s degree. A national shortage of anatomy instructors is evident for medical schools, allied health and nursing schools, and graduate schools, so this program track will provide well-trained instructors that will fill a growing need in the State as well as elsewhere in the country. School of Medicine and Other Postgraduate Training Programs at LSUHSC-S Since Louisiana has large areas in which the population has limited access to health care, one of the most pressing requirements is an adequate supply of primary care physicians. LSUHSC-S has initiated several educational and training programs aimed at meeting those needs. A Health Professional Shortage Area (HPSA) map is provided in Appendix 4 and illustrates the many medically underserved parishes of Louisiana. Appendix 5, from a recent American Association of Medical Colleges (AAMC) report, demonstrates the high retention of LSUHSC-S graduates in-state and practicing in underserved areas as benchmarked against all US medical schools. LSUHSC-S Primary Care Internal Medicine Residency Program In addition to the categorical Internal Medicine training program at LSUHSC-S, the institution began a program to specifically train internists in the practice of Primary Care Internal Medicine. Recognizing that a great percentage of traditional Internal Medicine residents choose to enter specialty fellowship training after graduation, the LSUHSC-S Department of Internal Medicine determined that the need for community internists was not being met and began the Primary Care Internal Medicine Program in 2008. LSUHSC-S Family Medicine Residency Program The primary mission of the LSUHSC-S Family Medicine Residency Program is to train residents capable of practicing in rural settings. In addition to providing an excellent foundation in the practice of primary care medicine, the program has emphasized training in a variety of procedural skills for over 20 years to help accomplish this goal. To function in rural areas, physicians must be prepared to perform a number of treatments and diagnostic studies that, in urban areas, might be done by a specialist. The Department of Family Medicine has maintained a rural training track for over 10 years. The Emergency Medicine/Family Medicine Program is intended to prepare graduates to effectively staff emergency departments as well as practice family medicine in rural communities. LSUHSC-S Area Health Education Centers (AHEC) AHEC is a national organization with a primary mission to enhance access to quality health care, particularly primary and preventive care, by improving the supply and distribution of healthcare professionals through community/academic educational partnerships. In keeping with the overall AHEC mission and its application to Louisiana, the AHEC Program Office at LSUHSC-S and its two centers focus on introducing students to the practice of medicine in the rural and underserved areas of the state. The program plays an active role in the training of LSUHSC-S medical students and also offers programs for high school and college level students.

!LSU Health Sciences Center at Shreveport GRAD Act Annual Report – Year 2
10
Measures Summary of program review 2010-11
i. Number of programs eliminated 01
ii. Number of programs modified or added 12
1As part of the Board of Regents low-completer review in 2010-2011, the institution proposed the consolidation of the five
master’s programs in the School of Graduate Studies into a single master’s program to be known as the Biomedical Sciences Master’s Program beginning in 2011-12. 2Physician Assistant Program began transition from bachelor’s to masters in 2010-11.
Programs aligned with workforce and economic development needs
2010-11
iii. Percent of programs aligned with workforce and economic development needs
100%
• Number of program offerings 18
• Number of programs aligned with workforce and economic development needs
18
Element 3b: Increase use of technology for distance learning to expand educational offerings. Narrative School of Medicine As is prevalent in most medical schools, students in the School of Medicine must interact in person with faculty, students, patients, etc. in most curricular activities (e.g. clinical clerkships, small group discussions, lectures, problem-based learning, standardized patient experiences, etc.); therefore, distance learning is not a viable delivery option for the M.D. Program. School of Graduate Studies The Introduction to Bioinformatics course (BCH 290, 3 credit hours) provided by the School of Graduate Studies is offered to students at four universities in Louisiana including LSUHSC-S, LSU-S, Louisiana Tech, and Southern University in Baton Rouge. Fifty percent of the lectures in the course are given at LSUHSC-S and 50% are given at LSU-S, and the Access Grid System connects all four campuses. Students register on their respective campuses for course credit in their institutional programs. The course is taught in the spring of alternate years. The NIH-funded INBRE program supports Access Grid, allowing graduate students, postdoctoral fellows and faculty at LSUHSC-S to participate in a Bioinformatics Affinity Group Journal Club with students and others at Louisiana Tech, ULM, LSU-BR, LSU-S, LSUHSC-NO and SUBR. These interactive Journal Clubs are important in student learning as well as development of oral communication skills. Students from multiple departments participate in this course. Students in the School of Graduate Studies must perform scientific research as part of their degree requirements, and this aspect of training cannot be provided through distance learning. No courses in the School of Graduate Studies are offered 100% through distance education. School of Allied Health Professions The Cardiopulmonary Science Program has a consortium agreement with Bossier Parish Community College (BPCC) to teach on that campus as well as use technology for distance learning to teach students residing in the Monroe and Alexandria region. The students in Monroe and Alexandria have a weekly lab performed at

!LSU Health Sciences Center at Shreveport GRAD Act Annual Report – Year 2
11
their site with a clinical instructor and all clinical rotations are completed in their respective areas. Upon completion these students will receive an Associate Degree in Respiratory Therapy from BPCC. Measures Distance Learning 2010-11
*
i. Number of course sections offered during the reporting year with 50% and with 100% instruction through distance education, reported separately for:
• Number of course sections with 50% to 99% instruction through distance education
0
• Number of course sections with 100% instruction through distance education
0
ii. Number of students enrolled in courses during the reporting year with 50% and with 100% instruction through distance education, reported separately for:
• Number of students (duplicated) enrolled in courses with 50% to 99% instruction through distance education
0
• Number of students (duplicated) enrolled in courses with 100% instruction through distance education
0
iii. Number of programs offered through 100% distance education, by award level 0 *The Introduction to Bioinformatics course (BCH 290, 3 credit hours) is taught in the School of Graduate Studies, and fifty percent of the lectures in the course are given at LSUHSC-S and 50% are given at LSU-S. The Access Grid System connects these two campuses as well as Louisiana Tech and Southern University in Baton Rouge. The course is taught in the spring of alternate years; it was not offered in spring 2011.
Element 3c: Increase research productivity especially in key economic development industries and technology transfer at institutions to levels consistent with the institution’s peers. Note: Special narrative required for this element. The narrative (up to 7 pages) should include at a minimum descriptions of:
• Context for research reporting for the current year: how alignment of Research & Development activities with key economic development industries was determined, sources of reported data and information, method for isolating data related to key economic areas, and any other critical factors in approaching specific GRAD Act reporting requirements.
• Research productivity and technology transfer activities related to Louisiana’s key economic development industries that have taken place during the reporting year; provide any relevant metrics to demonstrate impact
• Collaborations during the reporting year with Louisiana Economic Development, Louisiana Association of Business and Industry, industrial partners, chambers of commerce, and other economic development organizations to align Research & Development activities with Louisiana’s key economic development industries, discuss any changes from previous year.
• Business innovations and new companies (startups) and companies formed during previous years and continuing (surviving startups) resulting from institutional research and/or partnerships related to Small Business Innovation Research/Small Business Technology Transfer (SBIR/STTR) awards.
• Using most recent data available, research productivity and technology transfer efforts in comparison with peer institutions, provide any relevant metrics to demonstrate comparisons.
Note: Louisiana’s key economic development industries include but are not limited to the key industry sectors identified in the Fostering Innovation through Research in Science and Technology in Louisiana (FIRST Louisiana) plan as well as LED’s Blue Ocean targeted industry sectors. The following list provides FIRST Louisiana core industry sectors with related Blue Ocean sections in parentheses: o Petrochemical (ultra-deep water oil & gas; unconventional natural gas; enhanced oil
recovery) o Energy & Environmental (next generation automotive; energy efficiency; renewable energy;
nuclear power; water management; ultra-deep water oil & gas; enhanced oil recovery)

!LSU Health Sciences Center at Shreveport GRAD Act Annual Report – Year 2
12
o Transport, Construction & Manufacturing (next-generation automotive; pharmaceutical manufacturing; renewable energy; nuclear power; water management)
o Information Technology & Services (digital media/software development) o Arts & Media (digital media/software development) o Agricultural & Wood Products (water management; renewable energy) o Health Care (Specialty research hospital; obesity/diabetes research and treatment;
pharmaceutical manufacturing; digital media/software development: health care IT) Narrative One of Louisiana’s top economic development goals is expanding research, clinical trials, and treatment opportunities. The Center of Molecular and Tumor Virology at LSUHSC-S, funded through an NIH COBRE grant, is one major area of research, which includes both basic and clinical science investigations of molecular mechanisms involved in virally-induced pathogenesis. Another major research area at the university is an NIH funded program project grant on the Role of the Microcirculation in Intestinal Inflammation. Investigators working on this project are studying inflammatory bowel diseases, such as colitis and Crohn's Disease in order to develop better treatments for these debilitating conditions. Researchers at the LSUHSC-S Feist-Weiller Cancer Center perform investigations into molecular mechanisms of cancer initiation and metastases as well as conduct clinical trails on new cancer treatments. Other areas of basic and clinical research in the neurosciences include Parkinson's Disease, Alzheimer's Disease, other neurodegenerative diseases, Multiple Sclerosis, drug abuse and olfactory processing. Other investigators are studying diabetes, stroke, asthma, rheumatoid arthritis, kidney disease, pulmonary disease, hepatitis, sickle cell disease, preeclampsia, and cystic fibrosis. In addition, LSUHSC-S conducts numerous clinical trials in diabetes, cancer, heart disease, behavioral and cognitive disorders, and inflammatory diseases as well as other conditions, which are supported by the pharmaceutical industry, foundations, and the National Institutes of Health. As part of its mission, LSUHSC-S supports the region and the state in economic growth and prosperity by utilizing research and knowledge to engage in productive partnerships with the private sector. Ongoing partnerships between LSUHSC-S and several start-up companies are active. The intellectual property developed at LSUHSC-S was exclusively licensed to these companies, and the companies are working on commercializing these technologies. For example, Requisite Biomedical is developing a drug delivery device and if their commercialization efforts are successful, LSUHSC-S could potentially receive ownership in the company. Dr. Nicholas Goeders at LSUHSC-S was awarded an NIH grant that subcontracts to Embera Pharmaceuticals to develop new drug combination formulations for treatment of drug addiction. TheraVasc has been granted a license to commercial several patents that originated at LSUHSC-S for use of novel agents in treating ischemic diseases. In addition, established companies have licensed LSUHSC-S developed technologies. For example, Applied Biosystems, Fermentas, TriLink and New England BioLabs have licensed technology developed at LSUHSC-S for the synthesis and use of anti-reverse mRNA cap analogs ARCA. A Shreveport company, Indigeaux, has licensed the LSUHSC-S patent for a gum that slowly releases curcumin to treat upper aerodigestive diseases and head and neck problems. All research and development activities at LSUHSC-S are related to Louisiana's key economic industry of health care. The Shreveport and Monroe metropolitan areas support two medical hubs in North Louisiana, which provide health care for the northern half of the state, east Texas, west Mississippi and southern Arkansas. With 59 hospitals, an academic medical center (LSUHSC-S), and 5,122 beds combined, the healthcare sector in the region employs approximately 25,000 professionals, who have brought national recognition to the region. The healthcare industry is one of the largest employers in North Louisiana and an economic driver for the region. The Community Foundation of NW Louisiana is managing the funds from an endowment obtained from donations dedicated to support the Research Core Facility (RCF). The RCF consists of state-of-the-art instruments that are utilized by clinical and basic scientists for biomedical research. This research supports Louisiana's key economic development industry of health care. The Director of Institutional Planning serves on the State Council of Workforce and Economic Development Officers, which provides guidance, strategies, and policies to support workforce development efforts at

!LSU Health Sciences Center at Shreveport GRAD Act Annual Report – Year 2
13
Louisiana’s higher education institutions. In addition, the council facilitates dialogue among colleges and universities, business and industry, state and federal governmental representatives, Louisiana Economic Development, Louisiana Workforce Commission, etc. Comparison data to other U.S. universities, hospitals, and research institutions published in the Association of University Technology Managers (AUTM) U.S. Licensing Activity Survey FY2010 is provided in Appendix 6. LSUHSC-S data is consolidated with the LSU System. Measures Research Productivity and Technology Transfer Measures 2010-11
Faculty (FTE) holding (serving as principal and/or co-principal investigators) active research and development grants/contracts.
91.55
Total number of research/instructional faculty (FTE) at the institution during the reporting year. Include all FTE faculty, tenure and non-tenure track including physicians whose job responsibilities include expectations for scholarly productivity.
247.63
Total number of Basic Science research/instructional faculty (FTE) at the institution during the reporting year.
72.55
i. a. Percent of above research/instructional faculty (FTE) at the institution holding active research and development grants/contracts
37% (91.55/247.63)
i. b. Percent of above Basic Science research/instructional faculty (FTE) at the institution holding active research and development grants/contracts
68% (49.55/72.55)
ii. a. Percent of research/instructional faculty (FTE) holding active research and development grants/contracts in Louisiana’s key economic development industries
37% (91.55/247.63)
ii. a. Percent of Basic Science research/instructional faculty (FTE) holding active research and development grants/contracts in Louisiana’s key economic development industries
68% (49.55/72.55)
iii. Dollar amount of research and development expenditures, reported annually, based on a five-year rolling average, by source (federal, industry, institution, other). Include all expenditures from S&E and non S&E grants/contracts as reported annually to the NSF. (Five-year average of FY2005-06 through FY2009-10).
• Federal: $13,661,000
• Other: $16,770,600
• Total: $30,431,600
iv. Dollar amount of research and development expenditures in Louisiana’s key economic development industries, reported annually, based on a five year average (Five-year average of FY2005-06 through FY2009-10). These data will be supplemented with the narrative report demonstrating how research activities align with Louisiana’s key economic development industries.
$30,431,600
v. Number of intellectual property measures (patents, disclosures, licenses, options, new start-ups, surviving start-ups, etc.) which are the result of the institution’s research productivity and technology transfer efforts reported by: total count of the number of disclosures, licenses and options awarded; the number of patents awarded; the number of new companies (start-ups) formed; and the number of companies formed during previous years and continuing (surviving start-ups).
• Patent applications filed: 2
• Patents issued: 1
• Disclosures: 10
• Licenses/options executed: 2
• New start-ups: 0

!LSU Health Sciences Center at Shreveport GRAD Act Annual Report – Year 2
14
• Surviving start-ups since 2005: 5
Element 3d: To the extent that information can be obtained, demonstrate progress in increasing the number of students in jobs and in increasing the performance of associate degree recipients who transfer to institutions that offer academic undergraduate degrees at the baccalaureate level or higher. Narrative Medical students participate in the National Resident Match Program in their fourth year; and 100% matched in 2010-11 with the vast majority matching into their field of choice. Graduates of the School of Allied Health Professions and the School of Graduate Studies are tracked by formal survey and word of mouth, and nearly 100% are employed in their field of study. LSUHSC-S does not offer associate degrees; therefore, progress related to the performance of associate degree recipients who transfer to institutions that offer baccalaureate degrees or higher is not applicable. Measures iii. Placement rates of graduates 2010-11
Target 2010-11 Actual
School of Medicine 97% 100% (112/112) School of Allied Health Professions 95% 99% (119/120) School of Graduate Studies 89% 91% (10/11)
iv. Placement rates of graduates in postgraduate training 2010-11
Target 2010-11 Actual
School of Medicine 97% 100% (112/112) School of Allied Health Professions n/a n/a School of Graduate Studies 78% 82% (9/11)
!

!LSU Health Sciences Center at Shreveport GRAD Act Annual Report – Year 2
15
PERFORMANCE OBJECTIVE 4: INSTITUTIONAL EFFICIENCY AND ACCOUNTABILITY
Element 4a: Eliminate remedial education course offerings and developmental study programs unless such courses or programs cannot be offered at a community college in the same geographical area. Not applicable to LSUHSC-S.
Element 4b: Eliminate associate degree program offerings unless such programs cannot be offered at a community college in the same geographic area or when the Board of Regents has certified educational or workforce needs. Not applicable to LSUHSC-S.
Element 4c: Upon entering the initial performance agreement, adhere to a schedule established by the institution’s management board to increase nonresident tuition amounts that are not less than the average tuition amount charged to Louisiana residents attending peer institutions in other Southern Regional Educational Board states and monitor the impact of such increases on the institution. However, for each public historically black college or university, the nonresident tuition amounts shall not be less than the average tuition amount charged to Louisiana residents attending public historically black colleges and universities in other Southern Regional Education Board states. Narrative Granting Resources and Autonomy for Diplomas (GRAD) Act is legislation enacted to support the state’s public postsecondary education institutions in remaining competitive and increasing their overall effectiveness and efficiency. Institutions should achieve specific, measureable performance objectives aimed at improving college completion and at meeting the state’s current and future workforce and economic development needs. Institutions will be granted limited operational autonomy and flexibility in exchange for achieving such objectives. Pursuant to the provisions of Act 741 of the 2010 Legislative Session, the LSU Board of Supervisors at its meeting of July 16, 2010, authorized campuses to increase tuition for resident students by up to five percent annually, in addition to other increases authorized by law, such increases which may be made effective beginning with the 2010 fall semester upon formal acceptance of the initial performance agreements by the Board of Regents. These increases would be based on the institutions’ yearly progress in achieving specific performance goals. After reaching the average tuition of their peers, institutions may increase tuition and fees up to five percent or the amount of the increase in the Higher Education Price Index in the previous year, whichever is greater. Participating institutions will also be allowed to establish tuition and fees according to credit hours, rather than having them capped at full-time,12-credit hour status. Since the applicant pool for LSUHSC-S is almost entirely drawn from Louisiana residents, there would be virtually no impact on either enrollment or revenue from a non-resident tuition increase in accordance with the GRAD Act. As well, a tuition increase for Louisiana residents is not anticipated to negatively affect enrollment in the schools of LSUHSC-S. Additional revenues that would be realized from an in-state tuition increase, however, are not expected to offset the anticipated budget reduction for Louisiana higher education.

!LSU Health Sciences Center at Shreveport GRAD Act Annual Report – Year 2
16
Measures i. Total tuition and fees charged to full-time non-resident students 2010-11 Peer Comparison Difference
School of Graduate Studies 7,521 15,570 (SREB Avg) -8,049 School of Allied Health Professions – Doctor of Physical Therapy
15,371 28,058 (Southern Dean’s Avg)
-12,687
School of Allied Health Professions – Graduate
10,668 16,184 (Southern Dean’s Avg)
-5,516
School of Allied Health Professions – Undergraduate
9,398 16,727 (Southern Dean’s Avg)
-7,329
School of Medicine 27,630 41,763 (SREB Avg) -14,133
Element 4d: Designate centers of excellence as defined by the Board of Regents which have received a favorable academic assessment form the Board of Regents and have demonstrated substantial progress toward meeting the following goals:
• Offering a specialized program that involves partnerships between the institution and business and industry, national laboratories, research centers, and other institutions.
• Aligning with current and strategic statewide and regional workforce needs as identified by the Louisiana Workforce Commission and Louisiana Economic Development.
• Having a high percentage of graduates or completers each year as compared to the state average percentage of graduates and that of the institution's peers.
• Having a high number of graduates or completers who enter productive careers or continue their education in advanced degree programs, whether at the same or other institution.
• Having a high level of research productivity and technology transfer. The Board of Regents shall develop a policy for this element. Upon approval of the policy, measures and reporting requirements will be defined. Pending development of these items, institutions are not required to report on this element.

!LSU Health Sciences Center at Shreveport GRAD Act Annual Report – Year 2
17
SECTION 5 5.a. Number of students by classification Fall Headcount
Undergraduate Graduate Postgraduate1 Total
Fall 2011 59 808 597 1,464 1Postgraduate learners at LSUHSC-S include graduate medical residents and fellows (532) and other
research/healthcare postgraduate trainees (65). Student FTE Not applicable to LSUHSC-S; credit hour data is not submitted to the Student Credit Hour (SCH) Reporting System by the institution. However, the following FTE student enrollment from July 1, 2010 to June 30, 2011 was reported in IPEDS 12-month Enrollment: Undergraduate student FTE 79 Graduate student FTE 854 Total FTE students 933
5.b. Number of Instructional Staff Fall 2011
Instructional faculty headcount 375 Instructional faculty FTE 334.56
5.c. Average class student-to-instructor ratio (average undergraduate class size) Not applicable to LSUHSC-S; credit hour data is not submitted to the Student Credit Hour (SCH) Reporting System by the institution. However, the following student-to-instructional staff for undergraduate programs for Fall 2011 was reported in IPEDS Enrollment: Student-to-faculty ratio 5 to 1
5.d. Average number of students per instructor Not applicable to LSUHSC-S; credit hour data is not submitted to the Student Credit Hour (SCH) Reporting System by the institution. However, the fall 2011 learner headcount to instructional faculty headcount is 3.9 to 1 (1464/375). Learner-to-faculty ratio 3.9 to 1
5.e. Number of non-instructional staff members in academic colleges and departments Fall 2011 Academic clinical departments are responsible for providing patient care services in the University Hospital; therefore, some staff may have duties in both the medical school and the hospital. Headcount 80 FTE 79.22

!LSU Health Sciences Center at Shreveport GRAD Act Annual Report – Year 2
18
5.f. Number of staff in Administrative Areas Fall 2011 Academic clinical departments are responsible for providing patient care services in the University Hospital; therefore, some staff may have duties in both the medical school and the hospital. Headcount 173 FTE 173.00
5.g. Organizational chart containing all departments and personnel in the institution down to the second level of the organization below the chancellor. See Appendix 7 for organizational chart. 5.h. Salaries of all personnel identified in (g) above and the date, amount, and type of all increases in salary received since June 30, 2008.
POSITION
TOTAL BASE SALARY Reported
for Fall 2009
SALARY CHANGES SINCE 6/30/2008 Reported for Fall
2010
SALARY CHANGES SINCE 06/30/2010 Reported for Fall
2011
SALARY CHANGES SINCE 06/30/2011 Reported for Fall
2012
Chancellor April 1, 2009 $325,000 (previous Chancellor retired)
new Chancellor hired at a greater
salary
Vice Chancellor Business and
Reimbursements
July 1, 2008 $251,410.50
current incumbent received a raise
April 1, 2011 current incumbent retired at
salary of $251,410.50
Vice Chancellor for Administration
(created 4/15/2009)
April 15, 2009 current incumbent hired at a salary of
$220,000
Vice Chancellor Clinical Affairs
July 1, 2008 $186,999.96
previous incumbent received increase
. July 1, 2010 $222,000 previous
incumbent retired and new Vice Chancellor
hired at a greater salary
Dean School of Allied Health Professions
July 1, 2008 $144,417.96
current incumbent received a raise
Dean School of Graduate Studies
July 1, 2008 $128,211.96
current incumbent received a raise
Dean School of Medicine (created
11/01/2009)
November 1, 2009 current incumbent hired at a salary of
$270,000
Administrator LSU Hospital
July 1, 2008 $236,982.00

!LSU Health Sciences Center at Shreveport GRAD Act Annual Report – Year 2
19
current incumbent received a raise
Senior Associate Dean and LSU Hospital CMO
(created 1/1/2010)
January 1, 2010 current incumbent hired at a salary of
$200,000 5.i. A cost performance analysis i. Total operating budget by function, amount, and percent of total, reported in a manner consistent with NACUBO guidelines
Expenditures by Function: Amount
% of Total
Instruction $43,648,834 10.2%
Research $19,868,023 4.6%
Public Service $2,161,802 0.5%
Academic Support** $7,746,223 1.8%
Student Services $1,121,356 0.3%
Institutional Services $22,190,894 5.2%
Scholarships/Fellowships $510,793 0.1% Plant
Operations/Maintenance $5,553,519 1.3%
Total E&G Expenditures $102,801,443 24.0%
Hospital $324,357,127 75.6%
Transfers out of agency $- 0.0%
Athletics $- 0.0%
Other $1,612,952 0.4%
Total Expenditures $428,771,522 100.0% ii. Average yearly cost of attendance for the reporting year as reported to the US Department of Education
Not applicable to LSUHSC-S; measure applies to first-time, full-time undergraduates which LSUHSC-S does not enroll.
iii. Average time to degree for completion of academic programs at 4-year universities, 2-year colleges, and technical colleges
Not applicable to LSUHSC-S iv. Average cost per degree awarded in most recent academic year Not applicable to LSUHSC-S v. Average cost per non-completer in the most recent academic year
Not applicable to LSUHSC-S vi. All expenditures of the institution for that year most recent academic year
$597,149,523.82

APPENDIX 4
Health Professional Shortage Area (HPSA) Map – Primary Care Designations

PCHPSAMap-FLAT.jpg (JPEG Image, 576x663 pixels)
1 of 1
APPENDIX 5
Association of American Medical Colleges (AAMC) Medical School Missions
Management Tool – Graduates Practicing in State and in Underserved Areas

!

APPENDIX 6
Association of University Technology Managers (AUTM) U.S. Licensing Activity
Survey FY2010

46
AUTM
U.S
. L
ice
nsi
ng
Su
rve
y: F
Y2010
U.S
. U
niv
ers
itie
sD
ata
Ap
pe
nd
ixS
um
ma
ry o
f 2
00
8 –
20
10
Alb
ert
Ein
ste
in C
oll
eg
e o
f M
ed
/Ye
shiv
a U
niv
ers
ity
19
85
4
.0
15
2,1
61
,01
6
44
0,6
50
,65
7
13
2
54
1
34
1
9
20
6
,40
7,8
56
1
1,4
09
,44
9
6,4
96
,43
1
Ari
zon
a S
tate
Un
ive
rsit
y 1
98
5
10
.0
32
9,3
45
,11
8
82
0,8
73
,05
8
55
1
39
4
1
87
4
98
1
7
99
1
,58
6,2
28
4
,58
1,1
18
1
,62
5,7
16
Au
bu
rn U
niv
ers
ity
19
88
3
.5
14
5,1
15
,00
0
43
5,7
53
,00
0
25
6
3
1
10
5
27
6
23
1
08
7
70
,13
4
2,1
38
,71
8
77
0,1
34
Ba
ylo
r C
oll
eg
e o
f M
ed
icin
e
19
83
7
.0
40
3,3
51
,00
0
1,0
13
,26
3,0
00
4
8
60
5
NA
7
8
22
7
8
27
8
,48
5,0
00
2
6,1
57
,00
0
8,4
85
,00
0
Bo
ise
Sta
te U
niv
ers
ity
20
10
1
.0
18
,73
1,2
50
N
A
4
4
0
14
N
A
4
11
1
,00
0
NA
1
,00
0
Bo
sto
n C
oll
eg
e
20
05
1
.0
43
,57
1,3
32
N
A
3
2
0
15
N
A
8
8
13
4,4
24
N
A
13
4,4
24
Bo
sto
n U
niv
ers
ity/
Bo
sto
n M
ed
ica
l C
en
ter.
1
97
6
10
.8
40
2,5
21
,23
5
1,1
17
,59
7,0
41
9
1
60
2
7
7
24
8
18
5
2
1,2
82
,55
7
4,2
96
,54
7
1,4
71
,35
3
Bo
wli
ng
Gre
en
Sta
te U
niv
ers
ity
20
01
1
.0
7,9
58
,99
9
27
,06
6,9
99
2
2
1
9
2
9
3
9
6,3
35
2
4,8
35
6
,33
5
Bri
gh
am
Yo
un
g U
niv
ers
ity
19
86
4
.0
28
,50
3,0
08
8
2,1
66
,34
5
27
2
39
1
3
11
7
36
8
10
6
2
4,0
79
,21
6
11
,22
3,3
26
4
,07
9,2
16
Ca
lifo
rnia
In
st.
of
Tech
no
log
y 1
97
8
6.0
5
04
,47
6,1
28
N
A
47
9
4
10
5
73
1
,63
3
13
8
41
5
50
,97
3,6
80
1
16
,25
9,8
28
5
1,5
82
,14
9
Ca
rne
gie
Me
llo
n U
niv
ers
ity
19
92
4
.0
23
3,4
86
,00
0
69
5,7
58
,00
0
48
2
88
1
0
10
8
34
1
24
5
3
6,0
75
,40
8
20
,47
8,3
29
6
,07
8,6
62
Ca
se W
est
ern
Re
serv
e U
niv
ers
ity
19
86
8
.5
33
4,9
93
,00
0
1,0
83
,73
1,0
00
3
8
25
0
5
21
6
49
3
28
5
4
14
,33
3,2
73
4
3,9
09
,84
2
14
,33
3,2
73
Cle
mso
n U
niv
ers
ity
19
87
3
.0
18
7,2
92
,16
1
46
7,5
45
,26
2
11
4
5
3
82
2
21
2
0
39
1
,06
4,6
78
6
,76
3,3
43
1
,06
4,6
78
Co
lora
do
Sta
te U
niv
ers
ity
19
70
3
.5
30
2,8
95
,45
3
91
7,2
28
,77
7
33
1
08
5
1
14
3
07
8
5
2
1,0
79
,31
5
4,5
94
,80
9
1,1
09
,84
1
Co
lum
bia
Un
ive
rsit
y 1
98
2
14
.0
66
2,0
48
,55
0
1,9
06
,70
8,5
50
6
1
NA
1
2
33
3
93
2
66
1
77
1
00
,80
6,6
68
3
09
,06
4,5
66
1
47
,23
7,6
31
Co
rne
ll U
niv
ers
ity
19
79
1
1.0
7
64
,24
4,5
88
2
,11
9,9
02
,99
4
37
5
53
1
2
30
8
91
6
69
1
42
1
0,3
94
,84
1
22
,03
2,4
95
1
1,5
79
,90
5
Da
rtm
ou
th C
oll
eg
e
19
85
2
.0
14
3,9
55
,42
4
46
4,0
18
,00
1
9
13
1
1
48
1
61
1
5
31
2
,30
1,0
90
8
,89
1,1
86
2
,33
5,5
06
Dre
xel
Un
ive
rsit
y 1
99
5
3.0
1
13
,61
0,0
00
3
19
,85
9,0
05
1
8
60
3
1
10
3
95
2
2
62
1
45
,67
2
61
9,9
71
1
85
,67
2
Du
ke U
niv
ers
ity
19
86
9
.6
82
6,9
93
,37
5
2,2
14
,98
0,6
68
9
9
73
8
5
21
4
60
1
43
1
25
2
5,6
05
,57
0
59
,69
9,9
07
2
5,7
33
,52
6
Ea
st C
aro
lin
a U
niv
ers
ity
19
95
3
.0
23
,99
5,0
00
6
4,3
64
,00
0
2
18
0
1
5
37
2
2
2
93
,90
1
2,0
47
,30
2
29
3,9
01
Ea
ste
rn V
irg
inia
Me
dic
al
Sch
oo
l 1
99
9
1.0
4
4,4
20
,00
0
11
1,8
75
,00
0
1
23
0
1
9
34
2
2
4
1,2
28
,50
5
3,6
78
,07
5
1,2
28
,50
5
Em
ory
Un
ive
rsit
y 1
98
5
7.0
4
50
,20
4,1
68
1
,25
7,6
45
,64
5
36
2
51
4
2
12
5
63
1
7
58
1
4,3
28
,71
8
48
,39
4,4
36
1
4,3
83
,54
2
Flo
rid
a A
tla
nti
c U
niv
ers
ity
19
96
2
.0
41
,60
5,7
82
N
A
6
10
1
2
5
NA
4
1
5
13
7,9
76
N
A
14
5,4
76
Flo
rid
a I
nte
rna
tio
na
l U
niv
ers
ity
NA
0
.5
76
,74
6,4
03
2
25
,98
0,1
47
1
4
0
2
4
58
1
7
2
4,9
42
7
4,1
84
2
4,9
42
Flo
rid
a S
tate
Un
ive
rsit
y 1
99
6
4.0
2
17
,44
1,9
56
6
23
,05
7,6
54
6
6
5
2
45
1
46
2
1
34
1
,31
4,9
17
3
,76
4,6
31
1
,31
4,9
17
Ge
org
e M
aso
n U
niv
ers
ity
19
96
1
.9
10
0,2
86
,57
5
28
0,3
34
,41
4
6
19
2
6
1
17
1
24
4
4
98
,23
2
35
0,6
83
1
10
,37
5
Ge
org
eto
wn
Un
ive
rsit
y 1
99
3
5.0
2
35
,78
0,7
55
6
11
,37
5,4
13
1
0
13
9
0
53
1
59
4
4
1
8,0
44
,09
4
23
,66
3,1
16
8
,05
4,8
87
Ge
org
ia I
nst
. o
f Te
chn
olo
gy
19
90
7
.0
64
3,7
36
,56
7
1,7
61
,42
7,7
49
4
2
46
4
8
40
9
1,0
86
4
9
25
5
2,2
78
,26
7
6,9
37
,40
2
2,2
82
,82
4
Ha
rva
rd U
niv
ers
ity
19
77
1
0.3
7
69
,50
0,0
00
2
,13
4,6
55
,50
0
67
5
47
8
3
01
8
73
3
9
15
4
9,6
47
,15
4
41
,52
5,7
36
1
0,0
52
,09
8
Ida
ho
Sta
te U
niv
ers
ity
20
11
N
A
22
,07
9,5
71
N
A
1
1
0
NA
N
A
0
3
0
NA
0
Ind
ian
a U
niv
ers
ity
(AR
TI)
1
99
1
7.0
4
32
,02
6,8
62
1
,25
8,7
33
,14
6
27
2
42
4
1
54
4
29
8
9
2
14
,09
7,0
53
2
4,4
74
,02
2
14
,12
6,9
64
Iow
a S
tate
Un
ive
rsit
y 1
93
5
7.5
2
80
,95
6,0
00
7
85
,95
3,0
00
8
3
44
8
0
11
1
29
3
29
6
0
9,3
83
,08
8
26
,73
9,2
06
9
,40
2,5
63
Joh
ns
Ho
pk
ins
Un
ive
rsit
y 1
97
3
11
.1
1,4
62
,97
5,0
00
3
,88
9,0
59
,44
5
10
4
56
8
11
3
55
1
,01
3
53
4
49
1
1,4
94
,90
9
33
,80
1,3
52
1
2,4
13
,71
4
Joh
ns
Ho
pk
ins
Un
ive
rsit
y A
pp
lie
d P
hys
ics
La
bo
rato
ry
19
99
5
.0
1,0
70
,84
4,7
25
2
,83
9,9
50
,55
2
26
1
23
2
1
34
3
91
1
4
31
1
,21
4,9
70
3
,86
1,9
66
1
,21
4,9
70
Na
me
of
Inst
itu
tio
n
Pro
gra
m
Sta
rt
2010
Lic
en
sin
g
FTE
2010
Re
sea
rch
Ex
pe
nd
itu
res
2008
-201
0
Cu
mu
lati
ve
Re
sea
rch
Ex
pe
nd
itu
res
2010
Lic
en
ses
an
d
Op
tio
ns
Ex
ec
ute
d
Cum
ulat
ive
Ac
tive
Lic
en
ses
2010
Sta
rtu
ps
2010
Inve
nti
on
Dis
clo
sure
s
2008
-201
0
Cu
mu
lati
ve
Inve
nti
on
Dis
clo
sure
s
2010
U.S
. Pa
ten
ts
Issu
ed
2010
Ne
w
Pa
ten
t
Ap
pli
ca
tio
ns
2010
Ad
just
ed
Gro
ss
Inc
om
e
2008
–20
10
Cu
mu
lati
ve
Ad
just
ed
Gro
ss
Inc
om
e
2010
Lic
en
se
Inc
om
e

47
AUTM
U.S
. L
ice
nsi
ng
Su
rve
y: F
Y2010
U.S
. U
niv
ers
itie
sD
ata
Ap
pe
nd
ixS
um
ma
ry o
f 2
00
8 –
20
10
Ka
nsa
s S
tate
Un
ive
rsit
y R
ese
arc
h F
ou
nd
ati
on
1
94
2
3.0
1
17
,32
0,2
87
3
18
,31
5,8
35
4
5
0
0
27
9
8
11
1
8
1,4
68
,59
2
4,5
28
,18
8
1,4
68
,59
2
Ke
nt
Sta
te U
niv
ers
ity
19
89
1
.5
26
,33
1,0
00
7
6,5
79
,35
7
8
35
0
1
5
59
8
2
5
38
3,7
33
1
,06
0,4
86
4
01
,23
3
Le
hig
h U
niv
ers
ity
20
04
1
.0
44
,67
2,8
00
1
33
,25
5,8
00
N
A
NA
N
A
25
6
3
3
18
1
69
,00
6
NA
1
69
,00
6
Lo
uis
ian
a S
tate
Un
ive
rsit
y S
yste
m
19
86
7
.0
41
6,8
45
,00
0
1,2
09
,91
8,0
00
2
6
12
2
5
12
1
38
0
14
4
7
9,5
51
,93
2
18
,74
0,2
96
9
,57
5,1
15
Lo
uis
ian
a T
ech
Un
ive
rsit
y 2
00
0
1.0
2
6,0
20
,00
0
66
,88
4,0
00
2
1
2
1
24
7
7
4
13
3
3,5
00
2
33
,88
6
33
,50
0
Lo
yola
Un
ive
rsit
y o
f C
hic
ag
o.
NA
0
.0
43
,90
2,8
19
N
A
2
3
0
5
NA
2
5
3
,73
7,0
75
N
A
3,7
37
,07
5
Ma
ssa
chu
sett
s In
st.
of
Tech
no
log
y (M
IT)
19
40
2
0.0
1
,40
0,9
45
,00
0
4,0
95
,01
8,0
00
9
6
91
9
17
5
21
1
,53
8
17
2
53
5
64
,71
0,0
00
2
09
,56
6,6
04
6
9,2
00
,00
0
Me
dic
al
Co
lle
ge
of
Ge
org
ia
Re
sea
rch
In
st.
20
01
3
.0
NA
N
A
NA
N
A
NA
N
A
NA
N
A
NA
N
A
NA
N
A
Me
dic
al
Co
lle
ge
of
Wis
con
sin
R
ese
arc
h F
nd
tn
19
84
3
.0
12
8,4
50
,34
5
38
6,0
19
,31
5
8
55
4
3
3
12
5
3
6
66
6,4
47
9
33
,49
5
66
6,4
47
Me
dic
al
Un
ive
rsit
y o
f S
ou
th C
aro
lin
a
19
94
1
.3
18
1,3
50
,41
5
49
7,4
70
,91
2
7
17
3
4
0
14
4
1
16
1
80
,58
1
1,4
85
,28
2
18
0,5
81
Mia
mi U
niv
ers
ity
NA
0
.0
22
,72
7,1
94
7
5,1
69
,63
9
0
1
0
5
18
1
1
1
,65
3,0
34
4
,07
4,3
76
1
,65
3,0
34
Mic
hig
an
Sta
te U
niv
ers
ity
19
92
5
.0
43
1,3
73
,00
0
1,1
61
,32
4,0
00
3
1
34
3
0
11
6
33
6
52
4
1
3,8
67
,80
3
12
,32
5,8
78
4
,01
6,7
33
Mic
hig
an
Te
chn
olo
gic
al
Un
ive
rsit
y 1
98
8
3.0
6
3,4
70
,64
4
18
4,2
21
,32
5
14
9
5
1
50
1
31
6
1
7
30
0,0
34
1
,26
7,5
98
3
08
,17
4
Mis
siss
ipp
i Sta
te U
niv
ers
ity
19
95
3
.0
23
1,6
75
,00
0
65
9,5
62
,00
0
12
4
6
1
51
1
58
8
1
6
32
8,0
80
1
,13
8,7
89
3
28
,08
0
Mo
nta
na
Sta
te U
niv
ers
ity
19
80
2
.0
10
9,4
81
,69
4
30
4,0
63
,93
8
53
1
91
1
2
2
70
4
1
7
27
3,7
90
8
35
,22
6
27
3,7
90
Mo
un
t S
ina
i Sch
oo
l o
f M
ed
icin
e o
f N
YU 1
,99
1
6.5
3
71
,08
8,1
09
9
88
,76
7,5
16
2
4
11
9
1
72
2
37
1
1
34
1
3,0
53
,23
6
66
,66
1,3
30
1
5,3
81
,63
1
Ne
w J
ers
ey
Inst
. o
f Te
chn
olo
gy
19
90
3
.0
92
,31
8,0
00
2
75
,00
1,0
00
5
6
21
1
0
76
2
53
1
7
43
5
07
,50
6
1,2
88
,90
9
50
7,5
06
Ne
w M
exic
o S
tate
Un
ive
rsit
y 1
99
0
1.0
1
25
,75
1,9
40
3
68
,61
6,9
40
2
9
2
2
1
8
7
5
15
,17
1
30
0,4
22
1
5,1
71
Ne
w Y
ork
Un
ive
rsit
y 1
98
9
5.0
3
65
,94
4,0
00
9
85
,47
7,0
00
4
0
32
8
6
13
4
36
8
58
7
1
17
8,2
68
,37
3
39
5,1
63
,33
0
17
8,3
89
,51
3
No
rth
Ca
roli
na
Sta
te U
niv
ers
ity
19
84
6
.0
36
0,7
95
,00
0
1,1
07
,53
2,0
00
7
4
45
0
4
12
4
40
8
32
3
2
5,1
11
,66
1
NA
5
,11
7,3
61
No
rth
Da
kota
Sta
te U
niv
ers
ity
19
95
1
.9
12
6,4
19
,24
5
35
5,1
46
,24
5
94
5
36
0
4
9
13
6
9
40
1
,88
3,8
61
4
,91
0,7
42
1
,88
4,3
61
No
rth
ern
Ari
zon
a U
niv
ers
ity
20
08
0
.3
NA
N
A
0
2
0
9
NA
5
0
NA
0
No
rth
ern
Ill
ino
is U
niv
ers
ity
19
88
0
.0
15
,34
6,9
35
N
A
0
2
0
11
N
A
1
9
10
,37
8
NA
1
0,3
78
No
rth
we
ste
rn U
niv
ers
ity
NA
6
.0
49
1,6
28
,94
3
1,2
59
,81
0,8
70
3
2
18
9
6
16
5
54
8
58
2
23
9
0,4
97
,51
0
94
7,4
03
,00
8
17
9,8
35
,14
8
NU
tech
Ve
ntu
res
20
09
7
.0
19
1,2
67
,27
2
NA
2
6
83
5
1
12
N
A
13
5
6
1,9
25
,41
7
NA
1
,92
5,4
17
Oh
io S
tate
Un
ive
rsit
y 1
99
0
6.8
7
55
,66
1,6
82
2
,17
4,6
86
,43
7
35
1
79
8
1
73
4
78
3
8
69
1
,89
9,8
44
5
,70
6,3
66
1
,90
7,0
46
Ok
lah
om
a S
tate
Un
ive
rsit
y 1
99
5
4.0
1
83
,10
7,2
09
4
84
,93
2,5
48
9
6
2
2
42
1
37
5
1
5
1,4
20
,63
4
4,0
97
,32
8
1,4
41
,39
1
Ore
go
n H
ea
lth
& S
cie
nce
Un
ive
rsit
y 1
98
9
4.8
3
91
,67
2,3
16
N
A
48
3
23
3
1
16
3
57
2
1
42
1
,20
1,2
02
7
,33
8,2
10
1
,22
5,5
08
Ore
go
n S
tate
Un
ive
rsit
y 1
98
0
4.0
2
16
,59
5,0
00
6
13
,71
2,0
00
3
2
12
9
0
52
1
84
1
8
22
2
,48
0,6
53
7
,23
4,6
03
2
,48
0,6
53
Pe
nn
Sta
te U
niv
ers
ity
19
89
4
.5
78
0,0
66
,00
0
2,2
62
,34
7,0
00
2
4
16
2
5
13
3
39
5
54
7
8
2,2
05
,74
4
4,9
10
,61
3
2,2
71
,00
2
Po
rtla
nd
Sta
te U
niv
ers
ity
20
05
N
A
58
,19
2,8
61
1
51
,37
9,6
64
6
1
7
0
13
4
0
1
6
91
,96
0
22
7,0
24
9
1,9
60
Pu
rdu
e R
ese
arc
h F
ou
nd
ati
on
1
98
8
7.0
5
72
,86
6,0
00
1
,59
2,0
82
,00
0
99
3
87
1
1
25
7
73
1
52
1
24
3
,93
1,6
28
1
1,4
19
,97
3
3,9
31
,62
8
Re
nss
ela
er
Po
lyte
chn
ic I
nst
. 1
99
3
3.7
6
8,1
69
,81
4
19
5,1
75
,41
7
8
71
2
7
7
19
7
25
4
5
1,0
15
,30
2
2,2
16
,02
6
1,0
70
,64
3
Na
me
of
Inst
itu
tio
n
Pro
gra
m
Sta
rt
2010
Lic
en
sin
g
FTE
2010
Re
sea
rch
Ex
pe
nd
itu
res
2008
-201
0
Cu
mu
lati
ve
Re
sea
rch
Ex
pe
nd
itu
res
2010
Lic
en
ses
an
d
Op
tio
ns
Ex
ec
ute
d
Cum
ulat
ive
Ac
tive
Lic
en
ses
2010
Sta
rtu
ps
2010
Inve
nti
on
Dis
clo
sure
s
2008
-201
0
Cu
mu
lati
ve
Inve
nti
on
Dis
clo
sure
s
2010
U.S
. Pa
ten
ts
Issu
ed
2010
Ne
w
Pa
ten
t
Ap
pli
ca
tio
ns
2010
Ad
just
ed
Gro
ss
Inc
om
e
2008
–20
10
Cu
mu
lati
ve
Ad
just
ed
Gro
ss
Inc
om
e
2010
Lic
en
se
Inc
om
e
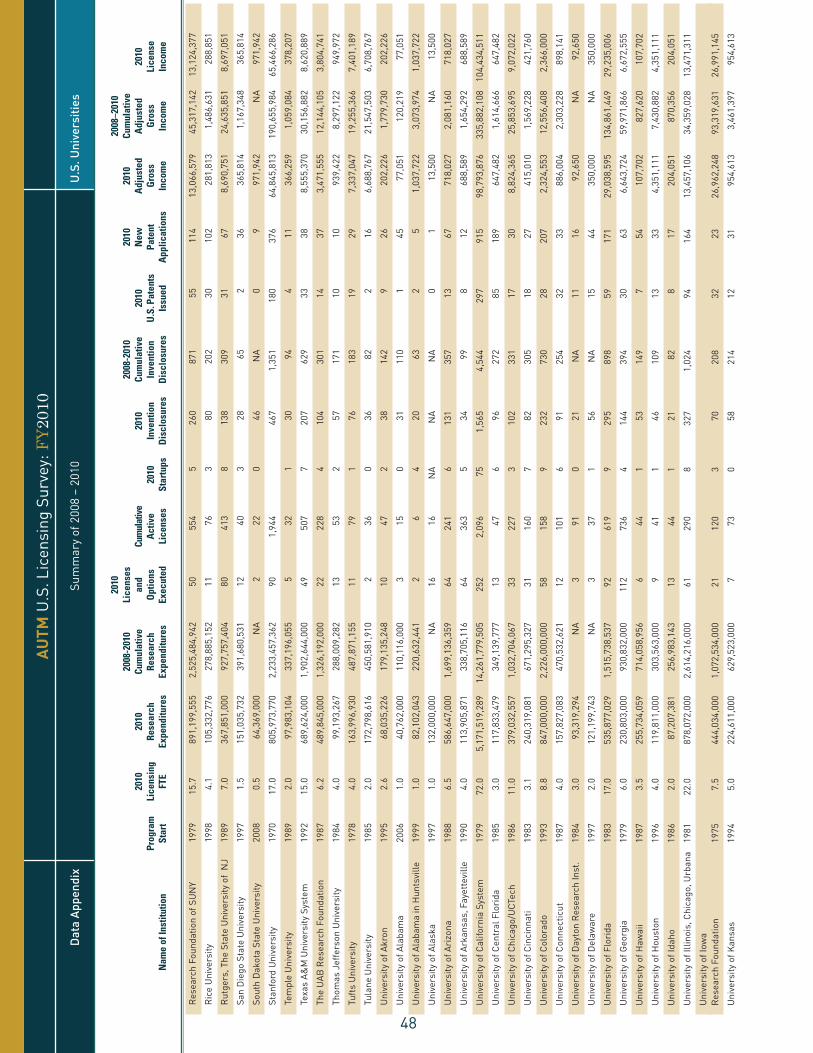
48
AUTM
U.S
. L
ice
nsi
ng
Su
rve
y: F
Y2010
U.S
. U
niv
ers
itie
sD
ata
Ap
pe
nd
ixS
um
ma
ry o
f 2
00
8 –
20
10
Re
sea
rch
Fo
un
da
tio
n o
f S
UN
Y 1
97
9
15
.7
89
1,1
99
,55
5
2,5
25
,48
4,9
42
5
0
55
4
5
26
0
87
1
55
1
14
1
3,0
66
,57
9
45
,31
7,1
42
1
3,1
24
,37
7
Ric
e U
niv
ers
ity
19
98
4
.1
10
5,3
32
,77
6
27
8,8
85
,15
2
11
7
6
3
80
2
02
3
0
10
2
28
1,8
13
1
,48
6,6
31
2
88
,85
1
Ru
tge
rs, T
he
Sta
te U
niv
ers
ity
of
NJ
19
89
7
.0
36
7,8
51
,00
0
92
7,7
57
,40
4
80
4
13
8
1
38
3
09
3
1
67
8
,69
0,7
51
2
4,6
35
,85
1
8,6
97
,05
1
Sa
n D
ieg
o S
tate
Un
ive
rsit
y 1
99
7
1.5
1
51
,03
5,7
32
3
91
,68
0,5
31
1
2
40
3
2
8
65
2
3
6
36
5,8
14
1
,16
7,3
48
3
65
,81
4
So
uth
Da
kota
Sta
te U
niv
ers
ity
20
08
0
.5
64
,36
9,0
00
N
A
2
22
0
4
6
NA
0
9
9
71
,94
2
NA
9
71
,94
2
Sta
nfo
rd U
niv
ers
ity
19
70
1
7.0
8
05
,97
3,7
70
2
,23
3,4
57
,36
2
90
1
,94
4
4
67
1
,35
1
18
0
37
6
64
,84
5,8
13
1
90
,65
5,9
84
6
5,4
66
,28
6
Tem
ple
Un
ive
rsit
y 1
98
9
2.0
9
7,9
83
,10
4
33
7,1
96
,05
5
5
32
1
3
0
94
4
1
1
36
6,2
59
1
,05
9,0
84
3
78
,20
7
Texa
s A
&M
Un
ive
rsit
y S
yste
m
19
92
1
5.0
6
89
,62
4,0
00
1
,90
2,6
44
,00
0
49
5
07
7
2
07
6
29
3
3
38
8
,55
5,3
70
3
0,1
56
,88
2
8,6
20
,88
9
Th
e U
AB
Re
sea
rch
Fo
un
da
tio
n
19
87
6
.2
48
9,8
45
,00
0
1,3
26
,19
2,0
00
2
2
22
8
4
10
4
30
1
14
3
7
3,4
71
,55
5
12
,14
4,1
05
3
,80
4,7
41
Th
om
as
Jeff
ers
on
Un
ive
rsit
y 1
98
4
4.0
9
9,1
93
,26
7
28
8,0
09
,28
2
13
5
3
2
57
1
71
1
0
10
9
39
,42
2
8,2
97
,12
2
94
9,9
72
Tuft
s U
niv
ers
ity
19
78
4
.0
16
3,9
96
,93
0
48
7,8
71
,15
5
11
7
9
1
76
1
83
1
9
29
7
,33
7,0
47
1
9,2
55
,36
6
7,4
01
,18
9
Tula
ne
Un
ive
rsit
y 1
98
5
2.0
1
72
,79
8,6
16
4
50
,58
1,9
10
2
3
6
0
36
8
2
2
16
6
,68
8,7
67
2
1,5
47
,50
3
6,7
08
,76
7
Un
ive
rsit
y o
f A
kro
n
19
95
2
.6
68
,03
5,2
26
1
79
,13
5,2
48
1
0
47
2
3
8
14
2
9
26
2
02
,22
6
1,7
79
,73
0
20
2,2
26
Un
ive
rsit
y o
f A
lab
am
a
20
06
1
.0
40
,76
2,0
00
1
10
,11
6,0
00
3
1
5
0
31
1
10
1
4
5
77
,05
1
12
0,2
19
7
7,0
51
Un
ive
rsit
y o
f A
lab
am
a in
Hu
nts
vill
e
19
99
1
.0
82
,10
2,0
43
2
20
,63
2,4
41
2
6
4
2
0
63
2
5
1
,03
7,7
22
3
,07
3,9
74
1
,03
7,7
22
Un
ive
rsit
y o
f A
lask
a
19
97
1
.0
13
2,0
00
,00
0
NA
1
6
16
N
A
NA
N
A
0
1
13
,50
0
NA
1
3,5
00
Un
ive
rsit
y o
f A
rizo
na
1
98
8
6.5
5
86
,64
7,0
00
1
,69
9,1
36
,35
9
64
2
41
6
1
31
3
57
1
3
67
7
18
,02
7
2,0
81
,16
0
71
8,0
27
Un
ive
rsit
y o
f A
rka
nsa
s, F
aye
tte
vill
e
19
90
4
.0
11
3,9
05
,87
1
33
8,7
05
,11
6
64
3
63
5
3
4
99
8
1
2
68
8,5
89
1
,65
4,2
92
6
88
,58
9
Un
ive
rsit
y o
f C
ali
forn
ia S
yste
m
19
79
7
2.0
5
,17
1,5
19
,28
9
14
,26
1,7
79
,50
5
25
2
2,0
96
7
5
1,5
65
4
,54
4
29
7
91
5
98
,79
3,8
76
3
35
,88
2,1
08
1
04
,43
4,5
11
Un
ive
rsit
y o
f C
en
tra
l F
lori
da
1
98
5
3.0
1
17
,83
3,4
79
3
49
,13
9,7
77
1
3
47
6
9
6
27
2
85
1
89
6
47
,48
2
1,6
14
,66
6
64
7,4
82
Un
ive
rsit
y o
f C
hic
ag
o/U
CTe
ch
19
86
1
1.0
3
79
,03
2,5
57
1
,03
2,7
04
,06
7
33
2
27
3
1
02
3
31
1
7
30
8
,82
4,3
65
2
5,8
53
,69
5
9,0
72
,02
2
Un
ive
rsit
y o
f C
inci
nn
ati
1
98
3
3.1
2
40
,31
9,0
81
6
71
,29
5,3
27
3
1
16
0
7
82
3
05
1
8
27
4
15
,01
0
1,5
69
,22
8
42
1,7
60
Un
ive
rsit
y o
f C
olo
rad
o
19
93
8
.8
84
7,0
00
,00
0
2,2
26
,00
0,0
00
5
8
15
8
9
23
2
73
0
28
2
07
2
,32
4,5
53
1
2,5
56
,40
8
2,3
66
,00
0
Un
ive
rsit
y o
f C
on
ne
ctic
ut
19
87
4
.0
15
7,8
27
,08
3
47
0,5
32
,62
1
12
1
01
6
9
1
25
4
32
3
3
88
6,0
04
2
,30
3,2
28
8
98
,14
1
Un
ive
rsit
y o
f D
ayt
on
Re
sea
rch
In
st.
19
84
3
.0
93
,31
9,2
94
N
A
3
91
0
2
1
NA
1
1
16
9
2,6
50
N
A
92
,65
0
Un
ive
rsit
y o
f D
ela
wa
re
19
97
2
.0
12
1,1
99
,74
3
NA
3
3
7
1
56
N
A
15
4
4
35
0,0
00
N
A
35
0,0
00
Un
ive
rsit
y o
f F
lori
da
1
98
3
17
.0
53
5,8
77
,02
9
1,5
15
,73
8,5
37
9
2
61
9
9
29
5
89
8
59
1
71
2
9,0
38
,59
5
13
4,8
61
,44
9
29
,23
5,0
06
Un
ive
rsit
y o
f G
eo
rgia
1
97
9
6.0
2
30
,80
3,0
00
9
30
,83
2,0
00
1
12
7
36
4
1
44
3
94
3
0
63
6
,64
3,7
24
5
9,9
71
,86
6
6,6
72
,55
5
Un
ive
rsit
y o
f H
aw
aii
19
87
3
.5
25
5,7
34
,05
9
71
4,0
58
,95
6
6
44
1
5
3
14
9
7
54
1
07
,70
2
82
7,6
20
1
07
,70
2
Un
ive
rsit
y o
f H
ou
sto
n
19
96
4
.0
11
9,8
11
,00
0
30
3,5
63
,00
0
9
41
1
4
6
10
9
13
3
3
4,3
51
,11
1
7,4
30
,88
2
4,3
51
,11
1
Un
ive
rsit
y o
f Id
ah
o
19
86
2
.0
87
,20
7,3
81
2
56
,98
3,1
43
1
3
44
1
2
1
82
8
1
7
20
4,0
51
8
70
,35
6
20
4,0
51
Un
ive
rsit
y o
f Il
lin
ois
, Ch
ica
go
, Urb
an
a
19
81
2
2.0
8
78
,07
2,0
00
2
,61
4,2
16
,00
0
61
2
90
8
3
27
1
,02
4
94
1
64
1
3,4
57
,10
6
34
,35
9,0
28
1
3,4
71
,31
1
Un
ive
rsit
y o
f Io
wa
R
ese
arc
h F
ou
nd
ati
on
1
97
5
7.5
4
44
,03
4,0
00
1
,07
2,5
34
,00
0
21
1
20
3
7
0
20
8
32
2
3
26
,96
2,2
48
9
3,3
19
,63
1
26
,99
1,1
45
Un
ive
rsit
y o
f K
an
sas
19
94
5
.0
22
4,6
11
,00
0
62
9,5
23
,00
0
7
73
0
5
8
21
4
12
3
1
95
4,6
13
3
,46
1,3
97
9
54
,61
3
Na
me
of
Inst
itu
tio
n
Pro
gra
m
Sta
rt
2010
Lic
en
sin
g
FTE
2010
Re
sea
rch
Ex
pe
nd
itu
res
2008
-201
0
Cu
mu
lati
ve
Re
sea
rch
Ex
pe
nd
itu
res
2010
Lic
en
ses
an
d
Op
tio
ns
Ex
ec
ute
d
Cum
ulat
ive
Ac
tive
Lic
en
ses
2010
Sta
rtu
ps
2010
Inve
nti
on
Dis
clo
sure
s
2008
-201
0
Cu
mu
lati
ve
Inve
nti
on
Dis
clo
sure
s
2010
U.S
. Pa
ten
ts
Issu
ed
2010
Ne
w
Pa
ten
t
Ap
pli
ca
tio
ns
2010
Ad
just
ed
Gro
ss
Inc
om
e
2008
–20
10
Cu
mu
lati
ve
Ad
just
ed
Gro
ss
Inc
om
e
2010
Lic
en
se
Inc
om
e

49
AUTM
U.S
. L
ice
nsi
ng
Su
rve
y: F
Y2010
U.S
. U
niv
ers
itie
sD
ata
Ap
pe
nd
ixS
um
ma
ry o
f 2
00
8 –
20
10
Un
ive
rsit
y o
f K
en
tuck
y R
ese
arc
h F
ou
nd
ati
on
1
98
4
2.0
N
A
NA
9
1
53
6
5
7
21
9
28
2
8
2,1
61
,74
3
5,0
61
,74
3
2,1
61
,74
3
Un
ive
rsit
y o
f L
ou
isvi
lle
1
99
6
7.0
1
89
,09
0,0
00
5
20
,39
1,0
00
6
N
A
NA
1
05
2
75
8
15
7,4
39
7
37
,17
0
15
7,4
39
Un
ive
rsit
y o
f M
ass
ach
use
tts
19
94
1
4.7
5
63
,99
8,8
98
1
,48
8,3
05
,89
8
42
2
81
2
1
69
4
97
4
4
77
3
9,9
46
,26
6
14
6,2
56
,66
1
40
,01
9,1
74
Un
ive
rsit
y o
f M
em
ph
is
20
08
1
.0
NA
N
A
NA
N
A
0
18
N
A
1
16
5
0,5
00
N
A
50
,50
0
Un
ive
rsit
y o
f M
iam
i 1
98
9
4.0
3
29
,80
0,0
00
9
73
,10
0,0
00
4
7
7
2
97
2
75
5
6
5
1,3
05
,66
1
3,2
74
,50
1
1,3
05
,66
1
Un
ive
rsit
y o
f M
ich
iga
n
19
82
9
.0
1,1
39
,49
3,9
86
3
,03
1,8
13
,40
6
97
3
96
1
0
29
0
94
6
82
1
53
3
7,9
70
,90
5
78
,34
5,9
34
3
9,8
22
,11
3
Un
ive
rsit
y o
f M
inn
eso
ta
19
57
1
6.0
6
53
,61
6,8
19
1
,82
8,0
21
,77
5
73
9
05
8
2
55
7
16
4
6
80
8
2,9
54
,51
6
26
1,4
04
,90
5
83
,90
5,6
60
Un
ive
rsit
y o
f M
issi
ssip
pi
19
92
2
.0
50
,28
1,0
00
1
59
,69
9,0
00
3
2
1
2
9
21
3
9
1
10
,88
3
27
3,2
29
1
10
,88
3
Un
ive
rsit
y o
f M
isso
uri
, all
ca
mp
use
s 1
98
7
10
.6
32
5,5
52
,70
3
1,0
19
,41
3,4
80
5
4
13
5
7
13
1
42
9
35
5
9
10
,09
8,4
37
2
7,2
12
,39
6
10
,09
8,7
70
Un
ive
rsit
y o
f N
eb
rask
a
19
92
1
1.0
3
29
,48
5,9
04
1
,04
6,9
56
,86
5
47
1
30
7
1
59
4
63
2
4
10
2
3,7
03
,95
4
8,4
29
,89
8
3,7
15
,46
4
Un
ive
rsit
y o
f N
eva
da
at
Re
no
2
00
0
1.0
9
5,4
23
,00
0
24
3,9
75
,82
1
1
19
0
2
5
NA
1
1
17
1
09
,94
1
37
1,8
60
1
09
,94
1
Un
ive
rsit
y o
f N
ew
Ha
mp
shir
e
19
97
1
.5
12
0,6
70
,04
3
31
7,3
59
,93
2
12
1
00
1
1
1
38
4
7
2
96
,67
1
84
8,1
55
2
96
,67
1
Un
ive
rsit
y o
f N
ew
Mex
ico
/S
ci.
& T
ech
. C
orp
. 1
99
5
3.5
2
11
,77
1,0
42
6
11
,16
8,2
56
3
3
77
5
1
22
3
47
2
6
10
5
3,7
72
,65
9
5,1
38
,56
4
3,7
72
,65
9
Un
ive
rsit
y o
f N
ort
h C
aro
lin
a
at
Gre
en
sbo
ro
20
02
1
.0
35
,28
8,2
99
1
05
,09
2,4
99
3
1
8
1
12
4
7
0
5
12
0,5
23
4
73
,62
1
12
0,5
23
Un
ive
rsit
y o
f N
ort
h C
aro
lin
a,
Ch
ap
el
Hil
l 1
98
5
6.0
7
37
,59
1,9
59
2
,02
4,0
63
,57
2
39
5
50
5
1
25
3
84
2
7
64
2
,51
7,0
61
7
,92
5,6
15
2
,59
7,8
41
Un
ive
rsit
y o
f N
ort
h C
aro
lin
a,
Ch
arl
ott
e
19
93
3
.0
34
,37
5,3
76
9
4,5
83
,46
4
6
50
4
3
7
12
0
6
55
4
5,6
85
2
44
,45
4
45
,68
5
Un
ive
rsit
y o
f N
ort
h T
exa
s H
ea
lth
Sci
en
ce C
en
ter.
1
99
9
1.5
3
9,8
54
,87
8
10
6,0
63
,92
3
4
25
0
2
8
61
2
8
5
1,6
08
1
49
,10
0
51
,60
8
Un
ive
rsit
y o
f N
otr
e D
am
e
19
99
3
.0
11
0,3
68
,85
5
31
8,5
68
,85
5
8
21
2
3
9
12
0
11
2
9
31
4,8
86
5
70
,02
7
33
8,1
61
Un
ive
rsit
y o
f O
kla
ho
ma
, All
Ca
mp
use
s 1
98
4
6.0
1
60
,55
9,0
80
4
73
,08
8,7
67
3
5
2
1
49
1
69
2
2
27
4
28
,03
5
1,1
81
,83
8
43
0,4
89
Un
ive
rsit
y o
f O
reg
on
1
99
2
3.8
1
15
,60
9,3
76
3
27
,27
3,3
96
3
0
13
2
1
30
8
8
7
19
7
,41
6,3
92
2
1,3
56
,49
6
7,4
96
,76
6
Un
ive
rsit
y o
f P
en
nsy
lva
nia
1
98
6
12
.0
78
5,3
17
,00
0
2,2
13
,50
7,6
60
6
8
50
6
4
37
3
1,0
77
6
4
48
3
11
,04
7,0
00
3
0,5
52
,05
2
11
,25
9,0
00
Un
ive
rsit
y o
f P
itts
bu
rgh
1
99
2
6.3
7
37
,02
5,0
00
2
,03
2,5
76
,00
0
80
2
20
6
2
25
7
23
3
3
69
3
,60
6,4
10
1
3,8
91
,64
9
3,8
39
,15
7
Un
ive
rsit
y o
f R
ho
de
Isl
an
d
19
91
2
.0
81
,32
6,0
00
2
10
,72
6,0
00
3
4
2
0
21
4
1
4
20
2
00
,75
2
1,2
23
,37
3
20
0,7
52
Un
ive
rsit
y o
f R
och
est
er
19
80
9
.0
46
0,5
22
,00
0
1,1
99
,37
0,1
72
1
9
12
8
5
12
3
41
8
21
4
6
41
,65
3,5
83
1
59
,94
3,1
02
4
1,6
64
,03
6
Un
ive
rsit
y o
f S
ou
th A
lab
am
a
19
95
2
.0
35
,50
0,0
00
9
6,4
61
,27
4
3
4
2
17
3
9
3
10
2
,30
2,1
92
6
,87
8,0
31
2
,30
2,1
92
Un
ive
rsit
y o
f S
ou
th C
aro
lin
a
19
93
1
.0
12
6,9
94
,39
8
52
2,6
52
,77
6
16
4
2
1
61
1
86
6
3
3
53
7,6
79
8
87
,04
5
53
7,6
79
Un
ive
rsit
y o
f S
ou
th D
ako
ta
20
06
N
A
34
,50
0,0
00
9
1,9
32
,00
0
0
0
2
4
14
0
1
2
5,0
00
5
0,0
00
2
5,0
00
Un
ive
rsit
y o
f S
ou
th F
lori
da
1
99
0
3.4
3
90
,85
0,0
00
N
A
37
1
55
5
1
61
N
A
67
8
4
17
,41
1,6
25
N
A
17
,41
1,6
25
Un
ive
rsit
y o
f S
ou
the
rn C
ali
forn
ia
19
71
1
5.0
5
92
,79
0,8
73
1
,61
0,4
31
,64
2
24
1
70
6
1
66
5
12
5
8
10
9
12
,27
6,7
32
2
3,9
23
,22
1
12
,29
6,6
93
Un
ive
rsit
y o
f Te
nn
ess
ee
1
98
3
2.0
2
86
,28
0,5
73
8
16
,88
9,3
21
1
5
14
0
4
91
2
72
2
2
96
2
13
,05
9
5,1
42
,65
2
42
8,3
26
Un
ive
rsit
y o
f Te
xas
Sys
tem
1
98
5
46
.7
2,3
46
,09
9,5
22
N
A
17
5
1,1
60
3
3
71
3
NA
1
50
3
68
3
5,2
78
,12
5
NA
3
8,3
09
,48
7
Na
me
of
Inst
itu
tio
n
Pro
gra
m
Sta
rt
2010
Lic
en
sin
g
FTE
2010
Re
sea
rch
Ex
pe
nd
itu
res
2008
-201
0
Cu
mu
lati
ve
Re
sea
rch
Ex
pe
nd
itu
res
2010
Lic
en
ses
an
d
Op
tio
ns
Ex
ec
ute
d
Cum
ulat
ive
Ac
tive
Lic
en
ses
2010
Sta
rtu
ps
2010
Inve
nti
on
Dis
clo
sure
s
2008
-201
0
Cu
mu
lati
ve
Inve
nti
on
Dis
clo
sure
s
2010
U.S
. Pa
ten
ts
Issu
ed
2010
Ne
w
Pa
ten
t
Ap
pli
ca
tio
ns
2010
Ad
just
ed
Gro
ss
Inc
om
e
2008
–20
10
Cu
mu
lati
ve
Ad
just
ed
Gro
ss
Inc
om
e
2010
Lic
en
se
Inc
om
e
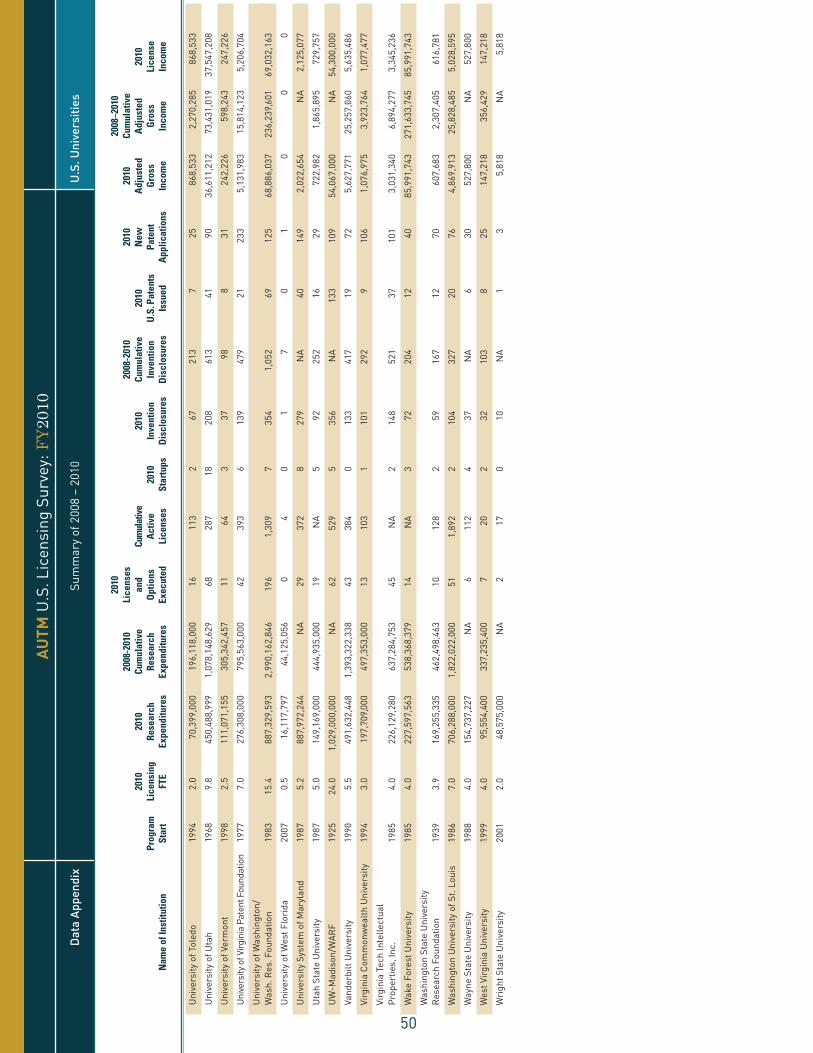
50
AUTM
U.S
. L
ice
nsi
ng
Su
rve
y: F
Y2010
U.S
. U
niv
ers
itie
sD
ata
Ap
pe
nd
ixS
um
ma
ry o
f 2
00
8 –
20
10
Un
ive
rsit
y o
f To
led
o
19
94
2
.0
70
,39
9,0
00
1
96
,11
8,0
00
1
6
11
3
2
67
2
13
7
2
5
86
8,5
33
2
,27
0,2
85
8
68
,53
3
Un
ive
rsit
y o
f U
tah
1
96
8
9.8
4
50
,48
8,9
99
1
,07
8,1
48
,62
9
68
2
87
1
8
20
8
61
3
41
9
0
36
,61
1,2
12
7
3,4
31
,01
9
37
,54
7,2
08
Un
ive
rsit
y o
f V
erm
on
t 1
99
8
2.5
1
11
,07
1,1
55
3
05
,34
2,4
57
1
1
64
3
3
7
98
8
3
1
24
2,2
26
5
98
,24
3
24
7,2
26
Un
iver
sity
of V
irg
inia
Pat
ent
Fou
nd
atio
n
19
77
7
.0
27
6,3
08
,00
0
79
5,5
63
,00
0
42
3
93
6
1
39
4
79
2
1
23
3
5,1
31
,98
3
15
,81
4,1
23
5
,20
6,7
04
Un
ive
rsit
y o
f W
ash
ing
ton
/
Wa
sh.
Re
s. F
ou
nd
ati
on
1
98
3
15
.4
88
7,3
29
,59
3
2,9
90
,16
2,8
46
1
96
1
,30
9
7
35
4
1,0
52
6
9
12
5
68
,88
6,0
37
2
36
,23
9,6
01
6
9,0
32
,16
3
Un
ive
rsit
y o
f W
est
Flo
rid
a
20
07
0
.5
16
,11
7,7
97
4
4,1
25
,05
6
0
4
0
1
7
0
1
0
0
0
Un
ive
rsit
y S
yste
m o
f M
ary
lan
d
19
87
5
.2
88
7,9
72
,24
4
NA
2
9
37
2
8
27
9
NA
4
0
14
9
2,0
22
,65
4
NA
2
,12
5,0
77
Uta
h S
tate
Un
ive
rsit
y 1
98
7
5.0
1
49
,16
9,0
00
4
44
,93
5,0
00
1
9
NA
5
9
2
25
2
16
2
9
72
2,9
82
1
,86
5,8
95
7
29
,75
7
UW
-Ma
dis
on
/WA
RF
1
92
5
24
.0
1,0
29
,00
0,0
00
N
A
62
5
29
5
3
56
N
A
13
3
10
9
54
,06
7,0
00
N
A
54
,30
0,0
00
Van
de
rbil
t U
niv
ers
ity
19
90
5
.5
49
1,6
32
,44
8
1,3
93
,32
2,3
38
4
3
38
4
0
13
3
41
7
19
7
2
5,6
27
,77
1
25
,25
7,0
60
5
,63
5,4
86
Vir
gin
ia C
om
mo
nw
ea
lth
Un
ive
rsit
y 1
99
4
3.0
1
97
,70
9,0
00
4
97
,35
3,0
00
1
3
10
3
1
10
1
29
2
9
10
6
1,0
76
,97
5
3,9
23
,76
4
1,0
77
,47
7
Vir
gin
ia T
ech
In
tell
ect
ua
l
Pro
pe
rtie
s, I
nc.
1
98
5
4.0
2
26
,12
9,2
80
6
37
,28
4,7
53
4
5
NA
2
1
48
5
21
3
7
10
1
3,0
31
,34
0
6,8
94
,27
7
3,3
45
,23
6
Wa
ke
Fo
rest
Un
ive
rsit
y 1
98
5
4.0
2
27
,59
7,5
63
5
38
,36
8,3
79
1
4
NA
3
7
2
20
4
12
4
0
85
,99
1,7
43
2
71
,63
3,7
45
8
5,9
91
,74
3
Wa
shin
gto
n S
tate
Un
ive
rsit
y
Re
sea
rch
Fo
un
da
tio
n
19
39
3
.9
16
9,2
55
,33
5
46
2,4
98
,46
3
10
1
28
2
5
9
16
7
12
7
0
60
7,6
83
2
,30
7,4
05
6
16
,78
1
Wa
shin
gto
n U
niv
ers
ity
of
St.
Lo
uis
1
98
6
7.0
7
06
,28
8,0
00
1
,82
2,0
22
,00
0
51
1
,89
2
2
10
4
32
7
20
7
6
4,8
69
,91
3
25
,82
8,4
85
5
,02
8,5
95
Wa
yne
Sta
te U
niv
ers
ity
19
88
4
.0
15
4,7
37
,22
7
NA
6
1
12
4
3
7
NA
6
3
0
52
7,8
00
N
A
52
7,8
00
We
st V
irg
inia
Un
ive
rsit
y 1
99
9
4.0
9
5,5
54
,40
0
33
7,2
35
,40
0
7
20
2
3
2
10
3
8
25
1
47
,21
8
35
6,4
29
1
47
,21
8
Wri
gh
t S
tate
Un
ive
rsit
y 2
00
1
2.0
4
8,5
75
,00
0
NA
2
1
7
0
10
N
A
1
3
5,8
18
N
A
5,8
18
Na
me
of
Inst
itu
tio
n
Pro
gra
m
Sta
rt
2010
Lic
en
sin
g
FTE
2010
Re
sea
rch
Ex
pe
nd
itu
res
2008
-201
0
Cu
mu
lati
ve
Re
sea
rch
Ex
pe
nd
itu
res
2010
Lic
en
ses
an
d
Op
tio
ns
Ex
ec
ute
d
Cum
ulat
ive
Ac
tive
Lic
en
ses
2010
Sta
rtu
ps
2010
Inve
nti
on
Dis
clo
sure
s
2008
-201
0
Cu
mu
lati
ve
Inve
nti
on
Dis
clo
sure
s
2010
U.S
. Pa
ten
ts
Issu
ed
2010
Ne
w
Pa
ten
t
Ap
pli
ca
tio
ns
2010
Ad
just
ed
Gro
ss
Inc
om
e
2008
–20
10
Cu
mu
lati
ve
Ad
just
ed
Gro
ss
Inc
om
e
2010
Lic
en
se
Inc
om
e

51
AUTM
U.S
. L
ice
nsi
ng
Su
rve
y: F
Y2010
Da
ta A
pp
en
dix
Su
mm
ary
of
20
08
– 2
01
0
Be
th I
sra
el
De
aco
ne
ss M
ed
ica
l C
en
ter.
19
97
4
.0
22
3,8
53
,00
0
60
9,5
20
,00
0
18
1
63
5
9
9
26
2
20
3
8
3,4
32
,77
4
8,1
54
,38
5
3,5
83
,78
3
Bri
gh
am
& W
om
en
’s H
osp
ita
l, I
nc.
1
98
6
12
.0
53
7,3
34
,00
0
1,4
63
,58
9,0
00
5
5
29
5
1
15
7
44
0
31
7
6
17
,99
1,8
61
3
8,0
48
,71
3
20
,28
6,0
03
Ce
da
rs-S
ina
i Me
dic
al
Ce
nte
r.
19
91
4
.0
86
,51
4,6
84
2
40
,12
5,4
67
5
3
3
0
38
1
03
1
3
41
1
3,6
00
,56
6
43
,31
4,0
98
1
3,6
00
,56
6
Ch
ild
ren
’s H
osp
ita
l B
ost
on
1
99
1
6.0
2
23
,69
3,8
58
6
22
,67
0,0
50
3
0
23
9
1
11
7
36
1
19
3
2
11
,30
8,1
39
3
5,5
98
,00
9
12
,55
0,7
00
Ch
ild
ren
’s H
osp
ita
l O
ak
lan
d R
ese
arc
h I
nst
. 2
00
1
1.0
5
0,7
36
,31
5
14
2,9
04
,63
7
6
32
0
1
5
43
6
7
9
9,8
56
7
39
,92
0
99
,85
6
Ch
ild
ren
’s H
osp
ita
l o
f P
hil
ad
elp
hia
1
99
1
1.0
2
19
,57
9,0
00
6
44
,48
5,0
00
7
3
5
0
50
1
57
5
1
8
30
3,7
48
1
91
,29
3,8
53
3
03
,74
8
Ch
ild
ren
’s H
osp
ita
l, C
inci
nn
ati
1
99
7
3.5
2
70
,05
7,9
75
7
56
,45
8,6
84
2
0
15
1
2
93
2
82
1
0
10
1
,73
4,0
90
2
7,6
11
,08
0
1,8
20
,37
5
Cit
y o
f H
op
e N
ati
on
al
Me
dic
al
Ce
nte
r. &
Be
ckm
an
Re
sea
1
98
6
3.0
2
65
,80
6,8
47
7
69
,51
0,8
47
7
4
2
0
52
8
4
7
29
2
02
,26
4,8
75
8
06
,60
4,1
21
2
02
,26
4,8
75
Cle
vela
nd
Cli
nic
1
98
9
10
.0
25
2,0
00
,00
0
68
7,5
91
,00
0
35
2
19
5
2
07
6
14
3
8
56
3
5,3
75
,26
9
51
,08
2,6
07
3
5,5
05
,00
2
Da
na
-Fa
rbe
r C
an
cer
Inst
. 1
98
1
6.0
2
61
,42
1,4
13
6
98
,49
5,3
16
3
6
38
5
1
74
2
57
2
7
38
7
,03
4,0
13
1
7,2
34
,57
5
7,4
55
,21
9
Fre
d H
utc
hin
son
Ca
nce
r R
es.
Ce
nte
r.
19
88
4
.0
32
0,1
58
,00
0
91
4,7
99
,00
0
17
1
86
2
4
0
11
2
6
12
1
2,6
74
,98
0
26
,05
8,5
94
1
2,8
24
,15
3
H L
ee
Mo
ffitt
Ca
nce
r C
en
ter
&
Re
sea
rch
In
st.
20
04
3
.0
12
4,7
99
,36
1
35
8,8
53
,31
8
18
2
6
3
32
9
8
5
22
2
55
,47
1
50
9,6
41
2
79
,77
2
Ma
yo F
dn
. fo
r M
ed
ica
l E
du
cati
on
an
d R
ese
arc
h
19
86
1
5.3
5
55
,00
0,0
00
1
,63
3,0
00
,00
0
73
6
29
5
3
33
1
,10
2
68
9
6
22
,39
1,0
92
6
7,1
98
,37
7
22
,46
3,8
83
Na
tio
na
l Je
wis
h H
ea
lth
1
99
4
1.0
6
6,6
06
,55
6
17
9,4
04
,75
1
7
10
6
1
27
8
5
3
5
13
4,0
34
5
82
,16
9
13
4,0
34
RU
SH
-Pre
sbyt
eri
an
-St.
L
uk
e’s
Me
dic
al
Ce
nte
r 2
00
3
2.0
9
0,8
62
,12
8
22
0,5
81
,38
9
2
22
0
1
8
66
7
2
1
,02
1,1
50
1
,34
0,0
12
1
,02
1,1
50
Sa
nfo
rd-B
urn
ha
m M
ed
ica
l R
ese
arc
h I
nst
. 1
99
5
6.4
9
7,1
00
,00
0
27
7,9
17
,00
0
3
83
0
3
4
10
7
22
3
0
86
6,0
00
2
,60
5,0
00
8
66
,00
0
Slo
an
Ke
tte
rin
g I
nst
. fo
r C
an
cer
Re
s.
19
81
8
.0
42
1,4
09
,00
0
1,1
93
,98
9,0
00
2
6
29
0
1
60
1
91
2
0
16
1
39
,08
2,5
54
4
86
,32
0,3
61
1
39
,37
0,3
32
St.
Ju
de
Ch
ild
ren
’s R
ese
arc
h H
osp
ita
l 1
99
5
3.0
2
86
,87
4,3
60
8
26
,25
3,0
54
1
0
26
7
0
36
1
18
5
1
0
3,3
97
,90
7
9,1
36
,19
1
3,4
04
,46
4
Th
e G
en
era
l H
osp
ita
l d
ba
M
ass
ach
use
tts
Ge
ne
ral
Ho
s 1
97
6
21
.5
67
3,9
84
,00
0
1,8
63
,05
3,0
00
1
20
7
39
6
2
61
8
60
7
2
12
7
71
,20
7,0
59
1
61
,94
7,6
17
7
7,0
91
,50
3
Th
e J
ack
son
La
bo
rato
ry
20
02
1
.5
66
,10
0,0
00
N
A
27
8
9
0
10
N
A
3
3
95
0,0
00
N
A
1,2
00
,00
0
Th
e S
alk
In
st.
for
Bio
log
ica
l S
tud
ies
19
69
3
.0
90
,74
4,1
75
2
46
,70
5,6
46
1
5
24
1
1
33
1
10
8
2
8
2,6
63
,57
9
24
,08
4,9
02
2
,81
3,1
07
Tuft
s M
ed
ica
l C
en
ter.
1
99
3
1.0
7
9,3
84
,00
0
22
6,4
20
,00
0
7
35
2
2
4
76
2
5
3
59
,02
2
1,9
13
,30
1
45
3,1
05
Wh
ite
he
ad
In
st.
for
Bio
me
dic
al
Re
sea
rch
1
98
7
2.8
4
5,4
92
,00
0
NA
2
0
87
1
2
5
NA
8
7
6
2,8
45
,85
5
NA
3
,16
0,0
00
Wis
tar
Inst
. 1
99
1
1.0
5
6,4
02
,00
0
16
2,9
49
,00
0
16
1
40
0
4
2
4
6
6
13
,20
7,0
00
3
6,8
07
,00
0
13
,22
3,0
00
U.S
. H
os
pit
als
an
d
Re
se
arc
h I
ns
titu
tio
ns
Na
me
of
Inst
itu
tio
n
Pro
gra
m
Sta
rt
2010
Lic
en
sin
g
FTE
2010
Re
sea
rch
Ex
pe
nd
itu
res
2008
-201
0
Cu
mu
lati
ve
Re
sea
rch
Ex
pe
nd
itu
res
2010
Lic
en
ses
an
d
Op
tio
ns
Ex
ec
ute
d
Cum
ulat
ive
Ac
tive
Lic
en
ses
2010
Sta
rtu
ps
2010
Inve
nti
on
Dis
clo
sure
s
2008
-201
0
Cu
mu
lati
ve
Inve
nti
on
Dis
clo
sure
s
2010
U.S
. Pa
ten
ts
Issu
ed
2010
Ne
w
Pa
ten
t
Ap
pli
ca
tio
ns
2010
Ad
just
ed
Gro
ss
Inc
om
e
2008
–20
10
Cu
mu
lati
ve
Ad
just
ed
Gro
ss
Inc
om
e
2010
Lic
en
se
Inc
om
e

APPENDIX 7
LSUHSC-S Organizational Chart

Senio
r A
ssocia
te D
ean a
nd
LS
U H
osp
ital C
MO
Ass
ocia
te D
ean
Rese
arc
h
LS
U H
EA
LTH
SC
IEN
CE
S C
EN
TE
R A
T S
HR
EVE
PO
RT
OR
GA
NIZ
ATIO
NA
L C
HA
RT
Vic
e C
hancellor
Clinic
al A
ffair
s
Clinic
al
Board
Com
pliance
DIO
/
Educati
on
Phys
icia
n
Serv
ices
Chancellor
Vic
e C
hancellor
Busi
ness
and R
ein
burs
em
ent
Ass
ista
nt
Vic
e C
hancellor
Info
rmati
on T
echnolo
gy
Accounti
ng
Auxi
liari
es
Budget
Offi
ce
Hosp
ital B
illing
Hum
an R
eso
urc
es
Purc
hasi
ng
Reim
burs
em
ents
Stu
dent
Fin
ancia
l A
id
Dean
School of
Gra
duate
Stu
die
s
Gra
duate
Pro
gra
ms
Legal A
ffair
s
Info
rmati
on S
erv
ices
Dean
School of
Medic
ine
Rese
arc
h
Serv
ices
Anim
al R
eso
urc
es
Rese
arc
h C
ore
Facilit
y
Sponso
red P
rogra
ms
/
Technolo
gy
Tra
nsf
er
Clinic
al R
ese
arc
h O
ffice
Ass
ocia
te D
ean
Academ
ic A
ffair
s
Ass
ista
nt
Dean
VA
MC
Aff
air
s
Ass
ista
nt
Dean
Stu
dent
Aff
air
s
Ass
ista
nt
Dean
Educati
on
Pro
gra
m
Dev
elop
men
t
Basi
c S
cie
nces
Depart
ments
Oth
er
Academ
ic
Depart
ments
Clinic
al S
cie
nces
Depart
ments
Cente
rs o
f
Exc
ellence
Sta
ndin
g
Com
mit
tees
Ass
ista
nt
Dean
Stu
dent
Adm
issi
ons
Revi
sed:
9/1
3/2
01
0
Dean
School of
Allie
d H
ealt
h P
rofe
ssio
ns
Depart
ment
of
Rehabilit
ati
on
Scie
nces
Depart
ment
of
Clinic
al
Scie
nces
Ass
ista
nt
Dean
Academ
ic A
ffair
s
Depart
ment
of
Clinic
al
Serv
ices
Ass
ista
nt
Dean
for
Rese
arc
h
and T
echnolo
gy
Tra
nsf
er
Vic
e C
hancellor
Adm
inis
trati
on
Adm
inis
trato
r
LS
U H
osp
ital
Phys
ical
Pla
nt
Support
Serv
ices
LS
U
Hosp
ital
E.A
. C
onw
ay
Medic
al C
ente
r
Huey
P. Long
Medic
al C
ente
r