lower snake river dams power replacement … · study overview. energy strategies ... study...
TRANSCRIPT
1PageENERGY STRATEGIES © 2018 | LSR Dam Power Replacement Study
March 2018Full Summary SlidesStudy commissioned by the NW Energy Coalition
LOWER SNAKE RIVER DAMS POWER REPLACEMENT STUDYRegional power system planning assessment of the technical feasibility and cost implications of replacing the Lower Snake River dams with clean energy portfolios
Keegan Moyer, PrincipalBen Brownlee, Consulting EngineerKathleen Fraser, Senior Consultant
Daniel Ramirez, ConsultantGordon Comegys, Subcontractor (CPS)

SUMMARY
3PageENERGY STRATEGIES © 2018 | LSR Dam Power Replacement Study
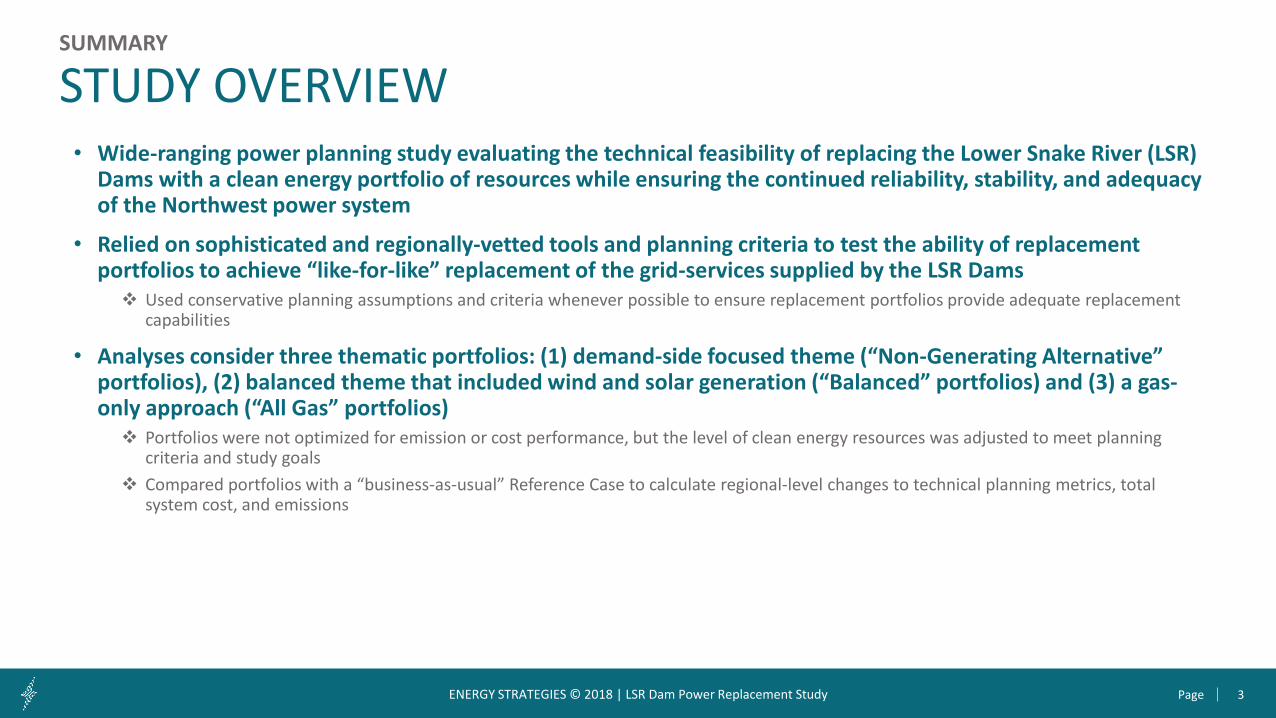
• Wide-ranging power planning study evaluating the technical feasibility of replacing the Lower Snake River (LSR) Dams with a clean energy portfolio of resources while ensuring the continued reliability, stability, and adequacy of the Northwest power system
• Relied on sophisticated and regionally-vetted tools and planning criteria to test the ability of replacement portfolios to achieve “like-for-like” replacement of the grid-services supplied by the LSR Dams Used conservative planning assumptions and criteria whenever possible to ensure replacement portfolios provide adequate replacement
capabilities
• Analyses consider three thematic portfolios: (1) demand-side focused theme (“Non-Generating Alternative” portfolios), (2) balanced theme that included wind and solar generation (“Balanced” portfolios) and (3) a gas-only approach (“All Gas” portfolios) Portfolios were not optimized for emission or cost performance, but the level of clean energy resources was adjusted to meet planning
criteria and study goals Compared portfolios with a “business-as-usual” Reference Case to calculate regional-level changes to technical planning metrics, total
system cost, and emissions
SUMMARY
STUDY OVERVIEW
4PageENERGY STRATEGIES © 2018 | LSR Dam Power Replacement Study
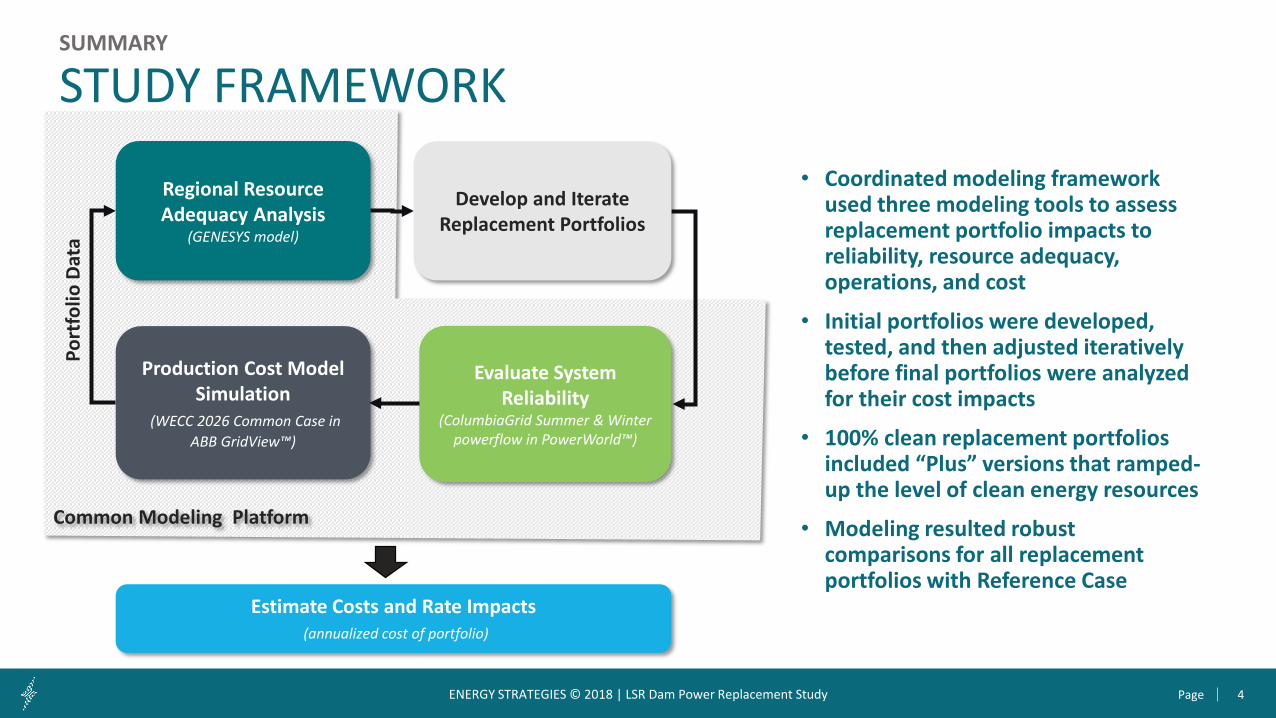
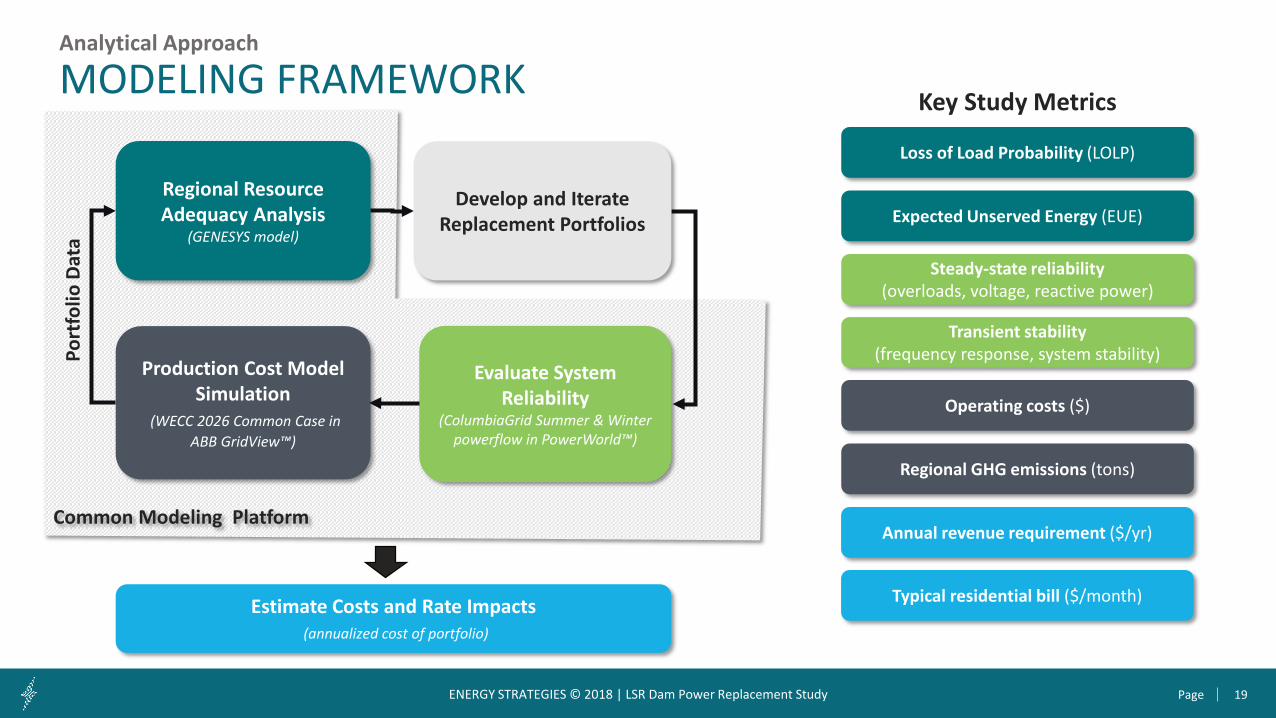
• Coordinated modeling framework used three modeling tools to assess replacement portfolio impacts to reliability, resource adequacy, operations, and cost
• Initial portfolios were developed, tested, and then adjusted iteratively before final portfolios were analyzed for their cost impacts
• 100% clean replacement portfolios included “Plus” versions that ramped-up the level of clean energy resources
• Modeling resulted robust comparisons for all replacement portfolios with Reference Case
SUMMARY
STUDY FRAMEWORK
Regional Resource Adequacy Analysis
(GENESYS model)
Evaluate System Reliability
(ColumbiaGrid Summer & Winter powerflow in PowerWorld™)
Production Cost Model Simulation
(WECC 2026 Common Case in ABB GridView™)
Estimate Costs and Rate Impacts (annualized cost of portfolio)
Develop and Iterate Replacement Portfolios
Port
folio
Dat
a
Common Modeling Platform

5PageENERGY STRATEGIES © 2018 | LSR Dam Power Replacement Study
REPLACEMENT PORTFOLIOS AND RESULTSSUMMARY
Replacement Portfolios GHG Reduction Policy Sensitivity
NGA NGA Plus Balanced Balanced Plus All Gas NGA Plus Balanced Plus All Gas
Repl
acem
ent
Reso
urce
s
Demand-side ~1,000 MW DR320 aMW EE
~1000 MW DR880 aMW EE
~500 MW DR160 aMW EE
~500 MW DR160 aMW EE - ~500 MW DR
160 aMW EE~500 MW DR160 aMW EE -
Resource-side - - 500 MW wind250 MW solar
1,250 MW wind750 MW solar
500 MW NGCC450 MW recip
500 MW wind250 MW solar
1,250 MW wind750 MW solar
500 MW NGCC450 MW recip
Capacity Market 100 MW 100 MW - - - 100 MW - -
Port
folio
Pe
rfor
man
ce
Resource Adequacy (Δ LOLP%) -1.1% -2.1% -0.4% -1.3% -0.3% -2.1% -1.3% -0.3%
Δ Reliability All met NERC/WECC criteria, but for one reliability issue identified in all replacement portfolios (mitigated w/ transmission upgrade and cost captured)
Δ GHG Regional Emissions (%) +5% +2% +5% +1% +8% 0% -2% +5%
Cost
s
Δ Total Annual Cost($M/year) $421 $1,191 $396 $464 $535 $1,224 $501 $581
Δ Region Revenue Requirement in 2026 (%) +2.7% +7.6% +2.5% +3.0% +3.4% +7.6% 3.21% +3.7%
Δ Levelized Monthly Bill($/Month) $1.16 $3.28 $1.09 $1.28 $1.47 $3.37 $1.38 $1.60
DR = demand responseEE = energy efficiency
NGCC = natural gas-fired combined cycleRecip = reciprocating engine
All are changes relative to Reference Case that retains
the LSR Dams
6PageENERGY STRATEGIES © 2018 | LSR Dam Power Replacement Study
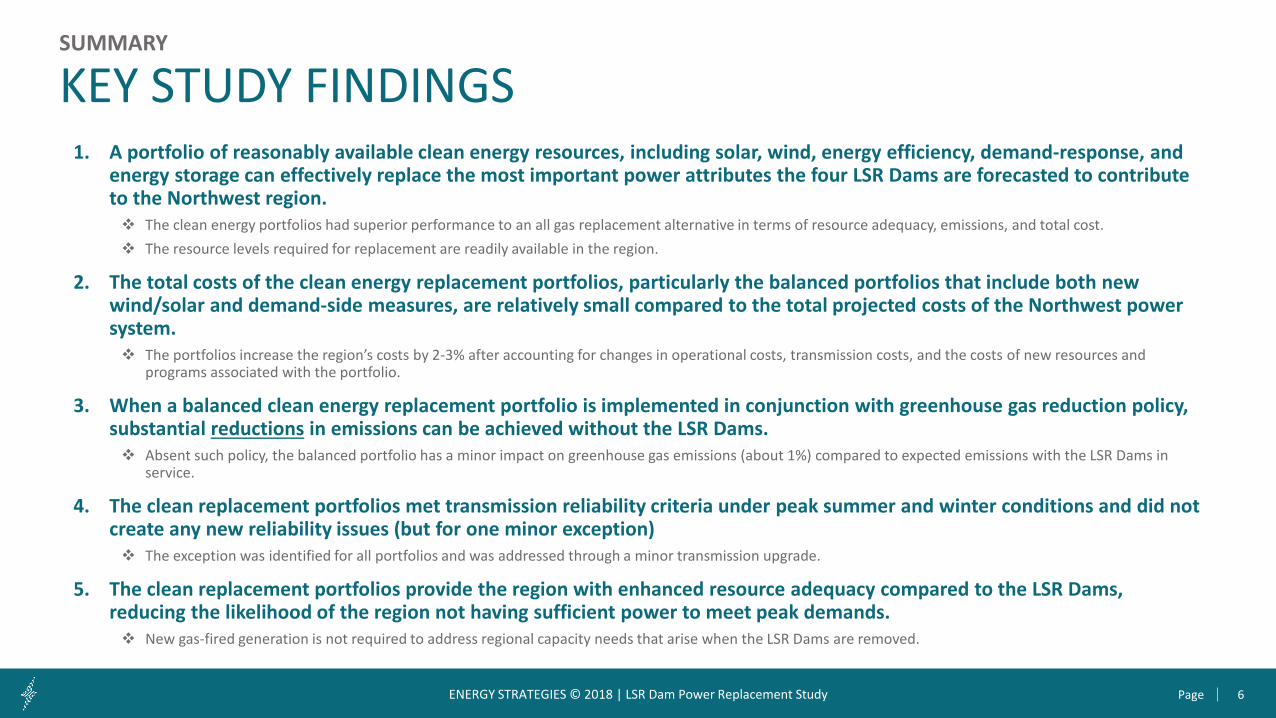
1. A portfolio of reasonably available clean energy resources, including solar, wind, energy efficiency, demand-response, and energy storage can effectively replace the most important power attributes the four LSR Dams are forecasted to contribute to the Northwest region. The clean energy portfolios had superior performance to an all gas replacement alternative in terms of resource adequacy, emissions, and total cost. The resource levels required for replacement are readily available in the region.
2. The total costs of the clean energy replacement portfolios, particularly the balanced portfolios that include both new wind/solar and demand-side measures, are relatively small compared to the total projected costs of the Northwest power system. The portfolios increase the region’s costs by 2-3% after accounting for changes in operational costs, transmission costs, and the costs of new resources and
programs associated with the portfolio.
3. When a balanced clean energy replacement portfolio is implemented in conjunction with greenhouse gas reduction policy, substantial reductions in emissions can be achieved without the LSR Dams. Absent such policy, the balanced portfolio has a minor impact on greenhouse gas emissions (about 1%) compared to expected emissions with the LSR Dams in
service.
4. The clean replacement portfolios met transmission reliability criteria under peak summer and winter conditions and did not create any new reliability issues (but for one minor exception) The exception was identified for all portfolios and was addressed through a minor transmission upgrade.
5. The clean replacement portfolios provide the region with enhanced resource adequacy compared to the LSR Dams, reducing the likelihood of the region not having sufficient power to meet peak demands. New gas-fired generation is not required to address regional capacity needs that arise when the LSR Dams are removed.
SUMMARY
KEY STUDY FINDINGS
7PageENERGY STRATEGIES © 2018 | LSR Dam Power Replacement Study
1
Reference Case and Replacement Portfolios
Analytical Approach
Portfolio Performance and Sensitivities
Value of the Lower Snake River Dams
Findings
Introduction & Background
2
3
5
6
4
OUTLINE
Technical Appendix7

8PageENERGY STRATEGIES © 2018 | LSR Dam Power Replacement Study
1. INTRODUCTION & BACKGROUND
9PageENERGY STRATEGIES © 2018 | LSR Dam Power Replacement Study
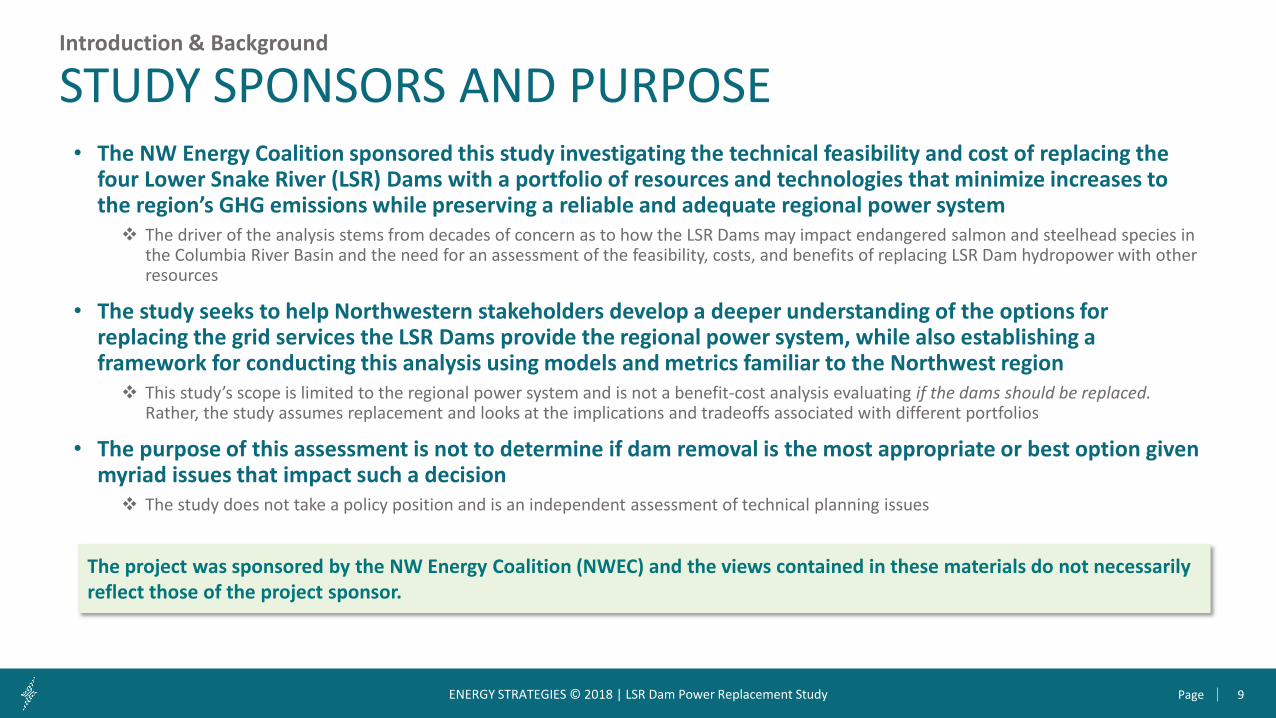
• The NW Energy Coalition sponsored this study investigating the technical feasibility and cost of replacing the four Lower Snake River (LSR) Dams with a portfolio of resources and technologies that minimize increases to the region’s GHG emissions while preserving a reliable and adequate regional power system The driver of the analysis stems from decades of concern as to how the LSR Dams may impact endangered salmon and steelhead species in
the Columbia River Basin and the need for an assessment of the feasibility, costs, and benefits of replacing LSR Dam hydropower with other resources
• The study seeks to help Northwestern stakeholders develop a deeper understanding of the options for replacing the grid services the LSR Dams provide the regional power system, while also establishing a framework for conducting this analysis using models and metrics familiar to the Northwest region This study’s scope is limited to the regional power system and is not a benefit-cost analysis evaluating if the dams should be replaced.
Rather, the study assumes replacement and looks at the implications and tradeoffs associated with different portfolios
• The purpose of this assessment is not to determine if dam removal is the most appropriate or best option given myriad issues that impact such a decision The study does not take a policy position and is an independent assessment of technical planning issues
Introduction & Background
STUDY SPONSORS AND PURPOSE
The project was sponsored by the NW Energy Coalition (NWEC) and the views contained in these materials do not necessarily reflect those of the project sponsor.
10PageENERGY STRATEGIES © 2018 | LSR Dam Power Replacement Study
What the study IS:• Limited in scope to power system analysis and
the evaluation energy-system attributes of the dams and potential replacement portfolios
• Demonstration of the planning analyses that can be undertaken to evaluate potential energy replacement portfolios
• Leverages regionally-vetted planning tools and advanced hydro modeling to accurately analyze the forward-going value of the dams
• An independent assessment focused on developing analytical frameworks and objectively evaluating the feasibility of energy replacement portfolios
• Focused on the Pacific Northwest region, representing the entire WECC when appropriate
Introduction & Background
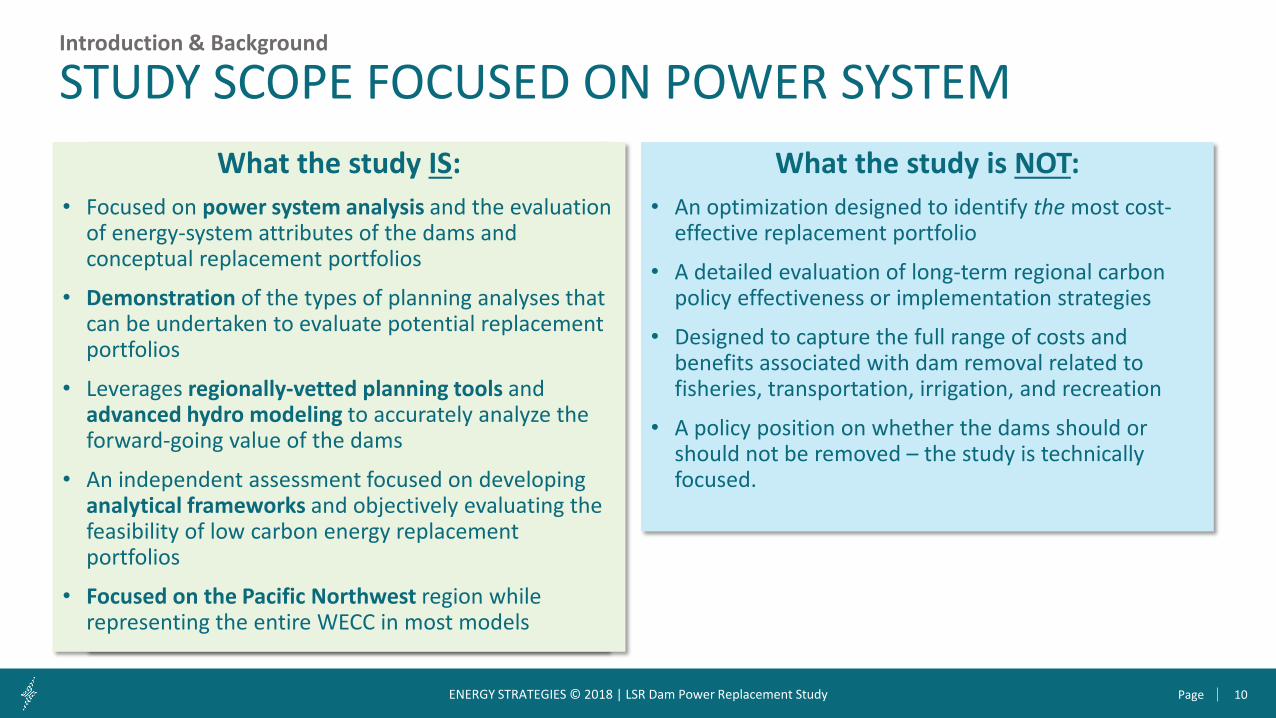
STUDY SCOPE FOCUSED ON POWER SYSTEMWhat the study IS:
• Focused on power system analysis and the evaluation of energy-system attributes of the dams and conceptual replacement portfolios
• Demonstration of the types of planning analyses that can be undertaken to evaluate potential replacement portfolios
• Leverages regionally-vetted planning tools and advanced hydro modeling to accurately analyze the forward-going value of the dams
• An independent assessment focused on developing analytical frameworks and objectively evaluating the feasibility of low carbon energy replacement portfolios
• Focused on the Pacific Northwest region while representing the entire WECC in most models
What the study is NOT:• An optimization designed to identify the most cost-
effective replacement portfolio
• A detailed evaluation of long-term regional carbon policy effectiveness or implementation strategies
• Designed to capture the full range of costs and benefits associated with dam removal related to fisheries, transportation, irrigation, and recreation
• A policy position on whether the dams should or should not be removed – the study is technically focused.
11PageENERGY STRATEGIES © 2018 | LSR Dam Power Replacement Study
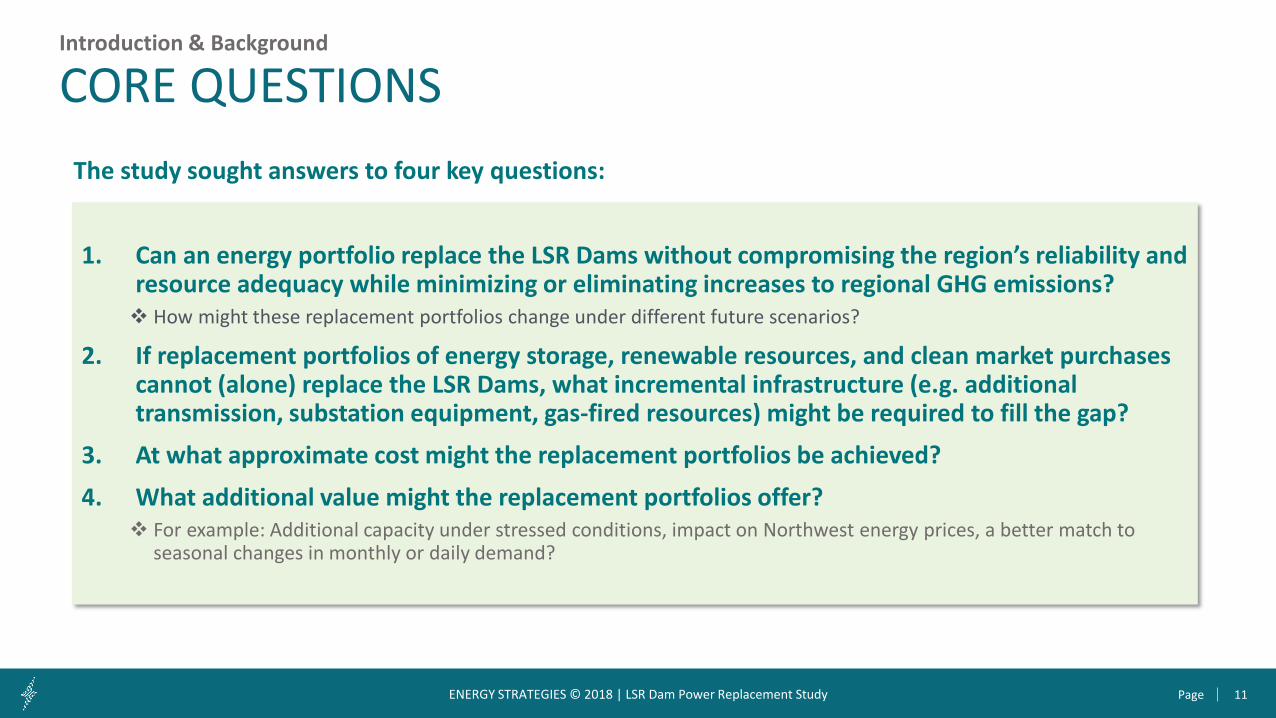
1. Can an energy portfolio replace the LSR Dams without compromising the region’s reliability and resource adequacy while minimizing or eliminating increases to regional GHG emissions? How might these replacement portfolios change under different future scenarios?
2. If replacement portfolios of energy storage, renewable resources, and clean market purchases cannot (alone) replace the LSR Dams, what incremental infrastructure (e.g. additional transmission, substation equipment, gas-fired resources) might be required to fill the gap?
3. At what approximate cost might the replacement portfolios be achieved?
4. What additional value might the replacement portfolios offer? For example: Additional capacity under stressed conditions, impact on Northwest energy prices, a better match to
seasonal changes in monthly or daily demand?
Introduction & Background
CORE QUESTIONSThe study sought answers to four key questions:

12PageENERGY STRATEGIES © 2018 | LSR Dam Power Replacement Study
• Rely on existing authoritative data sources, models, and planning metrics Leverage standard, fully vetted models and metrics familiar to stakeholders in the Northwest and used by regional and
utility planners Capture unique characteristics of NW hydro system in ways with which the region is familiar
• Do not seek to fully optimize the replacement portfolios for economic or environmental efficiency. Conduct analyses iteratively, allowing for linkages and feedback between study types when developing the replacement
portfolios
• Focus the geographical scope on the Northwest power system footprint• Create common databases and assumptions across study phases and modeling platforms
For example, major announced coal retirements in region are to be reflected in reliability, adequacy, and operational assessments
Introduction & Background
STUDY PRINCIPLES

13PageENERGY STRATEGIES © 2018 | LSR Dam Power Replacement Study
Introduction & Background
PLANNING IN THE NORTHWEST
Organization
Role/responsibility
Federal power marketing administration transmitting power from federal hydro
resources, including the four Lower Snake River dams
Conducts reliability, economic, and public policy regional transmission planning under
FERC Order 1000 for utility members, including BPA
Creates regional conservation, power plan, and fish/wildlife program every 5-years as required under the Northwest Power Act. Plan guides BPA’s resource decision and
allows explicit state input.
Relevance to study footprint and scope
Analysis captures generation assets and transmission in BPA’s control area
Analysis captures generation and transmission for utilities that are members of
ColumbiaGridStudy scope based on NWPCC footprint
Planning analyses relevant to this study
10-year Transmission PlanBPA White Book 2017 System Assessment 7th Power Plan
Power Supply Adequacy Assessment
Data/models used in this study
Data captured through input to WECC, ColumbiaGrid, and NWPCC
2026 Heavy Summer Case2026-27 Heavy Summer Case GENESYS
• The Northwest power system is analyzed and planned by several entities that, in addition to decades of experience, each have a unique scope, charter, and perspective.
• Investor-owned utilities and municipalities/co-ops also conduct planning for generation and transmission
14PageENERGY STRATEGIES © 2018 | LSR Dam Power Replacement Study
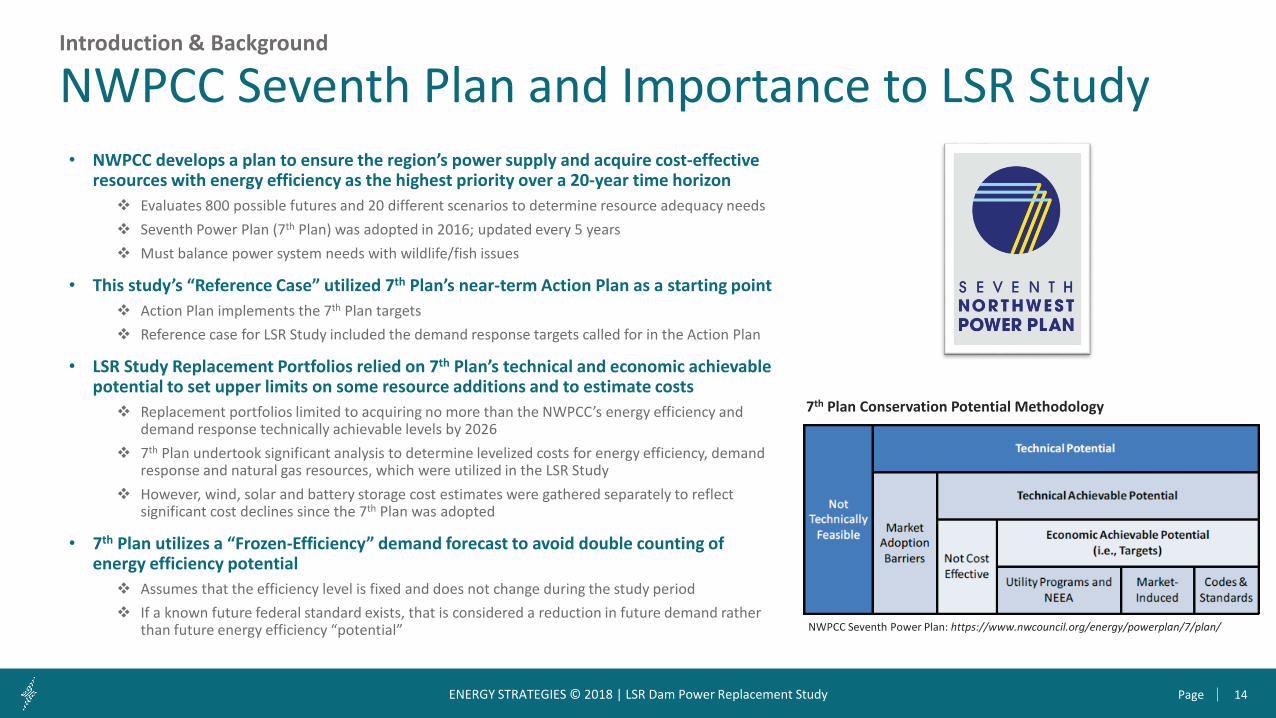
• NWPCC develops a plan to ensure the region’s power supply and acquire cost-effective resources with energy efficiency as the highest priority over a 20-year time horizon Evaluates 800 possible futures and 20 different scenarios to determine resource adequacy needs Seventh Power Plan (7th Plan) was adopted in 2016; updated every 5 years Must balance power system needs with wildlife/fish issues
• This study’s “Reference Case” utilized 7th Plan’s near-term Action Plan as a starting point Action Plan implements the 7th Plan targets Reference case for LSR Study included the demand response targets called for in the Action Plan
• LSR Study Replacement Portfolios relied on 7th Plan’s technical and economic achievable potential to set upper limits on some resource additions and to estimate costs Replacement portfolios limited to acquiring no more than the NWPCC’s energy efficiency and
demand response technically achievable levels by 2026 7th Plan undertook significant analysis to determine levelized costs for energy efficiency, demand
response and natural gas resources, which were utilized in the LSR Study However, wind, solar and battery storage cost estimates were gathered separately to reflect
significant cost declines since the 7th Plan was adopted
• 7th Plan utilizes a “Frozen-Efficiency” demand forecast to avoid double counting of energy efficiency potential Assumes that the efficiency level is fixed and does not change during the study period If a known future federal standard exists, that is considered a reduction in future demand rather
than future energy efficiency “potential”
Introduction & Background
NWPCC Seventh Plan and Importance to LSR Study
NWPCC Seventh Power Plan: https://www.nwcouncil.org/energy/powerplan/7/plan/
7th Plan Conservation Potential Methodology
15PageENERGY STRATEGIES © 2018 | LSR Dam Power Replacement Study
• Assessment leverages established regional planning criteria and targets as the basis to evaluate the technical feasibility of replacement portfolios
• Resource adequacy criteria: Northwest Power and Conservation Council (NWPCC) adopted a resource adequacy standard in 2011 to assess the adequacy of the Northwest’s power supply Loss-of-load probability (LOLP) that is less than 5% for five years into the future NWPCC is currently considering other alternatives, so we have broadened the metric for this analysis
• Reliability criteria: NERC Transmission Planning (TPL) Standards are the guiding criteria, along with applicable WECC guidelines ColumbiaGrid, BPA, and all transmission operators, use these standards when conducting their respective assessments
• System Costs and emissions: Costs and emissions are not a “hard constraint”, although we seek to evaluate how the portfolios can minimize impact to these two criteria while adhering to the criteria above Considers regional-level cost impacts using system annual revenue requirement All new costs are incremental to the NWPCC 7th Power Plan levels Mirrors residential rate-analysis conducted by the NWPCC in its 7th Plan Does not seek to evaluate impacts of any specific carbon reduction policy, such as those being considered by Oregon and Washington,
although it does broadly consider how assigning a proxy cost to carbon emission could change the emission and cost effects of the replacement portfolios
Introduction & Background
PLANNING CRITERIA
16PageENERGY STRATEGIES © 2018 | LSR Dam Power Replacement Study
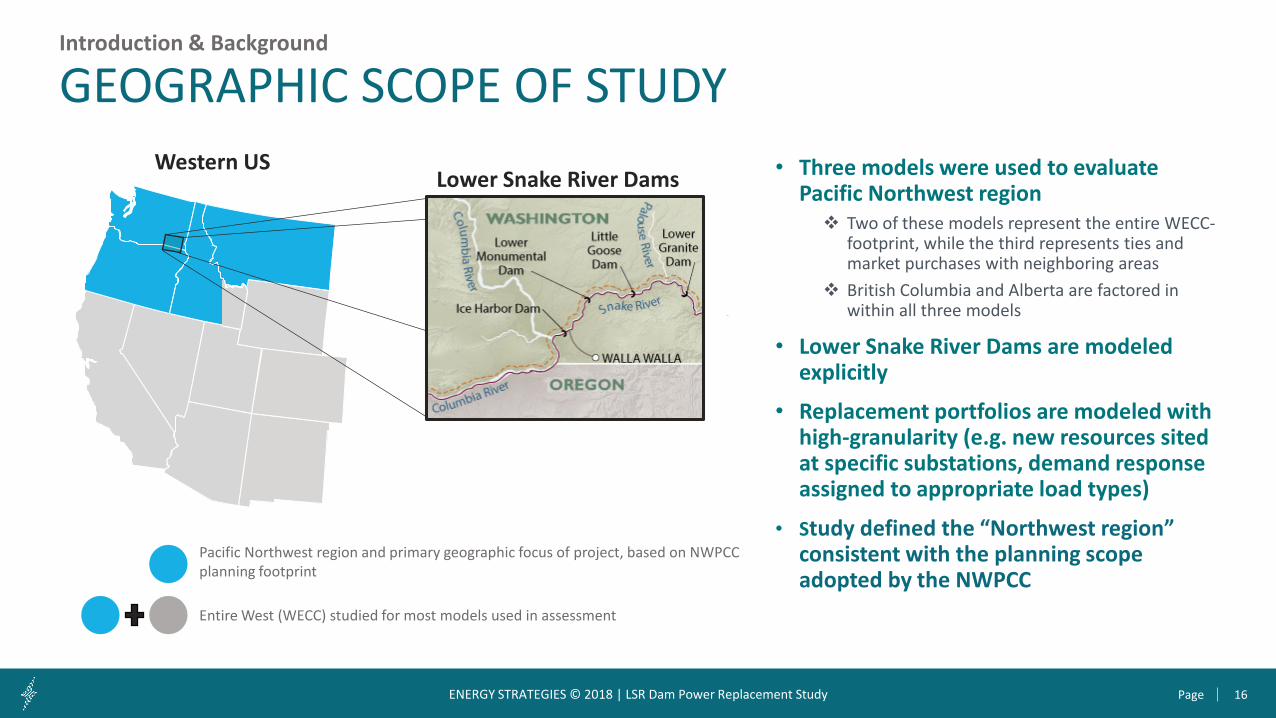
• Three models were used to evaluate Pacific Northwest region Two of these models represent the entire WECC-
footprint, while the third represents ties and market purchases with neighboring areas
British Columbia and Alberta are factored in within all three models
• Lower Snake River Dams are modeled explicitly
• Replacement portfolios are modeled with high-granularity (e.g. new resources sited at specific substations, demand response assigned to appropriate load types)
• Study defined the “Northwest region” consistent with the planning scope adopted by the NWPCC
Introduction & Background
GEOGRAPHIC SCOPE OF STUDY
Lower Snake River Dams
Pacific Northwest region and primary geographic focus of project, based on NWPCC planning footprint
Entire West (WECC) studied for most models used in assessment
Western US

17PageENERGY STRATEGIES © 2018 | LSR Dam Power Replacement Study
2. ANALYTICAL APPROACH
18PageENERGY STRATEGIES © 2018 | LSR Dam Power Replacement Study
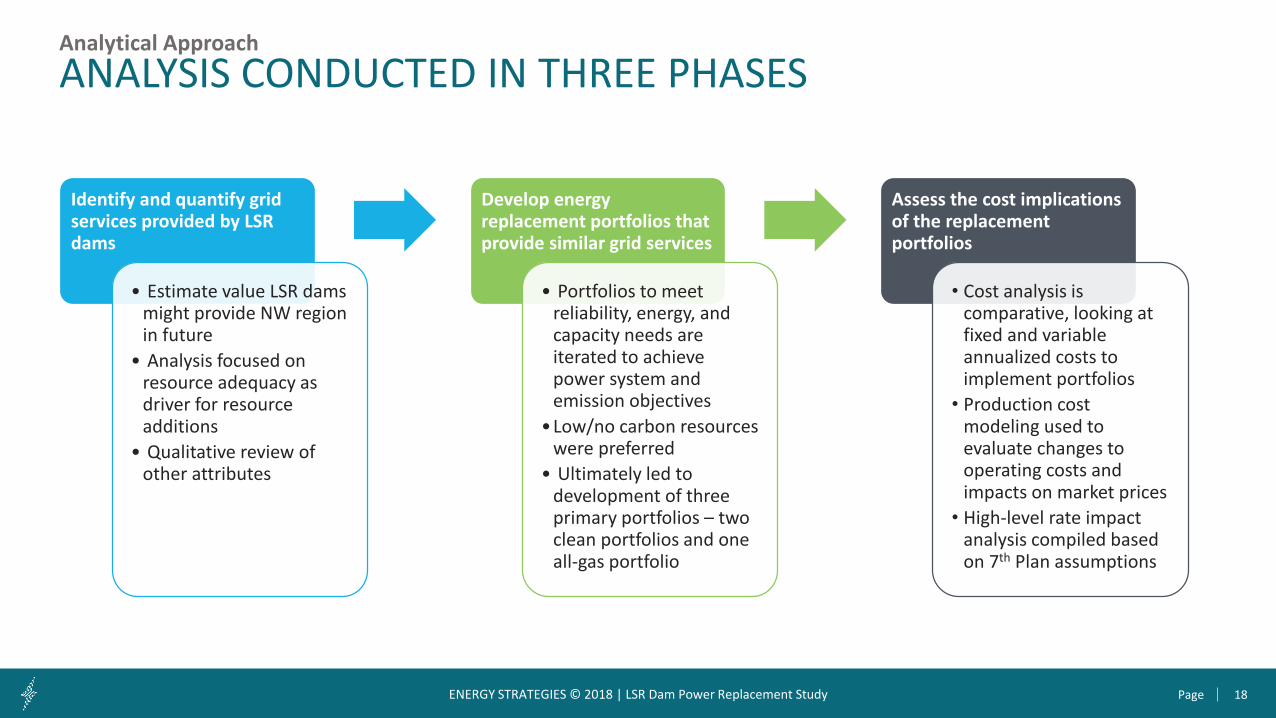
Analytical ApproachANALYSIS CONDUCTED IN THREE PHASES
Identify and quantify grid services provided by LSR dams
• Estimate value LSR dams might provide NW region in future
• Analysis focused on resource adequacy as driver for resource additions
• Qualitative review of other attributes
Develop energy replacement portfolios that provide similar grid services
• Portfolios to meet reliability, energy, and capacity needs are iterated to achieve power system and emission objectives
•Low/no carbon resources were preferred
• Ultimately led to development of three primary portfolios – two clean portfolios and one all-gas portfolio
Assess the cost implications of the replacement portfolios
• Cost analysis is comparative, looking at fixed and variable annualized costs to implement portfolios
• Production cost modeling used to evaluate changes to operating costs and impacts on market prices
• High-level rate impact analysis compiled based on 7th Plan assumptions
19PageENERGY STRATEGIES © 2018 | LSR Dam Power Replacement Study
Analytical Approach
MODELING FRAMEWORK
Regional Resource Adequacy Analysis
(GENESYS model)
Evaluate System Reliability
(ColumbiaGrid Summer & Winter powerflow in PowerWorld™)
Production Cost Model Simulation
(WECC 2026 Common Case in ABB GridView™)
Key Study Metrics
Loss of Load Probability (LOLP)
Expected Unserved Energy (EUE)
Steady-state reliability (overloads, voltage, reactive power)
Transient stability (frequency response, system stability)
Operating costs ($)
Regional GHG emissions (tons)
Annual revenue requirement ($/yr)
Estimate Costs and Rate Impacts (annualized cost of portfolio)
Typical residential bill ($/month)
Develop and Iterate Replacement Portfolios
Port
folio
Dat
a
Common Modeling Platform
20PageENERGY STRATEGIES © 2018 | LSR Dam Power Replacement Study
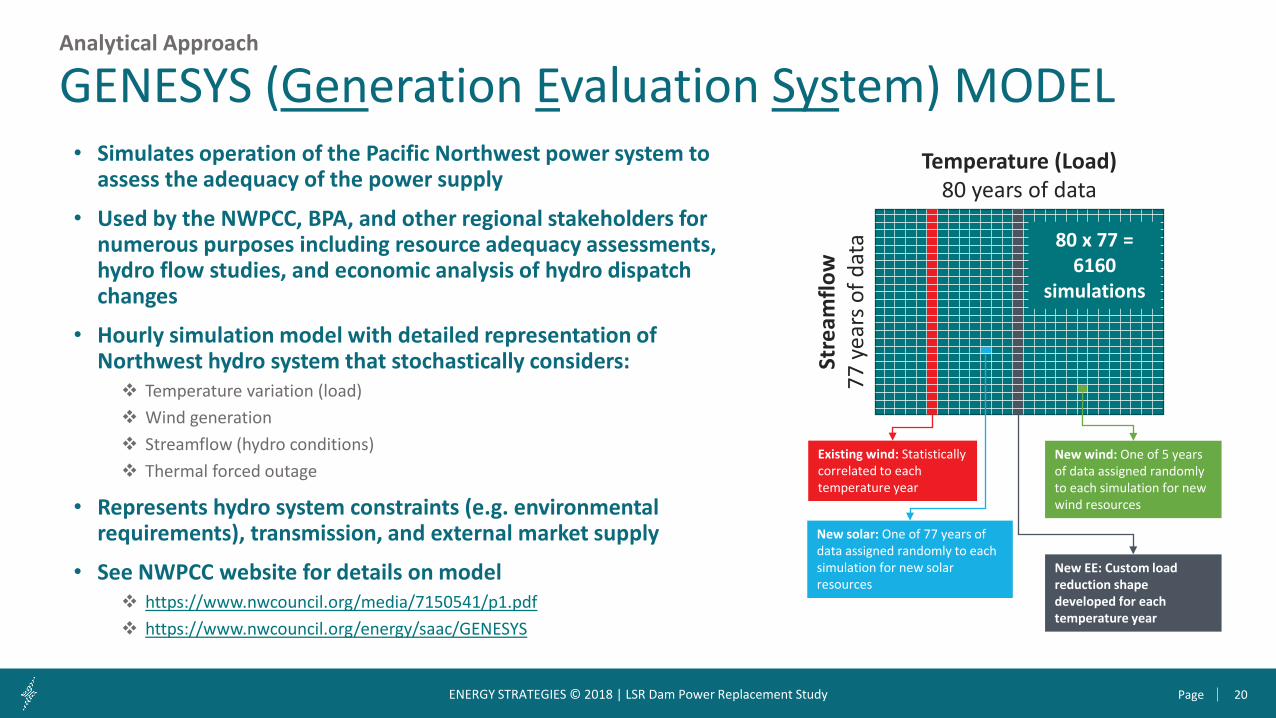
• Simulates operation of the Pacific Northwest power system to assess the adequacy of the power supply
• Used by the NWPCC, BPA, and other regional stakeholders for numerous purposes including resource adequacy assessments, hydro flow studies, and economic analysis of hydro dispatch changes
• Hourly simulation model with detailed representation of Northwest hydro system that stochastically considers: Temperature variation (load) Wind generation Streamflow (hydro conditions) Thermal forced outage
• Represents hydro system constraints (e.g. environmental requirements), transmission, and external market supply
• See NWPCC website for details on model https://www.nwcouncil.org/media/7150541/p1.pdf https://www.nwcouncil.org/energy/saac/GENESYS
GENESYS (Generation Evaluation System) MODELTemperature (Load)
80 years of data
Stre
amflo
w77
yea
rs o
f dat
a 80 x 77 = 6160
simulations
Existing wind: Statistically correlated to each temperature year
New wind: One of 5 years of data assigned randomly to each simulation for new wind resources
New EE: Custom load reduction shape developed for each temperature year
New solar: One of 77 years of data assigned randomly to each simulation for new solar resources
Analytical Approach
21PageENERGY STRATEGIES © 2018 | LSR Dam Power Replacement Study
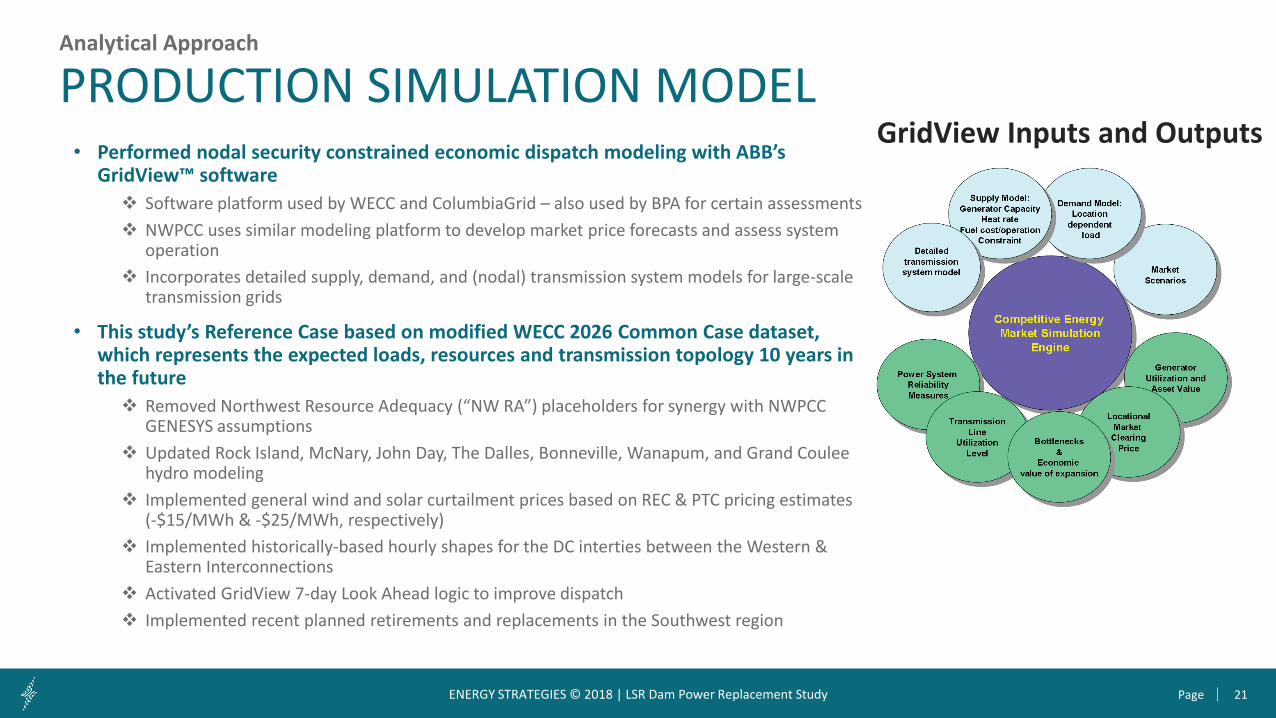
• Performed nodal security constrained economic dispatch modeling with ABB’s GridView™ software Software platform used by WECC and ColumbiaGrid – also used by BPA for certain assessments NWPCC uses similar modeling platform to develop market price forecasts and assess system
operation Incorporates detailed supply, demand, and (nodal) transmission system models for large-scale
transmission grids
• This study’s Reference Case based on modified WECC 2026 Common Case dataset, which represents the expected loads, resources and transmission topology 10 years in the future Removed Northwest Resource Adequacy (“NW RA”) placeholders for synergy with NWPCC
GENESYS assumptions Updated Rock Island, McNary, John Day, The Dalles, Bonneville, Wanapum, and Grand Coulee
hydro modeling Implemented general wind and solar curtailment prices based on REC & PTC pricing estimates
(-$15/MWh & -$25/MWh, respectively) Implemented historically-based hourly shapes for the DC interties between the Western &
Eastern Interconnections Activated GridView 7-day Look Ahead logic to improve dispatch Implemented recent planned retirements and replacements in the Southwest region
Analytical Approach
PRODUCTION SIMULATION MODELGridView Inputs and Outputs
22PageENERGY STRATEGIES © 2018 | LSR Dam Power Replacement Study
• PowerWorld: Used by power system engineers to simulate single snap-shot condition of grid, evaluating ability of system to remain within reliable operating limits before and after contingencies Model commonly used by transmission planners in the Northwest
• The best available data source for this study is ColumbiaGrid’s most recent System Assessment (3/21/2017) Studied two stressed system conditions in 2027 timeframe: 2027 Heavy Summer and 2027-28 Heavy Winter (3/21/2017 Posting) Included power flow contingency definitions Dynamics data included, but no switching data to perform simulations
• Energy Strategies made modifications to Base Cases in order to create a more reasonable starting point for the assessment Reference Case includes the Lower Snake River Dams, but the output of the dams was adjusted based on historical operation during system
peak to provide a more realistic perspective of what is needed, from a reliability standpoint, to replace the Lower Snake River Dams Case was also updated to align assumptions between other 10-year models (production cost model and GENESYS) – redispatch across the
system was minimized whenever possible to maintain alignment with the Base Cases
• Replacement portfolio cases were built from the Reference Case and include removal of the Lower Snake River Dams and the addition of resources or demand-side measures detailed in the Replacement Portfolios New demand response and energy efficiency resulted in load adjustments based on specific load types New resources added and dispatched to reasonable levels
POWER FLOW MODELAnalytical Approach
23PageENERGY STRATEGIES © 2018 | LSR Dam Power Replacement Study
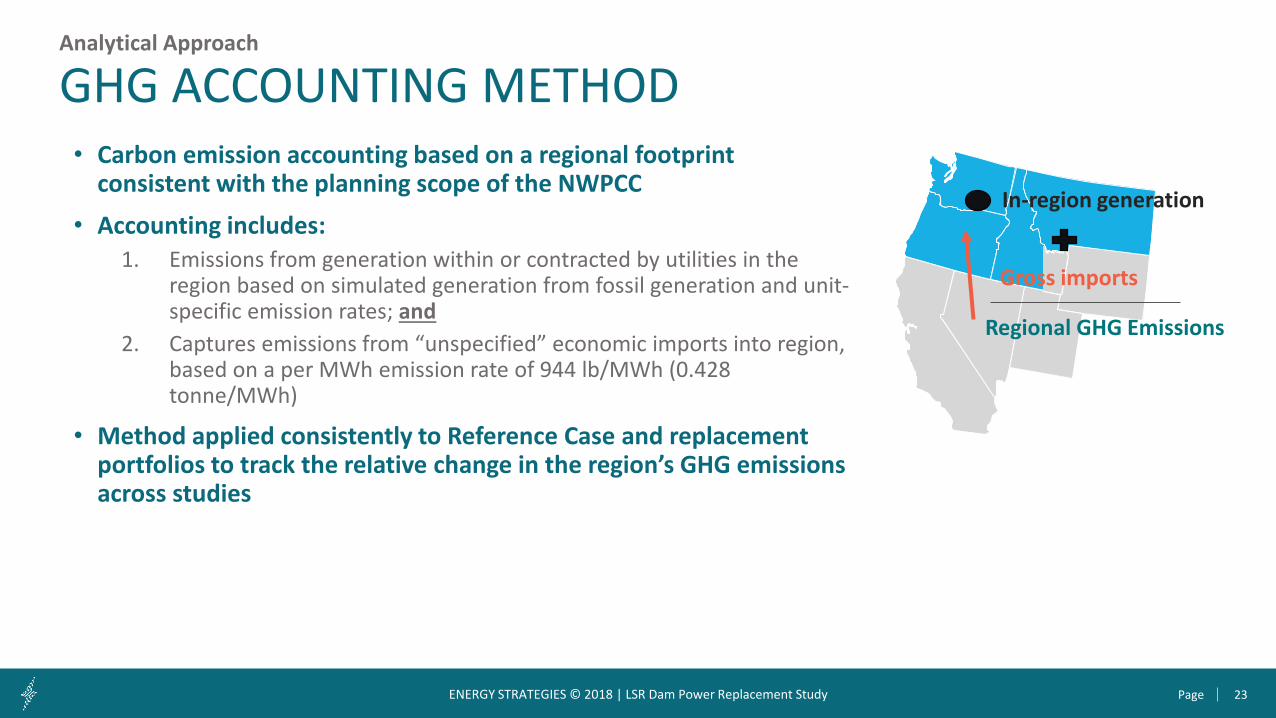
• Carbon emission accounting based on a regional footprint consistent with the planning scope of the NWPCC
• Accounting includes:1. Emissions from generation within or contracted by utilities in the
region based on simulated generation from fossil generation and unit-specific emission rates; and
2. Captures emissions from “unspecified” economic imports into region, based on a per MWh emission rate of 944 lb/MWh (0.428 tonne/MWh)
• Method applied consistently to Reference Case and replacement portfolios to track the relative change in the region’s GHG emissions across studies
Analytical Approach
GHG ACCOUNTING METHOD
Gross imports
In-region generation
Regional GHG Emissions

24PageENERGY STRATEGIES © 2018 | LSR Dam Power Replacement Study
3. REFERENCE CASE AND REPLACEMENT PORTFOLIOS
25PageENERGY STRATEGIES © 2018 | LSR Dam Power Replacement Study
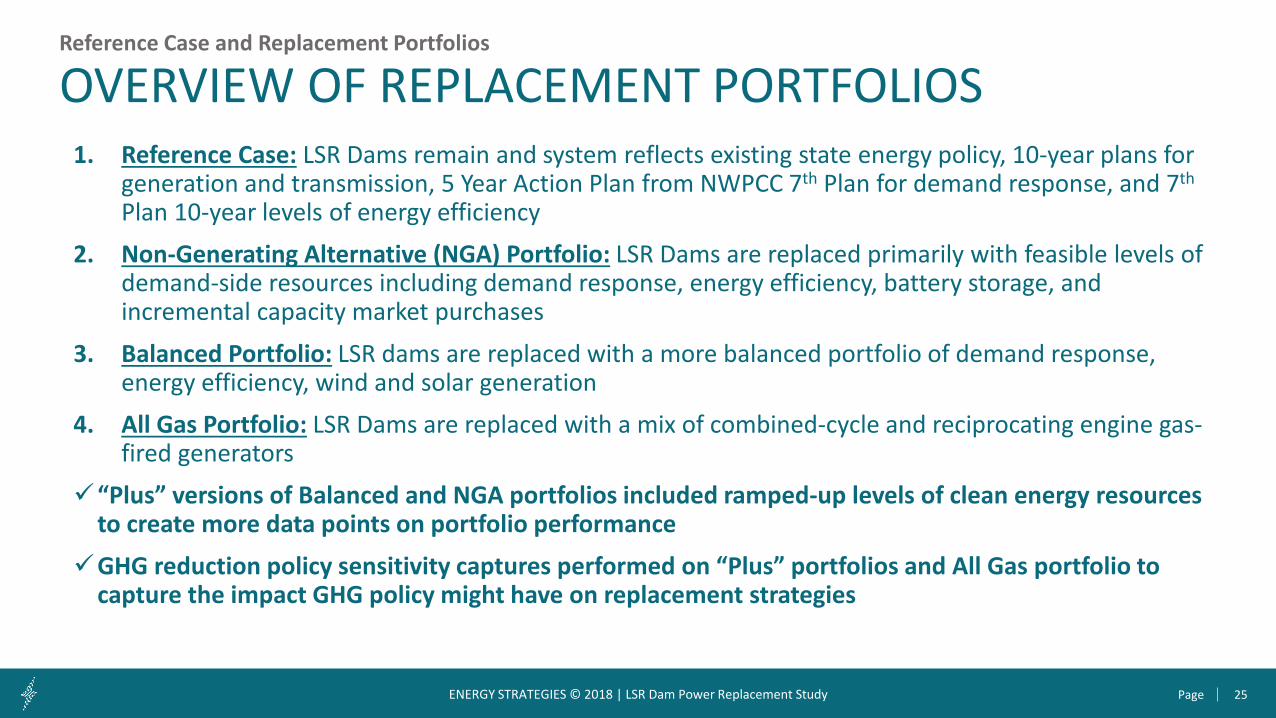
1. Reference Case: LSR Dams remain and system reflects existing state energy policy, 10-year plans for generation and transmission, 5 Year Action Plan from NWPCC 7th Plan for demand response, and 7th
Plan 10-year levels of energy efficiency 2. Non-Generating Alternative (NGA) Portfolio: LSR Dams are replaced primarily with feasible levels of
demand-side resources including demand response, energy efficiency, battery storage, and incremental capacity market purchases
3. Balanced Portfolio: LSR dams are replaced with a more balanced portfolio of demand response, energy efficiency, wind and solar generation
4. All Gas Portfolio: LSR Dams are replaced with a mix of combined-cycle and reciprocating engine gas-fired generators
“Plus” versions of Balanced and NGA portfolios included ramped-up levels of clean energy resources to create more data points on portfolio performance
GHG reduction policy sensitivity captures performed on “Plus” portfolios and All Gas portfolio to capture the impact GHG policy might have on replacement strategies
Reference Case and Replacement Portfolios
OVERVIEW OF REPLACEMENT PORTFOLIOS
26PageENERGY STRATEGIES © 2018 | LSR Dam Power Replacement Study
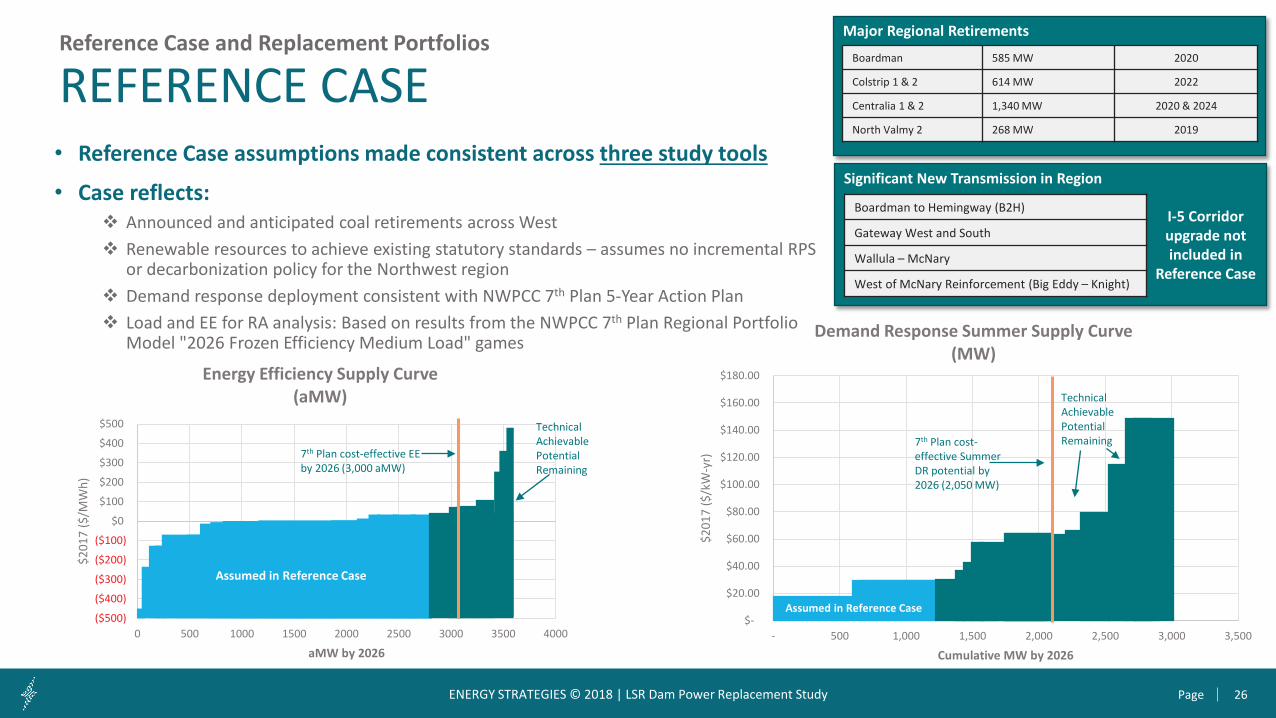
• Reference Case assumptions made consistent across three study tools
• Case reflects: Announced and anticipated coal retirements across West Renewable resources to achieve existing statutory standards – assumes no incremental RPS
or decarbonization policy for the Northwest region Demand response deployment consistent with NWPCC 7th Plan 5-Year Action Plan Load and EE for RA analysis: Based on results from the NWPCC 7th Plan Regional Portfolio
Model "2026 Frozen Efficiency Medium Load" games
REFERENCE CASEMajor Regional Retirements
Significant New Transmission in Region
Boardman 585 MW 2020
Colstrip 1 & 2 614 MW 2022
Centralia 1 & 2 1,340 MW 2020 & 2024
North Valmy 2 268 MW 2019
Boardman to Hemingway (B2H)
Gateway West and South
Wallula – McNary
West of McNary Reinforcement (Big Eddy – Knight)
I-5 Corridor upgrade not included in
Reference Case
Reference Case and Replacement Portfolios
($500)
($400)
($300)
($200)
($100)
$0
$100
$200
$300
$400
$500
0 500 1000 1500 2000 2500 3000 3500 4000
$201
7 ($
/MW
h)
aMW by 2026
Energy Efficiency Supply Curve(aMW)
7th Plan cost-effective EE by 2026 (3,000 aMW)
Technical Achievable Potential Remaining
Assumed in Reference Case
$-
$20.00
$40.00
$60.00
$80.00
$100.00
$120.00
$140.00
$160.00
$180.00
- 500 1,000 1,500 2,000 2,500 3,000 3,500
$201
7 ($
/kW
-yr)
Cumulative MW by 2026
Demand Response Summer Supply Curve(MW)
7th Plan cost-effective Summer DR potential by 2026 (2,050 MW)
Technical Achievable Potential Remaining
Assumed in Reference Case
27PageENERGY STRATEGIES © 2018 | LSR Dam Power Replacement Study
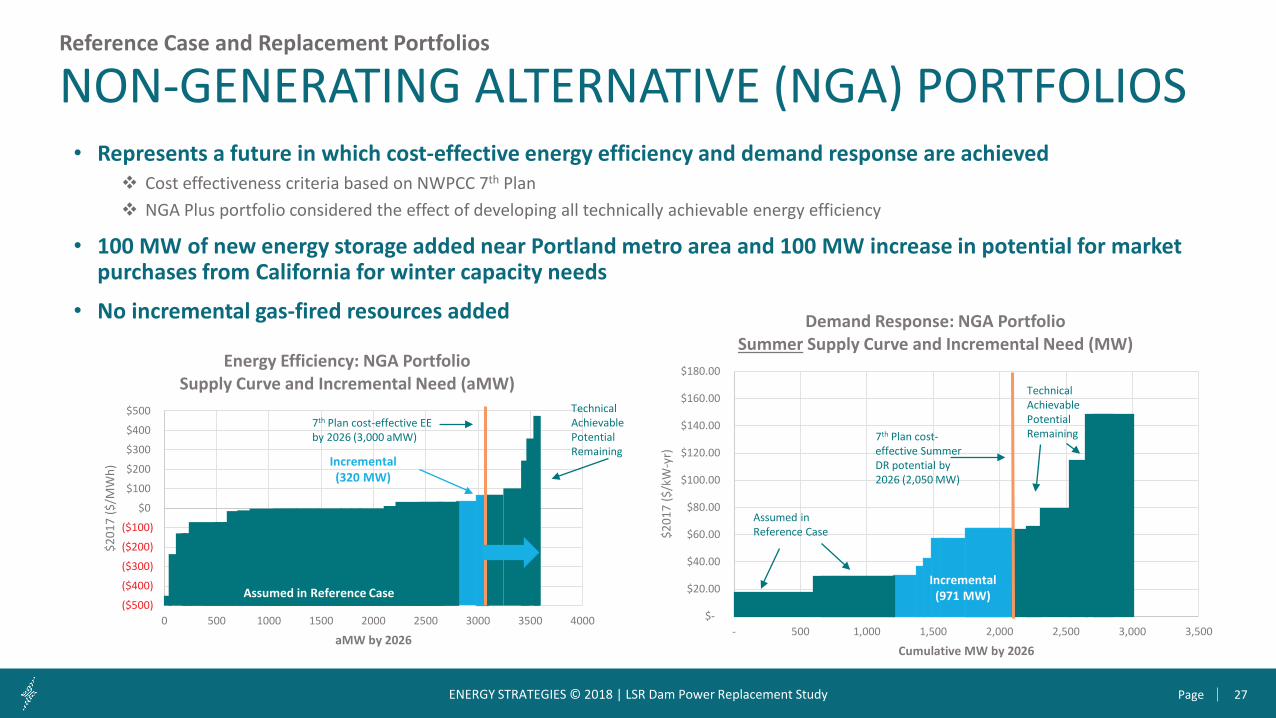
• Represents a future in which cost-effective energy efficiency and demand response are achieved Cost effectiveness criteria based on NWPCC 7th Plan NGA Plus portfolio considered the effect of developing all technically achievable energy efficiency
• 100 MW of new energy storage added near Portland metro area and 100 MW increase in potential for market purchases from California for winter capacity needs
• No incremental gas-fired resources added
NON-GENERATING ALTERNATIVE (NGA) PORTFOLIOS Reference Case and Replacement Portfolios
($500)
($400)
($300)
($200)
($100)
$0
$100
$200
$300
$400
$500
0 500 1000 1500 2000 2500 3000 3500 4000
$201
7 ($
/MW
h)
aMW by 2026
Energy Efficiency: NGA PortfolioSupply Curve and Incremental Need (aMW)
7th Plan cost-effective EE by 2026 (3,000 aMW)
Technical Achievable Potential Remaining
Incremental (320 MW)
Assumed in Reference Case
$-
$20.00
$40.00
$60.00
$80.00
$100.00
$120.00
$140.00
$160.00
$180.00
- 500 1,000 1,500 2,000 2,500 3,000 3,500
$201
7 ($
/kW
-yr)
Cumulative MW by 2026
Demand Response: NGA Portfolio Summer Supply Curve and Incremental Need (MW)
Incremental(971 MW)
7th Plan cost-effective Summer DR potential by 2026 (2,050 MW)
Assumed in Reference Case
Technical Achievable Potential Remaining

28PageENERGY STRATEGIES © 2018 | LSR Dam Power Replacement Study
• Represents a future in which half of cost-effective energy efficiency and demand response are achieved
• Portfolios featured a range of additional renewable resources Balanced portfolio included 500 MW of Montana wind and 250 MW of Idaho solar “Plus” portfolio increased these levels of renewables by 750 MW and 500 MW, respectively
• No incremental energy storage and no incremental market purchases for capacity and incremental gas-fired resources
BALANCED PORTFOLIOSReference Case and Replacement Portfolios
$-
$20.00
$40.00
$60.00
$80.00
$100.00
$120.00
$140.00
$160.00
$180.00
- 500 1,000 1,500 2,000 2,500 3,000 3,500$2
017
($/k
W-y
r)Cumulative MW by 2026
Demand Response: Balanced Portfolio Summer Supply Curve and Incremental Need (MW)
7th Plan cost-effective Summer DR potential by 2026 (2,050 MW)
Technical Achievable Potential Remaining
Incremental (486 MW)
Assumed in Reference Case
($500)
($400)
($300)
($200)
($100)
$0
$100
$200
$300
$400
$500
0 500 1000 1500 2000 2500 3000 3500 4000
$201
7 ($
/MW
h)
aMW by 2026
Energy Efficiency: Balanced Portfolio Supply Curve and Incremental Need (aMW)
7th Plan cost-effective EE by 2026 (3,000 aMW)
Technical Achievable Potential RemainingIncremental
(160 MW)
Assumed in Reference Case
29PageENERGY STRATEGIES © 2018 | LSR Dam Power Replacement Study
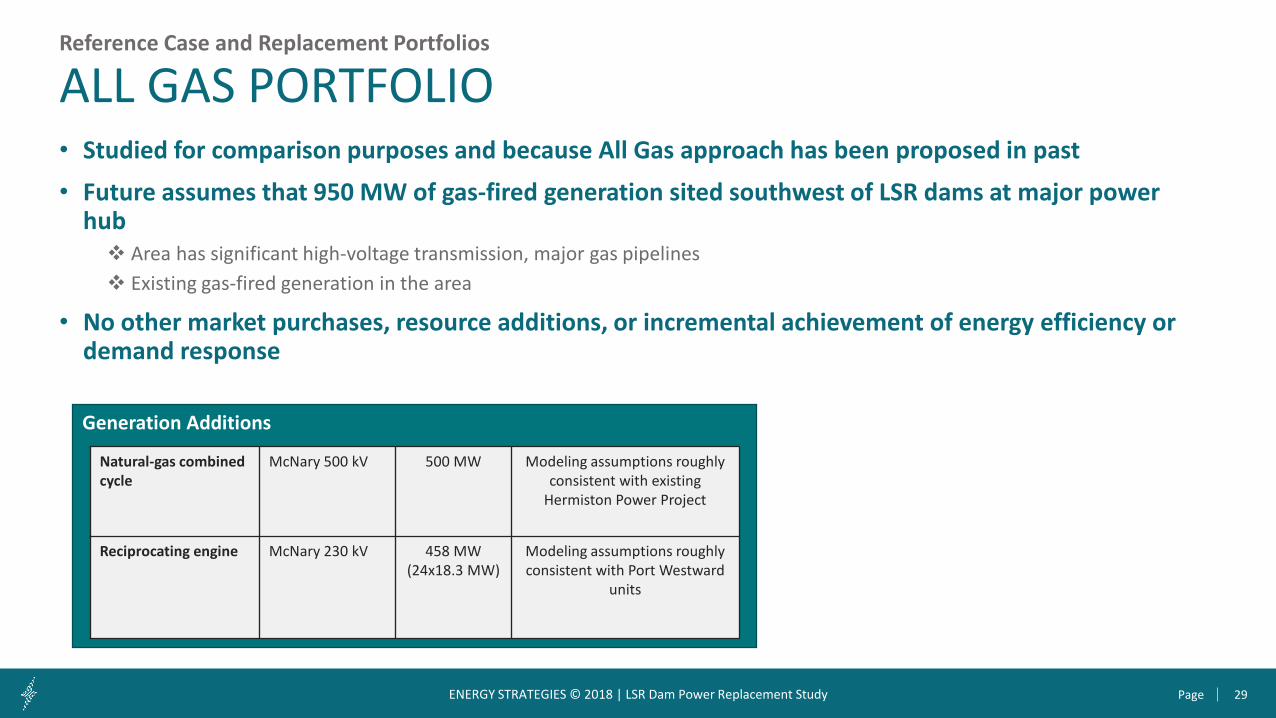
• Studied for comparison purposes and because All Gas approach has been proposed in past• Future assumes that 950 MW of gas-fired generation sited southwest of LSR dams at major power
hub Area has significant high-voltage transmission, major gas pipelines Existing gas-fired generation in the area
• No other market purchases, resource additions, or incremental achievement of energy efficiency or demand response
ALL GAS PORTFOLIOReference Case and Replacement Portfolios
Generation Additions
Natural-gas combined cycle
McNary 500 kV 500 MW Modeling assumptions roughly consistent with existing
Hermiston Power Project
Reciprocating engine McNary 230 kV 458 MW(24x18.3 MW)
Modeling assumptions roughly consistent with Port Westward
units
30PageENERGY STRATEGIES © 2018 | LSR Dam Power Replacement Study
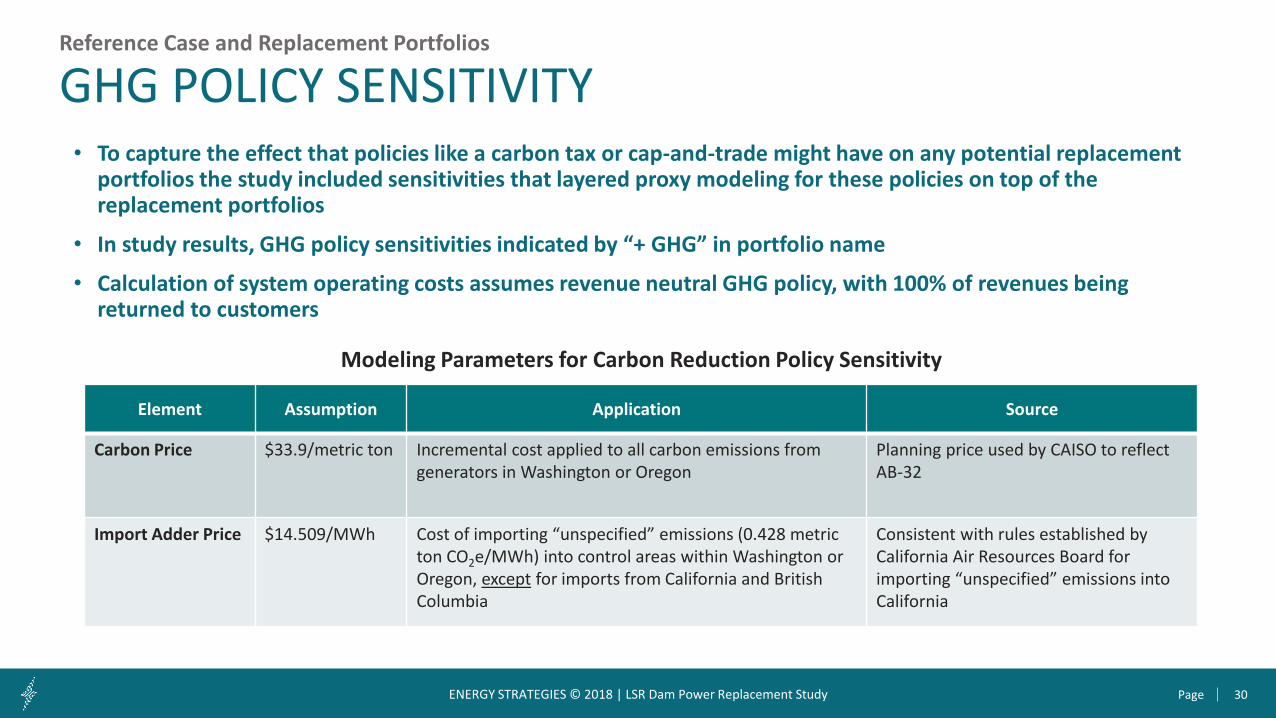
• To capture the effect that policies like a carbon tax or cap-and-trade might have on any potential replacement portfolios the study included sensitivities that layered proxy modeling for these policies on top of the replacement portfolios
• In study results, GHG policy sensitivities indicated by “+ GHG” in portfolio name
• Calculation of system operating costs assumes revenue neutral GHG policy, with 100% of revenues being returned to customers
Reference Case and Replacement Portfolios
GHG POLICY SENSITIVITY
Element Assumption Application Source
Carbon Price $33.9/metric ton Incremental cost applied to all carbon emissions from generators in Washington or Oregon
Planning price used by CAISO to reflect AB-32
Import Adder Price $14.509/MWh Cost of importing “unspecified” emissions (0.428 metric ton CO2e/MWh) into control areas within Washington or Oregon, except for imports from California and British Columbia
Consistent with rules established by California Air Resources Board for importing “unspecified” emissions into California
Modeling Parameters for Carbon Reduction Policy Sensitivity
31PageENERGY STRATEGIES © 2018 | LSR Dam Power Replacement Study
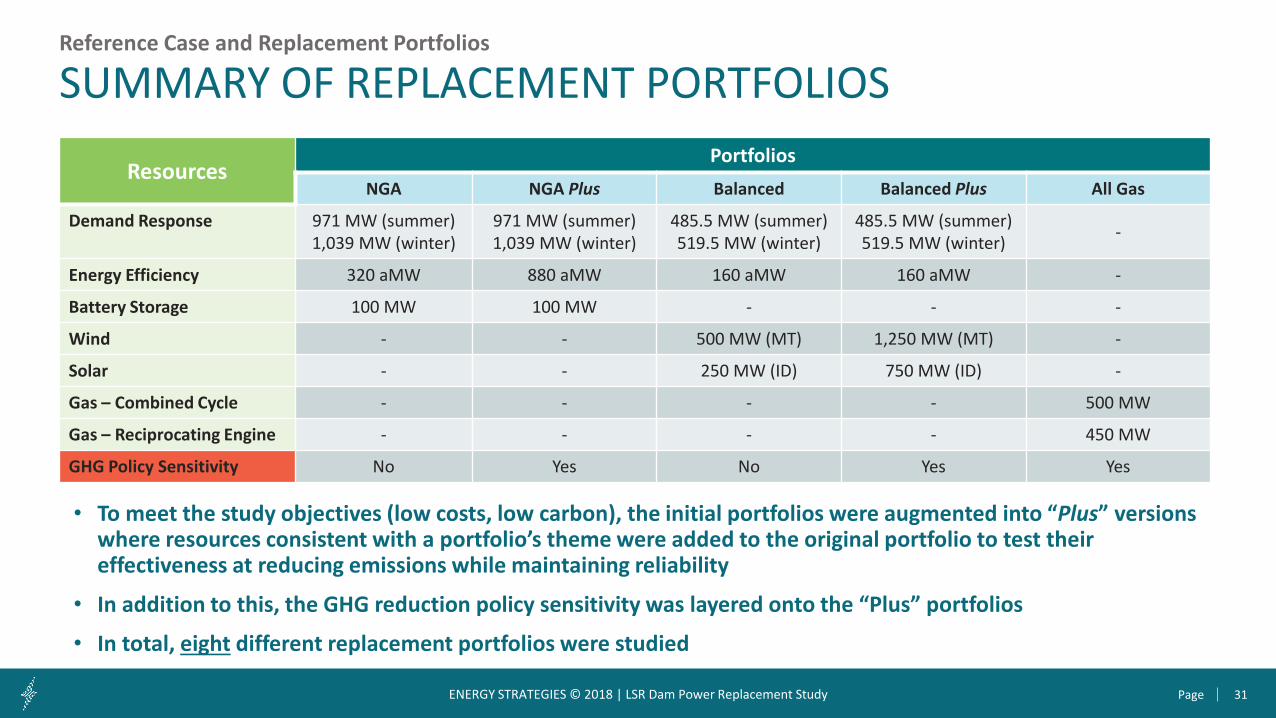
SUMMARY OF REPLACEMENT PORTFOLIOSReference Case and Replacement Portfolios
ResourcesPortfolios
NGA NGA Plus Balanced Balanced Plus All Gas
Demand Response 971 MW (summer)1,039 MW (winter)
971 MW (summer)1,039 MW (winter)
485.5 MW (summer)519.5 MW (winter)
485.5 MW (summer)519.5 MW (winter) -
Energy Efficiency 320 aMW 880 aMW 160 aMW 160 aMW -
Battery Storage 100 MW 100 MW - - -
Wind - - 500 MW (MT) 1,250 MW (MT) -
Solar - - 250 MW (ID) 750 MW (ID) -
Gas – Combined Cycle - - - - 500 MW
Gas – Reciprocating Engine - - - - 450 MW
GHG Policy Sensitivity No Yes No Yes Yes
• To meet the study objectives (low costs, low carbon), the initial portfolios were augmented into “Plus” versions where resources consistent with a portfolio’s theme were added to the original portfolio to test their effectiveness at reducing emissions while maintaining reliability
• In addition to this, the GHG reduction policy sensitivity was layered onto the “Plus” portfolios
• In total, eight different replacement portfolios were studied

32PageENERGY STRATEGIES © 2018 | LSR Dam Power Replacement Study
4. VALUE OF THE LOWER SNAKE RIVER DAMS

33PageENERGY STRATEGIES © 2018 | LSR Dam Power Replacement Study
• Certain power system attributes were assumed to retain their historical value going forward, others fell outside of the scopeof the analysis, and others were studied using regionally vetted planning models and methods
• This table summarizes how the attribute was or was not addressed in the assessment
Value of the LSR DamsVALUE TO THE SYSTEM
Power System Attribute
Forecasted Value of the LSR Dams Analytical Approach
Resource Adequacy • The LSR dams provide significant capacity to the NW system. When they are removed, the region loss-of-load probability (LOLP) increases to 8%, well above the 5% planning target
• Analyzed the ability of replacement portfolios to makeup this lost capacity using Council’s GENESYS model
• Goal was to return region to pre-removal adequacy levels, going beyond regional adequacy targets
Energy • Historically, the LSR dams provide about 1,000 aMW of generation annually. This value is assumed to continue into the future and the study did not capture any potential climate-driven energy increases/reductions.
• The ability of the replacement resources and existing regional resources to make up the lost energy value of the LSR dams is analyzed through production cost modeling to evaluate impacts to regional dispatch, energy shortfalls, imports, operating costs and power prices
Operating and Contingency Reserves
• Contingency: The exact amount of contingency reserves provided by the LSR Dams is not published
• Operating (regulation and balancing): Not quantified due to a lack of sub-hourly generation data that would indicate the LSR dams role in providing contingency reserves
• Both GENESYS and GridView model contingency reserve requirements as an explicit constraint and any violations of this constraint will be captured in the modeling
• The NWPCC does not consider regulating reserves in its long-term resource making decisions so they were not accounted for in this analysis
• Balancing reserves were captured as constraints in the NWPCC TRAPEZOIDAL (“TRAP”) model, which feeds into GENESYS
Transmission Reliability
• Provides Reactive supply, voltage control, frequency response • Determined by reliability analysis comparing pre-retirement case with cases with replacement portfolios designed to ensure that these services are maintained within established reliability requirements
34PageENERGY STRATEGIES © 2018 | LSR Dam Power Replacement Study
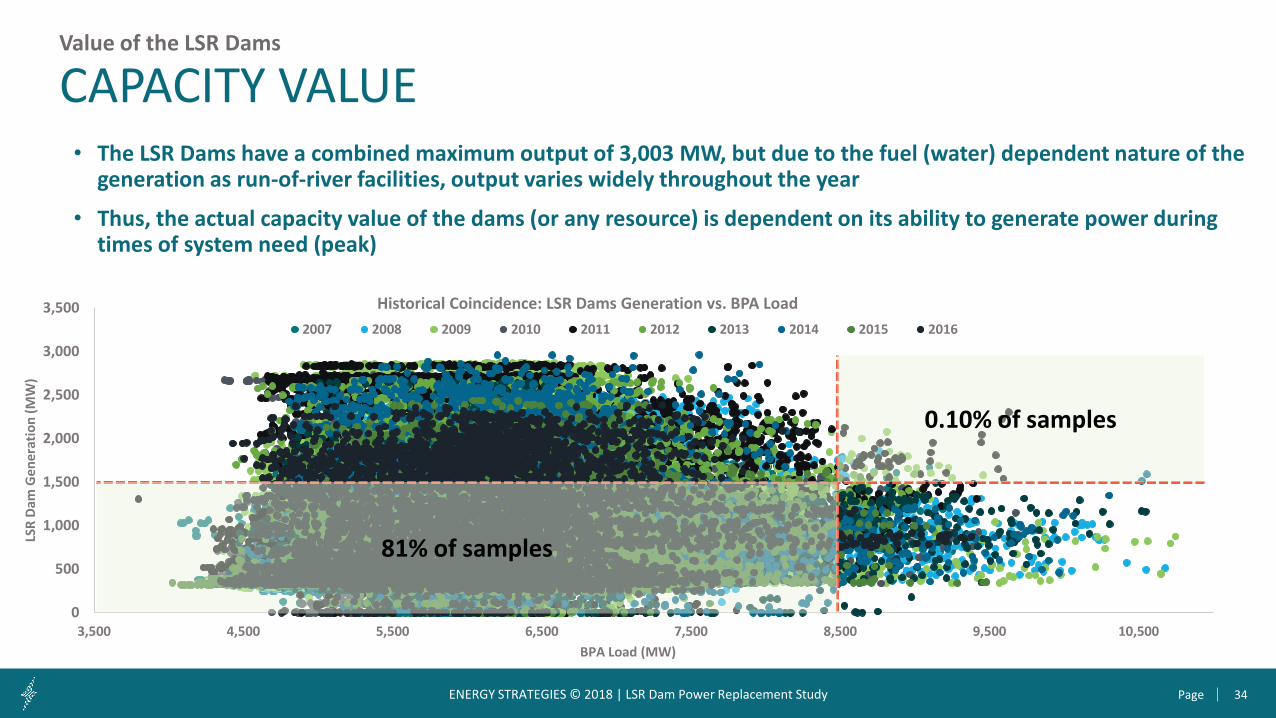
• The LSR Dams have a combined maximum output of 3,003 MW, but due to the fuel (water) dependent nature of the generation as run-of-river facilities, output varies widely throughout the year
• Thus, the actual capacity value of the dams (or any resource) is dependent on its ability to generate power during times of system need (peak)
CAPACITY VALUEValue of the LSR Dams
0
500
1,000
1,500
2,000
2,500
3,000
3,500
3,500 4,500 5,500 6,500 7,500 8,500 9,500 10,500
LSR
Dam
Gen
erat
ion
(MW
)
BPA Load (MW)
Historical Coincidence: LSR Dams Generation vs. BPA Load2007 2008 2009 2010 2011 2012 2013 2014 2015 2016
0.10% of samples
81% of samples
35PageENERGY STRATEGIES © 2018 | LSR Dam Power Replacement Study
CAPACITY VALUEValue of the LSR Dams
0.0
0.5
1.0
1.5
2.0
2.5
3.0
Oct Nov Dec Jan Feb Mar Ap1 Ap2 May Jun Jul Au1 Au2 Sep
LOLP
(%)
Monthly Loss of Load Probability (LOLP, %)
Increase in monthly LOLP due to removal of LSR Dams
Red bar indicates LOLP in Reference Case prior to dam removal
No loss of load before or after LSR dam removal
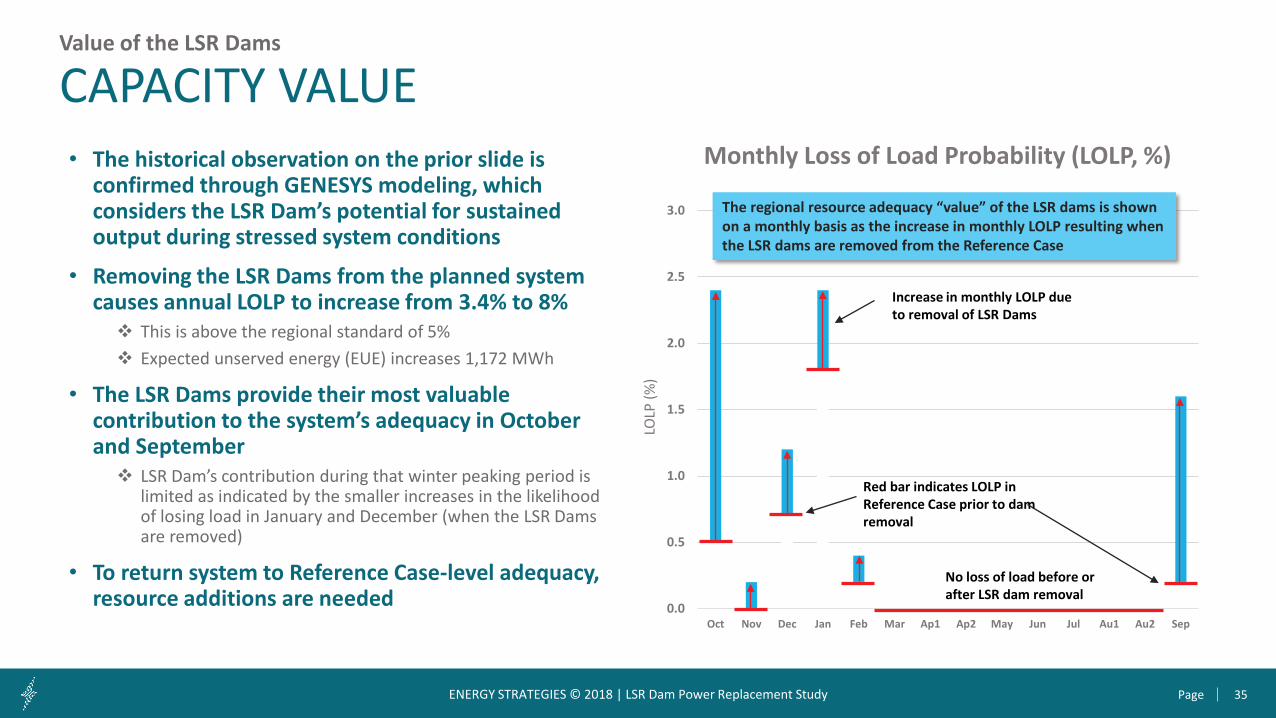
The regional resource adequacy “value” of the LSR dams is shown on a monthly basis as the increase in monthly LOLP resulting when the LSR dams are removed from the Reference Case
• The historical observation on the prior slide is confirmed through GENESYS modeling, which considers the LSR Dam’s potential for sustained output during stressed system conditions
• Removing the LSR Dams from the planned system causes annual LOLP to increase from 3.4% to 8% This is above the regional standard of 5% Expected unserved energy (EUE) increases 1,172 MWh
• The LSR Dams provide their most valuable contribution to the system’s adequacy in October and September LSR Dam’s contribution during that winter peaking period is
limited as indicated by the smaller increases in the likelihood of losing load in January and December (when the LSR Dams are removed)
• To return system to Reference Case-level adequacy, resource additions are needed
36PageENERGY STRATEGIES © 2018 | LSR Dam Power Replacement Study
12.5% of BPA Load9.6% of BPA Hydro
6.6% of BPA Load+Exports
27.9% of BPA Load15.1% of BPA Hydro
12.6% of BPA Load+Exports11.2% of BPA Load
10.7% of BPA Hydro5.7% of BPA Load+Exports
9.3% of BPA Load8.0% of BPA Hydro
5.1% of BPA Load+Exports
0
2,000
4,000
6,000
8,000
10,000
12,000
14,000
16,000
1 2 3 4 5 6 7 8 9 10 11 12
BPA Average Monthly Generation vs Load & Exports (aMW) per 2007-2015LSR Hydro Non-LSR Hydro Thermal Wind Load+Exports Load
ENERGY VALUEValue of the LSR Dams
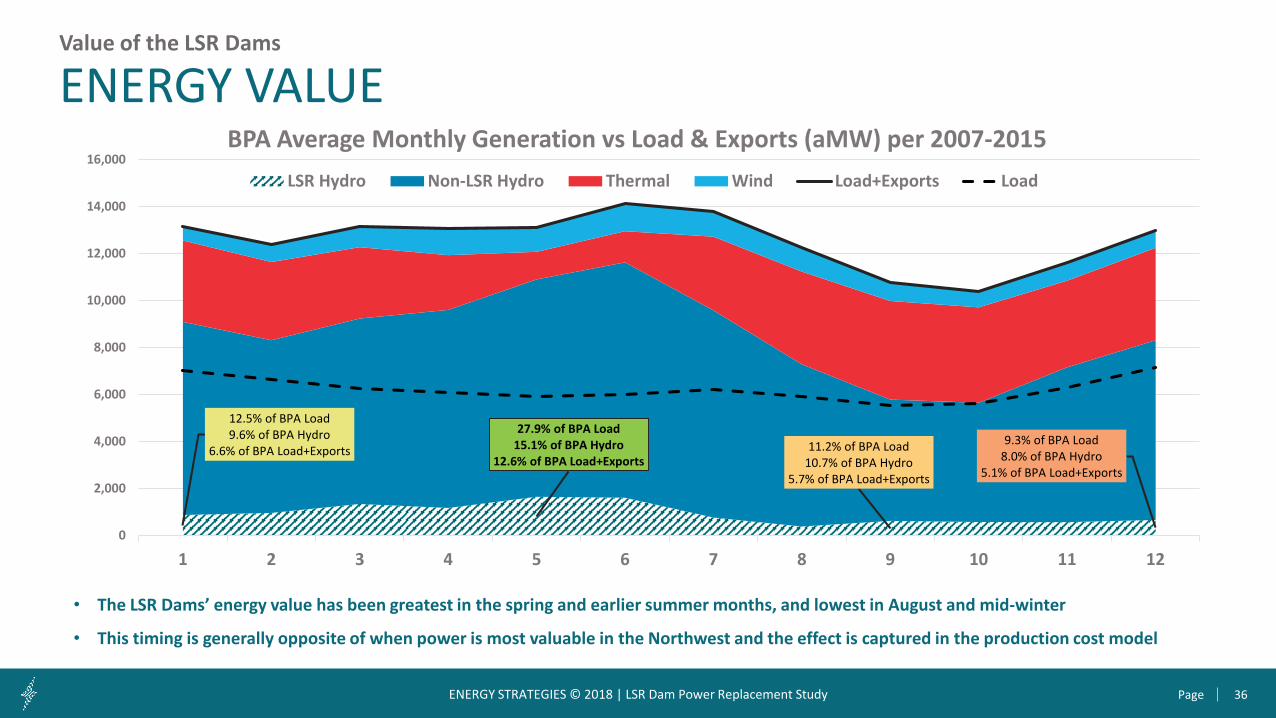
• The LSR Dams’ energy value has been greatest in the spring and earlier summer months, and lowest in August and mid-winter
• This timing is generally opposite of when power is most valuable in the Northwest and the effect is captured in the production cost model
37PageENERGY STRATEGIES © 2018 | LSR Dam Power Replacement Study
5. REPLACEMENT PORTFOLIO PERFORMANCE
• Adequacy Assessment• Reliability Assessment• Operations and Emissions Assessment• Annualized Cost Impact
38PageENERGY STRATEGIES © 2018 | LSR Dam Power Replacement Study
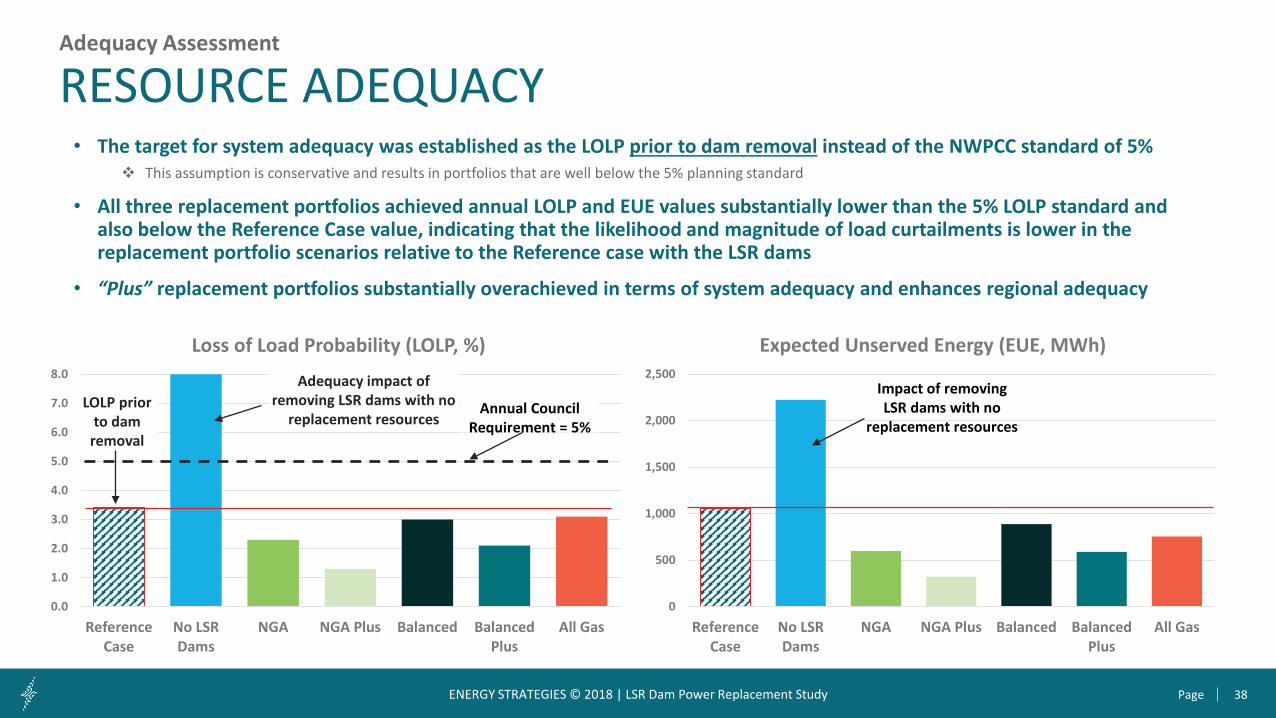
• The target for system adequacy was established as the LOLP prior to dam removal instead of the NWPCC standard of 5% This assumption is conservative and results in portfolios that are well below the 5% planning standard
• All three replacement portfolios achieved annual LOLP and EUE values substantially lower than the 5% LOLP standard and also below the Reference Case value, indicating that the likelihood and magnitude of load curtailments is lower in the replacement portfolio scenarios relative to the Reference case with the LSR dams
• “Plus” replacement portfolios substantially overachieved in terms of system adequacy and enhances regional adequacy
RESOURCE ADEQUACYAdequacy Assessment
0.0
1.0
2.0
3.0
4.0
5.0
6.0
7.0
8.0
ReferenceCase
No LSRDams
NGA NGA Plus Balanced BalancedPlus
All Gas
Loss of Load Probability (LOLP, %)
Adequacy impact of removing LSR dams with no
replacement resourcesLOLP prior
to dam removal
Annual CouncilRequirement = 5%
0
500
1,000
1,500
2,000
2,500
ReferenceCase
No LSRDams
NGA NGA Plus Balanced BalancedPlus
All Gas
Expected Unserved Energy (EUE, MWh)
Impact of removingLSR dams with no
replacement resources

39PageENERGY STRATEGIES © 2018 | LSR Dam Power Replacement Study
0.0
0.5
1.0
1.5
2.0
2.5
3.0
Oct Nov Dec Jan Feb Sep
Monthly Loss of Load Probability (LOLP, %)Reference Case No LSR Dams NGA NGA Plus Balanced Balanced Plus All Gas
March through August are zero and not shown as no curtailment occurred in those months in the study
Balanced portfolio slightly higher than reference in December, but still below Reference on a quarterly basis
All scenarios substantially improved system adequacy in January, indicating that these portfolios enhance adequacy more than LSR dams in certain winter months
NGA portfolio eliminates curtailments in September, resulting in a system with more adequacy than Reference
• Although not defined by the NWPCC standard, shifting the likelihood of curtailment from one month to another is not acceptable from an adequacy planning perspective To mitigate against this, a more conservative and granular monthly LOLP criteria was used to evaluate the replacement portfolios
• The replacement portfolios achieved monthly LOLP values lower than or equal to the Reference case values, indicating that that the likelihood of curtailments decreased (or stayed roughly the same) Critical months such as December and January are roughly at or below the Reference Case level, and no new curtailment risk introduced in high-load months such
as August
RESOURCE ADEQUACYAdequacy Assessment
40PageENERGY STRATEGIES © 2018 | LSR Dam Power Replacement Study
5. REPLACEMENT PORTFOLIO PERFORMANCE
• Adequacy Assessment• Reliability Assessment• Operations and Emissions Assessment• Annual Cost Impact
41PageENERGY STRATEGIES © 2018 | LSR Dam Power Replacement Study
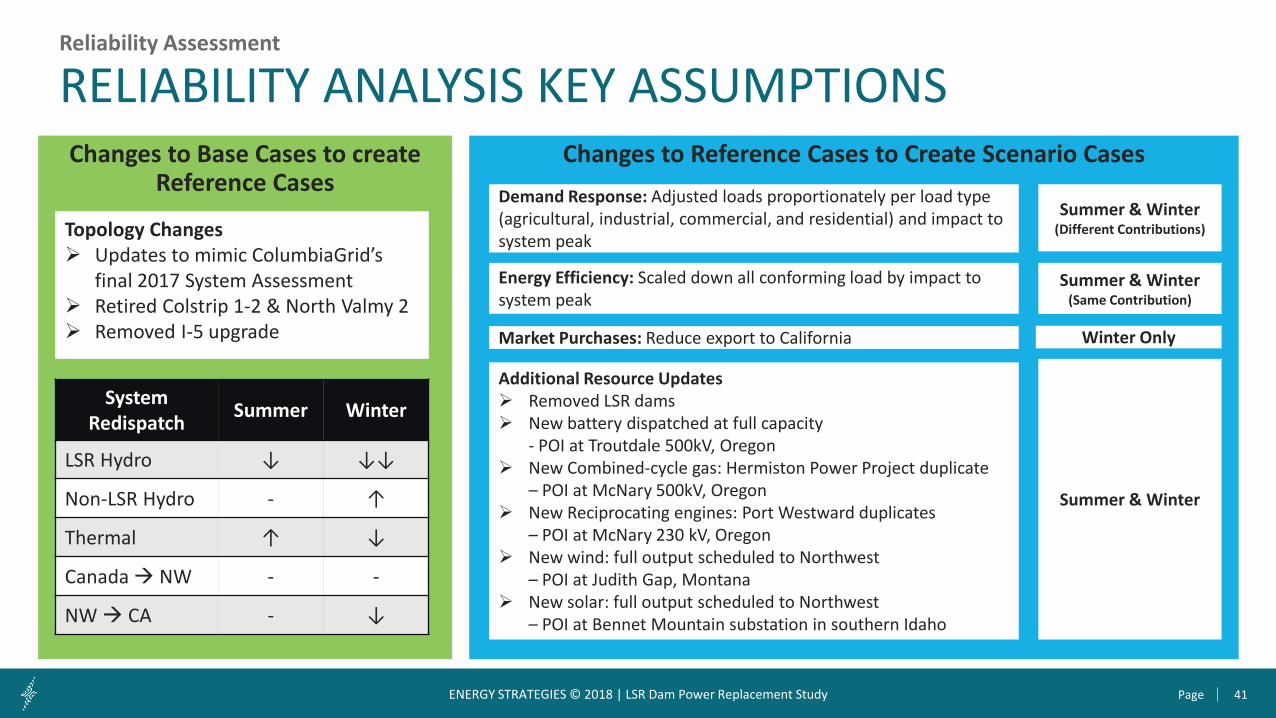
Changes to Base Cases to create Reference Cases
Reliability Assessment
RELIABILITY ANALYSIS KEY ASSUMPTIONS
Topology Changes Updates to mimic ColumbiaGrid’s
final 2017 System Assessment Retired Colstrip 1-2 & North Valmy 2 Removed I-5 upgrade
System Redispatch Summer Winter
LSR Hydro ↓ ↓↓
Non-LSR Hydro - ↑
Thermal ↑ ↓
Canada NW - -
NW CA - ↓
Changes to Reference Cases to Create Scenario CasesDemand Response: Adjusted loads proportionately per load type (agricultural, industrial, commercial, and residential) and impact to system peak
Energy Efficiency: Scaled down all conforming load by impact to system peak
Market Purchases: Reduce export to California
Additional Resource Updates Removed LSR dams New battery dispatched at full capacity
- POI at Troutdale 500kV, Oregon New Combined-cycle gas: Hermiston Power Project duplicate
– POI at McNary 500kV, Oregon New Reciprocating engines: Port Westward duplicates
– POI at McNary 230 kV, Oregon New wind: full output scheduled to Northwest
– POI at Judith Gap, Montana New solar: full output scheduled to Northwest
– POI at Bennet Mountain substation in southern Idaho
Summer & Winter(Different Contributions)
Summer & Winter
Winter Only
Summer & Winter(Same Contribution)
42PageENERGY STRATEGIES © 2018 | LSR Dam Power Replacement Study
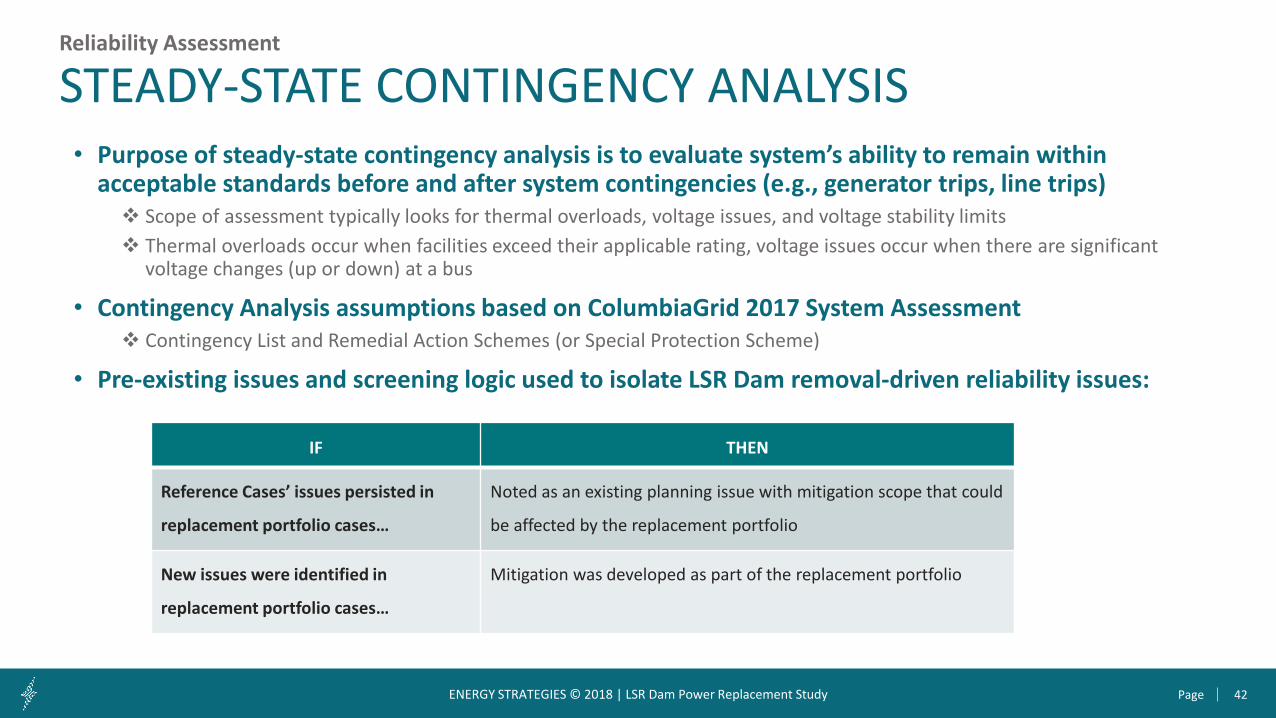
• Purpose of steady-state contingency analysis is to evaluate system’s ability to remain within acceptable standards before and after system contingencies (e.g., generator trips, line trips) Scope of assessment typically looks for thermal overloads, voltage issues, and voltage stability limits Thermal overloads occur when facilities exceed their applicable rating, voltage issues occur when there are significant
voltage changes (up or down) at a bus
• Contingency Analysis assumptions based on ColumbiaGrid 2017 System Assessment Contingency List and Remedial Action Schemes (or Special Protection Scheme)
• Pre-existing issues and screening logic used to isolate LSR Dam removal-driven reliability issues:
STEADY-STATE CONTINGENCY ANALYSISReliability Assessment
IF THEN
Reference Cases’ issues persisted in
replacement portfolio cases…
Noted as an existing planning issue with mitigation scope that could
be affected by the replacement portfolio
New issues were identified in
replacement portfolio cases…
Mitigation was developed as part of the replacement portfolio
43PageENERGY STRATEGIES © 2018 | LSR Dam Power Replacement Study
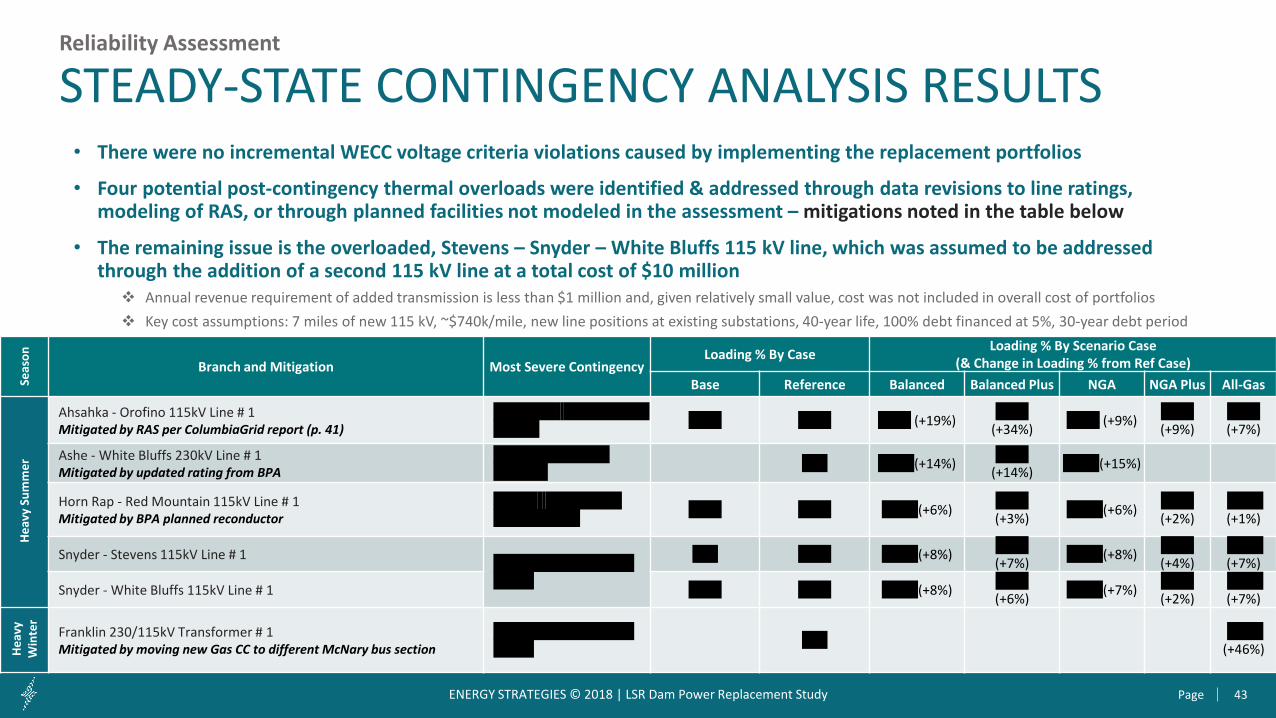
STEADY-STATE CONTINGENCY ANALYSIS RESULTS• There were no incremental WECC voltage criteria violations caused by implementing the replacement portfolios
• Four potential post-contingency thermal overloads were identified & addressed through data revisions to line ratings, modeling of RAS, or through planned facilities not modeled in the assessment – mitigations noted in the table below
• The remaining issue is the overloaded, Stevens – Snyder – White Bluffs 115 kV line, which was assumed to be addressed through the addition of a second 115 kV line at a total cost of $10 million Annual revenue requirement of added transmission is less than $1 million and, given relatively small value, cost was not included in overall cost of portfolios Key cost assumptions: 7 miles of new 115 kV, ~$740k/mile, new line positions at existing substations, 40-year life, 100% debt financed at 5%, 30-year debt period
Reliability AssessmentSe
ason
Branch and Mitigation Most Severe ContingencyLoading % By Case Loading % By Scenario Case
(& Change in Loading % from Ref Case)Base Reference Balanced Balanced Plus NGA NGA Plus All-Gas
Heav
y Su
mm
er
Ahsahka - Orofino 115kV Line # 1Mitigated by RAS per ColumbiaGrid report (p. 41)
Dworshak - Hatwai 500kV Line # 1 109% 101% 121% (+19%) 135%
(+34%) 110% (+9%) 110%(+9%)
108%(+7%)
Ashe - White Bluffs 230kV Line # 1Mitigated by updated rating from BPA
Midway 230kV Bus Section 2 88% 102% (+14%) 102%
(+14%) 103% (+15%)
Horn Rap - Red Mountain 115kV Line # 1Mitigated by BPA planned reconductor
Snyder - White Bluffs 115kV Line # 1 120% 125% 131% (+6%) 128%
(+3%) 131% (+6%) 127%(+2%)
127% (+1%)
Snyder - Stevens 115kV Line # 1 McNary 115kV Breaker Failure
99% 103% 111% (+8%) 110%(+7%) 111% (+8%) 107%
(+4%)111% (+7%)
Snyder - White Bluffs 115kV Line # 1 116% 121% 129% (+8%) 127%(+6%) 128% (+7%) 123%
(+2%)128% (+7%)
Heav
y W
inte
r
Franklin 230/115kV Transformer # 1Mitigated by moving new Gas CC to different McNary bus section
McNary 500kV Breaker Failure 70% 116%
(+46%)
44PageENERGY STRATEGIES © 2018 | LSR Dam Power Replacement Study
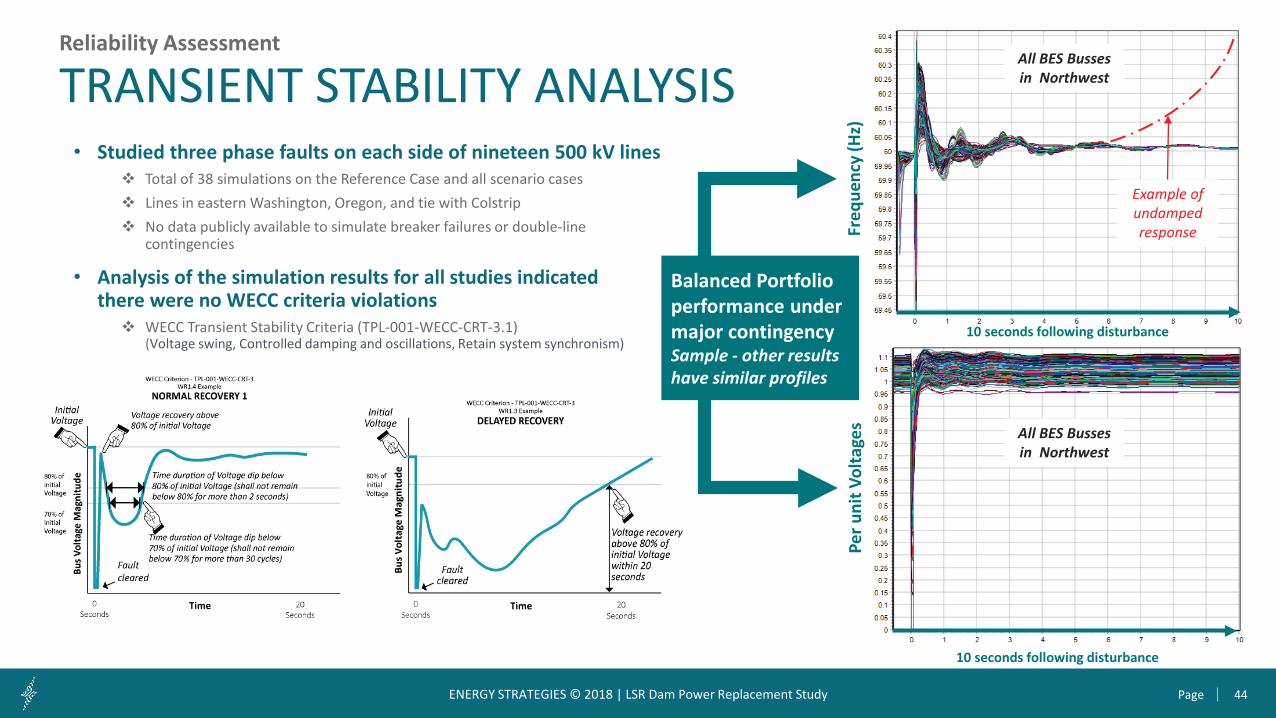
• Studied three phase faults on each side of nineteen 500 kV lines Total of 38 simulations on the Reference Case and all scenario cases Lines in eastern Washington, Oregon, and tie with Colstrip No data publicly available to simulate breaker failures or double-line
contingencies
• Analysis of the simulation results for all studies indicatedthere were no WECC criteria violations WECC Transient Stability Criteria (TPL-001-WECC-CRT-3.1)
(Voltage swing, Controlled damping and oscillations, Retain system synchronism)
TRANSIENT STABILITY ANALYSISAll BES Busses in Northwest
10 seconds following disturbance
10 seconds following disturbance
Per u
nit V
olta
ges
Freq
uenc
y (H
z)
Reliability Assessment
Balanced Portfolioperformance under major contingency Sample - other results have similar profiles
All BES Busses in Northwest
Example of undamped response
45PageENERGY STRATEGIES © 2018 | LSR Dam Power Replacement Study
5. REPLACEMENT PORTFOLIO PERFORMANCE
• Adequacy Assessment• Reliability Assessment• Operations and Emissions Assessment• Annualized Cost Impact
46PageENERGY STRATEGIES © 2018 | LSR Dam Power Replacement Study
Reference Case8,976,409
Historical Average9,125,554
0
2,000,000
4,000,000
6,000,000
8,000,000
10,000,000
12,000,000
14,000,000
16,000,000
1995
1996
1997
1998
1999
2000
2001
2002
2003
2004
2005
2006
2007
2008
2009
2010
2011
2012
2013
2014
2015
2016
LSR Dams Net Annual Generation (MWh)
Reference Case Historical Average LSR Net Generation
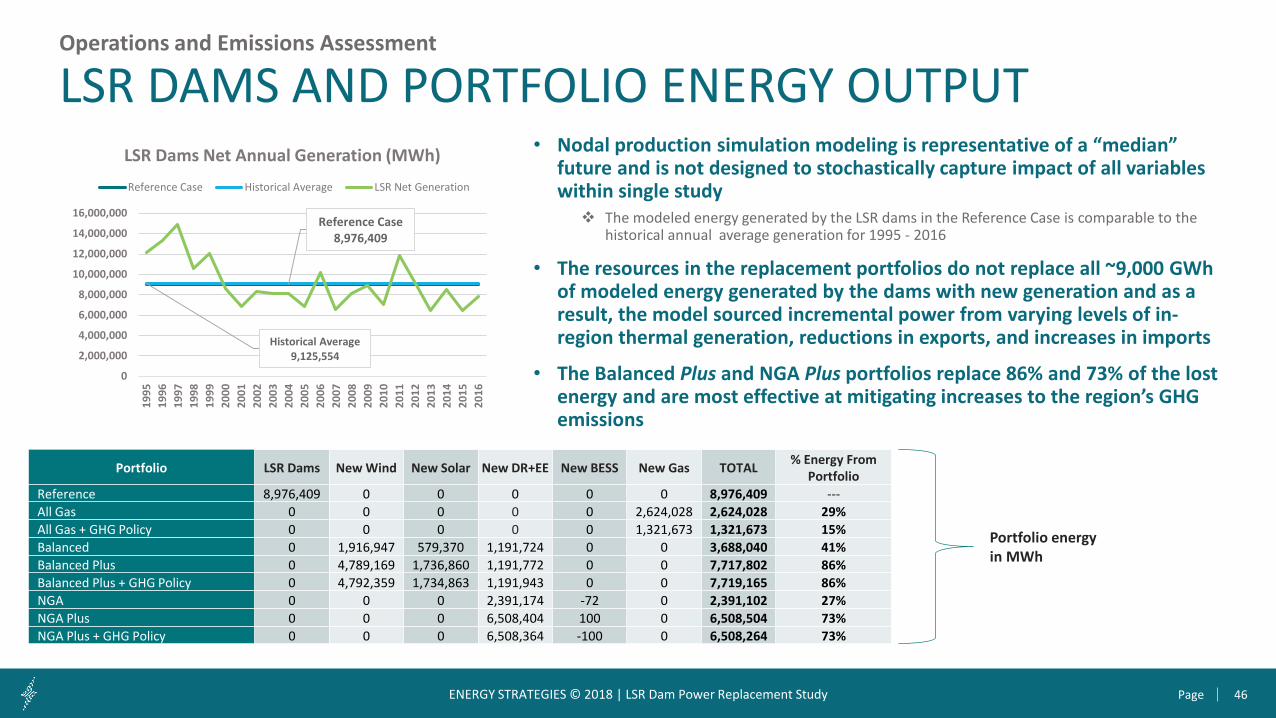
• Nodal production simulation modeling is representative of a “median” future and is not designed to stochastically capture impact of all variables within single study The modeled energy generated by the LSR dams in the Reference Case is comparable to the
historical annual average generation for 1995 - 2016
• The resources in the replacement portfolios do not replace all ~9,000 GWh of modeled energy generated by the dams with new generation and as a result, the model sourced incremental power from varying levels of in-region thermal generation, reductions in exports, and increases in imports
• The Balanced Plus and NGA Plus portfolios replace 86% and 73% of the lost energy and are most effective at mitigating increases to the region’s GHG emissions
Operations and Emissions Assessment
LSR DAMS AND PORTFOLIO ENERGY OUTPUT
Portfolio LSR Dams New Wind New Solar New DR+EE New BESS New Gas TOTAL % Energy From Portfolio
Reference 8,976,409 0 0 0 0 0 8,976,409 ---All Gas 0 0 0 0 0 2,624,028 2,624,028 29%All Gas + GHG Policy 0 0 0 0 0 1,321,673 1,321,673 15%Balanced 0 1,916,947 579,370 1,191,724 0 0 3,688,040 41%Balanced Plus 0 4,789,169 1,736,860 1,191,772 0 0 7,717,802 86%Balanced Plus + GHG Policy 0 4,792,359 1,734,863 1,191,943 0 0 7,719,165 86%NGA 0 0 0 2,391,174 -72 0 2,391,102 27%NGA Plus 0 0 0 6,508,404 100 0 6,508,504 73%NGA Plus + GHG Policy 0 0 0 6,508,364 -100 0 6,508,264 73%
Portfolio energy in MWh

47PageENERGY STRATEGIES © 2018 | LSR Dam Power Replacement Study
• Removing the LSR dams generally increased the amount of annual gross imports and decreased the amount of gross exports, with the net effect being varying reductions in regional net exports
• The Balanced Plus and NGA Plus portfolios limited the reduction to net exports due to (1) amount of energy in those portfolios and (2) the timing at which that energy was available relative to the LSR Dam generation
Operations and Emissions Assessment
IMPACTS TO IMPORTS/EXPORTS
Portfolio Annual Gross Imports (GWh)
∆ Import (GWh)
Annual Gross Exports (GWh)
∆ Export (GWh)
Annual Net Exports (GWh)
∆ Export (GWh)
∆ Export (%)
∆ Export (aMW)
Reference 13,181 0 26,510 0 13,329 0 0% 0
Balanced 14,319 1,138 25,781 -729 11,462 -1,867 -14% -213
Balanced Plus 13,908 727 26,888 379 12,980 -349 -3% -40
Balanced Plus + GHG Policy 17,971 4,790 24,648 -1,862 6,677 -6,652 -50% -759
NGA 13,972 791 24,799 -1,711 10,827 -2,502 -19% -286
NGA Plus 13,514 333 26,190 -320 12,676 -653 -5% -75
NGA Plus + GHG Policy 18,601 5,420 24,521 -1,989 5,920 -7,409 -56% -846
All-Gas 14,393 1,212 25,386 -1,123 10,993 -2,336 -18% -267
All-Gas + GHG Policy 19,291 6,110 22,427 -4,082 3,136 -10,193 -76% -1164
• The GHG Policy sensitivities had the effect of increasing the marginal power price in the region as the cost of carbon is internalized by thermal units, which (1) increased the in-region value of low-carbon resources that would have otherwise been exported and (2) increased the cost of dispatching thermal generators for export.
48PageENERGY STRATEGIES © 2018 | LSR Dam Power Replacement Study
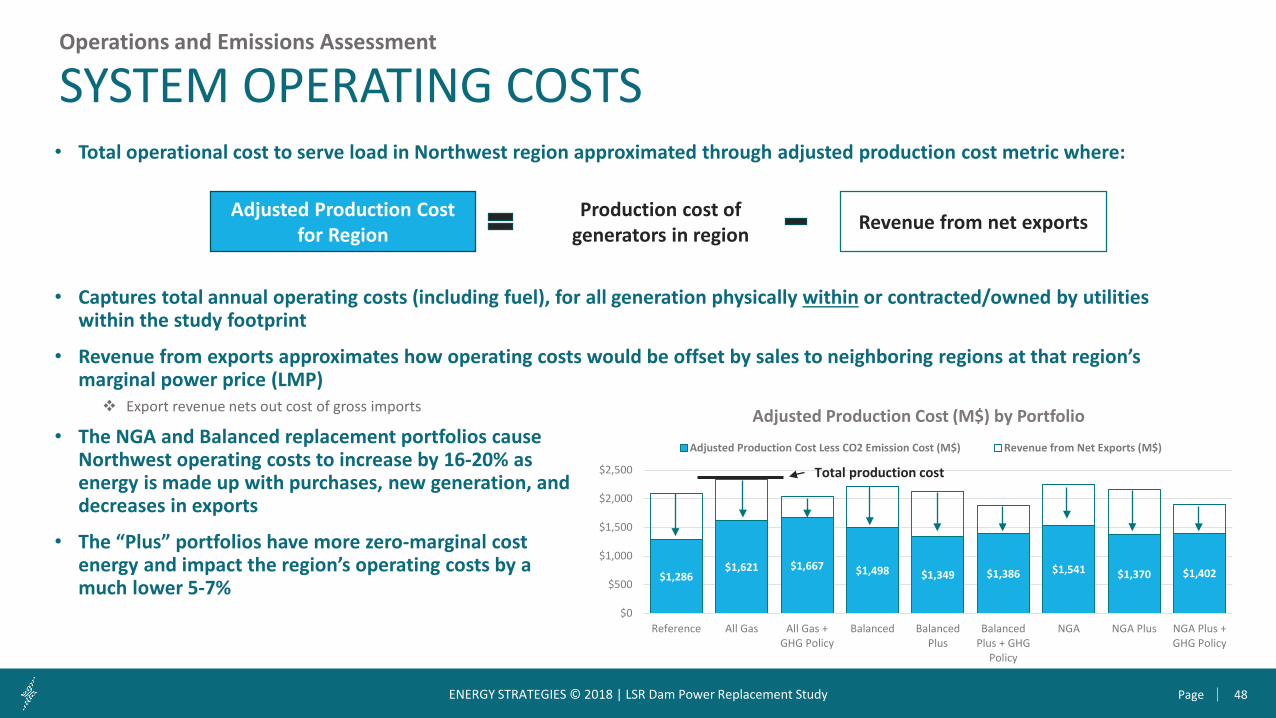
• Total operational cost to serve load in Northwest region approximated through adjusted production cost metric where:
• Captures total annual operating costs (including fuel), for all generation physically within or contracted/owned by utilities within the study footprint
• Revenue from exports approximates how operating costs would be offset by sales to neighboring regions at that region’s marginal power price (LMP) Export revenue nets out cost of gross imports
Operations and Emissions Assessment
SYSTEM OPERATING COSTS
Adjusted Production Cost for Region
Production cost of generators in region Revenue from net exports
• The NGA and Balanced replacement portfolios cause Northwest operating costs to increase by 16-20% as energy is made up with purchases, new generation, and decreases in exports
• The “Plus” portfolios have more zero-marginal cost energy and impact the region’s operating costs by a much lower 5-7%
$1,286$1,621 $1,667 $1,498 $1,349 $1,386 $1,541 $1,370 $1,402
$0
$500
$1,000
$1,500
$2,000
$2,500
Reference All Gas All Gas +GHG Policy
Balanced BalancedPlus
BalancedPlus + GHG
Policy
NGA NGA Plus NGA Plus +GHG Policy
Adjusted Production Cost (M$) by Portfolio
Adjusted Production Cost Less CO2 Emission Cost (M$) Revenue from Net Exports (M$)
Total production cost
49PageENERGY STRATEGIES © 2018 | LSR Dam Power Replacement Study
GHG EMISSIONSOperations and Emissions Assessment
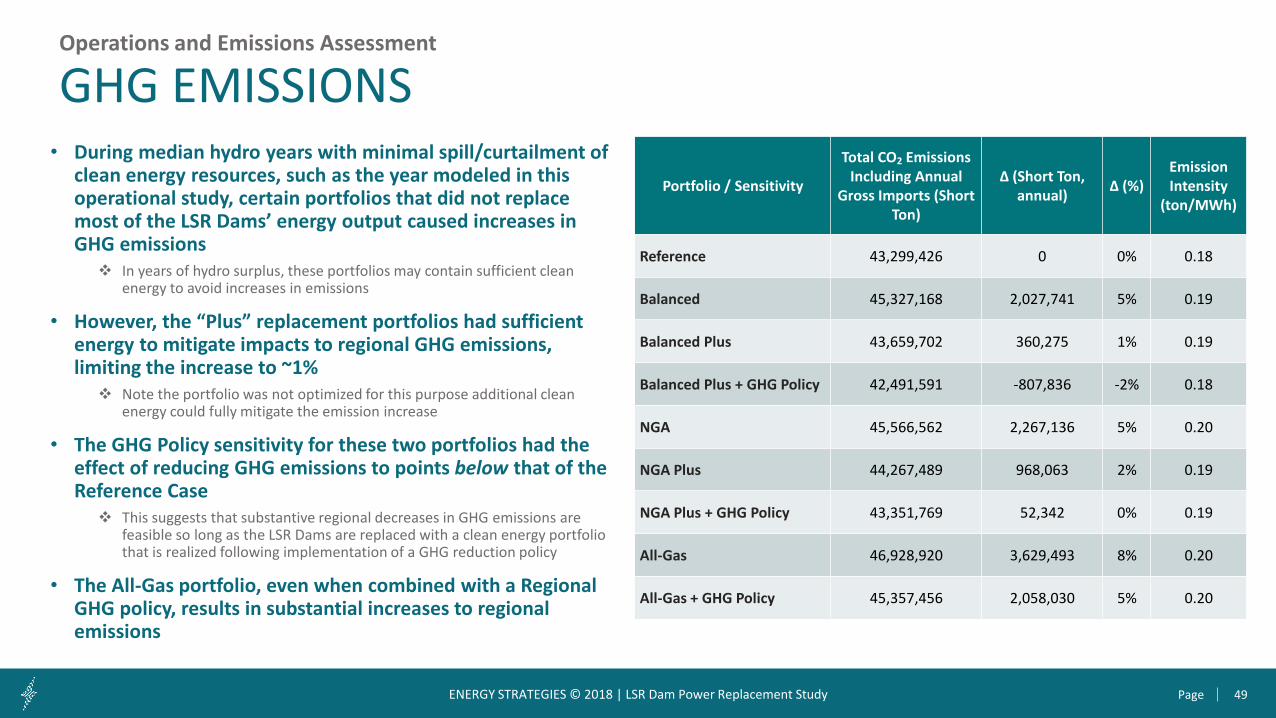
• During median hydro years with minimal spill/curtailment of clean energy resources, such as the year modeled in this operational study, certain portfolios that did not replace most of the LSR Dams’ energy output caused increases in GHG emissions In years of hydro surplus, these portfolios may contain sufficient clean
energy to avoid increases in emissions
• However, the “Plus” replacement portfolios had sufficient energy to mitigate impacts to regional GHG emissions, limiting the increase to ~1% Note the portfolio was not optimized for this purpose additional clean
energy could fully mitigate the emission increase
• The GHG Policy sensitivity for these two portfolios had the effect of reducing GHG emissions to points below that of the Reference Case This suggests that substantive regional decreases in GHG emissions are
feasible so long as the LSR Dams are replaced with a clean energy portfolio that is realized following implementation of a GHG reduction policy
• The All-Gas portfolio, even when combined with a Regional GHG policy, results in substantial increases to regional emissions
Portfolio / Sensitivity
Total CO2 Emissions Including Annual
Gross Imports (Short Ton)
∆ (Short Ton, annual) ∆ (%)
Emission Intensity
(ton/MWh)
Reference 43,299,426 0 0% 0.18
Balanced 45,327,168 2,027,741 5% 0.19
Balanced Plus 43,659,702 360,275 1% 0.19
Balanced Plus + GHG Policy 42,491,591 -807,836 -2% 0.18
NGA 45,566,562 2,267,136 5% 0.20
NGA Plus 44,267,489 968,063 2% 0.19
NGA Plus + GHG Policy 43,351,769 52,342 0% 0.19
All-Gas 46,928,920 3,629,493 8% 0.20
All-Gas + GHG Policy 45,357,456 2,058,030 5% 0.20
50PageENERGY STRATEGIES © 2018 | LSR Dam Power Replacement Study
Operations and Emissions Assessment
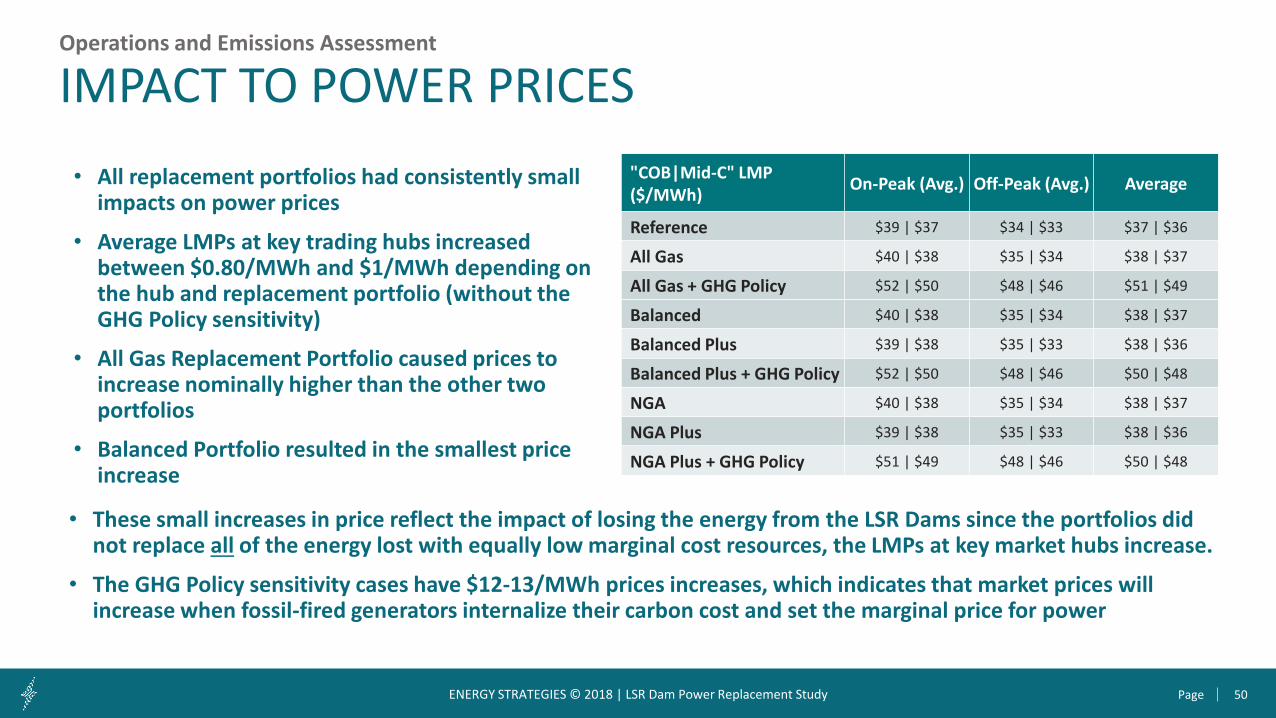
IMPACT TO POWER PRICES• All replacement portfolios had consistently small
impacts on power prices
• Average LMPs at key trading hubs increased between $0.80/MWh and $1/MWh depending on the hub and replacement portfolio (without the GHG Policy sensitivity)
• All Gas Replacement Portfolio caused prices to increase nominally higher than the other two portfolios
• Balanced Portfolio resulted in the smallest price increase
• These small increases in price reflect the impact of losing the energy from the LSR Dams since the portfolios did not replace all of the energy lost with equally low marginal cost resources, the LMPs at key market hubs increase.
• The GHG Policy sensitivity cases have $12-13/MWh prices increases, which indicates that market prices will increase when fossil-fired generators internalize their carbon cost and set the marginal price for power
"COB|Mid-C" LMP($/MWh) On-Peak (Avg.) Off-Peak (Avg.) Average
Reference $39 | $37 $34 | $33 $37 | $36
All Gas $40 | $38 $35 | $34 $38 | $37
All Gas + GHG Policy $52 | $50 $48 | $46 $51 | $49
Balanced $40 | $38 $35 | $34 $38 | $37
Balanced Plus $39 | $38 $35 | $33 $38 | $36
Balanced Plus + GHG Policy $52 | $50 $48 | $46 $50 | $48
NGA $40 | $38 $35 | $34 $38 | $37
NGA Plus $39 | $38 $35 | $33 $38 | $36
NGA Plus + GHG Policy $51 | $49 $48 | $46 $50 | $48
51PageENERGY STRATEGIES © 2018 | LSR Dam Power Replacement Study
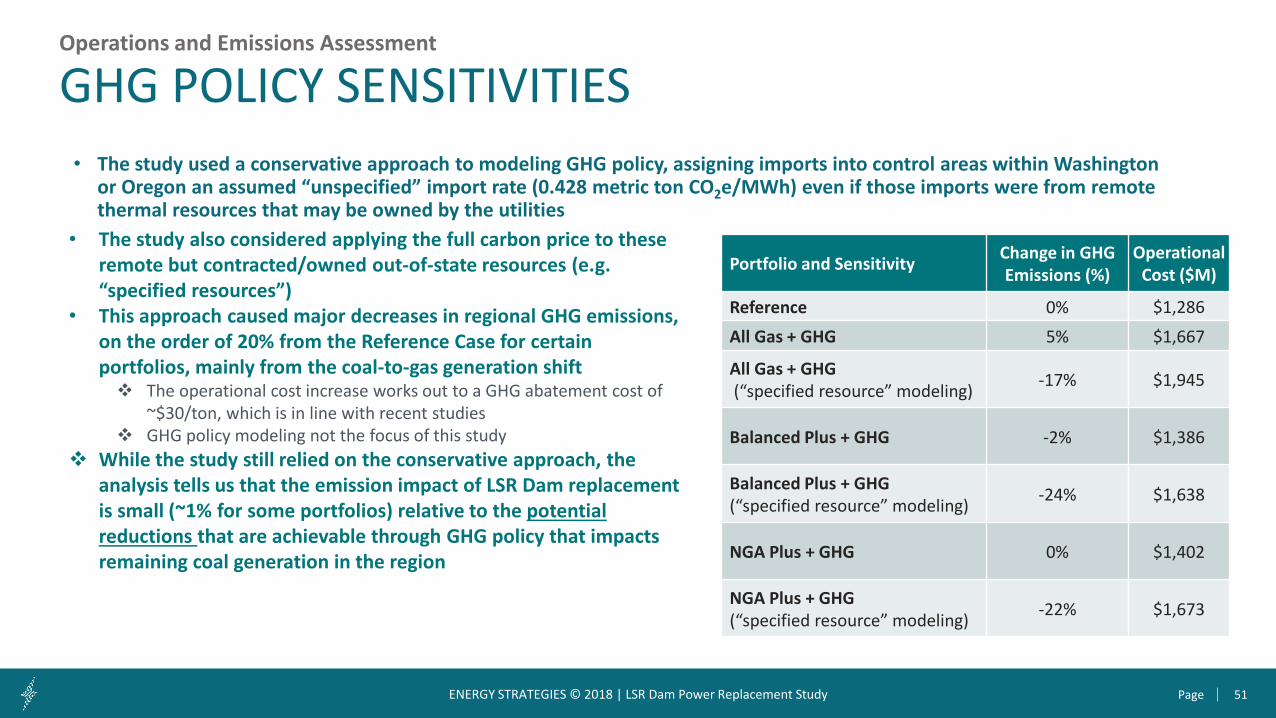
• The study used a conservative approach to modeling GHG policy, assigning imports into control areas within Washington or Oregon an assumed “unspecified” import rate (0.428 metric ton CO2e/MWh) even if those imports were from remote thermal resources that may be owned by the utilities
Operations and Emissions Assessment
GHG POLICY SENSITIVITIES
Portfolio and Sensitivity Change in GHG Emissions (%)
Operational Cost ($M)
Reference 0% $1,286All Gas + GHG 5% $1,667
All Gas + GHG(“specified resource” modeling) -17% $1,945
Balanced Plus + GHG -2% $1,386
Balanced Plus + GHG(“specified resource” modeling) -24% $1,638
NGA Plus + GHG 0% $1,402
NGA Plus + GHG(“specified resource” modeling) -22% $1,673
• The study also considered applying the full carbon price to these remote but contracted/owned out-of-state resources (e.g. “specified resources”)
• This approach caused major decreases in regional GHG emissions, on the order of 20% from the Reference Case for certain portfolios, mainly from the coal-to-gas generation shift The operational cost increase works out to a GHG abatement cost of
~$30/ton, which is in line with recent studies GHG policy modeling not the focus of this study
While the study still relied on the conservative approach, the analysis tells us that the emission impact of LSR Dam replacement is small (~1% for some portfolios) relative to the potential reductions that are achievable through GHG policy that impacts remaining coal generation in the region
52PageENERGY STRATEGIES © 2018 | LSR Dam Power Replacement Study
5. REPLACEMENT PORTFOLIO PERFORMANCE
• Adequacy Assessment• Reliability Assessment• Operations and Emissions Assessment• Annualized Cost Impact
53PageENERGY STRATEGIES © 2018 | LSR Dam Power Replacement Study
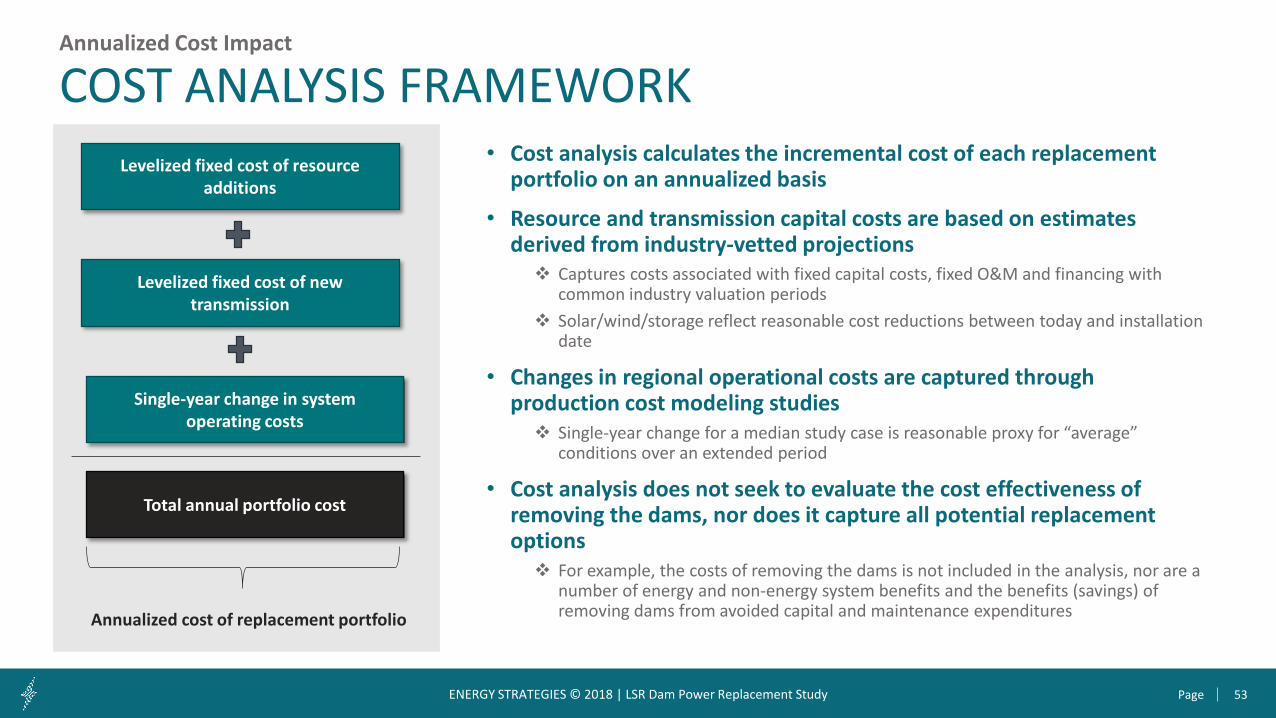
COST ANALYSIS FRAMEWORK• Cost analysis calculates the incremental cost of each replacement
portfolio on an annualized basis
• Resource and transmission capital costs are based on estimates derived from industry-vetted projections Captures costs associated with fixed capital costs, fixed O&M and financing with
common industry valuation periods Solar/wind/storage reflect reasonable cost reductions between today and installation
date
• Changes in regional operational costs are captured through production cost modeling studies Single-year change for a median study case is reasonable proxy for “average”
conditions over an extended period
• Cost analysis does not seek to evaluate the cost effectiveness of removing the dams, nor does it capture all potential replacement options For example, the costs of removing the dams is not included in the analysis, nor are a
number of energy and non-energy system benefits and the benefits (savings) of removing dams from avoided capital and maintenance expenditures
Levelized fixed cost of resource additions
Levelized fixed cost of new transmission
Single-year change in system operating costs
Total annual portfolio cost
Annualized cost of replacement portfolio
Annualized Cost Impact

54PageENERGY STRATEGIES © 2018 | LSR Dam Power Replacement Study
ASSUMPTIONS AND METHODOLGY Resource Type Replacement Portfolio Cost Assumption
Demand Response 7th Plan documentation
Energy Efficiency
Renewable Resources
Energy Strategies-derived costs based on multiple industry cost estimates
Battery Storage Energy Strategies-derived costs based primarily on Lazard Levelized Cost of Storage Report v3.0
Gas CC7th Plan documentation
Gas CT
Annualized Cost Impact
• Wind, solar and battery storage levelized fixed costs were calculated using the 2017 WECC Capital Cost Model, with some modifications Publicly vetted cash flow model created for WECC’s long-term transmission expansion planning
process Allows users to input unique assumptions for generation resources
Energy Strategies updated the resource capital cost assumptions in the model to account for recent estimates customized for the Northwest
• All resources, transmission, and operational costs embedded in Reference Case are considered sunk costs This includes 5-year Action Plan for demand response and energy efficiency from NWPCC 7th Plan
2017 WECC Capital Cost Proforma Model can be
found at this link
2017 WECC Capital Cost Pro-Forma Model
Levelized Fixed Cost ($/kW-yr)
Property Tax and Insurance
• Assumes 1% property tax and no insurance cost
Capital Cost• Energy Strategies-
defined input in $/kW
• Includes Progress Multiplier to capture future cost declines
(ITC Value)• Assumes 10% ITC
on 95% of capital for solar
• Not applicable for wind
O&M• Fixed over 25-yr
life of asset +++ =
55PageENERGY STRATEGIES © 2018 | LSR Dam Power Replacement Study
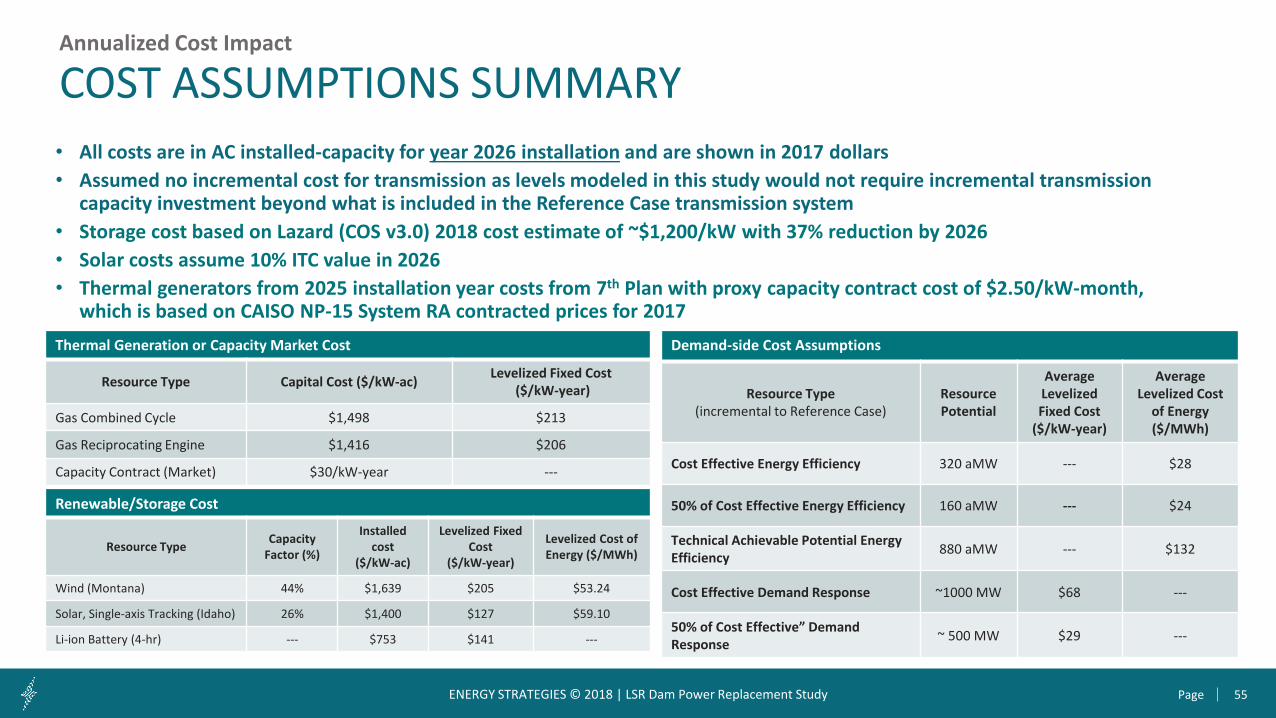
• All costs are in AC installed-capacity for year 2026 installation and are shown in 2017 dollars• Assumed no incremental cost for transmission as levels modeled in this study would not require incremental transmission
capacity investment beyond what is included in the Reference Case transmission system • Storage cost based on Lazard (COS v3.0) 2018 cost estimate of ~$1,200/kW with 37% reduction by 2026 • Solar costs assume 10% ITC value in 2026• Thermal generators from 2025 installation year costs from 7th Plan with proxy capacity contract cost of $2.50/kW-month,
which is based on CAISO NP-15 System RA contracted prices for 2017
Annualized Cost Impact
COST ASSUMPTIONS SUMMARY
Thermal Generation or Capacity Market Cost
Resource Type Capital Cost ($/kW-ac) Levelized Fixed Cost($/kW-year)
Gas Combined Cycle $1,498 $213
Gas Reciprocating Engine $1,416 $206
Capacity Contract (Market) $30/kW-year ---
Renewable/Storage Cost
Resource Type Capacity Factor (%)
Installed cost
($/kW-ac)
Levelized Fixed Cost
($/kW-year)
Levelized Cost of Energy ($/MWh)
Wind (Montana) 44% $1,639 $205 $53.24
Solar, Single-axis Tracking (Idaho) 26% $1,400 $127 $59.10
Li-ion Battery (4-hr) --- $753 $141 ---
Demand-side Cost Assumptions
Resource Type (incremental to Reference Case)
Resource Potential
Average Levelized Fixed Cost
($/kW-year)
Average Levelized Cost
of Energy ($/MWh)
Cost Effective Energy Efficiency 320 aMW --- $28
50% of Cost Effective Energy Efficiency 160 aMW --- $24
Technical Achievable Potential Energy Efficiency 880 aMW --- $132
Cost Effective Demand Response ~1000 MW $68 ---
50% of Cost Effective” Demand Response ~ 500 MW $29 ---
56PageENERGY STRATEGIES © 2018 | LSR Dam Power Replacement Study
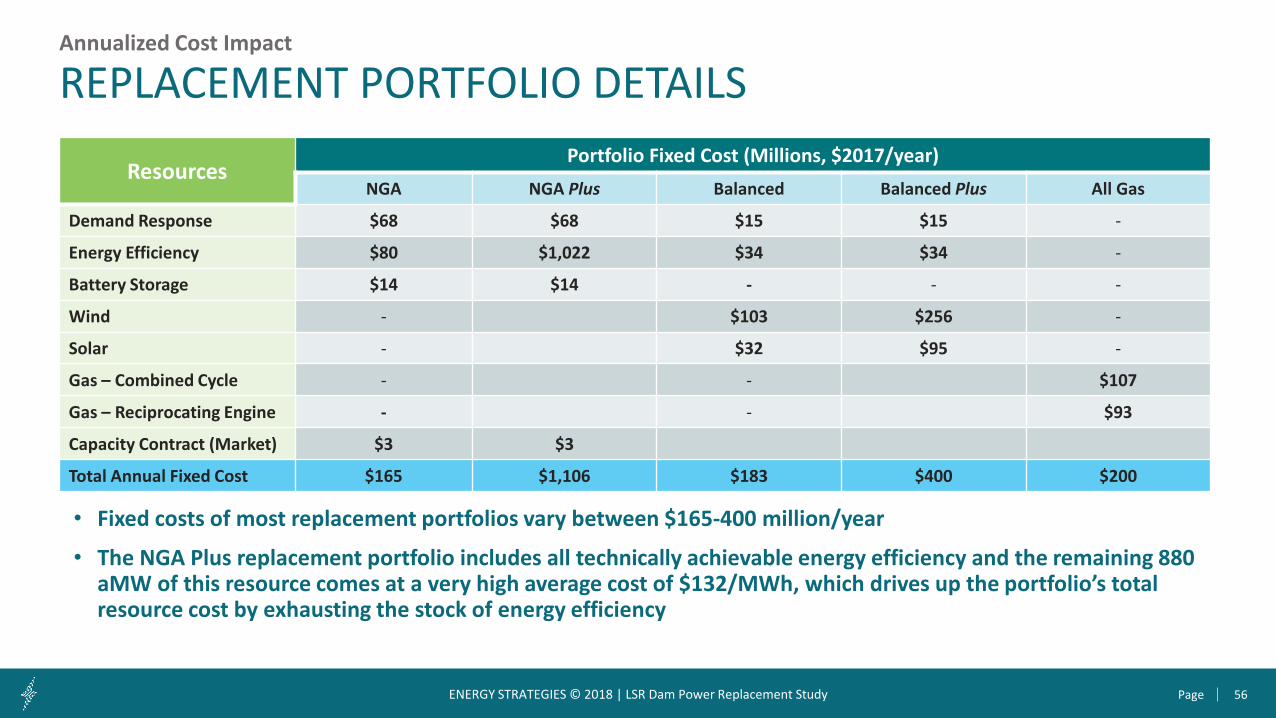
REPLACEMENT PORTFOLIO DETAILSAnnualized Cost Impact
ResourcesPortfolio Fixed Cost (Millions, $2017/year)
NGA NGA Plus Balanced Balanced Plus All Gas
Demand Response $68 $68 $15 $15 -
Energy Efficiency $80 $1,022 $34 $34 -
Battery Storage $14 $14 - - -
Wind - $103 $256 -
Solar - $32 $95 -
Gas – Combined Cycle - - $107
Gas – Reciprocating Engine - - $93
Capacity Contract (Market) $3 $3
Total Annual Fixed Cost $165 $1,106 $183 $400 $200
• Fixed costs of most replacement portfolios vary between $165-400 million/year
• The NGA Plus replacement portfolio includes all technically achievable energy efficiency and the remaining 880 aMW of this resource comes at a very high average cost of $132/MWh, which drives up the portfolio’s total resource cost by exhausting the stock of energy efficiency

57PageENERGY STRATEGIES © 2018 | LSR Dam Power Replacement Study
$200 $165
$1,107
$183
$400
$200
$1,107
$400
$335 $255
$84
$212
$63 $381
$116
$100
$-
$200
$400
$600
$800
$1,000
$1,200
$1,400
All Gas NGA NGA Plus Balanced BalancedPlus
All Gas &GHG
Policy
NGA Plus& GHGPolicy
BalancedPlus &GHG
Policy
Total Annual Cost of Replacement Portfolios ($M/year)
Resource Additions Fixed Cost Transmission Additions Operational Cost
• All Gas portfolios have greater increases in operating costs as compared to clean portfolios On average, All Gas portfolio costs $110 million per year more than
the clean replacement portfolios (excluding the NGA Plus option)
• NGA and Balanced portfolio are similar in total cost NGA Portfolio has a slightly lower fixed costs from resource
additions, but higher operating costs Balanced Portfolio has higher fixed costs, but lower operating costs
• Transmission addition costs are insignificant relative to total costs for all portfolios Less than $1M/yr
• Balanced Plus portfolio is about 17% more costly than the Balanced portfolio, but has the benefit of relative reductions in carbon emissions The GHG reduction policy sensitivity further emphases this effect,
although the incremental carbon reductions come at a lower abatement cost due to the efficiency of the carbon policy (relative to the incremental resource additions)
INCREMENTAL COST OF REPLACEMENTAnnualized Cost Impact
$535$581
$421
$1,191 $1,224
$396$464 $501
GHG Policy Sensitivities
58PageENERGY STRATEGIES © 2018 | LSR Dam Power Replacement Study
$-
$2,000
$4,000
$6,000
$8,000
$10,000
$12,000
$14,000
$16,000
$18,000
Tota
l Sys
tem
Rev
enue
Req
uire
men
t ($M
)
Northwest System Annual Revenue Requirement ($2017 in millions)
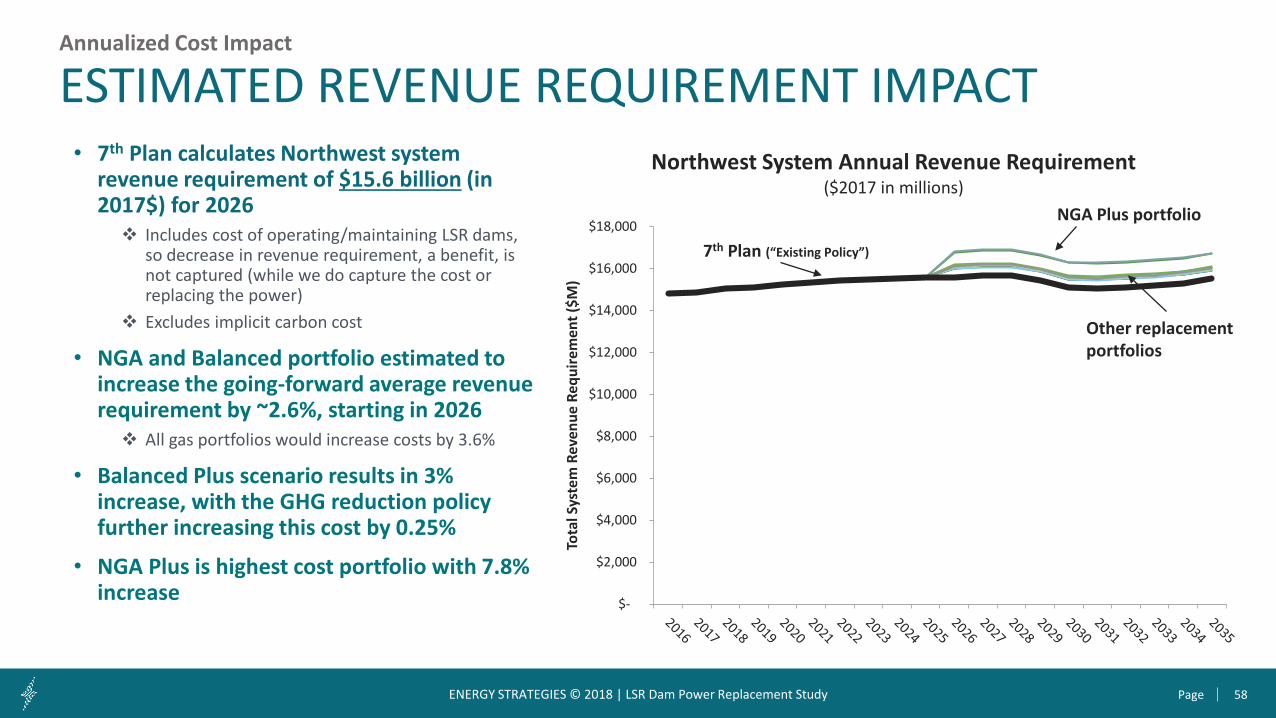
• 7th Plan calculates Northwest system revenue requirement of $15.6 billion (in 2017$) for 2026 Includes cost of operating/maintaining LSR dams,
so decrease in revenue requirement, a benefit, is not captured (while we do capture the cost or replacing the power)
Excludes implicit carbon cost
• NGA and Balanced portfolio estimated to increase the going-forward average revenue requirement by ~2.6%, starting in 2026 All gas portfolios would increase costs by 3.6%
• Balanced Plus scenario results in 3% increase, with the GHG reduction policy further increasing this cost by 0.25%
• NGA Plus is highest cost portfolio with 7.8% increase
ESTIMATED REVENUE REQUIREMENT IMPACTAnnualized Cost Impact
NGA Plus portfolio
Other replacement portfolios
7th Plan (“Existing Policy”)

59PageENERGY STRATEGIES © 2018 | LSR Dam Power Replacement Study
0%
5%
10%
15%
-2% -1% 0% 1% 2% 3% 4% 5% 6% 7% 8% 9%
Change in Total Revenue
Requirement (%)
Change in Annual CO2 Emissions (%)
Changes to Regional Regional Costs and CO2 Emissions• The initial Balanced, NGA, and Gas portfolios did not
meet the study goal of mitigating increase in carbon emissions
• When the Balanced portfolio was modified to include additional renewable resources and then modified further to include a regional GHG policy, carbon emissions are fully mitigated at a relatively low incremental cost
• The effect was similar for the NGA case, but because the incremental energy efficiency had a high cost, the iteration of the portfolio had a much higher carbon abatement cost as reflected by the increase in the regional revenue requirement
• The All Gas portfolio started with much higher emissions and while the GHG policy was effective at reducing those emissions, the portfolio was still more costly and higher emitting than the Balanced portfolio
• An optimized portfolio may result in an finely tuned balance between emissions and cost tradeoffs
For example: If the Balanced portfolio was optimized to include slightly more conservation, emission reductions may be further mitigated at a lower cost
Annualized Cost Impact
COSTS AND EMISSIONS SUMMARY
+ GHG policy
Balanced Portfolios
NGA Portfolios
All Gas Portfolios
Reference Case
+
+
+ GHG policy+
++ GHG policy
“Plus” Portfolios+

60PageENERGY STRATEGIES © 2018 | LSR Dam Power Replacement Study
Annualized Cost Impact
RESIDENTIAL BILL METRIC
Replacement Portfolio
Change in Levelized Residential Electric Bill
($)($/month/household)
Change in Residential Electric
Bill (%)
Reference Case --- ---
All Gas $1.47 1.4%
All Gas + GHG Policy $1.60 1.6%
NGA $1.16 1.1%
NGA Plus $3.28 3.2%
NGA Plus + GHG Policy $3.37 3.3%
Balanced $1.09 1.1%
Balanced Plus $1.28 1.2%
Balanced Plus + GHG Policy $1.38 1.3%
• Bill impact analysis based on methodology used by NWPCC for 7th Plan Assumes that 47% of total revenue requirement is paid
for by residential customers Kept constant NWPCC projections for total households in
region and assumption that residential share is split equally among the number of forecasted households
Captures effects of incremental conservation
• Relative to total monthly residential bill analysis from the 7th Plan, increases in monthly bill metric for the least costly portfolios are in the 1-3% range, which translates to approximately $1-2 dollars per month per household on a 20-year levelized basis On a non-levelized basis, bill impacts are in the 2-3%
range starting in 2026
• Calculation was also performed on a 30-year levelized basis to capture additional costs beyond 2035 For most portfolios, this increased the levelized average
residential bill by ~0.5%, or roughly $0.43/month
• Bills levelized over 20-year period for comparison with Reference Case and 7th Plan• Assumes NWPCC 4% discount rate• All are 2017 dollars• Reference Case corresponds to NWPCC Existing Policy scenario and captures full system ongoing
costs for 20-years

61PageENERGY STRATEGIES © 2018 | LSR Dam Power Replacement Study
$-
$200
$400
$600
$800
$1,000
$1,200
$1,400
NGA NGA Plus NGA Plus &GHG Policy
Balanced Balanced Plus Balanced Plus& GHG Policy
Total Annual Cost of Replacement Portfolios for Cost Sensitivities ($M/year)
• Evaluates impact of potential capital cost reductions for certain technologies Energy Efficiency reduced 20% relative to Base Case for full
technical achievable potential (high cost conservation) to capture technological advances or new conservation that may bring down the costs of conservation
Wind, solar, and battery storage reduced 20%, 30%, and 40%, respectively, reflecting the relative maturity of the technologies
• Based on these assumptions, the low cost sensitivity has a small effect on total costs except for the NGA Plus alternative NGA Plus included all technically achievable energy
efficiency and when the cost for that conservation was decreased the savings were pronounced (17-18% reduction in total costs)
For the Balanced Portfolio, fixed capital costs made up only a portion of the total costs so 10-20% reductions in capital costs translated to 6-14% of total cost reduction
Annualized Cost Impact
COST SENSITIVITIES Summary of Resource Installed Cost Changes (2026 installation, 2016$)
Resource Type Base Cost Reduction (%) Low Cost Sensitivity
Wind (Montana) $1,639/kW 20% $1,311/kW
Solar, Single-axis Tracking (Idaho) $1,400/kW 30% $980/kW
Li-ion Battery (4-hr) $753/kW 40% $452/kW
Technical Achievable Potential Energy Efficiency $132/MWh 20% $106/MWh
% Reduction from Base CostsReduction due to cost sensitivity
2%
18% 17%
6% 14% 13%
Total Annual Cost

62PageENERGY STRATEGIES © 2018 | LSR Dam Power Replacement Study
6. FINDINGS
63PageENERGY STRATEGIES © 2018 | LSR Dam Power Replacement Study
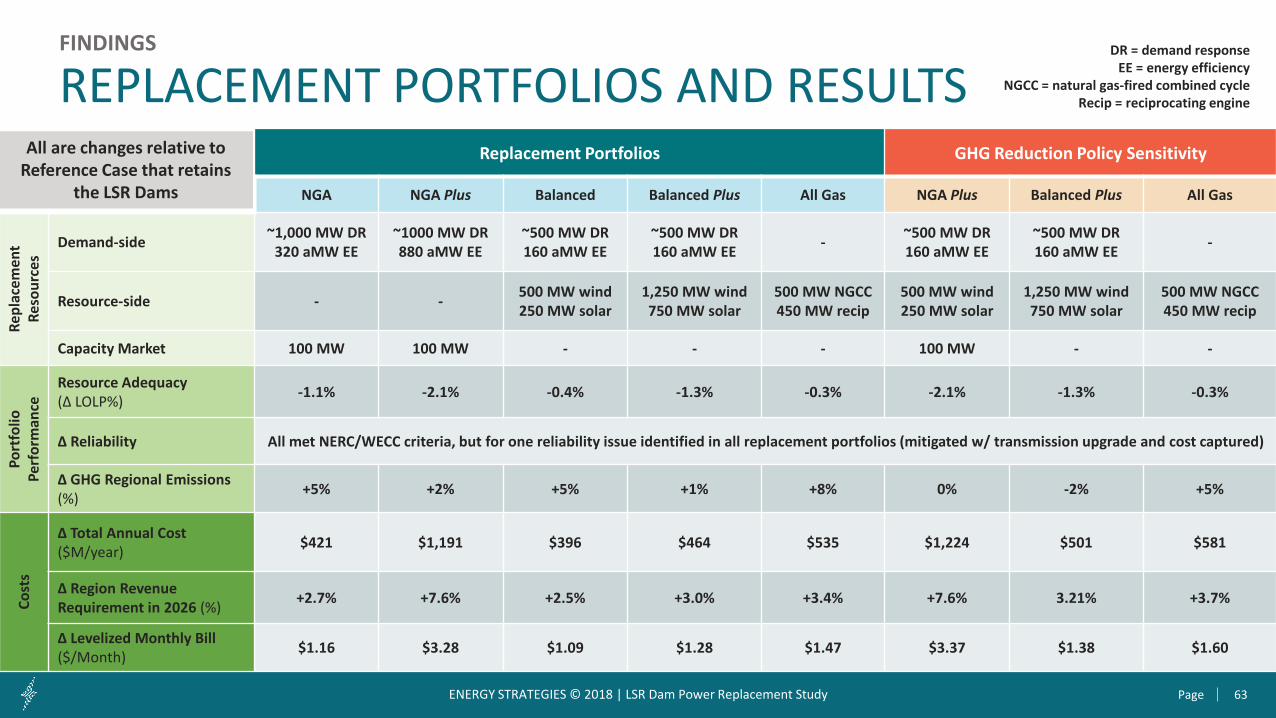
REPLACEMENT PORTFOLIOS AND RESULTSFINDINGS
Replacement Portfolios GHG Reduction Policy Sensitivity
NGA NGA Plus Balanced Balanced Plus All Gas NGA Plus Balanced Plus All Gas
Repl
acem
ent
Reso
urce
s
Demand-side ~1,000 MW DR320 aMW EE
~1000 MW DR880 aMW EE
~500 MW DR160 aMW EE
~500 MW DR160 aMW EE - ~500 MW DR
160 aMW EE~500 MW DR160 aMW EE -
Resource-side - - 500 MW wind250 MW solar
1,250 MW wind750 MW solar
500 MW NGCC450 MW recip
500 MW wind250 MW solar
1,250 MW wind750 MW solar
500 MW NGCC450 MW recip
Capacity Market 100 MW 100 MW - - - 100 MW - -
Port
folio
Pe
rfor
man
ce
Resource Adequacy (Δ LOLP%) -1.1% -2.1% -0.4% -1.3% -0.3% -2.1% -1.3% -0.3%
Δ Reliability All met NERC/WECC criteria, but for one reliability issue identified in all replacement portfolios (mitigated w/ transmission upgrade and cost captured)
Δ GHG Regional Emissions (%) +5% +2% +5% +1% +8% 0% -2% +5%
Cost
s
Δ Total Annual Cost($M/year) $421 $1,191 $396 $464 $535 $1,224 $501 $581
Δ Region Revenue Requirement in 2026 (%) +2.7% +7.6% +2.5% +3.0% +3.4% +7.6% 3.21% +3.7%
Δ Levelized Monthly Bill($/Month) $1.16 $3.28 $1.09 $1.28 $1.47 $3.37 $1.38 $1.60
DR = demand responseEE = energy efficiency
NGCC = natural gas-fired combined cycleRecip = reciprocating engine
All are changes relative to Reference Case that retains
the LSR Dams
64PageENERGY STRATEGIES © 2018 | LSR Dam Power Replacement Study
Can an energy portfolio replace the LSR Dams while minimizing or eliminating increases to regional carbon emissions?
How might these replacement portfolios change under different future scenarios?
FINDINGS
CORE QUESTIONS
• Yes – a portfolio of clean energy resources, including solar, wind, energy efficiency, demand response, and energy storage, can effectively replace the most critical power attributes the four LSR Dams contribute to the Northwest region. Clean resources required for this replacement, such as energy efficiency and renewable power, are or will be reasonably available within the region.
• When a balanced portfolio is implemented in conjunction with greenhouse gas reduction policy, substantial reductions in emissions can be achieved without the LSR Dams. GHG policy-driven reductions of emissions are much larger, in proportion, to LSR Dam emission impacts. Given the cost-effectiveness of the carbon policy in reducing carbon emissions, an optimal replacement strategy may rely less (or not fully) on resource-specific
replacements and more on broad policy measures to mitigate against carbon emissions – such a strategy could reduce costs of replacement.
• Absent such policy, the balanced portfolio has a minor impact on GHG emissions (about 1%) compared to expected emissions with the LSR Dams in service. Did not study cost of reducing emissions impact below 1%, but analysis indicates it is feasible even absent GHG policy
65PageENERGY STRATEGIES © 2018 | LSR Dam Power Replacement Study
If replacement portfolios of energy storage, renewable resources, and clean market purchases cannot (alone) replace the LSR Dams, what incremental infrastructure (e.g. additional transmission, substation equipment, gas-fired resources) might be required to fill the gap?
FINDINGS
CORE QUESTIONS
• The reliability analysis revealed one reliability issue that was mitigated at a relatively low cost compared to the total cost of the replacement portfolio. Based on the scope, this was the only infrastructure (beyond the portfolios themselves) that would be required. Issued was identified in All Gas portfolio as well. After addressing the issue, the clean replacement portfolios met reliability criteria under peak summer and winter conditions and did not
create any new reliability issues.
• Gas-fired generation is not required to address regional capacity needs that arise when the LSR Dams are removed.
66PageENERGY STRATEGIES © 2018 | LSR Dam Power Replacement Study
At what approximate cost to Northwestern residential ratepayers might the replacement portfolios be achieved?
FINDINGS
CORE QUESTIONS
• The total costs of the clean energy replacement portfolios, particularly the balanced portfolios that include both new wind/solar and demand-side measures, are relatively small compared to the total projected costs of the Northwest power system. Implementing the replacement portfolios results in system cost increases, starting in 2026, on the order of 2-3%, accounting for the cost of
the incremental resources/programs, the change in cost of system operation (including increased market purchases), and the cost of any new transmission to address minor reliability issues
• Compared to business-as-usual, on a levelized basis the impact of implementing the portfolios studied translates to a roughly $1-2 dollar increase to the month bill metric calculated for a typical residential customer in the Northwest Bill metric increases 2-3% from forecasted Reference Case levels starting in 2026
• Reductions in the cost of technologies like wind, solar, and conservation would decrease these costs
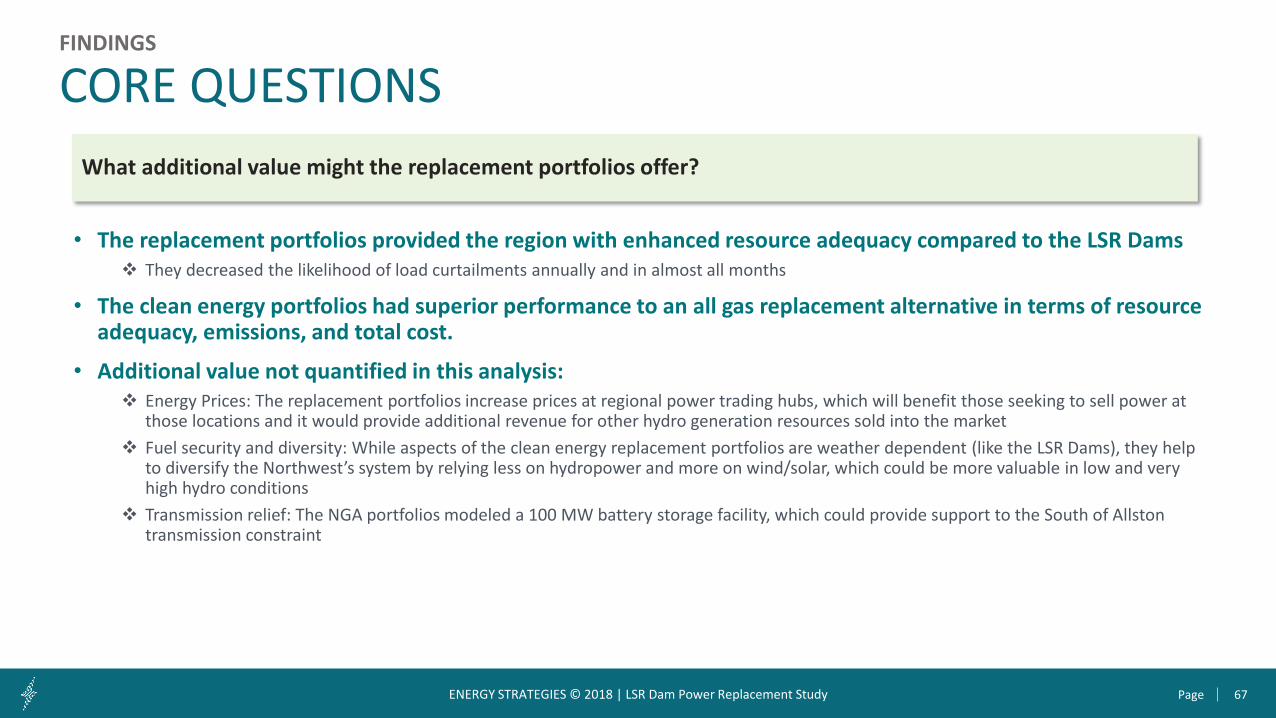
67PageENERGY STRATEGIES © 2018 | LSR Dam Power Replacement Study
What additional value might the replacement portfolios offer?
FINDINGS
CORE QUESTIONS
• The replacement portfolios provided the region with enhanced resource adequacy compared to the LSR Dams They decreased the likelihood of load curtailments annually and in almost all months
• The clean energy portfolios had superior performance to an all gas replacement alternative in terms of resource adequacy, emissions, and total cost.
• Additional value not quantified in this analysis: Energy Prices: The replacement portfolios increase prices at regional power trading hubs, which will benefit those seeking to sell power at
those locations and it would provide additional revenue for other hydro generation resources sold into the market Fuel security and diversity: While aspects of the clean energy replacement portfolios are weather dependent (like the LSR Dams), they help
to diversify the Northwest’s system by relying less on hydropower and more on wind/solar, which could be more valuable in low and very high hydro conditions
Transmission relief: The NGA portfolios modeled a 100 MW battery storage facility, which could provide support to the South of Allston transmission constraint
68PageENERGY STRATEGIES © 2018 | LSR Dam Power Replacement Study
• Identifying the most cost effective, environmentally efficient, and robust/adequate replacement portfolio will require scenario-based optimization studies. An effort to do so by the region may lead to a more cost effective and environmentally efficient outcome than the portfolios considered in this analysis.
• Future studies should gather and incorporate detailed cost estimates surrounding planned, long-term capital and maintenance costs that could be avoided if the dams were removed and replaced, the cost of fish programs that could potentially be avoided, as well as any incremental costs required to breach the dams.
• The region should consider the issue in combination with other evolving policy, climate, and economic factors.
• The impacts of decarbonization policy needs additional investigation – an optimal portfolio may be partly made up of physical resources and GHG reduction policy.
• The study used conservative assumptions with regards to resource adequacy and capital costs and relaxing these assumptions should be considered.
• The study did not consider the impacts of high renewable penetration levels in neighboring regions, such as California, nor did it consider the implications of changes to natural gas prices, load forecast, and other key variables.
• The residential bill analysis was done at a regional level and more granular impacts should be considered
• An assessment to evaluate the impact, if any, that the removal and replacement of the LSR Dams might have on path transfer capabilities would be important to identify.
FINDINGS
AREAS OF ADDITIONAL STUDY AND CONSIDERATION
69PageENERGY STRATEGIES © 2018 | LSR Dam Power Replacement Study
• The following organizations generously provided data, modeling tools and/or feedback on preliminary study results and the authors of this report very much appreciate their efforts:Northwest Power and Conservation CouncilColumbiaGrid (and its members)
• These organization have not, however, participated in the project and their role in providing data, tools, or review is not an endorsement or support of the project and/or its findings
• Additionally, the NW Energy Coalition and its partner organizations provided valued input in establishing the scope of the assessment and in reviewing the final results
FINDINGS
ACKNOWLEDGEMENTS
70PageENERGY STRATEGIES © 2018 | LSR Dam Power Replacement Study 70Page© 2017 ENERGY STRATEGIES. All rights reserved
THANK YOU215 South State Street, Suite 200Salt Lake City, Utah 84111
(801) 355-4365
Contact
energystrat.com
Project TeamKeegan Moyer, Principal Ben Brownlee, Consulting Engineer Kathleen Fraser, Senior ConsultantDaniel Ramirez, ConsultantGordon Comegys, CPS (subcontract)

71PageENERGY STRATEGIES © 2018 | LSR Dam Power Replacement Study 71Page© 2017 ENERGY STRATEGIES. All rights reserved
TECHNICAL APPENDIXAdditional technical materials
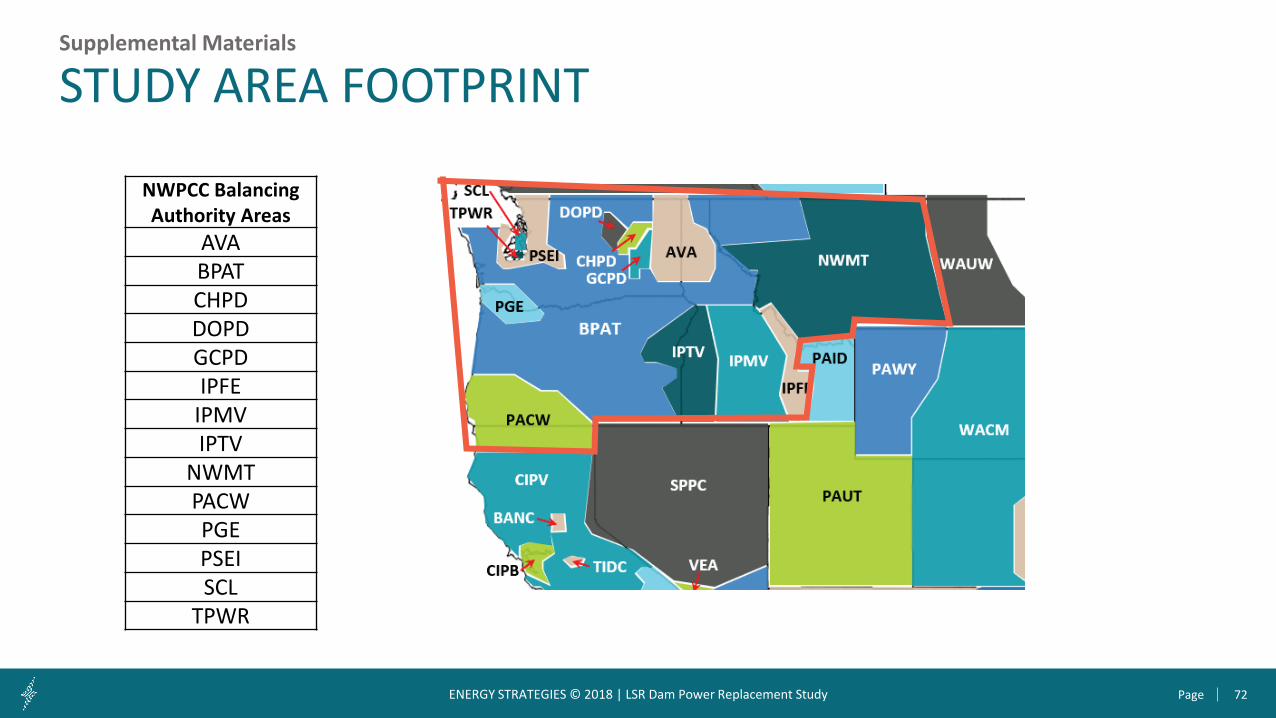
72PageENERGY STRATEGIES © 2018 | LSR Dam Power Replacement Study
Supplemental Materials
STUDY AREA FOOTPRINT
NWPCC Balancing Authority Areas
AVABPATCHPDDOPDGCPDIPFE
IPMVIPTV
NWMTPACWPGEPSEISCL
TPWR

73PageENERGY STRATEGIES © 2018 | LSR Dam Power Replacement Study
Supplemental Materials
RELIABILITY ANALYSIS KEY ASSUMPTIONS (CONT.)Summer Case Dispatch/Flow Totals (MW) – Pacific Northwest Region
Base Case Reference Case NGA NGA Plus Balanced Balanced Plus All Gas Scenario
LSR Hydro 2,291 1,497 - - - - -
Non-LSR Hydro 21,424 21,793 21,693 21,788 21,737 21,683 21,873
Thermal 5,892 6,212 6,212 5,672 7,022 5,334 6,682
Canada->NW 2,296 2,296 2,296 2,296 2,296 2,296 2,296
PDCI N->S Flow 1,240 1,240 1,240 1,240 1,240 1,240 1,240
COI N->S Flow 2,678 2,711 2,648 2,634 2,653 2,568 2,715
New Thermal - - - - - - 958
New DR - - 971 1,715 486 486 -
New EE - - 425 425 212 212 -
New Battery - - 100 100 - - -
New Wind - - - - 500 1,250 -
New Solar - - - - 250 750 -
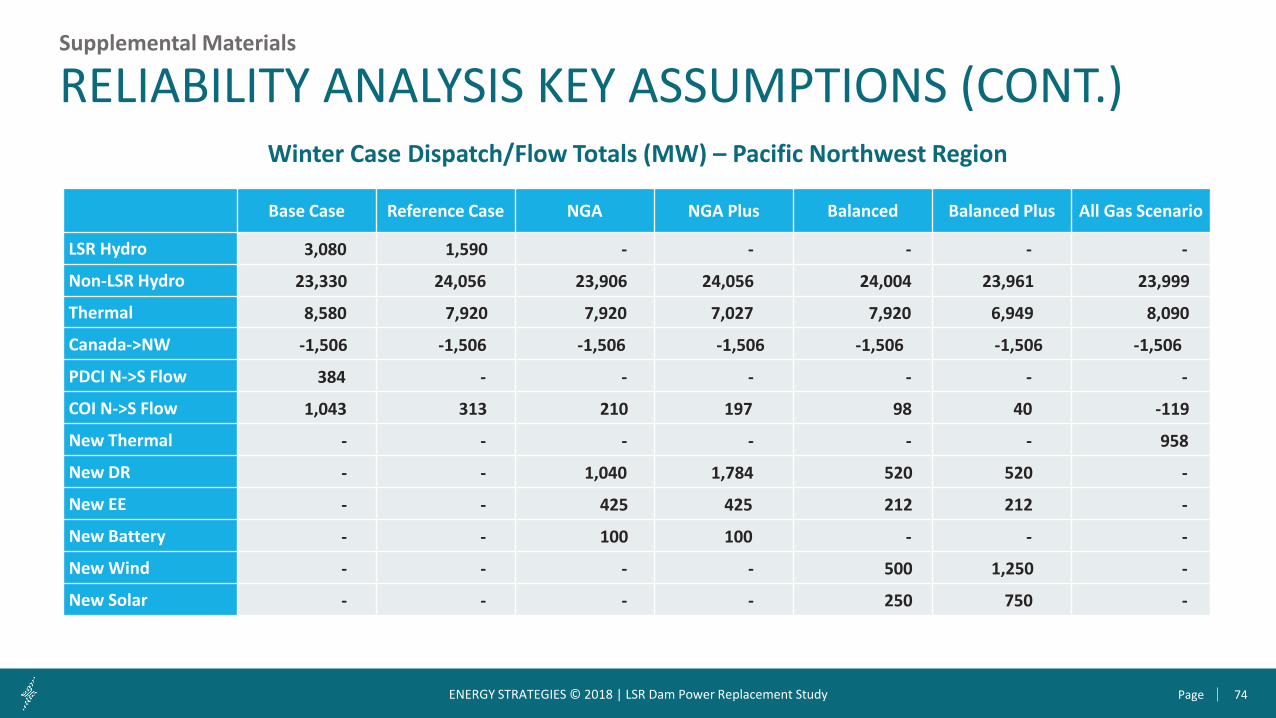
74PageENERGY STRATEGIES © 2018 | LSR Dam Power Replacement Study
Supplemental Materials
RELIABILITY ANALYSIS KEY ASSUMPTIONS (CONT.)Winter Case Dispatch/Flow Totals (MW) – Pacific Northwest Region
Base Case Reference Case NGA NGA Plus Balanced Balanced Plus All Gas Scenario
LSR Hydro 3,080 1,590 - - - - -
Non-LSR Hydro 23,330 24,056 23,906 24,056 24,004 23,961 23,999
Thermal 8,580 7,920 7,920 7,027 7,920 6,949 8,090
Canada->NW -1,506 -1,506 -1,506 -1,506 -1,506 -1,506 -1,506
PDCI N->S Flow 384 - - - - - -
COI N->S Flow 1,043 313 210 197 98 40 -119
New Thermal - - - - - - 958
New DR - - 1,040 1,784 520 520 -
New EE - - 425 425 212 212 -
New Battery - - 100 100 - - -
New Wind - - - - 500 1,250 -
New Solar - - - - 250 750 -
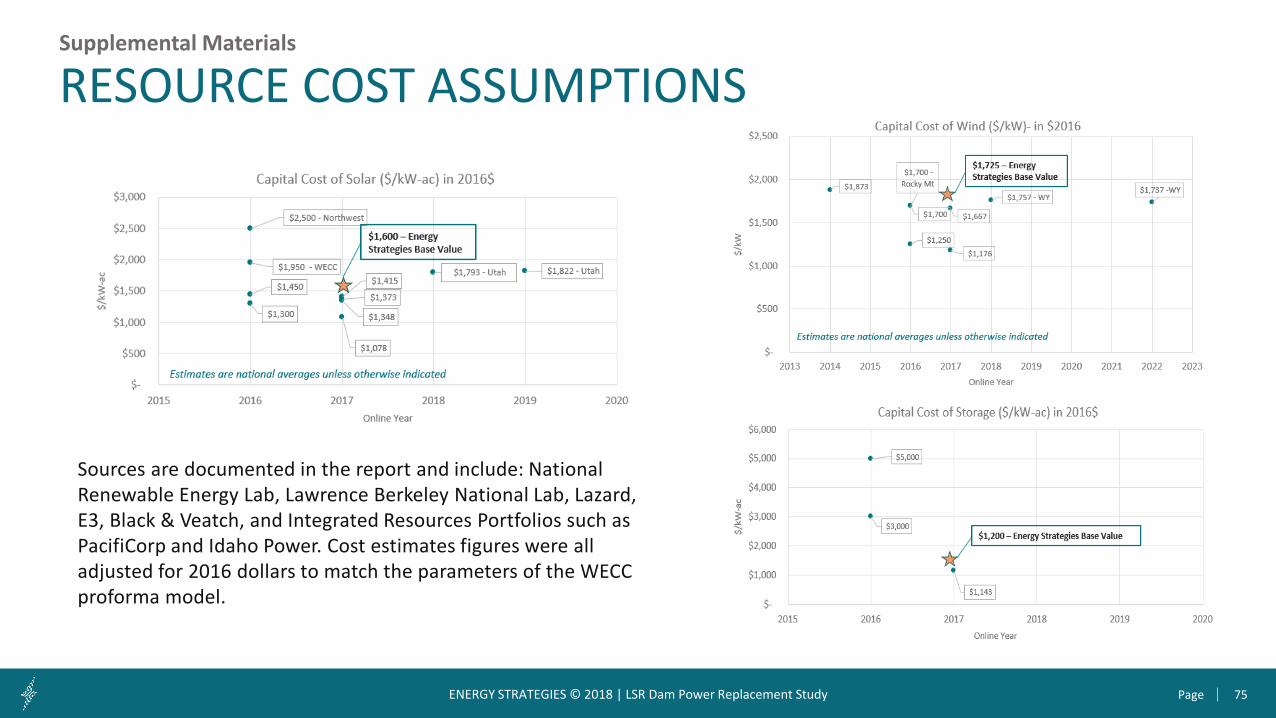
75PageENERGY STRATEGIES © 2018 | LSR Dam Power Replacement Study
Supplemental Materials
RESOURCE COST ASSUMPTIONS
Sources are documented in the report and include: National Renewable Energy Lab, Lawrence Berkeley National Lab, Lazard, E3, Black & Veatch, and Integrated Resources Portfolios such as PacifiCorp and Idaho Power. Cost estimates figures were all adjusted for 2016 dollars to match the parameters of the WECC proforma model.