lower pioneer valley educational …lpvec-org.lpvctec.org/wp-content/uploads/lpvec-fy2015...lower...
TRANSCRIPT

LOWER PIONEER VALLEY EDUCATIONAL COLLABORATIVE
WEST SPRINGFIELD, MASSACHUSETTS
COMPREHENSIVE ANNUAL FINANCIAL REPORT
For the Year Ended June 30, 2015

Lower Pioneer Valley Educational Collaborative
West Springfield, Massachusetts
Comprehensive Annual
Financial Report
For the Year July 1, 2014 through June 30, 2015
Prepared by the Finance Department

LOWER PIONEER VALLEY EDUCATIONAL COLLABORATIVE
COMPREHENSIVE ANNUAL FINANCIAL REPORT
JUNE 30, 2015
TABLE OF CONTENTS
Introductory Section ................................................................................................................................... 1 Letter of Transmittal ..................................................................................................................................................... 3
Organizational Chart .................................................................................................................................................. 10
Principal Executive Officers and Board of Directors .................................................................................................. 11
Mission, Vision, and Values ....................................................................................................................................... 12
Certificate of Achievement for Excellence in Financial Reporting ............................................................................. 13
Distinguished Budget Presentation Award ................................................................................................................ 14
Meritorious Budget Award .......................................................................................................................................... 15
Financial Section ...................................................................................................................................... 17 Independent Auditor’s Report .................................................................................................................................... 19
Management’s Discussion and Analysis ................................................................................................................... 21
Basic Financial Statements ........................................................................................................................................ 28
Statement of net position ........................................................................................................................................ 29
Statement of activities ............................................................................................................................................ 30
Governmental funds – balance sheet .................................................................................................................... 32
Reconciliation of the governmental funds balance sheet total fund balances to the statement of net position ..... 33
Governmental funds – statement of revenues, expenditures, and changes in fund balances .............................. 34
Reconciliation of the statement of revenues, expenditures, and changes in fund balances of governmental
funds to the statement of activities ......................................................................................................................... 35
Proprietary funds – statement of net position ......................................................................................................... 36
Proprietary funds – statement of revenues, expenses and changes in net position .............................................. 37
Proprietary funds – statement of cash flows .......................................................................................................... 38
Fiduciary funds – statement of fiduciary net position ............................................................................................. 39
Fiduciary funds – statement of changes in fiduciary net position ........................................................................... 40
Notes to basic financial statements ........................................................................................................................ 41
Required Supplementary Information ........................................................................................................................ 65
Schedule of revenues, expenditures and changes in fund balance – general fund – budget and actual .............. 66
Collaborative pension plan schedules .................................................................................................................... 70
Schedule of Collaborative’s contributions ........................................................................................................... 71

Schedule of the special funding amounts of the net pension liability of the Massachusetts State Employees
Retirement System ............................................................................................................................................. 72
Schedule of the special funding amounts of the net pension liability of the Massachusetts Teacher’s
Retirement System ............................................................................................................................................. 73
Other postemployment benefits plan schedules .................................................................................................... 74
Other postemployment benefit plan funding progress and employer contributions ........................................... 75
Other postemployment benefit plan actuarial methods and assumptions .......................................................... 76
Notes to required supplementary information ........................................................................................................ 77
Other Supplementary Information .............................................................................................................................. 79
Combining and Individual Fund Statements .......................................................................................................... 81
Nonmajor governmental funds ........................................................................................................................... 82
This page intentionally left blank. .................................................................................................................... 83
Nonmajor governmental funds – combining balance sheet ............................................................................ 84
Nonmajor governmental funds – combining statement of revenues, expenditures, and changes in fund
balances .......................................................................................................................................................... 86
Agency Fund .......................................................................................................................................................... 88
Agency fund – statement of changes in assets and liabilities ............................................................................ 89
Statistical Section ..................................................................................................................................... 91 Net position by component – last ten years ............................................................................................................... 92
Changes in net position – last ten years .................................................................................................................... 93
Fund balances, governmental funds – last ten years ................................................................................................ 94
Changes in fund balances, governmental funds – last ten years .............................................................................. 95
Revenue by member communities – current year and nine years ago ..................................................................... 96
Principal employers – current year and nine years ago ............................................................................................ 97
Ratios of outstanding debt – last ten years ................................................................................................................ 98
Demographic and economic statistics – last ten years .............................................................................................. 99
Full-time equivalent employees by function – last ten years ................................................................................... 100
Operating indicators by function/program – last six years ....................................................................................... 101
Capital asset statistics ............................................................................................................................................. 102
Schedule of Cumulative Surplus and Required Disclosures for Massachusetts Educational Collaboratives ......................................................................................................................................... 103
Schedule of Cumulative Surplus .............................................................................................................................. 104
Required Disclosures for Massachusetts Educational Collaboratives ..................................................................... 105

Introductory Section
The Lower Pioneer Valley Early Education and Care program.

Lower Pioneer Valley Educational Collaborative 1 Comprehensive Annual Financial Report
Introductory Section

Lower Pioneer Valley Educational Collaborative 2 Comprehensive Annual Financial Report
This page intentionally left blank.

Lower Pioneer Valley Educational Collaborative 3 Comprehensive Annual Financial Report
Letter of Transmittal November 18, 2015 State law requires the Lower Pioneer Valley Educational Collaborative to publish at the close of each year a complete set of financial statements in conformity with accounting principles generally accepted in the United States of America (GAAP) that are audited in accordance with generally accepted auditing standards by a firm of licensed certified public accountants. Pursuant to that requirement, we hereby issue the Comprehensive Annual Financial Report (CAFR) of the Lower Pioneer Valley Educational Collaborative, for the year ending June 30, 2015 for your review. The report is designed to be used by the Board of Directors of the Collaborative and others who are concerned with its management and progress such as bond analysts, banking institutions and credit raters as well as residents of the Collaborative’s member school districts. This report consists of management’s representations concerning the finances of the Lower Pioneer Valley Educational Collaborative. Consequently, management assumes full responsibility for the completeness and reliability of all of the information presented in this report. As management, we assert that, to the best of our knowledge and belief, this financial report is complete and reliable in all material respects. Management of the Collaborative is responsible for establishing and maintaining an internal control structure designed to ensure the assets of the Collaborative are protected from loss, theft or misuse and to ensure that adequate accounting data is compiled to allow for the preparation of financial statements in conformity with generally accepted accounting principles. The Executive Director is responsible for evaluating the adequacy and effectiveness of the internal control structure and implementing improvements. Because the cost of internal controls should not outweigh their benefits, the Lower Pioneer Valley Educational Collaborative’s comprehensive framework of internal controls has been designed to provide reasonable rather than absolute assurance that the financial statements will be free from material misstatement. The Lower Pioneer Valley Educational Collaborative’s financial statements have been audited by Powers & Sullivan, LLC, a firm of licensed certified public accountants. The goal of the independent audit was to provide reasonable assurance that the financial statements of the Lower Pioneer Valley Educational Collaborative for the year ended June 30, 2015, are free of material misstatement. The independent audit involved examining, on a test basis, evidence supporting the amounts and disclosures in the financial statements; assessing the accounting principles used and significant estimates made by management; and evaluating the overall financial statement presentation. The independent auditor concluded, based upon the audit, that there was a reasonable basis for rendering an unmodified opinion that the Lower Pioneer Valley Educational Collaborative’s financial statements for the year ended June 30, 2015, are fairly presented in conformity with GAAP. The independent auditor’s report is presented as the first component of the financial section of this report. Generally accepted accounting principles (GAAP) require that management’s discussion and analysis (MD&A) provide a narrative introduction, overview and analysis to accompany the basic financial statements. This letter of transmittal is designed to complement the MD&A where the financial analysis is presented. The Collaborative’s MD&A can be found immediately following the independent auditor's report from Powers & Sullivan, LLC.

Lower Pioneer Valley Educational Collaborative 4 Comprehensive Annual Financial Report
PROFILE OF THE COLLABORATIVE The Collaborative is an educational service agency in Western Massachusetts. Educational service agencies are organizations created by special state legislation or administrative rule to provide programs and services to local school districts, or to serve state interests in other ways. The Collaborative meets the descriptive criteria set forth in the Association of School Business Official’s International’s publication Standards of Excellence in Budget Presentation for a primary governmental entity. These criteria include:
• Members of the governing board are selected from school committee members chosen in a general election;
• The organization functions as a separate legal entity; and • The entity is fiscally independent.
The Lower Pioneer Valley Educational Corporation is a tax-exempt 501C (3) nonprofit corporation and a component unit of the Collaborative. In order to distinguish the two entities, the term Collaborative is used to describe the educational entity. Seven school districts hold membership in the Collaborative: Agawam, East Longmeadow, Hampden-Wilbraham Regional School District, Longmeadow, Ludlow, Southwick-Tolland-Granville Regional School District, and West Springfield. In addition to serving its member districts, the Collaborative provides services to school districts and municipalities throughout Western Massachusetts. The Massachusetts legislature passed, and the governor signed into law Chapter 49 Section 4e in 1974. This act encouraged local school committees to conduct, in concert, educational programs and services to supplement or strengthen existing school programs and services. On March 2, 2012 Governor Patrick signed into law Chapter 43 of the Acts of 2012, An Act Relative to Improving Accountability and Oversight of Education Collaboratives. Subsequently, the Massachusetts Board of Education adopted a policy on Educational Collaboratives. In the most recent policy statement, the Board of Education reiterated its belief “that educational collaboratives have a potential beyond special education to increase and expand the level of service in regular education, occupational education, staff development, research and innovative programs.” Every fall, program administrators and department heads of the Collaborative develop a general fund budget for the coming school year which is voted on annually by the Board. Throughout the winter months, the executive director and director of finance meet regularly with the Board to review the annually proposed budget, elicit feedback, and make revisions based on new information. The legal level of budgetary control is established by the Board and this approval defines the level at which expenditures may not exceed appropriations. This level is at the department level, i.e.; administration, special education, occupational education, and professional development. While estimates for supplemental services are voted as part of the general fund budget, these services are billed directly to the users; therefore, expenditures may exceed the voted budget, however, they are offset by matching revenues. Transfers between departments must be voted by the Board. Level of Education Provided The Collaborative serves a general population of 21,636 students in seven member communities. Enrollment in Career and Technical Education (CTEC) programs at the secondary level has remained constant at approximately 472 from 2010 to 2015. Enrollment in special education programs for students in elementary, secondary, and transition programs is 147. The Collaborative offers educational programs for a wide range of learners at the elementary and secondary levels. Educational programs at the Collaborative focus on Career and Technical Education and Special Education. The Career and Technical Education Center offers Chapter 74 approved career and technical education programs including a cooperative education program. Special education programs include program for students with various learning differences including students on the Autism spectrum, students with multiple and significant disabilities, student with specific learning disabilities, and students with emotional and behavior disorders. The special education department also provides nursing services and adaptive physical education services. Within its special education department, the Collaborative

Lower Pioneer Valley Educational Collaborative 5 Comprehensive Annual Financial Report
administers an Innovation School – the 21st Century Skills Academy – on behalf of West Springfield. Career and technical programs and the 21st Century Skills Academy are located at the Career and Technical Education Center in West Springfield. The special education programs reside in various schools and buildings throughout its member communities. Geographic Area Served The Collaborative is located in Western Massachusetts. Although the Collaborative is comprised of seven member districts, the Collaborative serves students throughout public school districts in Hampden and Hampshire Counties. The Collaborative provides business and professional development services to municipalities and local education agencies in Franklin, Berkshire, Hampshire, and Hampden Counties. The map below delineates the geographic area of the Collaborative member districts:
Member Communities:
Agawam: K-12 district serving 4,104 students East Longmeadow: PreK-12 district serving 2,699 students Hampden-Wilbraham Regional School District: PreK-12 district serving 3,346 students Longmeadow: PreK-12 district serving 2,857 students Ludlow: PreK-12 district serving 2,802 students Southwick-Tolland-Granville Regional School District: PreK-12 district serving 1,709 students West Springfield: PreK-12 district serving 3,899 students
Collaborative Programs The Collaborative offers programs and services in the following general areas: Career and Technical Education Program – The Lower Pioneer Valley Career and Technical Education Center (LPV CTEC), located in West Springfield, MA, is an extension of the seven member high schools served by the Collaborative providing career/vocational technical education programs for students. LPV CTEC programs are recognized career pathways as defined by the Carl D. Perkins Vocational and Applied Technology Act of 1990 and 1998 and reauthorized in 2006. Founded in 1974, LPV CETEC has a long tradition of partnering with local businesses and industry to ensure that students receive rigorous and relevant training aligned with the Massachusetts Department of Elementary & Secondary Education’s (DESE) Vocational Technical Education Frameworks, industry standards, and regional employment needs. Since 2006, LPV CTEC has operated out of its new facility in West Springfield, with state-of-the-art equipment and technology that meets or exceeds industry and OSHA standards.

Lower Pioneer Valley Educational Collaborative 6 Comprehensive Annual Financial Report
Students completing a career/vocational technical program have the opportunity to continue formal studies at the post-secondary level, secure gainful employment, or pursue a combination of both. Programs at the Career and Technical Education Center include:
• Automotive Technology: Automotive Technology is a Chapter 74 approved program certified by the National Automotive Technicians Education Foundation (NATEF) in the following areas: brakes, electrical/electronic systems, engine performance and suspension and steering. Students are assessed on competencies aligned with the Massachusetts Department of Education Vocational Technical Education Framework – Transportation Cluster – Automotive Technology and the National Institute for Automotive Service Excellence (ASE). The NATEF curriculum prepares students to meet national automotive industry standards and requires students to become proficient in a multitude of automotive procedures and diagnostic techniques.
• Carpentry: The Carpentry program is a Chapter 74 approved course of study offering a comprehensive competency based on curriculum aligned with the Massachusetts Department of Education Vocational Technical Education Frameworks – Construction Cluster – Carpentry. First year students focus in the classroom and shop developing basic carpentry-related skills.
• Cosmetology: Cosmetology, a Chapter 74 approved program, is a comprehensive competency based three-year program designed to develop skills used by cosmetologists. The Cosmetology program is certified by the Commonwealth of Massachusetts Board of Registration of Cosmetologists.
• Culinary Arts: The Culinary Arts program is a competency based Chapter 74 approved program certified by the American Culinary Federation (ACF) and is aligned with the Massachusetts Department of Education Vocational Technical Education Frameworks – Hospitality and Tourism Cluster – Culinary Arts, which prepares students for careers in hotels, restaurants, resorts, institutions, and corporations.
• Design and Visual Communications: The Design and Visual Communications program is a Chapter 74 approved program that is competency based and prepares students for the visual design field and is aligned with the Massachusetts Department of Education Vocational Technical Education Frameworks – Arts and Communication Service Cluster – Design and Visual Communications.
• Facilities Management: Facilities Management, a Chapter 74 approved program, is a competency based program designed to introduce students to the many facets of facilities maintenance: interior, exterior, and seasonal grounds and lawn care. The curriculum is aligned with the Massachusetts Department of Education Vocational Technical Education Frameworks – Construction Cluster – Facilities Management.
• Fashion Technology: The Fashion Technology program is a competency based Chapter 74 approved program aligned with the Massachusetts Department of Education Vocational Technical Education Frameworks – Business and Consumer Services Cluster – Fashion Technology.
• Graphic Communication: The Graphic Communications program is a competency based Chapter 74 approved program aligned with the Massachusetts Department of Education Vocational Technical Education Frameworks – Arts and Communication Services Cluster – Graphic Communication that prepares students for a wide range of career opportunities in the graphic arts and communications industry. The program is certified by PrintED®, a national accreditation program.
• Health Assisting: The Health Assisting program is a comprehensive competency based program aligned with the Massachusetts Department of Education Vocational Technical Education Framework – Health Services Cluster – Health Assisting.
• Information Support Services and Networking: The Information Support Services and Networking program, a Chapter 74 approved program, is a competency based program designed to provide students with entry level skills in personal computer maintenance and repair, data communications and networking. The curriculum is aligned with the Massachusetts Department of Education Vocational Technical Education Frameworks – Information Technology Services Cluster – Information Support Services and Networking.
• Landscaping Technology Horticulture: The Landscaping Technology/Horticulture program is a Chapter 74 approved program aligned with the Massachusetts Department of Education Vocational Technical Education Frameworks – Agriculture and Natural Resources Cluster – Horticulture that offers a comprehensive competency based course that explores career areas in landscaping maintenance,
Lower Pioneer Valley Educational Collaborative 7 Comprehensive Annual Financial Report
construction and design, greenhouse production, nursery production, floriculture, and retail garden center operations.
• Technical Career Exploratory: The Technical Career Exploratory is an introductory program designed to introduce ninth grade students to the career/vocational technical educational options available at the Lower Pioneer Valley Career and Technical Education Center (Career TEC).
• Cooperative Education Program: The Cooperation Education (CO-OP) Program at LPV Career TEC is designed to give second year students the opportunity to extend their learning experiences into the world of work, whereby students are placed into a paid position during shop hours.
• Early Education and Care Program – The Early Education and Care (EEC) program is new to the Collaborative in 2015. Students in this program will experience a combination of classroom instruction and hands on experience with children from ages 6 weeks through 6 years of age. Students will also understand and be familiar with many aspects of child development from infancy through elementary school years. The students who are in the EEC program use the Early Learning Center as their work-related experience to receive licensure as an Early Education and Care provider. The Early Learning Center is a part of the Collaborative, and is licensed by the Massachusetts Department of Early Education and Care.
Special Education Program - The LPVEC provides services to students aged 5 to 22 years who demonstrate a wide variety of exceptional learning needs including adjustment and behavioral problems, learning disabilities, Autism, Pervasive Developmental Disabilities, Asperger’s Syndrome, and developmental disabilities. Students are referred to the LPVEC for services when they present needs for specially designed instruction that cannot be delivered effectively within the traditional classroom. On October 1, 2014, there were 128 special needs students in LPVEC Special Education programs. The Twain Alternative High School, Transitional Alternative Program, and Transitional Services Program, by design, are located in separate buildings. All other LPVEC special education programs are appropriately located within the public schools of the member school districts. Supplemental Services – In addition to education programs, the Collaborative offers and coordinates a variety of education related services including:
• School Transportation Services: The LPVEC has provided school transportation services to all of its member school districts. These services include both regular as well as special needs transportation. The LPVEC employs and manages approximately 280 drivers and monitors and operates 209 school transportation vehicles. The cost of providing these transportation services through the LPVEC has resulted in cost savings for member districts. In addition, because of the relationship of the LPVEC to its member school districts, the LPVEC is highly responsive to the needs of its members.
• Staff/Professional Development: The LPVEC is committed to providing ongoing professional development services to its staff. Through annual “in service” days, the LPVEC provides resources necessary for individual, as well as small group investigation and research projects. In addition, the LPVEC is also committed to broadening the availability of professional development services to the member school districts. LPVEC coordinates professional development for its member districts on several topics including sheltered English immersion instruction, integrating technology and curriculum, new literacies, Common Core standards, social cognition training, Indicator 13 training and transition services, creating formative and summative assessments using Assistments, learning walk‐throughs, implementing the Massachusetts new educator evaluation regulations, and Lindamood Bell training. In 2015, Innovative Research in Education (IRIE) will focus on providing technical assistance to local school districts receiving Race to the Top funding and the development and implementation of online learning opportunities for students in alternative education settings. The staff and professional development program including the IRIE component is a cost center within the function of contracted services in the budget.
• Municipal Medicaid Reimbursement: The LPVEC Medicaid Reimbursement Program currently provides electronic billing services to 45 area school districts and municipalities. This project typically generates an annual revenue approaching $6 million of federal Medicaid funds to the participating districts. Due to the level of non‐member participation, the cost of these services is significantly less to the LPVEC member districts.

Lower Pioneer Valley Educational Collaborative 8 Comprehensive Annual Financial Report
• Energy Management Services: The LPVEC Energy Management Program currently provides for the aggregate bidding and purchasing of a variety of energy‐related utilities; including electricity, natural gas, fuel oil, diesel fuel and gasoline. Through joint purchasing, the participating municipalities and school districts are able to lock in fixed prices which usually save from 5 to 15% of their current cost for utilities and offer certainty in a volatile energy price environment. There are currently 75 school districts and municipalities participating in this project. Total energy purchases in FY2015 were approximately $25.2 million.
• Grant Writing and Special Projects: The Collaborative remains committed to assisting its member school districts in whatever way practical. As such, the Collaborative routinely applies for and conducts special projects for its member school districts and municipalities. In FY2015, the LPVEC plans to pursue grants to support program expansion in vocational-technical education. We will also actively seek out grant opportunities that support regional collaboration.
INFORMATION USEFUL IN ASSESSING THE COLLABORATIVE’S ECONOMIC CONDITION The mission of the Lower Pioneer Valley Educational Collaborative is to improve efficiency, effectiveness, and equity in public education. Although the Collaborative is an independent entity, it is governed by its members. Consequently, the Collaborative staff defines its purpose as providing programs, activities, or services that help school districts in the region to be more effective. Its mission is to serve the educational needs of students throughout the region, not just in its programs. To that end, much of the LPVEC’s work supports the work of the school districts in the region. Each year the Collaborative adopts goals in order to guide decision-making and evaluate expenditures. The LPVEC allocates resources in alignment with its stated goals. The budget reflects the allocation of revenue and expenditures to support educational programs and services defined by the Collaborative’s mission and goals. The budget also represents a careful analysis of the needs of LPVEC communities and available financial support. In FY12, the Collaborative purchased approximately $2.1 million of passenger buses to be used for transportation for its enrolled students. The purchase was paid for out of the Collaborative’s transportation enterprise fund. The Collaborative anticipates a useful life on the assets of approximately 10 years. The year 2015 budget adopted by the Board of Directors is $22,168,547. This amount represents a $202,956 or a 0.91% decrease from the FY14 amended budget. The FY15 budget includes the addition of two new programs, the Early Education and Care program and the Autism Elementary program. In addition, the budget reflects the closing of three special education programs which are: the Alternative High School program, the Elementary Developmental program, and the Prevocational Preparation program. Additional changes to the operation budget worth noting are the integration of administration into the Special Education and Vocational Technical Education cost centers. Regular and Special Needs Transportation – The 0.36% increase in transportation is primarily due to a projected increase in driver wages and benefits based on actual FY14 expenses at the time of building the budget.
Contracted Services Individual Aides – The 27.22% increase in individual aide expenses is based on actual utilization of individual aides in FY14 at the time the FY15 budget is built. Districts will only incur these expenses if they utilize the service. Contracted service budgets are provided as an estimate to assist member districts in building their own budgets.
Contracted Services IRIE – We have included the total amount of the IRIE budget under contracted services and excluded any grant funding. Although we anticipate receiving grant funding to support the program, the exact amount of grant funds has not been confirmed. Districts do not pay for IRIE services unless they utilize the services. Districts have agreed to support the program with money reserved in fund balance for the program in the event that the program receives insufficient grant funding.

Lower Pioneer Valley Educational Collaborative 9 Comprehensive Annual Financial Report
The most significant decrease in the FY15 budget is in the Contracted Services IRIE cost center. The LPVEC reduced one FTE in this cost center due to a decrease in demand for support services.
Providing high quality educational programs and services, as well as technical support and assistance to our member districts, requires a highly skilled labor force. The costs associated with recruiting and retaining qualified personnel are reflected in the budget. Personnel decisions reflect staffing policies and guidelines set forth by the Board of Directors on the basis of state requirements, program reviews, student enrollment, and curriculum requirements. Salary costs and increases are based on the average salaries and increases in LPVEC member districts. The Executive Director collects information on projected increases throughout the year. Once member districts finalize salaries and increases, the LPVEC adjusts staff salaries as necessary, issues retroactive pay, and amends the budget. For the 2014-2015 fiscal year, salaries and fringe benefits are expected to account for 71.74% of expenditures in the General Fund. The increase in personnel costs from FY2014 to FY2015 is 1.15%. Salaries for FY15 have been budgeted assuming a 3% increase and costs associated with providing employee healthcare are expected to increase by 10%. Awards and Acknowledgements The Government Finance Officers Association of the United States and Canada (GFOA) awarded a Certificate of Achievement for Excellence in Finance Reporting to the Lower Pioneer Valley Educational Collaborative for its comprehensive annual financial report for the fiscal year ended June 30, 2014. In order to be awarded this Certificate of Achievement, an entity must publish an easily readable and efficiently organized comprehensive annual financial report. This report must satisfy both generally accepted accounting principles and applicable legal requirements. A Certificate of Achievement is valid for a period of one year only. We believe that our current comprehensive annual financial report continues to meet the Certificate of Achievement Program’s requirements and we are submitting it to the GFOA to determine its eligibility for another certificate. The Government Finance Officers Association of the United States and Canada (GFOA) awarded a Distinguished Budget Presentation Award to the Collaborative for its budget document for the year beginning July 1, 2014. In order to receive this award, a government unit must publish a budget document of the very highest quality that reflects both the guidelines established by the National Advisory Council on State and Local Budgeting and the GFOA’s recommended practices on budgeting. The Collaborative has also submitted its budget document for the year beginning July 1, 2015 for consideration of this award. This will be the seventh year that the Collaborative has received this award. The Association of School Business Officials International awarded a Meritorious Budget Award to the Collaborative for its Annual Budget beginning July 1, 2008. The Meritorious Budget Awards Program encourages and recognizes excellence in school system budgeting. The Collaborative will also be submitted its budget document for the year beginning July 1, 2015 for consideration of this award. The preparation of this CAFR and the Annual Budget report would not have been possible without the efficient and dedicated services of the entire financial team of the Collaborative. We would like to express our appreciation to those who assisted and contributed to the preparation of this report. Respectfully submitted,
Andrew M. Churchill Anna M. Bishop Executive Director Director of Finance and Operation

Lower Pioneer Valley Educational Collaborative 10 Comprehensive Annual Financial Report
ORG
ANIZAT
IONAL
CHAR
T 2015
Organizational Chart

Lower Pioneer Valley Educational Collaborative 11 Comprehensive Annual Financial Report
Principal Executive Officers and Board of Directors
Principal Executive Officers
Andrew M. Churchill, Executive Director
Anna M. Bishop, Director of Finance and Operation
Donald Jarvis, Director of Occupational Education
Marisa Ross, Director of Special Education
Board of Directors
Agawam: Diane Juzba
East Longmeadow: William Fonseca
Hampden-Wilbraham Regional: Michelle Emirzian
Longmeadow: Kathryn Girard
Ludlow: Jacob Oliveira
Southwick-Tolland-Granville Regional: James Vincent
West Springfield: Dr. Jose Irizarry

Lower Pioneer Valley Educational Collaborative 12 Comprehensive Annual Financial Report
Mission, Vision, and Values of the Lower Pioneer Valley Educational Collaborative
Mission, Vision, and Values
Mission
The mission of the Lower Pioneer Valley Educational Collaborative is to improve effectiveness, efficiency, and equity in public education.
Vision
Guided by an innovative, creative, and entrepreneurial spirit, the Lower Pioneer Valley Educational Collaborative helps school districts meet the needs of every student while maximizing resource allocation. We are committed to responding to the changing needs of school districts by providing the highest quality programs and services at an affordable cost.
Values
The Collaborative values:
o A safe environment for all students, parents, and staff o Educational excellence and program accountability o Collaborative partnerships with schools, parents, and the community o Relevant, rigorous, and continuous professional development o Entrepreneurship o Responsibility, shared knowledge, and shared decision making o Recognizing the talents, achievements, and contributions of students and staff

Lower Pioneer Valley Educational Collaborative 13 Comprehensive Annual Financial Report
Certificate of Achievement for Excellence in Financial Reporting

Lower Pioneer Valley Educational Collaborative 14 Comprehensive Annual Financial Report
Distinguished Budget Presentation Award

Lower Pioneer Valley Educational Collaborative 15 Comprehensive Annual Financial Report
Meritorious Budget Award

Lower Pioneer Valley Educational Collaborative 16 Comprehensive Annual Financial Report
This page intentionally left blank.

Financial Section
Students in the Collaborative’s Culinary Arts program creating pastries.

Lower Pioneer Valley Educational Collaborative 17 Comprehensive Annual Financial Report
Financial Section

Lower Pioneer Valley Educational Collaborative 18 Comprehensive Annual Financial Report
This page intentionally left blank.

19
Independent Auditor’s Report To the Honorable Board of Directors Lower Pioneer Valley Educational Collaborative West Springfield, Massachusetts Report on the Financial Statements We have audited the accompanying financial statements of the governmental activities, the business-type activities, each major fund, and the aggregate remaining fund information of the Lower Pioneer Valley Educational Collaborative (Collaborative), as of and for the year ended June 30, 2015 and the related notes to the financial statements, which collectively comprise the Collaborative’s basic financial statements as listed in the table of contents. Management’s Responsibility for the Financial Statements Management is responsible for the preparation and fair presentation of these financial statements in accordance with accounting principles generally accepted in the United States of America; this includes the design, implementation, and maintenance of internal control relevant to the preparation and fair presentation of financial statements that are free from material misstatement, whether due to fraud or error. Auditor’s Responsibility Our responsibility is to express opinions on these financial statements based on our audit. We conducted our audit in accordance with auditing standards generally accepted in the United States of America and the standards applicable to financial audits contained in Government Auditing Standards, issued by the Comptroller General of the United States. Those standards require that we plan and perform the audit to obtain reasonable assurance about whether the financial statements are free of material misstatement. An audit involves performing procedures to obtain audit evidence about the amounts and disclosures in the financial statements. The procedures selected depend on the auditor’s judgment, including the assessment of the risks of material misstatement of the financial statements, whether due to fraud or error. In making those risk assessments, the auditor considers internal control relevant to the entity’s preparation and fair presentation of the financial statements in order to design audit procedures that are appropriate in the circumstances, but not for the purpose of expressing an opinion on the effectiveness of the entity’s internal control. Accordingly, we express no such opinion. An audit also includes evaluating the appropriateness of accounting policies used and the reasonableness of significant accounting estimates made by management, as well as evaluating the overall presentation of the financial statements. We believe that the audit evidence we have obtained is sufficient and appropriate to provide a basis for our audit opinions. Opinions In our opinion, the financial statements referred to above present fairly, in all material respects, the respective financial position of the governmental activities, the business-type activities, each major fund, and the aggregate remaining fund information of the Collaborative, as of June 30, 2015 and the respective changes in financial position and, where applicable, cash flows thereof for the year then ended in accordance with accounting principles generally accepted in the United States of America.

20
Other Matters Required Supplementary Information Accounting principles generally accepted in the United States of America require that the management’s discussion and analysis and required supplementary information, as listed in the table of contents, be presented to supplement the basic financial statements. Such information, although not part of the basic financial statements, is required by the Governmental Accounting Standards Board who considers it to be an essential part of financial reporting for placing the basic financial statements in an appropriate operational, economic, and historical context. We have applied certain limited procedures, to the required supplementary information in accordance with auditing standards generally accepted in the United States of America, which consisted of inquiries of management about the methods of preparing the information and comparing the information for consistency with management’s responses to our inquiries, the basic financial statements, and other knowledge we obtained during our audit of the basic financial statements. We do not express an opinion or provide any assurance on the information because the limited procedures do not provide us with sufficient evidence to express an opinion or provide any assurance. Other Information Our audit was conducted for the purpose of forming opinions on the financial statements that collectively comprise the Collaborative’s basic financial statements. The combining and individual fund statements and schedules, as listed in the table of contents, are presented for the purpose of additional analysis and are not a required part of the basic financial statements. The combining and individual fund statements and schedules are the responsibility of management and were derived from and relate directly to the underlying accounting and other records used to prepare the basic financial statements. Such information has been subjected to the auditing procedures applied in the audit of the basic financial statements and certain additional procedures, including comparing and reconciling such information directly to the underlying accounting and other records used to prepare the basic financial statements or to the basic financial statements themselves, and other additional procedures in accordance with auditing standards generally accepted in the United States of America. In our opinion, the combining and individual fund statements and schedules are fairly stated in all material respects in relation to the financial statements taken as a whole. The introductory and statistical sections, the schedule of cumulative surplus, and the required disclosures for Massachusetts Educational Collaboratives have not been subjected to the auditing procedures applied in the audit of the basic financial statements and, accordingly, we do not express an opinion or provide any assurance on them. Other Reporting Required by Government Auditing Standards In accordance with Government Auditing Standards, we have also issued our report dated November 18, 2015 on our consideration of the Collaborative’s internal control over financial reporting and our tests of its compliance with certain provisions of laws, regulations, contracts, grant agreements and other matters. The purpose of that report is to describe the scope of our testing of internal control over financial reporting and compliance and the results of that testing, and not to provide an opinion on internal control over financial reporting or compliance. That report is an integral part of an audit performed in accordance with Government Auditing Standards and should be read in conjunction with this report in considering the results of our audit.
November 18, 2015

Lower Pioneer Valley Educational Collaborative 21 Comprehensive Annual Financial Report
Management’s Discussion and Analysis Management’s Discussion and Analysis

Lower Pioneer Valley Educational Collaborative 22 Comprehensive Annual Financial Report
Management’s Discussion and Analysis As management of the Lower Pioneer Valley Educational Collaborative (Collaborative), we offer readers of these financial statements this narrative overview and analysis of the financial activities for the year ended June 30, 2015. The Collaborative complies with financial reporting requirements issued by the Governmental Accounting Standards Board (GASB). Management’s discussion and analysis are part of these requirements. All amounts, unless otherwise indicated, are expressed in whole dollars. Overview of the Financial Statements This discussion and analysis is intended to serve as an introduction to the Lower Pioneer Valley Educational Collaborative’s basic financial statements. These basic financial statements are comprised of three components: 1) government-wide financial statements, 2) fund financial statements, and 3) notes to the financial statements. This report also contains other supplementary information in addition to the basic financial statements themselves. Government-wide financial statements. The government-wide financial statements are designed to provide readers with a broad overview of finances, in a manner similar to private-sector business. The statement of net position presents information on all assets and deferred outflows and liabilities and deferred inflows, with the difference between them reported as net position. Over time, increases or decreases in net position may serve as a useful indicator of whether the financial position is improving or deteriorating. The statement of activities presents information showing how the government’s net position changed during the most recent year. All changes in net position are reported as soon as the underlying event giving rise to the change occurs, regardless of the timing of related cash flows. Thus, revenues and expenses are reported in this statement for some items that will only result in cash flows in future periods (e.g., uncollected revenues and earned but unused sick leave). Both of the government-wide financial statements distinguish functions that are principally supported by assessments to member and non-member districts and intergovernmental revenues (governmental activities) from other functions that are intended to recover all or a significant portion of their costs through user fees and charges (business-type activities). The governmental activities include administration, special education, occupational education, supplemental services, professional development, unallocated depreciation, and interest expense. These services are funded primarily by assessments and intergovernmental revenues including federal and state grants and other shared revenues. Also, blended within the governmental activities in the government-wide financial statements is the Lower Pioneer Valley Educational Corporation, a legally separate component unit. The component unit is blended with the primary government because it provides services almost entirely to the Collaborative and because almost all of the Corporation’s debt is expected to be repaid with assets derived from the Collaborative. The business-type activities include services provided on a charge for goods or services basis to recover all or a significant portion of the expenses of the goods and services provided. Business-type activities include the Collaborative’s transportation program. Fund financial statements. A fund is a grouping of related accounts that is used to maintain control over resources that have been segregated for specific activities or objectives. Fund accounting is used to ensure and demonstrate compliance with finance-related legal requirements. All of the funds can be divided into three categories: governmental funds, proprietary funds, and fiduciary funds. Governmental funds. The focus of the Collaborative’s governmental funds is to provide information on near-term inflows, outflows, and balances of spendable resources. Such information is useful in assessing the

Lower Pioneer Valley Educational Collaborative 23 Comprehensive Annual Financial Report
Collaborative’s financing requirements. In particular, unassigned fund balance may serve as a useful measure of a government’s net resources available for spending at the end of the year. Because the focus of governmental funds is narrower than that of the government-wide financial statements, it is useful to compare the information presented for governmental funds with similar information presented for governmental activities in the government-wide financial statements. By doing so, readers may better understand the long-term impact of the government’s near-term financing decisions. Both the governmental fund balance sheet and the governmental fund statement of revenues, expenditures, and changes in fund balances provide a reconciliation to facilitate this comparison between governmental funds and governmental activities. The Collaborative adopts an annual appropriated budget for its general fund. A budgetary comparison schedule has been provided for the general fund as required supplementary information after the notes to the financial statements to demonstrate compliance with this budget. Proprietary funds. The Collaborative maintains one type of proprietary fund. Enterprise funds are used to report the same functions presented as business-type activities in the government-wide financial statements. The Collaborative uses enterprise funds to account for its Transportation activities. Fiduciary funds. Fiduciary funds are used to account for resources held for the benefit of parties outside the government. Fiduciary funds are not reflected in the government-wide financial statements because the resources of those funds are not available to support the Collaborative’s own programs. The accounting used for fiduciary funds is much like that used for proprietary funds. Notes to the basic financial statements. The notes provide additional information that is essential to a full understanding of the data provided in the government-wide and fund financial statements. Other information. In addition to the basic financial statements and accompanying notes, this report also presents certain required supplementary information concerning the Collaborative’s budgetary basis of accounting as well as pension and other postemployment benefit obligations; other supplementary information; statistical tables; and additional state required disclosures. Government-wide Financial Analysis Governmental Activities As noted earlier, net position may serve over time as a useful indicator of a government’s financial position. The Collaborative’s governmental assets exceeded liabilities by $5.8 million at the close of year 2015. This represents an overall decrease in net position of $311,000. Net position of approximately $4.8 million reflects the Collaborative’s investment in capital assets (e.g., machinery and equipment); less any related debt used to acquire those assets that are still outstanding. The Collaborative uses these capital assets to provide services; consequently, these assets are not available for future spending. Although the investment in its capital assets is reported net of its related debt, it should be noted that the resources needed to repay this debt must be provided from other sources, since the capital assets themselves cannot be used to liquidate these liabilities. The remaining balance represents the unrestricted net position, which reports a year-end balance of approximately $1.1 million. The decrease in unrestricted net position is the result of an increase in the accrual of other postemployment benefit obligations (OPEB) by $681,000. Included within the governmental activities is the blended Lower Pioneer Valley Educational Corporation component unit which reported a net increase in assets of approximately $520,000.

Lower Pioneer Valley Educational Collaborative 24 Comprehensive Annual Financial Report
Key components of the Collaborative’s governmental financial position are listed as follows:
2015 2014
Assets: Current assets……………………………………… $ 9,749,715 $ 10,409,662 Capital assets……………………………………… 15,917,844 16,251,346
Total assets……………………………………… 25,667,559 26,661,008
Liabilities: Current liabilities (excluding debt)………………… 1,777,327 2,479,255 Noncurrent liabilities (excluding debt)…………… 6,911,880 6,184,854 Current debt………………………………………… 708,201 707,397 Noncurrent debt……………………………………… 10,433,270 11,141,471
Total liabilities………………………………… 19,830,678 20,512,977
Net Position: Net investment in capital assets…………………… 4,776,373 4,402,478 Unrestricted………………………………………… 1,060,508 1,745,553
Total net position……………………………… $ 5,836,881 $ 6,148,031
Program revenues: Charges for services………………………………… $ 2,413,990 $ 1,662,794 Operating grants and contributions……………… 1,974,005 1,651,515
General revenues:Member district assessments……………………… 8,186,225 9,509,825 Unrestricted investment income…………………… 2,307 2,542 Miscellaneous……………………………………… 450,598 440,851
Total revenues………………………………… 13,027,125 13,267,527
Expenses: Administration……………………………………… 1,824,395 960,520 Special Education…………………………………… 3,754,926 4,495,610 Occupational Education…………………………… 4,488,967 4,839,278 Supplemental Services……………………………… 2,279,491 2,201,398 Professional Development………………………… 44,043 3,596 Unallocated Depreciation…………………………… 655,988 652,293 Interest……………………………………………… 290,465 320,095
Total expenses………………………………… 13,338,275 13,472,790
Transfers………………………………………………… - (11,241)
Change in net position……………………………… (311,150) (216,504)
Beginning net position……………………………… 6,148,031 6,364,535
Ending net position…………………………………… $ 5,836,881 $ 6,148,031
Total revenues decreased by approximately $240,000 from the prior year. The majority of this decrease was related to a decrease in member assessment due to the closing of the Alternative High School, Elementary Developmental, and Prevocational Preparation programs. Total Collaborative expenses decreased from the prior year by approximately $135,000. The decrease in expenditures was the net effect of program cuts and an

Lower Pioneer Valley Educational Collaborative 25 Comprehensive Annual Financial Report
increase in the Collaborative’s accrued OPEB liability and recognized state pension expenditures. New accounting standards related to pensions required the Collaborative to recognize an additional revenue and expenditure for payments made by the state retirement system on behalf of the Collaborative. This resulted in a large increase in administrative expenditures and operating grant revenue. Business-type Activities For the Collaborative’s business-type activities, liabilities exceeded assets by $6.8 million at the close of year 2015. Key components of the Collaborative’s business-type financial position are listed as follows:
2015 2014Assets:
Current assets……………………………………… $ 350,465 $ 156,668 Capital assets……………………………………… 3,676,587 4,510,440
Total assets……………………………………… 4,027,052 4,667,108
Liabilities: Current liabilities (excluding debt)………………… 1,836,532 2,273,460 Noncurrent liabilities (excluding debt)…………… 8,581,314 7,496,106 Current debt………………………………………… 417,345 829,114 Noncurrent debt……………………………………… - 417,345
Total liabilities………………………………… 10,835,191 11,016,025
Net Position: Net investment in capital assets…………………… 3,259,242 3,263,981 Unrestricted………………………………………… (10,067,381) (9,612,898)
Total net position……………………………… $ (6,808,139) $ (6,348,917) 2015 2014
Program revenues: Charges for services………………………………… $ 11,823,271 $ 11,515,465
Expenses:
Transportation……………………………………… 12,282,493 12,433,554
Transfers………………………………………………… - 11,241
Change in net position……………………………… (459,222) (906,848)
Beginning net position……………………………… (6,348,917) (5,442,069)
Ending net position…………………………………… $ (6,808,139) $ (6,348,917)
Business type net position of $3.3 million represents net investment in capital assets. The remaining $10 million deficit balance of unrestricted net position is largely due to the recognition of the $8.6 million liability associated with GASB Statement #45 (OPEB). The Transportation enterprise fund reported a $459,000 decrease in net position, which was largely due to the recognition of an additional $1.1 million in OPEB expenses. Additionally, the Transportation enterprise fund is retiring debt related to the school buses over a five year period and has increased its fees to recover these costs
Lower Pioneer Valley Educational Collaborative 26 Comprehensive Annual Financial Report
over a 10 year period to reduce the impact on the users. This policy has had the effect of reducing the net position over the short term while the debt is repaid at a higher rate than the reimbursements are collected. The Collaborative anticipates that the opposite will begin to occur in years six through ten when the debt is paid-off and the fees are still being assessed and collected. Financial Analysis of the Governmental Funds As noted earlier, the Collaborative uses fund accounting to ensure and demonstrate compliance with finance-related legal requirements. Governmental funds. The focus of governmental funds is to provide information on near-term inflows, outflows, and balances of spendable resources. Such information is useful in assessing financing requirements. In particular, unassigned fund balance may serve as a useful measure of a government’s net resources available for spending at the end of the year. At of the end of the current year, governmental funds reported combined ending fund balances of $6.1 million, a net decrease of $160,000 from the prior year. The general fund decreased by $194,000 while the nonmajor governmental funds increased by $34,000. The General Fund is the Collaborative’s chief operating fund. At year end, unassigned fund balance of the general fund totaled $4.6 million while total fund balance equaled $5.9 million. Assigned fund balance consists of amounts the Collaborative has assigned for capital projects. As a measure of the general fund’s liquidity, it may be useful to compare both unassigned fund balance and total fund balance to total fund expenditures. Unassigned fund balance represents 40% of total general fund expenditures, while total fund balance represents 51% of that same amount. The general fund retained a consistent position from the prior fiscal year, decreasing by approximately 3%. Decreases in assessments due to discontinued programs were partially offset with reduced program costs. General Fund Budgetary Highlights The Collaborative’s 2015 original operating budget consisted of $10,591,337 in current appropriations and anticipated assessments. During the year appropriations were increased by $491,000 through the use of prior year fund balance. The majority of this was for a $250,000 transfer to establish an OPEB trust fund to begin the process of funding the outstanding OPEB liability; and 192,000 to fund a Machine Technology Program. There is no difference between the fund based and budgetary based change in fund balance for the year. Actual revenues came in less than budgeted by $667,000 and expenditures were under budget by a total of $473,000. All levels of expenditures came in under budget with the exception of supplemental services. These services are billed back to the users as the services are provided. Expenditures in this category may exceed the budget as long as they are covered by the actual revenues. Pension Benefits Employees of the Collaborative are covered under the Massachusetts Teachers Retirement System or the Massachusetts State Employees Retirement System which represents special funding situations related to the obligation for past pension liabilities. The Collaborative pays annual assessments for current pension costs related to both systems. Please refer to Note 12 in the basic financial statements for further discussion on the Collaborative’s Pension liability.

Lower Pioneer Valley Educational Collaborative 27 Comprehensive Annual Financial Report
Other Postemployment Benefits As of June 30, 2015, the Collaborative has recognized a liability for other postemployment liabilities based on its Annual Required Contribution (ARC) totaling $15.3 million which was reported in both the governmental and business-type activities. The Collaborative established an OPEB trust during fiscal year 2015 to begin the process of funding a portion of this liability. The Collaborative established the OPEB trust fund with a $250,000 transfer from the general fund. Please refer to Note 13 in the basic financial statements for further discussion on the Collaborative’s OPEB liability. Capital Asset and Debt Administration The Collaborative’s capital assets totaled $19.6 million as of June 30, 2015 which includes over $15.6 million in assets of the Lower Pioneer Valley Educational Corporation blended component unit. The Collaborative acquired approximately $322,000 in capital assets in year 2015. This consisted primarily of buildings and equipment acquired in the general fund. The Collaborative reported $11.1 million in long-term bonds payable which all related to debt held by the blended Corporation component unit. The corporation did not issue any new debt in year 2015 and retired approximately $707,000 in outstanding debt. The Collaborative has purchased machinery and equipment and vehicles through capital leases with remaining outstanding balances totaling approximately $417,000 as of June 30, 2015. Please refer to Note 4, 6, 7 and 8 in the basic financial statements for further discussion of the capital asset and debt activity. Requests for Information This financial report is designed to provide a general overview of the Lower Pioneer Valley Educational Collaborative’s finances for all those with an interest in the Collaborative’s finances. Questions concerning any of the information provided in this report or requests for additional financial information should be addressed to the Director of Finance, Lower Pioneer Valley Educational Collaborative, 174 Brush Hill Ave., West Springfield, Massachusetts 01089.

Lower Pioneer Valley Educational Collaborative 28 Comprehensive Annual Financial Report
Basic Financial Statements Basic Financial Statements

Governmental Business-typeActivities Activities Total
ASSETSCURRENT:
Cash and cash equivalents………………………………...…… $ 848,138 $ - $ 848,138 Investments………………………………………………………… 6,177,988 - 6,177,988 Receivables, net of allowance for uncollectibles:
Grants receivable……………………………………………… 286,362 - 286,362 Departmental and other……………………………………… 3,000 - 3,000 Intergovernmental……………………………………………… 684,299 309,001 993,300 Internal balances……………………………………...……… 1,749,639 (1,749,639) -
Inventory…………………………………………………………… - 41,464 41,464 Other assets………………………………………………………… 289 - 289
NONCURRENT: Capital assets, net of accumulated depreciation:
Nondepreciable………………………………………………… 2,100,088 - 2,100,088 Depreciable……………………………………………………… 13,817,756 3,676,587 17,494,343
TOTAL ASSETS……………………………………………………… 25,667,559 2,277,413 27,944,972
LIABILITIES CURRENT:
Warrants payable………………………………………………… 390,931 51,127 442,058 Advances and credits……………………………………………… 625,612 - 625,612 Accrued interest…………………………………………………… 8,517 - 8,517 Accrued payroll…………………………………………………… 587,076 - 587,076 Payroll withholdings……………………………………………… 91,416 - 91,416 Other liabilities……………………………………………………… 2,031 5,555 7,586 Capital lease obligations………………………………………… - 417,345 417,345 Compensated absences………………………………………… 71,744 30,211 101,955 Bonds payable……………………………………………………… 708,201 - 708,201
NONCURRENT: Compensated absences………………………………………… 133,137 14,335 147,472 Other postemployment benefits………………………………… 6,778,743 8,566,979 15,345,722 Bonds payable……………………………………………………… 10,433,270 - 10,433,270
TOTAL LIABILITIES…………………………………………………… 19,830,678 9,085,552 28,916,230
NET POSITIONNet investment in capital assets…………………………………… 4,776,373 3,259,242 8,035,615 Unrestricted…………………………………………………………… 1,060,508 (10,067,381) (9,006,873)
TOTAL NET POSITION………………………………………………$ 5,836,881 $ (6,808,139) $ (971,258)
See notes to basic financial statements.
STATEMENT OF NET POSITION
JUNE 30, 2015
Lower Pioneer Valley Educational Collaborative 29 Comprehensive Annual Financial Report

STATEMENT OF ACTIVITIES
YEAR ENDED JUNE 30, 2015
OperatingCharges for Grants and Net (Expense)
Functions/Programs Expenses Services Contributions RevenuePrimary Government:
Governmental Activities:Administration…………………………………………… $ 1,824,395 $ 24,825 $ 941,093 $ (858,477) Special education……………………………………… 3,754,926 814,652 316,375 (2,623,899) Occupational education………………………………… 4,488,967 910,397 311,478 (3,267,092) Supplemental services………………………………… 2,279,491 664,116 381,155 (1,234,220) Professional development……………………………… 44,043 - 23,904 (20,139) Unallocated depreciation……………………………… 655,988 - - (655,988) Interest expense………………………………..……… 290,465 - - (290,465)
Total Governmental Activities………………………… 13,338,275 2,413,990 1,974,005 (8,950,280)
Business-Type Activities:Transportation…………………………………………… 12,282,493 11,823,271 - (459,222)
Total Primary Government…………………………… $ 25,620,768 $ 14,237,261 $ 1,974,005 $ (9,409,502)
(Continued)See notes to basic financial statements.
Program Revenues
Lower Pioneer Valley Educational Collaborative 30 Comprehensive Annual Financial Report

Governmental Business-TypeActivities Activities Total
Changes in net position:Net (expense) revenue from previous page………… $ (8,950,280) $ (459,222) $ (9,409,502) General revenues:
Member District Assessments……………………… 8,186,225 - 8,186,225 Unrestricted investment income…………………… 2,307 - 2,307 Miscellaneous……………………………………… 450,598 - 450,598
Total general revenues………………………………… 8,639,130 - 8,639,130
Change in net position…………………………… (311,150) (459,222) (770,372)
Net Position: Beginning of year…………………………………… 6,148,031 (6,348,917) (200,886)
End of year…………………………………………… $ 5,836,881 $ (6,808,139) $ (971,258)
(Concluded)See notes to basic financial statements.
STATEMENT OF ACTIVITIES
YEAR ENDED JUNE 30, 2015
Lower Pioneer Valley Educational Collaborative 31 Comprehensive Annual Financial Report

Nonmajor TotalGovernmental Governmental
General Funds FundsASSETSCash and cash equivalents………………………………………………… $ 616,227 $ 231,280 $ 847,507 Investments………………………………………………………………… 4,605,072 - 4,605,072 Receivables, net of allowance for uncollectibles:
Grants receivable……………………………………………………… - 286,362 286,362 Departmental and other.………………………………………………… - 3,000 3,000 Intergovernmental……………………………………………………… 684,299 - 684,299
Due from other funds……………………………………………………… 1,749,639 63,005 1,812,644 Other assets………………………………………………………………… 289 - 289
TOTAL ASSETS…………………………………………………………… $ 7,655,526 $ 583,647 $ 8,239,173
LIABILITIESAccounts payable……………………………………………………… $ 505,680 $ 15,853 $ 521,533 Other accrued expenses……………………………………………… 576,459 10,617 587,076 Payroll withholdings…………………………………………………… 91,416 - 91,416 Other liabilities…………………………………………………………… 2,031 - 2,031 Due to other funds……………………………………………………… - 63,005 63,005 Advances and credits……………………...…………………………… 625,612 - 625,612
TOTAL LIABILITIES………………………………………………………… 1,801,198 89,475 1,890,673
DEFERRED INFLOWS OF RESOURCESUnavailable revenues…………………………………………………… - 215,803 215,803
FUND BALANCESRestricted………………………………………………………………… - 297,053 297,053 Assigned………………………………………………………………… 1,275,000 - 1,275,000 Unassigned……………………………………………………………… 4,579,328 (18,684) 4,560,644
TOTAL FUND BALANCES………………………………………………… 5,854,328 278,369 6,132,697
TOTAL LIABILITIES, DEFERRED INFLOWS OF RESOURCES,AND FUND BALANCES……………………………………………… $ 7,655,526 $ 583,647 $ 8,239,173
See notes to basic financial statements.
GOVERNMENTAL FUNDSBALANCE SHEET
JUNE 30, 2015
Lower Pioneer Valley Educational Collaborative 32 Comprehensive Annual Financial Report

RECONCILIATION OF THE GOVERNMENTAL FUNDS BALANCE SHEETTOTAL FUND BALANCES TO THE STATEMENT OF NET POSITION
JUNE 30, 2015
Total governmental fund balances……………………………………………………………… $ 6,132,697
Capital assets (net) used in governmental activities are not financial resourcesand, therefore, are not reported in the funds…………………………………………… 15,917,844
Accounts receivable are not available to pay for current-periodexpenditures and, therefore, are unavailable in the funds……………………..……… 215,803
Net effect of blending the component unit………………………………………………… 1,695,632
Long-term liabilities are not due and payable in the current period and, therefore,are not reported in the governmental funds.
Bonds payable…………………………………………………………………………… (11,141,471) Other postemployment benefits………………………………………………………… (6,778,743) Compensated absences………………………………………………………………… (204,881)
Net effect of reporting long-term liabilities………………………………………… (18,125,095)
Net position of governmental activities………………………………………………………… $ 5,836,881
See notes to basic financial statements.
Lower Pioneer Valley Educational Collaborative 33 Comprehensive Annual Financial Report

Nonmajor TotalGovernmental Governmental
General Funds FundsREVENUES:
Member district assessments……………………………… $ 8,967,734 $ 24,825 $ 8,992,559 Nonmember assessments………………………………… 1,444,340 - 1,444,340 Intergovernmental…………………………………………… 1,482,202 484,834 1,967,036 Investment income…………………………………………… 1,650 - 1,650 Departmental and other……………………………………… 1,202 163,316 164,518
TOTAL REVENUES………………………………… 11,897,128 672,975 12,570,103
EXPENDITURES:
Current: Administration…………………………………………… 1,683,991 - 1,683,991 Special education………………………………………… 3,570,898 1,440 3,572,338 Occupational education………………………………… 4,869,100 242,402 5,111,502 Supplemental services…………………………………… 1,947,098 369,203 2,316,301 Professional development……………………………… 20,207 25,556 45,763
TOTAL EXPENDITURES…………………………… 12,091,294 638,601 12,729,895
EXCESS (DEFICIENCY) OF REVENUES OVER (UNDER) EXPENDITURES………………………… (194,166) 34,374 (159,792)
OTHER FINANCING SOURCES (USES):
Transfers in…………………………………………………… - 158,779 158,779 Transfers out………………………………………………… - (158,779) (158,779)
TOTAL OTHER FINANCING SOURCES (USES)… - - -
NET CHANGE IN FUND BALANCES………………………… (194,166) 34,374 (159,792)
FUND BALANCES AT BEGINNING OF YEAR……………… 6,048,494 243,995 6,292,489
FUND BALANCES AT END OF YEAR……………………… $ 5,854,328 $ 278,369 $ 6,132,697
See notes to basic financial statements.
GOVERNMENTAL FUNDSSTATEMENT OF REVENUES, EXPENDITURES AND CHANGES IN FUND BALANCES
YEAR ENDED JUNE 30, 2015
Lower Pioneer Valley Educational Collaborative 34 Comprehensive Annual Financial Report

RECONCILIATION OF THE STATEMENT OF REVENUES, EXPENDITURES,AND CHANGES IN FUND BALANCES OF GOVERNMENTAL FUNDS
TO THE STATEMENT OF ACTIVITIES
YEAR ENDED JUNE 30, 2015
Net change in fund balances - total governmental funds……………………………………… $ (159,792)
Governmental funds report capital outlays as expenditures. However, in the Statement of Activities the cost of those assets is allocated over their estimated useful lives and reported as depreciation expense.
Capital outlay……………………………………………………………………………… 322,486 Depreciation expense………………………...………………………………………… (655,988)
Net effect of reporting capital assets…………………………………………… (333,502)
Revenues in the Statement of Activities that do not provide current financial
resources are unavailable in the Statement of Revenues, Expenditures and Changes in Fund Balances. Therefore, the recognition of revenue for various types of accounts receivable (i.e., real estate and personal property, motor vehicle excise, etc.) differ between the two statements. This amount represents the net change in unavailable revenue…………………………………………………… 6,969
The issuance of long-term debt (e.g., bonds and leases) provides current financial
resources to governmental funds, while the repayment of the principal of long- term debt consumes the financial resources of governmental funds. Neither transaction, however, has any effect on net position. Also, governmental funds report the effect of premiums, discounts, and similar items when debt is first issued, whereas these amounts are deferred and amortized in the Statement of Activities.
Debt principal payments………………………………………………………………… 707,397
Some expenses reported in the Statement of Activities do not require the use of current financial resources and, therefore, are not reported as expenditures in the governmental funds.
Net change in compensated absences and other accrued liabilities……………… (56,276) Net change in other postemployment benefits accrual……………………………… (681,282)
Net effect of recording long-term liabilities…………………………………...… (737,558)
Net effect of blending component unit………………………………………………………… 205,336
Change in net position of governmental activities……………………………………………… $ (311,150)
See notes to basic financial statements.
Lower Pioneer Valley Educational Collaborative 35 Comprehensive Annual Financial Report

TransportationASSETSCURRENT:
Receivables, net of allowance for uncollectibles: Intergovernmental…………………………………………$ 309,001
Inventory……………………………………………………… 41,464
Total current assets…………………………………… 350,465
NONCURRENT: Capital assets:
Depreciable……………………………………………… 3,676,587
TOTAL ASSETS………………………………………………… 4,027,052
LIABILITIES CURRENT:
Warrants payable…………………………………………… 51,127 Other liabilities………………………………………………… 5,555 Due to other funds…………………………………………… 1,749,639 Capital lease obligations…………………………………… 417,345 Compensated absences…………………………………… 30,211
Total current liabilities………………………………… 2,253,877
NONCURRENT: Compensated absences…………………………………… 14,335 Other postemployment benefits…………………………… 8,566,979
Total noncurrent liabilities…………………………… 8,581,314
TOTAL LIABILITIES…………………………………………… 10,835,191
NET POSITIONNet investment in capital assets……………………………… 3,259,242 Unrestricted……………………………………………………… (10,067,381)
TOTAL NET POSITION…………………………………………$ (6,808,139)
See notes to basic financial statements.
Business-type Activities -
Enterprise Fund
PROPRIETARY FUNDSSTATEMENT OF NET POSITION
JUNE 30, 2015
Lower Pioneer Valley Educational Collaborative 36 Comprehensive Annual Financial Report

PROPRIETARY FUNDSSTATEMENT OF REVENUES, EXPENSES AND CHANGES IN FUND NET POSITION
YEAR ENDED JUNE 30, 2015
TransportationOPERATING REVENUES:
School year transportation ………………………………………… $ 10,105,078 Vocational transportation ………………………………………… 242,796 Bus monitors ………………………………………………………… 901,378 Field trip transportation……………………………………………… 203,290 Summer school transportation…………………………………… 370,729
TOTAL OPERATING REVENUES …………………………… 11,823,271
OPERATING EXPENSES:Wages and fringe benefits ……………………………………….. 8,780,899 Fuel…………………………………………………………………… 1,012,756 Repairs and maintenance………………………………………… 458,017 Overhead and operating expenses……………………………… 832,675 Insurance…………………………………………………………… 348,833 Depreciation………………………………………………………. 833,853
TOTAL OPERATING EXPENSES …………………………… 12,267,033
OPERATING INCOME (LOSS)………………………………… (443,762)
NONOPERATING REVENUES (EXPENSES):Interest expense…………………………………………………… (15,460)
CHANGE IN NET POSITION…………………………………… (459,222)
NET POSITION AT BEGINNING OF YEAR………………………… (6,348,917)
NET POSITION AT END OF YEAR………………………………… $ (6,808,139)
See notes to basic financial statements.
Business-type Activities - Enterprise
Fund
Lower Pioneer Valley Educational Collaborative 37 Comprehensive Annual Financial Report

Transportation
CASH FLOWS FROM OPERATING ACTIVITIES:Receipts from customers and users………………………………………………$ 11,629,474 Payments to vendors……………………………………………………………… (2,689,158) Payments to employees…………………………………………………………… (7,708,010)
NET CASH FROM (USED FOR) OPERATING ACTIVITIES…………………… 1,232,306
CASH FLOWS FROM NONCAPITAL FINANCING ACTIVITIES:Advances from other funds……………………………………………………… (387,732)
NET CASH FROM NONCAPITAL FINANCING ACTIVITIES…………………… (387,732)
CASH FLOWS FROM CAPITAL AND RELATED FINANCING ACTIVITIES:Principal payments on capital lease obligations………………………………… (829,114) Interest expense…………………………………………………………………… (15,460)
NET CASH FROM (USED FOR) CAPITAL AND RELATEDFINANCING ACTIVITIES…………………………………...…………………… (844,574)
NET CHANGE IN CASH AND CASH EQUIVALENTS…………………………… -
CASH AND CASH EQUIVALENTS AT BEGINNING OF YEAR………………… -
CASH AND CASH EQUIVALENTS AT END OF YEAR……………………………$ -
RECONCILIATION OF OPERATING INCOME (LOSS) TO NET CASHFROM OPERATING ACTIVITIES:
Operating income (loss)……………………………………………………………$ (443,762) Adjustments to reconcile operating income (loss) to net
cash from operating activities:Depreciation…………………………………………………………………… 833,853 Changes in assets and liabilities:
Intergovernmental…………………………………………………………… (208,442) Inventory…………………………………………………………………… 14,645 Warrants payable…………………………………………………………… (26,356) Accrued liabilities…………………………………………………………… (10,521) Accrued payroll……………………………………………………………… (8,949) Accrued compensated absences………………………………………… (9,066) Other postemployment benefits obligation………………………..……… 1,090,904
Total adjustments……………………………………………………… 1,676,068
NET CASH FROM OPERATING ACTIVITIES…………………………………… $ 1,232,306
See notes to basic financial statements.
Business-type Activities -
Enterprise Fund
PROPRIETARY FUNDSSTATEMENT OF CASH FLOWS
YEAR ENDED JUNE 30, 2015
Lower Pioneer Valley Educational Collaborative 38 Comprehensive Annual Financial Report

FIDUCIARY FUNDSSTATEMENT OF FIDUCIARY NET POSITION
JUNE 30, 2015
OtherPostemployment
Benefits AgencyTrust Fund Fund
Cash and cash equivalents……………………………………… $ 250,000 $ 43,880 Receivables, net of allowance for uncollectibles:
Other…………………………………………………………… - 390
TOTAL ASSETS……………………………………………………… 250,000 44,270
LIABILITIESLiabilities due depositors………………………………………… - 44,270
NET POSITIONHeld in trust for OPEB…………………………………………$ 250,000 $ -
See notes to basic financial statements.
ASSETS
Lower Pioneer Valley Educational Collaborative 39 Comprehensive Annual Financial Report

FIDUCIARY FUNDSSTATEMENT OF CHANGES IN FIDUCIARY NET POSITION
YEAR ENDED JUNE 30, 2015
OtherPostemployment
BenefitsTrust Fund
ADDITIONS:Contributions:
Employer contributions………………………………………………………………$ 250,000
NET POSITION AT BEGINNING OF YEAR………………………………………… -
NET POSITION AT END OF YEAR……………………………………………………$ 250,000
See notes to basic financial statements.
Lower Pioneer Valley Educational Collaborative 40 Comprehensive Annual Financial Report

Notes to Basic Financial Statements Year Ended June 30, 2015
Lower Pioneer Valley Educational Collaborative 41 Comprehensive Annual Financial Report
NOTE 1 – SUMMARY OF SIGNIFICANT ACCOUNTING POLICIES Notes to basic financial statements The Lower Pioneer Valley Educational Collaborative (Collaborative) was formed in 1974 as authorized by Chapter 40 Section 4E and Chapter 797 of the Acts of 1979 of the Commonwealth of Massachusetts, by member school districts from the Towns of Agawam, East Longmeadow, Longmeadow, Ludlow, and West Springfield, and the Hampden-Wilbraham and Southwick-Tolland-Granville Regional School Districts. The primary purpose of the Collaborative is to expand the quality of educational services that can be provided more effectively and efficiently by pooling the resource and students of several school districts. Since inception, the Collaborative has been able to substantially broaden the quantity and quality of programs and services available to students in surrounding school districts. The Collaborative offers programs in occupational and special education areas, and in year 1992 began to provide transportation services to member school districts. The Collaborative’s programs and services are primarily intended for its members; however, nonmembers may also participate on space available basis. Nonmembers pay a 16% charge to provide for administration costs incurred by the Collaborative. The Collaborative operates under an “Agreement of Association” (Agreement). Governance of the Collaborative is vested in a seven member board of Directors (Board) composed of one representative from each member school committee. The Board appoints an Executive Director who is the chief operating official for the Collaborative and who reports directly to the Board. The superintendents from each of the member school districts compose an advisory board to the Executive Director and the Board of Directors. The accompanying basic financial statements of the Lower Pioneer Valley Educational Collaborative have been prepared in accordance with accounting principles generally accepted in the United States of America (GAAP). The Governmental Accounting Standards Board (GASB) is the recognized standard-setting body for establishing governmental accounting and financial reporting principles. The significant Collaborative accounting policies are described herein. A. Reporting Entity For financial reporting purposes, the Collaborative has included all funds, agencies, boards, commissions, and departments. The Collaborative has also considered all potential component units for which it is financially accountable as well as organizations for which the nature and significance of their relationship with the Collaborative are such that exclusion would cause the Collaborative’s basic financial statements to be misleading or incomplete. As required by GAAP, these basic financial statements present the Collaborative (primary government) and its component unit. The Lower Pioneer Valley Education Corporation (Corporation) meets the required criteria to be reported as a blended component unit. The Corporation was organized in 1981 and is comprised of the same seven member school districts as the Collaborative. The Corporation’s primary activity is to act as the Collaborative’s financing entity that issues debt to acquire real property and other educational related resources used by the Collaborative. The Corporation and Collaborative have entered into several long-term leases that provides for substantially all Corporation revenues which are then used to pay off all of the Corporation’s debt. The Corporation issues separate audited financial statements. A copy of the complete financial statements can be obtained by contacting the Corporation at 174 Brush Hill Avenue, West Springfield, MA 01089. The primary government consists of all funds and departments which provide various services including special education, occupational education, supplemental services, professional development, administrative, transportation services, and the activities of the blended component unit. The Collaborative Board of Directors and Executive Director are directly responsible for the activities of the governmental and business-type activities with the exception of the Lower Pioneer Valley Educational Corporation blended component unit.

Notes to Basic Financial Statements Year Ended June 30, 2015
Lower Pioneer Valley Educational Collaborative 42 Comprehensive Annual Financial Report
B. Government-Wide and Fund Financial Statements Government-Wide Financial Statements The government-wide financial statements (i.e., statement of net position and the statement of changes in net position) report information on all of the non-fiduciary activities of the primary government and its component units. Governmental activities are primarily supported by member assessments. Fund Financial Statements Separate financial statements are provided for governmental funds, proprietary funds and fiduciary funds, even though fiduciary funds are excluded from the government-wide financial statements. Major individual governmental funds are reported as separate columns in the fund financial statements. Nonmajor funds are aggregated and displayed in a single column. Major Fund Criteria Major funds must be reported if the following criteria are met:
• If the total assets and deferred outflows of resources, liabilities and deferred inflows of resources, revenues, or expenditures/expenses of an individual governmental or enterprise fund are at least 10 percent of the corresponding element (assets and deferred outflows, liabilities and deferred inflows, etc.) for all funds of that category or type (total governmental or total enterprise funds), and
• If the total assets and deferred outflows of resources, liabilities and deferred inflows of resources,
revenues, or expenditures/expenses of the individual governmental fund are at least 5 percent of the corresponding element for all governmental and enterprise funds combined.
Additionally, any other governmental fund that management believes is particularly significant to the basic financial statements may be reported as a major fund. C. Measurement Focus, Basis of Accounting and Financial Statement Presentation Government-Wide Financial Statements The government-wide financial statements are reported using the economic resources measurement focus and the accrual basis of accounting. Under this method, revenues are recorded when earned and expenses are recorded when the liabilities are incurred. Assessments are recognized as revenues in the year for which they are assessed. Grants and similar items are recognized as revenue as soon as all eligibility requirements imposed by the provider have been met. The statement of activities demonstrates the degree to which the direct expenses of a particular function or segment are offset by program revenues. Direct expenses are those that are clearly identifiable with a specific function or segment. Program revenues include the following:
• Charges to customers or applicants who purchase, use, or directly benefit from goods, services, or privileges provided by a given function or segment.
• Grants and contributions that are restricted to meeting the operational requirements of a particular
function or segment.

Notes to Basic Financial Statements Year Ended June 30, 2015
Lower Pioneer Valley Educational Collaborative 43 Comprehensive Annual Financial Report
• Grants and contributions that are restricted to meeting the capital requirements of a particular function or
segment. Assessments and other items not identifiable as program revenues are reported as general revenues. The effect of certain interfund activity has been removed from the government-wide financial statements so that activity is recorded only once in the consolidated statements. Interfund services provided and used are not eliminated in the process of consolidation. Fund Financial Statements Governmental fund financial statements are reported using the flow of current financial resources measurement focus and the modified accrual basis of accounting. Under the modified accrual basis of accounting, revenues are recognized when susceptible to accrual (i.e., measurable and available). Measurable means the amount of the transaction can be determined and available means collectible within the current period or soon enough thereafter to pay liabilities of the current period. Expenditures are recorded when the related fund liability is incurred, except for unmatured interest on general long-term debt which is recognized when due, and certain compensated absences, claims and judgments which are recognized when the obligations are expected to be liquidated with current expendable available resources. Member district assessments and non-member assessments are considered available if they are collected within 60 days after year end. Investment income is susceptible to accrual. Other receipts and revenues become measurable and available when the cash is received and are recognized as revenue at that time. Entitlements and shared revenues are recorded at the time of receipt or earlier if the susceptible to accrual criteria are met. Expenditure driven grants recognize revenue when the qualifying expenditures are incurred and all other grant requirements are met. The following major governmental fund is reported: The general fund is the primary operating fund. It is used to account for all financial resources, except those that are required to be accounted for in another fund. The nonmajor governmental funds consist of other special revenue funds that are aggregated and presented in the nonmajor governmental funds column on the governmental funds financial statements. The following describes the general use of these fund types: The special revenue fund is used to account for and report the proceeds of specific revenue sources that are restricted or committed to expenditure for specified purposes. Proprietary fund financial statements are reported using the flow of economic resources measurement focus and the accrual basis of accounting. Under this method, revenues are recorded when earned and expenses are recorded when the liabilities are incurred. Proprietary funds distinguish operating revenues and expenses from non-operating items. Operating revenues and expenses generally result from providing services and producing and delivering goods in connection with the proprietary funds principal ongoing operations. All revenues and expenses not meeting this definition are reported as non-operating revenues and expenses. The following major proprietary fund is reported:

Notes to Basic Financial Statements Year Ended June 30, 2015
Lower Pioneer Valley Educational Collaborative 44 Comprehensive Annual Financial Report
The transportation enterprise fund is used to account for transportation services which are provided to member districts. Fiduciary fund financial statements are reported using the flow of economic resources measurement focus and use the accrual basis of accounting except for the Agency Fund, which has no measurement focus. Fiduciary funds are used to account for assets held in a trustee capacity for others that cannot be used to support the governmental programs. The following fiduciary fund types are reported: The other postemployment benefit trust fund is used to accumulate resources to provide funding for future other postemployment benefits (OPEB) liabilities. The agency fund is used to account for assets held in a purely custodial capacity. The Collaborative’s agency fund is used to account for student activities. D. Cash and Investments Government-Wide and Fund Financial Statements Cash and cash equivalents are considered to be cash on hand, demand deposits and short-term investments with an original maturity of three months or less from the date of acquisition. Investments are carried at fair value. E. Accounts Receivable Government-Wide and Fund Financial Statements The recognition of revenue related to accounts receivable reported in the government-wide financial statements and fiduciary funds financial statements are reported under the accrual basis of accounting. The recognition of revenue related to accounts receivable reported in the governmental funds financial statements are reported under the modified accrual basis of accounting. Departmental and Other Departmental and other receivables consist of various benefit payments which are under agreement with current and former employees to reimburse the Collaborative and tuition payments receivable from other Collaboratives for special education services provided. Grants Various federal and state grants for operating and capital purposes are applied for and received annually. For non-expenditure driven grants, receivables are recorded as soon as all eligibility requirements imposed by the provider have been met. For expenditure driven grants, receivables are recorded when the qualifying expenditures are incurred and all other grant requirements are met. These receivables are considered 100% collectible and therefore do not report an allowance for uncollectibles. Intergovernmental Amounts due from member and non-member school districts for services provided.

Notes to Basic Financial Statements Year Ended June 30, 2015
Lower Pioneer Valley Educational Collaborative 45 Comprehensive Annual Financial Report
F. Inventories Government-Wide and Fund Financial Statements Inventories for governmental activities are recorded as expenditures at the time of purchase and are not material. Inventories in the business-type activities are valued at cost determined on a first-in, first-out basis. G. Capital Assets Government-Wide Financial Statements Capital assets, which include land, buildings and improvements, and machinery and equipment are reported in the government-wide financial statements. Capital assets are recorded at historical cost, or at estimated historical cost, if actual historical cost is not available. Donated capital assets are recorded at the estimated fair market value at the date of donation. All purchases and construction costs in excess of $5,000 are capitalized at the date of acquisition or construction, respectively, with expected useful lives of greater than one year. Capital assets (excluding land) are depreciated on a straight-line basis. The estimated useful lives of capital assets are as follows:
EstimatedUseful
Life(in years)
Buildings and improvements………………… 20-40Machinery and equipment…………………… 5-20Vehicles………………………………………… 5-10
Capital Asset Type
The cost of normal maintenance and repairs that do not add to the value of the assets or materially extend asset lives are not capitalized and are treated as expenses when incurred. Improvements are capitalized. Capital asset costs are recorded as expenditures in the acquiring fund in the year of the purchase. H. Deferred Outflows/Inflows of Resources Government-Wide and Fund Financial Statements In addition to assets, the statement of net position will sometimes report a separate section for deferred outflows of resources. This separate financial statement element, deferred outflows of resources, represents a consumption of net position that applies to a future period(s) and so will not be recognized as an outflow of resources (expense/expenditure) until then. The Collaborative did not have any items that qualify for reporting in this category. In addition to liabilities, the statement of net position will sometimes report a separate section for deferred inflows of resources. This separate financial statement element, deferred inflows of resources, represents an acquisition of net position that applies to a future period(s) and so will not be recognized as an inflow of resources (revenue) until that time. The Collaborative currently does not have elements that qualify for reporting in this category.

Notes to Basic Financial Statements Year Ended June 30, 2015
Lower Pioneer Valley Educational Collaborative 46 Comprehensive Annual Financial Report
Governmental Fund Financial Statements In addition to liabilities, the governmental funds balance sheet will sometimes report a separate section for deferred inflows of resources. This separate financial statement element, deferred inflows of resources, represents assets that have been recorded in the governmental fund financial statements but the revenue is not available and so will not be recognized as an inflow of resources (revenue) until it be available. The Collaborative has recorded unavailable revenue as deferred inflows of resources in the governmental funds balance sheet. I. Unavailable Revenue Unavailable revenue at the governmental fund financial statement level represents billed receivables that do not meet the availability criterion in accordance with the current financial resources measurement focus and the modified accrual basis of accounting. Unavailable revenue is recognized as revenue in the conversion to the entity-wide (full accrual) financial statements. J. Interfund Receivables and Payables During the course of its operations, transactions occur between and within individual funds that may result in amounts owed between funds. Fund Financial Statements Transactions of a buyer/seller nature between and within funds are not eliminated from the individual fund statements. Receivables and payables resulting from these transactions are classified as “Due from other funds” or “Due to other funds” on the balance sheet. Government-Wide Financial Statements Transactions of a buyer/seller nature between and within governmental funds are eliminated from the governmental activities in the statement of net position. Any residual balances outstanding between the governmental activities and business-type activities are reported in the statement of net position as “internal balances”. K. Interfund Transfers During the course of its operations, resources are permanently reallocated between and within funds. These transactions are reported as transfers in and transfers out. Government-Wide Financial Statements Transfers within governmental funds are eliminated from the governmental activities in the statement of net activities. Fund Financial Statements Transfers between and within funds are not eliminated from the individual fund statements and are reported as transfers in and transfers out.

Notes to Basic Financial Statements Year Ended June 30, 2015
Lower Pioneer Valley Educational Collaborative 47 Comprehensive Annual Financial Report
L. Net Position and Fund Equity Government-Wide Financial Statements (Net Position) Net position reported as “net investment in capital assets” includes capital assets, net of accumulated depreciation, less the principal balance of outstanding debt used to acquire capital assets. Unspent proceeds of capital related debt are not considered to be capital assets. Net position is reported as restricted when amounts that are not available for appropriation or are legally restricted by outside parties for a specific future use. Sometimes the Collaborative will fund outlays for a particular purpose from both restricted (e.g., restricted bond or grant proceeds) and unrestricted resources. In order to calculate the amounts to report as restricted net position and unrestricted net position in the government-wide and proprietary fund financial statements, a flow assumption must be made about the order in which the resources are considered to be applied. It is the Collaborative’s policy to consider restricted net position to have been depleted before unrestricted net position is applied. Fund Financial Statements (Fund Balances) Governmental fund balances are classified as nonspendable, restricted, committed, assigned, or unassigned based on the extent to which the government is bound to honor constraints on the specific purposes for which amounts in those funds can be spent. The governmental fund balance classifications are as follows: “Nonspendable” fund balance includes amounts that cannot be spent because they are either not in spendable form or they are legally or contractually required to be maintained intact. “Restricted” fund balance includes amounts subject to constraints placed on the use of resources that are either externally imposed by creditors, grantors, contributors, or laws or regulations of other governments; or that are imposed by law through constitutional provisions or enabling legislation. “Committed” fund balance includes amounts that can only be used for specific purposes pursuant to constraints imposed by formal action (vote) of the Board of Directors who are the government’s highest level of decision-making authority. Once adopted, the limitation imposed by the vote remains in place until all the funds are spent or until a similar action is taken to revise or rescind the limitation. “Assigned” fund balance includes amounts that are constrained by the Collaborative’s intent to be used for specific purposes, but are neither restricted nor committed. Fund balance can be assigned by a vote of the Board of Directors. Unlike commitments, assignments are carried over into the next year but any unspent amounts lapse at the end of the next year without any further action required. “Unassigned” fund balance includes the residual classification for the general fund. This classification represents fund balance that has not been assigned to other funds and that has not been restricted, committed, or assigned to specific purposes within the general fund. The Collaborative’s spending policy is to spend restricted fund balance first, followed by committed, assigned and unassigned fund balance. Most governmental funds are designated for one purpose at the time of their creation. Therefore, any expenditure from the fund will be allocated to the applicable fund balance classifications in the order of the aforementioned spending policy. The general fund and certain other funds may have more than one purpose.

Notes to Basic Financial Statements Year Ended June 30, 2015
Lower Pioneer Valley Educational Collaborative 48 Comprehensive Annual Financial Report
M. Pensions For purposes of measuring the net pension liability, deferred outflows of resources and deferred inflows of resources related to pensions, and pension expense, information about the fiduciary net position of both the Massachusetts State Employee Retirement System and the Massachusetts Teachers Retirement System and additions to/deductions from the Systems fiduciary net position have been determined on the same basis as they are reported by the Systems. For this purpose, benefit payments (including refunds of employee contributions) are recognized when due and payable in accordance with the benefit terms. Investments are reported at fair value. N. Long-term Debt Government-Wide and Proprietary Fund Financial Statements Long-term debt is reported as liabilities in the government-wide statement of net position. Material bond premiums and discounts are deferred and amortized over the life of the bonds using the effective interest method. Bonds payable are reported net of the applicable bond premium or discount. Governmental Fund Financial Statements The face amount of governmental funds long-term debt is reported as other financing sources. Bond premiums and discounts, as well as issuance costs, are recognized in the current period. Bond premiums are reported as other financing sources and bond discounts are reported as other financing uses. Issuance costs, whether or not withheld from the actual bond proceeds received, are reported as general government expenditures. O. Investment Income Investment income derived from major and nonmajor governmental funds is legally assigned to the general fund unless otherwise directed by Massachusetts General Law (MGL). P. Compensated Absences Employees are granted vacation and sick leave in varying amounts based on collective bargaining agreements, state laws and executive policies. Government-Wide and Proprietary Fund Financial Statements Vested or accumulated vacation and sick leave are reported as liabilities and expensed as incurred. Governmental Fund Financial Statements Vested or accumulated vacation and sick leave, which will be liquidated with expendable available financial resources, are reported as expenditures and fund liabilities upon maturity of the liability.

Notes to Basic Financial Statements Year Ended June 30, 2015
Lower Pioneer Valley Educational Collaborative 49 Comprehensive Annual Financial Report
Q. Use of Estimates Government-Wide and Fund Financial Statements The preparation of basic financial statements in conformity with GAAP requires management to make estimates and assumptions that affect the reported amounts of assets and liabilities and disclosure for contingent assets and liabilities at the date of the basic financial statements and the reported amounts of the revenues and expenditures/expenses during the year. Actual results could vary from estimates that were used. R. Total Column Government-Wide Financial Statements The total column presented on the government-wide financial statements represents consolidated financial information. Fund Financial Statements The total column on the fund financial statements is presented only to facilitate financial analysis. Data in this column is not the equivalent of consolidated financial information. S. Individual Fund Deficits Several individual fund deficits exist within the special revenue funds. These deficits are anticipated to be funded through available fund balance and program revenues during year 2016. NOTE 2 – CASH AND INVESTMENTS The Collaborative maintains a cash and investment pool that is available for use by all funds. Each fund type's portion of this pool is displayed on the balance sheet as "Cash and Cash Equivalents". Custodial Credit Risk – Deposits In the case of deposits, this is the risk that in the event of a bank failure, the Collaborative’s deposits may not be returned to it. The Collaborative’s investment policy requires all deposits to be insured or collateralized. At year-end, the carrying amount of deposits totaled $1,141,387 and the bank balance totaled $1,268,337. Of the bank balance, $250,000 was covered by Federal Depository Insurance, and $1,018,337 was fully collateralized. The Corporation maintains its cash deposits in one checking account. At June 30, 2015, the Corporation’s carrying balance for deposits and bank balance both totaled $631, all of which was covered by Federal Depositors Insurance. Investments As of June 30, 2015, the Collaborative had an investment of with a fair market value of $4,605,072 in an overnight Repurchase Agreement (REPO). Under the terms of the REPO, the bank collects funds in excess of an agreed upon amount and invests the monies in a REPO. Investments are fully collateralized by U.S. Government securities.

Notes to Basic Financial Statements Year Ended June 30, 2015
Lower Pioneer Valley Educational Collaborative 50 Comprehensive Annual Financial Report
NOTE 3 – RECEIVABLES At June 30, 2015, receivables for the individual major and nonmajor governmental funds, including the applicable allowances for uncollectible accounts, are as follows:
AllowanceGross for Net
Amount Uncollectibles AmountReceivables:
Grants………………………………………… $ 286,362 $ - $ 286,362 Departmental and other……………………… 3,000 - 3,000 Intergovernmental…………………………… 684,299 - 684,299
Total……………………………………………$ 973,661 $ - $ 973,661
At June 30, 2015, receivables for the enterprise funds consist of the following:
AllowanceGross for Net
Amount Uncollectibles AmountReceivables:
Intergovernmental…………………………… $ 309,001 $ - $ 309,001
Governmental funds report unavailable revenue in connection with receivables for revenues that are not considered to be available to liquidate liabilities of the current period. At the end of the current year, the various components of unavailable revenue reported in the governmental funds were as follows:
OtherGovernmental
FundsReceivable type:
Intergovernmental……………………$ 215,803

Notes to Basic Financial Statements Year Ended June 30, 2015
Lower Pioneer Valley Educational Collaborative 51 Comprehensive Annual Financial Report
NOTE 4 – CAPITAL ASSETS Capital asset activity for the Collaborative for the year ended June 30, 2015 was as follows:
Beginning EndingGovernmental Activities: Balance Additions Disposals Balance
Collaborative:Capital assets being depreciated:
Machinery and equipment…………………………………………$ 2,106,469 $ - $ - $ 2,106,469 Vehicles……………………………………………………………… 52,330 79,863 - 132,193
Total capital assets being depreciated……………………… 2,158,799 79,863 - 2,238,662
Less accumulated depreciation for: Machinery and equipment………………………………………… (1,852,403) (70,170) - (1,922,573) Vehicles……………………………………………………………… (13,083) (11,593) - (24,676)
Total accumulated depreciation……………………………… (1,865,486) (81,763) - (1,947,249)
Total Collaborative governmental activities capital assets, net…… 293,313 (1,900) - 291,413
Corporation blended component unit:Capital assets not being depreciated:
Land………………………………………………………………… 2,100,088 - - 2,100,088
Capital assets being depreciated:Buildings and improvements……………………………………… 19,175,231 242,623 - 19,417,854
Less accumulated depreciation for:
Buildings and improvements……………………………………… (5,317,286) (574,225) - (5,891,511)
Total Corporation capital assets being depreciated, net…………… 13,857,945 (331,602) - 13,526,343
Total Corporation capital assets, net………………………………… 15,958,033 (331,602) - 15,626,431
Total Governmental Activities capital assets, net……………………$ 16,251,346 $ (333,502) $ - $ 15,917,844
Beginning EndingBusiness-Type Activities: Balance Additions Disposals Balance
Capital assets being depreciated:Machinery and equipment…………………………………………$ 165,358 $ - $ - $ 165,358 Vehicles……………………………………………………………… 11,232,744 - (415,601) 10,817,143
Total capital assets being depreciated……………………… 11,398,102 - (415,601) 10,982,501
Less accumulated depreciation for:Machinery and equipment………………………………………… (161,421) (3,653) - (165,074) Vehicles……………………………………………………………… (6,726,241) (830,200) 415,601 (7,140,840)
Total accumulated depreciation……………………………… (6,887,662) (833,853) 415,601 (7,305,914)
Total Business-Type Activities capital assets, net…………………$ 4,510,440 $ (833,853) $ - $ 3,676,587
Depreciation expense for governmental activities totaled $655,988 and was unallocated.

Notes to Basic Financial Statements Year Ended June 30, 2015
Lower Pioneer Valley Educational Collaborative 52 Comprehensive Annual Financial Report
Subsequent Events In October, 2015, the Lower Pioneer Valley Educational Corporation purchased an additional garage located in Wilbraham, Massachusetts for $2,120,000. NOTE 5 – INTERFUND RECEIVABLES, PAYABLES, AND TRANSFERS Due to/from other funds Interfund receivables and payables between funds at June 30, 2015, are summarized as follows:
Nonmajor TransportationGovernmental Enterprise
Funds Fund Total
General Fund……………………………$ - $ 1,749,639 $ 1,749,639 (1)Nonmajor Governmental Funds……… 63,005 - 63,005 (1)
Total……………………………………$ 63,005 $ 1,749,639 $ 1,812,644
Receivable:
Payable:
(1) This is a temporary advance between funds for cash flow.
Interfund transfers Interfund transfers for governmental activities totaled $158,779 and were between nonmajor funds. NOTE 6 – CAPITAL LEASES The Collaborative has entered into several lease agreements to finance the acquisition of equipment and vehicles. These lease agreements qualify as capital leases for accounting purposes and, therefore, have been recorded at the present value of their future minimum lease payments as of the inception date. The Governmental leases relate to equipment and technology leased from the Corporation which has been eliminated as the Corporation has been blended with the governmental activities. The Corporation purchased the equipment and technology through long-term notes and is leasing the assets back to the Collaborative through a capital lease.

Notes to Basic Financial Statements Year Ended June 30, 2015
Lower Pioneer Valley Educational Collaborative 53 Comprehensive Annual Financial Report
Governmental Net effect of GovernmentalYears Activities Blending Activities
Ending June 30 Prior to Blending Corporation as Reported
2016……………………………………………………$ 68,903 $ (68,903) $ -
Less: amounts representing interest……………… (4,084) 4,084 -
Present value of minimum lease payments………$ 64,819 $ (64,819) $ -
The Business-type capital leases represent capital leases for vehicles and buses purchased through capital leases for the operation of the transportation enterprise fund. The remaining net value of assets acquired through capital leases totaled $3,606,131. The future minimum lease obligations and the present value of these minimum lease payments for the business-type activities, as of June 30, 2015 are listed below:
Years Business-TypeEnding June 30 Activities
2016……………………………………………………$ 425,608
Less: amounts representing interest……………… (8,263)
Present value of minimum lease payments………$ 417,345
Subsequent Events On July 6, 2015, the Lower Pioneer Valley Educational Corporation entered into a lease agreement for $811,493 for school buses, with a term of 48 months with an interest rate of 1.53%. Lease payments are scheduled to begin on September 4, 2015 and are expected to end on September 4, 2018. NOTE 7 – SHORT-TERM FINANCING Short-term debt may be authorized and issued to fund the following:
• Current operating costs prior to the collection of revenues through issuance of revenue or tax anticipation notes (RANS or TANS).
• Capital project costs and other approved expenditures incurred prior to obtaining permanent financing
through issuance of bond anticipation notes (BANS) or grant anticipation notes (GANS). Short-term loans are general obligations and carry maturity dates that are limited by statute. Interest on short-term borrowings are accounted for in the general fund. The Collaborative had no short-term financing for year 2015.

Notes to Basic Financial Statements Year Ended June 30, 2015
Lower Pioneer Valley Educational Collaborative 54 Comprehensive Annual Financial Report
NOTE 8 – LONG-TERM DEBT State law permits the Collaborative, under the provisions of Chapter 71, Section 16, to authorize indebtedness not to exceed an amount approved by the Board of Directors. Additionally, written notice of the amount of debt authorized and general purpose of the debt must be given to the School Committees in each of the Town’s comprising the Collaborative. The Collaborative had no long-term financing for year 2015. The Corporation had the following long-term financing activity during year 2015:
• The Corporation has a $17,500,000 bond, through the Massachusetts Development Finance Agency, with a variable interest rate based on the adjusted LIBOR rate, ranging from 2.5% to 5.0%. Monthly principal and interest payments range from $42,055 to $72,335. The bond matures in July 2029 and is collateralized by all business assets of the Corporation. The outstanding loan balance totaled $10,608,172 at June 30, 2015.
• Effective June 2006, the bond agreement through the Massachusetts Development Finance Agency was
amended by adding $348,418 to the amount borrowed. Monthly principal payments of $2,903 are required through May 2016. The bond amendment is collateralized by all business assets of the Corporation. The outstanding loan balance for the amendment totaled $34,894 at June 30, 2015.
• The Corporation has a $500,000 note payable bearing interest at 6.3%. Monthly principal payments of
$50,000 plus interest are required through October 2015. The note is collateralized by all business assets of the Corporation. The outstanding loan balance totaled $50,000 at June 30, 2015.
• The Corporation has a $500,000 note payable bearing interest at 4.09%. Monthly principal payments
range from $16,501 to $35,845. The bond matures in 2032 and is collateralized by all business assets of the Corporation. The outstanding loan balance totaled $448,405 at June 30, 2015.
Interest Outstanding OutstandingRate at June 30, at June 30,
Project (%) 2014 Issued Redeemed 2015
Massachusetts Development Bond………………………… variable $ 11,212,828 $ - $ 604,656 $ 10,608,172 Amendment to Massachusetts Development Bond………… variable 69,730 - 34,836 34,894 Equipment Note………………………………………………… 6.30% 100,000 - 50,000 50,000 Agawam Garage Note………………………………………… 4.09% 466,310 - 17,905 448,405
Total bonds payable…………………………………………… $ 11,848,868 $ - $ 707,397 $ 11,141,471

Notes to Basic Financial Statements Year Ended June 30, 2015
Lower Pioneer Valley Educational Collaborative 55 Comprehensive Annual Financial Report
Year Principal Interest (A) Total
2016……………$ 708,201 $ 286,347 $ 994,548 2017…………… 672,980 267,303 940,283 2018…………… 678,234 250,155 928,389 2019…………… 679,078 232,861 911,939 2020…………… 734,956 215,533 950,489 2021…………… 740,872 178,843 919,715 2022…………… 741,825 159,940 901,765 2023…………… 803,923 139,469 943,392 2024…………… 810,512 118,819 929,331 2025…………… 811,590 98,124 909,714 2026…………… 889,129 75,475 964,604 2027…………… 897,246 52,605 949,851 2028…………… 898,464 29,686 928,150 2029…………… 899,732 6,718 906,450 2030…………… 104,473 3,610 108,083 2031…………… 34,411 2,233 36,644 2032…………… 35,845 799 36,644
Total……………$ 11,141,471 $ 2,118,520 $ 13,259,991
(A) Estimated interest subject to change for the variable rate bonds.
Subsequent Events On September 1, 2015, the Lower Pioneer Valley Educational Corporation issued Massachusetts Development Finance Agency Revenue Bonds totaling $12,075,000 with maturities through 2025. Proceeds of the new bonds were used to finance the acquisition of a new garage in Wilbraham, MA and to refinance existing debt through a current refunding. Changes in Long-term Liabilities Long-term liabilities of the Corporation blended component unit are paid from the Corporation using the assessments paid from the Collaborative. Other long-term liabilities related to both governmental and business-type activities are normally paid from the General Fund and the Enterprise Funds, respectively.
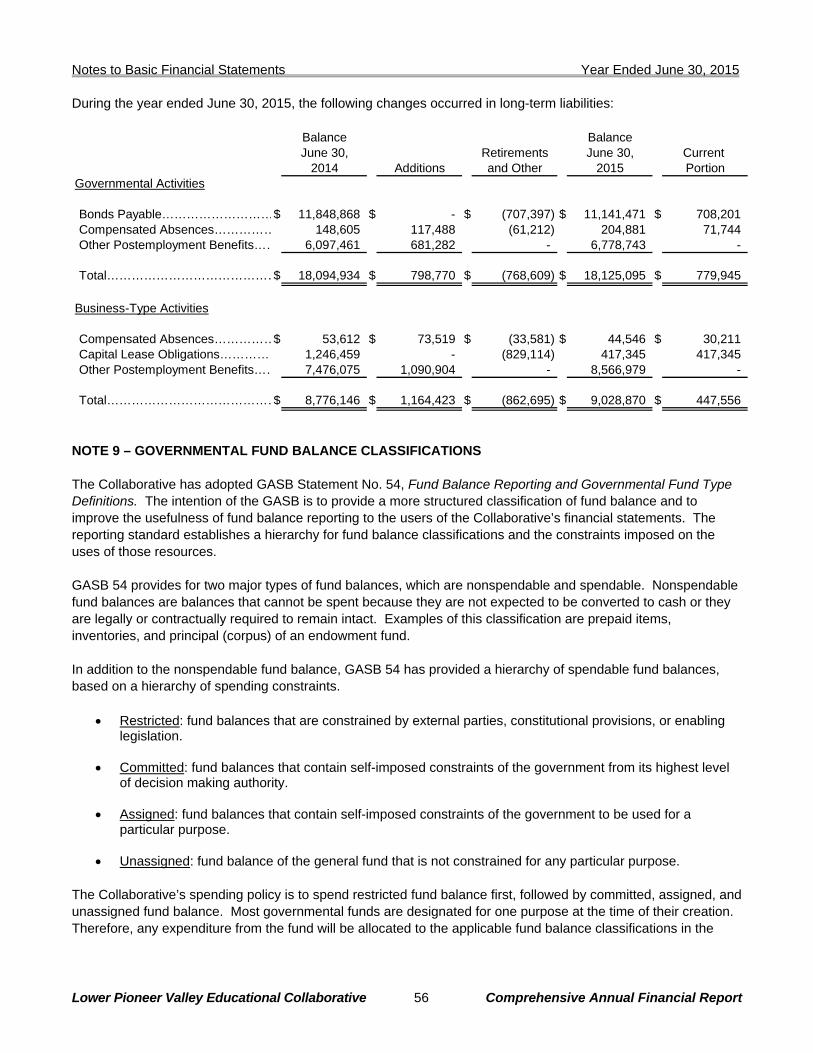
Notes to Basic Financial Statements Year Ended June 30, 2015
Lower Pioneer Valley Educational Collaborative 56 Comprehensive Annual Financial Report
During the year ended June 30, 2015, the following changes occurred in long-term liabilities:
Balance BalanceJune 30, Retirements June 30, Current
2014 Additions and Other 2015 PortionGovernmental Activities
Bonds Payable………………………$ 11,848,868 $ - $ (707,397) $ 11,141,471 $ 708,201 Compensated Absences…………… 148,605 117,488 (61,212) 204,881 71,744 Other Postemployment Benefits…… 6,097,461 681,282 - 6,778,743 -
Total……………………………………$ 18,094,934 $ 798,770 $ (768,609) $ 18,125,095 $ 779,945
Business-Type Activities
Compensated Absences……………$ 53,612 $ 73,519 $ (33,581) $ 44,546 $ 30,211 Capital Lease Obligations…………… 1,246,459 - (829,114) 417,345 417,345 Other Postemployment Benefits…… 7,476,075 1,090,904 - 8,566,979 -
Total……………………………………$ 8,776,146 $ 1,164,423 $ (862,695) $ 9,028,870 $ 447,556
NOTE 9 – GOVERNMENTAL FUND BALANCE CLASSIFICATIONS The Collaborative has adopted GASB Statement No. 54, Fund Balance Reporting and Governmental Fund Type Definitions. The intention of the GASB is to provide a more structured classification of fund balance and to improve the usefulness of fund balance reporting to the users of the Collaborative’s financial statements. The reporting standard establishes a hierarchy for fund balance classifications and the constraints imposed on the uses of those resources. GASB 54 provides for two major types of fund balances, which are nonspendable and spendable. Nonspendable fund balances are balances that cannot be spent because they are not expected to be converted to cash or they are legally or contractually required to remain intact. Examples of this classification are prepaid items, inventories, and principal (corpus) of an endowment fund. In addition to the nonspendable fund balance, GASB 54 has provided a hierarchy of spendable fund balances, based on a hierarchy of spending constraints.
• Restricted: fund balances that are constrained by external parties, constitutional provisions, or enabling legislation.
• Committed: fund balances that contain self-imposed constraints of the government from its highest level of decision making authority.
• Assigned: fund balances that contain self-imposed constraints of the government to be used for a
particular purpose.
• Unassigned: fund balance of the general fund that is not constrained for any particular purpose. The Collaborative’s spending policy is to spend restricted fund balance first, followed by committed, assigned, and unassigned fund balance. Most governmental funds are designated for one purpose at the time of their creation. Therefore, any expenditure from the fund will be allocated to the applicable fund balance classifications in the

Notes to Basic Financial Statements Year Ended June 30, 2015
Lower Pioneer Valley Educational Collaborative 57 Comprehensive Annual Financial Report
order of the aforementioned spending policy. The general fund and certain other funds may have more than one purpose. The general fund is the only fund that reports a positive unassigned fund balance amount. In other governmental funds it is not appropriate to report a positive unassigned fund balance amount. However, in the governmental funds other than the general fund, if expenditures incurred for specific purposes exceed the amounts that are restricted, committed, or assigned to other purposes, it may be necessary to report a negative unassigned fund balance in that fund. As of June 30, 2015, the governmental fund balances consisted of the following:
Nonmajor TotalGovernmental Governmental
General Funds Funds
FUND BALANCESRestricted for:
Other special revenues…………………………$ - $ 297,053 $ 297,053 Assigned to:
Capital projects………………………………… 1,275,000 - 1,275,000 Unassigned……………………………………….. 4,579,328 (18,684) 4,560,644
TOTAL FUND BALANCES………..…………………$ 5,854,328 $ 278,369 $ 6,132,697
GOVERNMENTAL FUNDS
NOTE 10 – ADVANCES AND CREDITS To provide cash flow in lieu of borrowing, the Collaborative routinely bills and accepts payments in advance of services from its member Districts. Periodically, the Collaborative may return a portion of fund balance to a member school district which is then credited to the advances and credits account. The account is reduced as amounts are applied to actual billings for services. The composition of advances and credits of governmental activities as of June 30, 2015 are shown below:
Beginning Increase EndingMember Districts Balance (Decrease) Balance
Town of East Longmeadow…………………………………… $ 128,065 $ (5,751) $ 122,314 Hampden-Wilbraham Regional School District……………… 251,976 (251,580) 396 Town of Ludlow…………………………………………………… 134,200 (94,655) 39,545 Town of Agawam………………………………………………… 258,022 (121,802) 136,220 Town of Longmeadow…………………………………………… 229,649 (172,999) 56,650 Town of West Springfield……………………………………… 295,988 (161,747) 134,241 Southwick-Tolland-Granville Regional School District……… 176,246 (40,000) 136,246
Total……………………………………………………………… $ 1,474,146 $ (848,534) $ 625,612

Notes to Basic Financial Statements Year Ended June 30, 2015
Lower Pioneer Valley Educational Collaborative 58 Comprehensive Annual Financial Report
NOTE 11 – RISK FINANCING Scantic Valley Regional Heath Trust The Collaborative is a member of the Scantic Valley Regional Health Trust (Trust), a public entity risk pool, consisting of four other towns from neighboring geographic area, with whom the Collaborative shares the risk of providing health care to eligible active and former employees. The Collaborative pays monthly premiums to the Trust. These payments are funded in part from the Collaborative, and payroll withholdings from active employees, or direct payments from retired employees. In general, the Collaborative pays 70% of the cost of insurance for active employees and 50% of the cost of insurance for retired and other past employees who may be eligible to participate in the plan. In accordance with the agreement between the Collaborative and the Trust, the Collaborative makes payments to the Trust in the form of monthly premiums based upon actual employee enrollment. The Trust makes payment, through a third-party administrator for actual health claims incurred for the entire Trust. At the end of the Trust’s year, the Trust’s insurance consultant will determine if assets are sufficient to meet the liabilities of the Trust on an accrual and premium rates adjusted to meet the anticipated needs of the ensuing year. It is anticipated that if claim liabilities exceed assets, premium rates will be adjusted prospectively to recover the necessary assets to meet claims. Assets of the Trust, which are in excess of claims computed on an actuarial basis, can be used to reduce prospective premium rates assessed to members. The Trust reported an accumulated surplus of $7,283,739 as of June 30, 2014, (its most recently issued report). Commercial Liability Insurance The Collaborative is exposed to various risks of loss relating to torts; theft or damage of, and destruction of assets, errors or omissions; injuries to employees; and natural disasters. The Collaborative has obtained a variety of commercial liability insurance policies which passes the risk of loss listed above to independent third parties. Settlement claims resulting from these risks have not exceeded commercial insurance coverage in any of the past three years. NOTE 12 – PENSION PLAN Plan Descriptions The Collaborative is a member of the Massachusetts State Employees’ Retirement System (MSERS), a public employee retirement system that administers a cost-sharing multi-employer defined benefit plan covering substantially all employees of the Commonwealth and certain employees of the independent authorities and agencies. The MSERS is part of the Commonwealth’s reporting entity and the audited financial report may be obtained by visiting http://www.mass.gov/osc/publications-and-reports/financial-reports/. The Collaborative is also a member of the Massachusetts Teachers’ Retirement System (MTRS), a cost-sharing multi-employer defined benefit plan. MTRS is managed by the Commonwealth of Massachusetts (Commonwealth) on behalf of municipal teachers and municipal teacher retirees. The Commonwealth is a nonemployer contributor and is responsible for 100% of the contributions and future benefit requirements of the MTRS. The MTRS covers certified teachers in cities (except Boston), towns, regional school districts, charter schools, educational collaboratives and Quincy College. The MTRS is part of the Commonwealth’s reporting entity and the audited financial report may be obtained by visiting http://www.mass.gov/osc/publications-and-reports/financial-reports/.

Notes to Basic Financial Statements Year Ended June 30, 2015
Lower Pioneer Valley Educational Collaborative 59 Comprehensive Annual Financial Report
Special Funding Situations The Commonwealth is a nonemployer contributor and is required by statute to make 100% of all actuarially determined employer contributions on behalf of the Collaborative’s teachers and retired teachers to the MTRS. Therefore, the Collaborative is considered to be in a special funding situation as defined by GASB Statement No. 68, Accounting and Financial Reporting for Pensions and the Commonwealth is a nonemployer contributor in MTRS. Since the Collaborative does not contribute directly to MTRS, the Collaborative does not have a net pension liability. The total of the Commonwealth provided contributions have been allocated based on each employer’s covered payroll to the total covered payroll of employers in MTRS as of the measurement date of June 30, 2014. The Collaborative’s portion of the collective pension expense, contributed by the Commonwealth, of $723,780 is reported in the general fund as intergovernmental revenue and pension expense in the current fiscal year. The portion of the Commonwealth’s collective net pension liability associated with the Collaborative is $10,417,880 as of the measurement date. A special funding situation was created by Massachusetts General Laws for all educational collaboratives in the Commonwealth. Collaboratives contribute amounts equal to the normal cost of non-teaching employees’ benefits at a rate established by the Public Employees’ Retirement Administration Commission (PERAC), currently 5.6% of covered payroll. Legally, the Collaboratives are only responsible for contributing the annual normal cost of their employees’ benefits (i.e., the present value of the benefits earned by those employees in any given year) and are not legally responsible for the past service cost attributable to those employees or previously retired employees of the Collaboratives. Therefore, the Collaborative does not have a net pension liability. The Collaborative’s required contribution to MSERS equaled its actual contribution for the year ended December 31, 2014 was $426,191 and 5.6% of covered payroll. The Commonwealth as a nonemployer is legally responsible for the entire past service cost related to the non-teaching employees’ of the Collaboratives and therefore has a 100% special funding situation. The total of the Commonwealth provided contributions are allocated based on each employer’s covered payroll to the total covered payroll of employers in MSERS as of the measurement date of June 30, 2014. The Collaborative’s portion of the collective pension expense, contributed by the Commonwealth, of $758,423 is reported as intergovernmental revenue and pension expense in the current fiscal year. The portion of the Commonwealth’s collective net pension liability associated with the Collaborative is $10,665,423 as of the measurement date. Benefits Provided Both Systems provide retirement, disability, survivor and death benefits to plan members and beneficiaries. Massachusetts Contributory Retirement System benefits are, with certain minor exceptions, uniform from system to system. The System provides for retirement allowance benefits up to a maximum of 80% of a member's highest three-year average annual rate of regular compensation. For persons who became members on or after April 2, 2012, average salary is the average annual rate of regular compensation received during the five consecutive years that produce the highest average, or, if greater, during the last five years (whether or not consecutive) preceding retirement. Benefit payments are based upon a member's age, length of creditable service, level of compensation, and group classification. Members become vested after ten years of creditable service. Employees who resign from service and who are not eligible to receive a retirement allowance or are under the age of 55 are entitled to request a refund of their accumulated total deductions. Survivor benefits are extended to eligible beneficiaries of members whose death occurs prior to or following retirement. Cost-of-living adjustments granted between 1981 and 1997 and any increase in other benefits imposed by the Commonwealth’s state law during those years are borne by the Commonwealth and are deposited into the
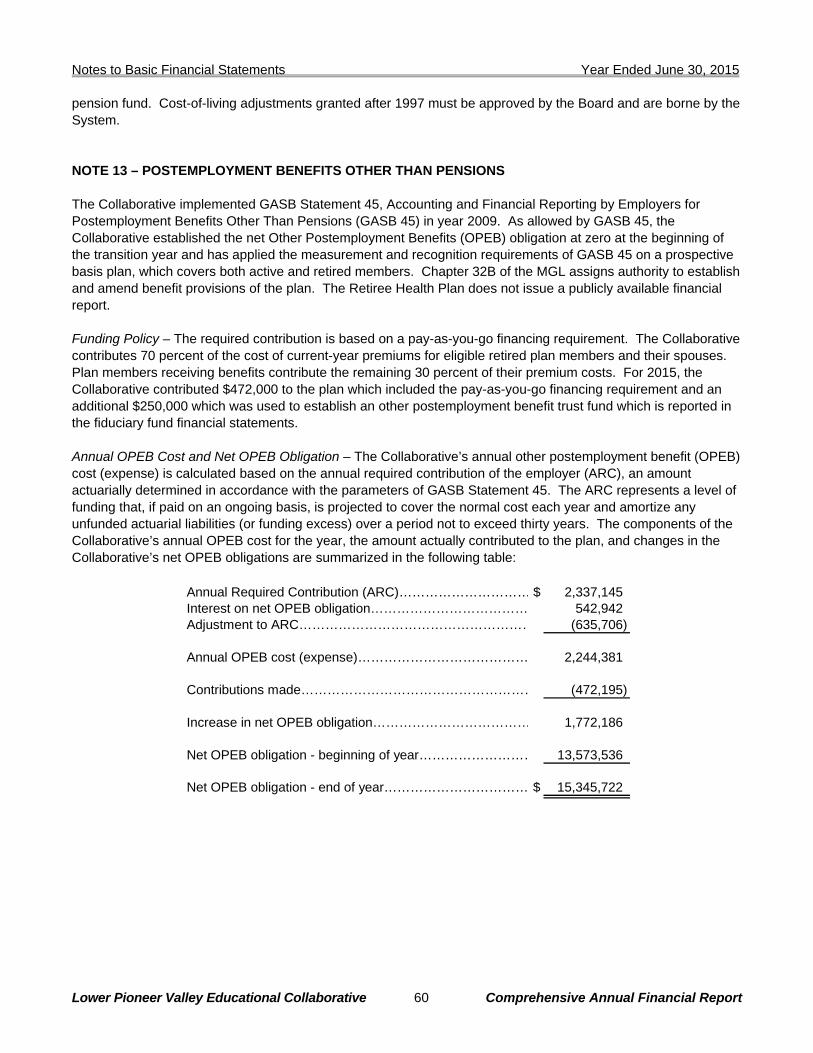
Notes to Basic Financial Statements Year Ended June 30, 2015
Lower Pioneer Valley Educational Collaborative 60 Comprehensive Annual Financial Report
pension fund. Cost-of-living adjustments granted after 1997 must be approved by the Board and are borne by the System. NOTE 13 – POSTEMPLOYMENT BENEFITS OTHER THAN PENSIONS The Collaborative implemented GASB Statement 45, Accounting and Financial Reporting by Employers for Postemployment Benefits Other Than Pensions (GASB 45) in year 2009. As allowed by GASB 45, the Collaborative established the net Other Postemployment Benefits (OPEB) obligation at zero at the beginning of the transition year and has applied the measurement and recognition requirements of GASB 45 on a prospective basis plan, which covers both active and retired members. Chapter 32B of the MGL assigns authority to establish and amend benefit provisions of the plan. The Retiree Health Plan does not issue a publicly available financial report. Funding Policy – The required contribution is based on a pay-as-you-go financing requirement. The Collaborative contributes 70 percent of the cost of current-year premiums for eligible retired plan members and their spouses. Plan members receiving benefits contribute the remaining 30 percent of their premium costs. For 2015, the Collaborative contributed $472,000 to the plan which included the pay-as-you-go financing requirement and an additional $250,000 which was used to establish an other postemployment benefit trust fund which is reported in the fiduciary fund financial statements. Annual OPEB Cost and Net OPEB Obligation – The Collaborative’s annual other postemployment benefit (OPEB) cost (expense) is calculated based on the annual required contribution of the employer (ARC), an amount actuarially determined in accordance with the parameters of GASB Statement 45. The ARC represents a level of funding that, if paid on an ongoing basis, is projected to cover the normal cost each year and amortize any unfunded actuarial liabilities (or funding excess) over a period not to exceed thirty years. The components of the Collaborative’s annual OPEB cost for the year, the amount actually contributed to the plan, and changes in the Collaborative’s net OPEB obligations are summarized in the following table:
Annual Required Contribution (ARC)………………………… $ 2,337,145 Interest on net OPEB obligation……………………………… 542,942 Adjustment to ARC……………………………………………… (635,706)
Annual OPEB cost (expense)………………………………… 2,244,381
Contributions made……………………………………………… (472,195)
Increase in net OPEB obligation……………………………… 1,772,186
Net OPEB obligation - beginning of year……………………… 13,573,536
Net OPEB obligation - end of year…………………………… $ 15,345,722

Notes to Basic Financial Statements Year Ended June 30, 2015
Lower Pioneer Valley Educational Collaborative 61 Comprehensive Annual Financial Report
The Collaborative’s annual OPEB cost, the percentage of annual OPEB cost contributed to the plan, and the net OPEB obligation for year 2015 was as follows:
Percentage ofYear Annual Annual OPEB Net OPEB
Ended OPEB Cost Cost Contributed Obligation
6/30/2015 $ 2,244,381 21.0% $ 15,345,722 6/30/2014 2,127,408 6.5% 13,573,536 6/30/2013 2,615,242 6.2% 11,585,054
Funded Status and Funding Progress – As of July 1, 2013, the most recent actuarial valuation date, the actuarial accrued liability for benefits totaled $16,224,660, all of which was unfunded. The covered payroll (annual payroll of active employees covered by the plan) totaled $9,699,867 and the ratio of the UAAL to the covered payroll was 167.3 percent. Plan membership includes 41 retirees and 234 active employees. Actuarial valuations of an ongoing plan involve estimates of the value of reported amounts and assumptions about the probability of occurrence of events far into the future. Examples include assumptions about future employment, mortality, and the healthcare cost trend. Amounts determined regarding the funded status of the plan and the annual required contributions of the employer are subject to continual revision as actual results are compared with past expectations and new estimates are made about the future. The schedule of funding progress, presented as required supplementary information following the notes to the financial statements, presents multiyear trend information about whether the actuarial value of plan assets is increasing or decreasing over time relative to the actuarial accrued liabilities for benefits. Actuarial Methods and Assumptions – Projections of benefits for financial reporting purposes are based on the substantive plan (the plan as understood by the employer and the plan members) and include the types of benefits provided at the time of each valuation and the historical pattern of sharing of benefit costs between the employer and plan members to that point. The actuarial methods and assumptions used include techniques that are designed to reduce the effects of short-term volatility in actuarial accrued liabilities and the actuarial value of assets, consistent with the long-term perspective of the calculations. In the July 1, 2013, actuarial valuation, actuarial liabilities were determined using the entry age normal method. The actuarial assumptions included a 4% investment return/inflation rate assumption; an annual medical/drug cost trend rate of 8% initially, graded to 5% in 2019; and projected salary increases of 2.5% annually. The UAAL is being amortized over a 30 year closed period, as a level percentage of payroll. The remaining amortization period at June 30, 2015 is 25 years. NOTE 14 – CONTINGENCIES Various legal actions and claims are pending against the Collaborative. Litigation is subject to many uncertainties, and the outcome of individual litigated matters is not always predictable. Although the amount of liability, if any, at June 30, 2015 cannot be ascertained, management believes any resulting liability should not materially affect the financial position at June 30, 2015. NOTE 15 – BLENDED COMPONENT UNIT TRANSACTIONS The Collaborative leases various facilities from the Corporation under operating lease agreements for use in their programs. Rental payments made to the Corporation during 2015 totaled approximately $1,144,180.

Notes to Basic Financial Statements Year Ended June 30, 2015
Lower Pioneer Valley Educational Collaborative 62 Comprehensive Annual Financial Report
During 2015, the Collaborative also remitted reimbursements and lease finance payments to the Corporation totaling $68,903. The Collaborative also contributed for expenditures related to the building repairs project, machine technology construction project, Wilbraham garage expenditures, and other expenditures for $39,869, $75,676, $127,078, and $73, respectively. The Collaborative has restructured the current operating leases with the Corporation, effective July 1, 2014. Under the new terms, all of the operating leases will expire on June 30, 2017, with various options for extensions. Based on the renegotiated operating lease agreements, future operating lease payments to the Corporation will be as follows:
Years Governmental Business-TypeEnding June 30 Activities Activities Total
2016………………………………………………$ 915,000 $ 215,000 $ 1,130,000 2017……………………………………………… 915,000 215,000 1,130,000
Total lease payments……………………………$ 1,830,000 $ 430,000 $ 2,260,000
The effects of all transactions between the governmental activities of the Collaborative and the Corporation have been eliminated through the blending of the component unit with the governmental activities in the government-wide financial statements. NOTE 16 – SUBSEQUENT EVENTS Management has evaluated subsequent events through November 18, 2015, which is the date the financial statements were available to be issued. NOTE 17 – IMPLEMENTATION OF NEW GASB PRONOUNCEMENTS During 2015, the following GASB pronouncement was implemented:
• GASB Statement #67, Financial Reporting for Pension Plans; GASB Statement #68, Accounting and Financial Reporting for Pensions; and GASB Statement #71 Pension Transition for Contributions Made Subsequent to the Measurement Date. Financial statement changes include the recognition of a net pension liability, pension expense and deferred outflows/inflows of resources depending on the nature of the change each year. The financial statements also recognized a restatement of the beginning net position to reflect the net pension liability at the beginning of the year. The notes to the basic financial statements and the required supplementary information were expanded to include additional required schedules and disclosures.
• GASB Statement #69, Governmental Combinations and Disposals of Government Operations. This pronouncement did not impact the basic financial statements.

Notes to Basic Financial Statements Year Ended June 30, 2015
Lower Pioneer Valley Educational Collaborative 63 Comprehensive Annual Financial Report
The following GASB pronouncements will be implemented in the future:
• The GASB issued Statement #72, Fair Value Measurement and Application, which is required to be implemented in 2016.
• The GASB issued Statement #73, Accounting and Financial Reporting for Pensions and Related Assets
That Are Not within the Scope of GASB Statement 68, and Amendments to Certain Provisions of GASB Statements 67 and 68. The provisions of this Statement are effective for 2016—except those provisions that address employers and governmental non-employer contributing entities for pensions that are not within the scope of Statement 68, which is required to be implemented in 2017.
• The GASB issued Statement #74, Financial Reporting for Postemployment Benefit Plans Other Than Pension Plans, which is required to be implemented in 2017.
• The GASB issued Statement #75, Accounting and Financial Reporting for Postemployment Benefits Other Than Pensions, which is required to be implemented in 2018.
• The GASB issued Statement #76, The Hierarchy of Generally Accepted Accounting Principles for State and Local Governments, which is required to be implemented in 2016.
• The GASB issued Statement #77, Tax Abatement Disclosures, which is required to be implemented in 2017.
Management is currently assessing the impact the implementation of these pronouncements will have on the basic financial statements.

Lower Pioneer Valley Educational Collaborative 64 Comprehensive Annual Financial Report
Required Supplementary Information

Lower Pioneer Valley Educational Collaborative 65 Comprehensive Annual Financial Report
This page intentionally left blank.
Required Supplementary Information

ActualOriginal Budget Final Budgetary Variance toBudget Adjustments Budget Amounts Final Budget
Administration:General Administration:
Use of Unreserved Fund Balance………………………… $ - $ 491,009 $ 491,009 $ 491,009 $ - Interest and other miscellaneous…………………………… - - - 2,852 2,852
Administration Coordination…………………………………… - - - - - Fringe Benefits…………………………………………….…… - - - - -
Administration Costs Applied to Other Programs………… - - - - -
Total Administration, Net…………………………………… - 491,009 491,009 493,861 2,852
Special Education: Grouped Programs:
Elementary Secondary……………………………………… 167,989 - 167,989 180,637 12,648 Career Skills………………………………………………… 241,973 - 241,973 280,411 38,438 Secondary Development…………………………………… 229,354 - 229,354 161,133 (68,221) Secondary Skills Program…………………………………… 196,281 - 196,281 141,365 (54,916) Summer School - Career Preparation……………………… 267,628 - 267,628 325,928 58,300 Twain Alternative High School……………………………… 513,732 - 513,732 438,096 (75,636) Vocational Preparation……………………………………… 289,172 - 289,172 284,536 (4,636)
Total Grouped Programs……………………………… 1,906,129 - 1,906,129 1,812,106 (94,023)
Individual Programs:
Asperger……………………………………………………… 423,967 - 423,967 446,352 22,385 Autism………………………………...……………………… 452,226 - 452,226 445,108 (7,118) Integrated Occupational Preparation……………………… 614,093 - 614,093 651,404 37,311 Transitional Alternative……………………………………… 148,144 - 148,144 109,800 (38,344) Brush Hill Academy………………………………………… 566,767 - 566,767 311,971 (254,796)
Total Individual Programs……………………………… 2,205,197 - 2,205,197 1,964,635 (240,562)
Shared Services:
Coordination………………………………………………… - - - 15 15 Costs Applied to Other Programs……………………… - - - - -
Coordination, Net…………………………………… - - - 15 15
Nurses………………………………………………………… - - - - -
Costs Applied to Other Programs……………………… - - - - -
Nurses, Net…………………………………………… - - - - -
Adaptive Physical Education………………………………… - - - - - Costs Applied to Other Programs……………………… - - - - -
Adaptive Physical Education, Net………………… - - - - -
Total Shared Services…………………………… - - - 15 15
Total Special Education……………………… 4,111,326 - 4,111,326 3,776,756 (334,570)
Budgeted Amounts
GENERAL FUNDSCHEDULE OF REVENUES, EXPENDITURES AND CHANGES IN FUND BALANCE -
BUDGET AND ACTUAL
YEAR ENDED JUNE 30, 2015
Revenues and Other Financing Sources
Lower Pioneer Valley Educational Collaborative 66 Comprehensive Annual Financial Report

Actual Actual NetOriginal Budget Final Budgetary Variance to Changes inBudget Adjustments Budget Amounts Final Budget Fund Balance
$ - $ 491,009 $ 491,009 $ 491,009 $ - $ - - - - - - 2,852
1,230,610 (1,230,610) - 1,169,368 (1,169,368) (1,169,368) 3,254,361 (3,254,361) - 3,049,985 (3,049,985) (3,049,985)
(4,484,971) 4,484,971 - (4,365,016) 4,365,016 4,365,016
- 491,009 491,009 345,346 145,663 148,515
167,989 - 167,989 141,219 26,770 39,418 241,973 - 241,973 243,624 (1,651) 36,787 229,354 - 229,354 215,710 13,644 (54,577) 196,281 - 196,281 197,673 (1,392) (56,308) 267,628 - 267,628 260,957 6,671 64,971 513,732 - 513,732 494,667 19,065 (56,571) 289,172 - 289,172 283,928 5,244 608
1,906,129 - 1,906,129 1,837,778 68,351 (25,672)
423,967 - 423,967 418,917 5,050 27,435 452,226 - 452,226 406,974 45,252 38,134 614,093 - 614,093 578,634 35,459 72,770 148,144 - 148,144 144,328 3,816 (34,528) 566,767 - 566,767 567,164 (397) (255,193)
2,205,197 - 2,205,197 2,116,017 89,180 (151,382)
1,305,761 (1,305,761) - 1,237,440 (1,237,440) (1,237,425) (1,305,761) 1,305,761 - (1,305,764) 1,305,764 1,305,764
- - - (68,324) 68,324 68,339
103,454 (103,454) - 71,802 (71,802) (71,802) (103,454) 103,454 - (103,456) 103,456 103,456
- - - (31,654) 31,654 31,654
200,318 (200,318) - 194,298 (194,298) (194,298) (200,318) 200,318 - (190,994) 190,994 190,994
- - - 3,304 (3,304) (3,304)
- - - (96,674) 96,674 96,689
4,111,326 - 4,111,326 3,857,121 254,205 (80,365)
(continued)
Budgeted Amounts
Expenditures and Other Financing Uses
Lower Pioneer Valley Educational Collaborative 67 Comprehensive Annual Financial Report

ActualOriginal Budget Final Budgetary Variance toBudget Adjustments Budget Amounts Final Budget
Budgeted Amounts
GENERAL FUNDSCHEDULE OF REVENUES, EXPENDITURES AND CHANGES IN FUND BALANCE -
BUDGET AND ACTUAL
YEAR ENDED JUNE 30, 2015
Revenues and Other Financing Sources
Occupational Education: Tuition Allocated to Occupational Education Programs……… 4,687,806 - 4,687,806 4,731,885 44,079 Coordination……………………………………………………… - - - - - Nursing……………………..…………………………………… - - - - - Allied Health……………………………………………………… - - - - - Automotive……………………………………………………… - - - - - Building Trades………………………………………………… - - - - - Information Services Systems………………………………… - - - - - Design and Visual Communications…………………………… - - - - - Early Education………………………………………………… - - - - - Fashion Design………………………………………………… - - - - - Food Services…………………………………………………… - - - - - Graphic Arts……………………………………………………… - - - - - Landscaping and Horticultural………………………………… - - - - - Building and Grounds Maintenance…………………………… - - - - - Technical Exploratory…………………………………………… - - - - - Vocational Guidance…………………………………………… - - - - - Cosmetology……………………………………………………… - - - - - Cooperative Education………………………………………… - - - - -
Total Occupational Education……………………………… 4,687,806 - 4,687,806 4,731,885 44,079
Supplemental Services:
Individual Aides………………………………………………… 377,640 - 377,640 446,121 68,481 Massachusetts Association of
School Business Officials (MASBO)……………………… 6,000 - 6,000 5,550 (450) Medicaid………………………………………………………… 422,582 - 422,582 424,548 1,966 Summer Developmental………………………………………… 96,276 - 96,276 104,930 8,654 Maintenance……………………………………………………… - - - - -
Maintenance Applied to Other Programs………………… - - - - - Technical Support……………………………………………… - - - - -
Technical Support Applied to Other Programs…………… - - - - - Contracted Therapy Services………………………………… 304,835 - 304,835 320,836 16,001 Supplemental Services………………………………………… 40,000 - 40,000 123,957 83,957 SBC……………………………………………………………… 244,607 - 244,607 261,580 16,973 Energy Management…………………………………………… 93,089 - 93,089 102,794 9,705 Innovative Research in Education……………………………. 207,176 - 207,176 113,117 (94,059)
Total Supplemental Services……………………………… 1,792,205 - 1,792,205 1,903,433 111,228
Professional Development:
General Operations……………………………………………… - - - - - Professional Development Applied to Other Programs… - - - - -
Total Professional Development, Net………………… - - - - -
Other Financing Sources and Uses:Transfers out……………………………………………………… - - - - - Use of available fund balance as a revenue source………… - - - (491,009) (491,009)
Total Other Financing Sources and Uses………………… - - - (491,009) (491,009)
NET CHANGE IN FUND BALANCE……………………………………$ 10,591,337 $ 491,009 $ 11,082,346 $ 10,414,926 $ (667,420)
BUDGETARY FUND BALANCE, Beginning of year…………………
BUDGETARY FUND BALANCE, End of year…………………………
See notes to required supplementary information.
Lower Pioneer Valley Educational Collaborative 68 Comprehensive Annual Financial Report

Actual Actual NetOriginal Budget Final Budgetary Variance to Changes inBudget Adjustments Budget Amounts Final Budget Fund Balance
Budgeted Amounts
Expenditures and Other Financing Uses
- - - - - 4,731,885 2,409,216 - 2,409,216 2,412,584 (3,368) (2,412,584)
56,215 - 56,215 46,817 9,398 (46,817) 288,393 - 288,393 281,124 7,269 (281,124) 201,739 - 201,739 192,172 9,567 (192,172) 164,466 - 164,466 160,684 3,782 (160,684) 165,208 - 165,208 162,346 2,862 (162,346) 80,429 - 80,429 73,836 6,593 (73,836) 49,761 - 49,761 48,006 1,755 (48,006)
112,923 - 112,923 112,069 854 (112,069) 250,236 - 250,236 240,516 9,720 (240,516) 169,914 - 169,914 163,234 6,680 (163,234) 129,391 - 129,391 153,513 (24,122) (153,513) 109,940 - 109,940 108,597 1,343 (108,597) 29,925 - 29,925 29,326 599 (29,326)
170,360 - 170,360 168,430 1,930 (168,430) 219,692 - 219,692 219,226 466 (219,226) 79,998 - 79,998 78,530 1,468 (78,530)
4,687,806 - 4,687,806 4,651,010 36,796 80,875
377,640 - 377,640 414,178 (36,538) 31,943
6,000 - 6,000 4,209 1,791 1,341 422,582 - 422,582 409,000 13,582 15,548 96,276 - 96,276 67,554 28,722 37,376
177,582 (177,582) - 148,210 (148,210) (148,210) (177,582) 177,582 - (177,582) 177,582 177,582 174,279 (174,279) - 171,759 (171,759) (171,759)
(174,279) 174,279 - (174,279) 174,279 174,279 304,835 - 304,835 312,339 (7,504) 8,497 40,000 - 40,000 123,957 (83,957) -
244,607 - 244,607 243,085 1,522 18,495 93,089 - 93,089 91,667 1,422 11,127
207,176 - 207,176 192,075 15,101 (78,958)
1,792,205 - 1,792,205 1,826,172 (33,967) 77,261
90,764 (90,764) - 20,207 (20,207) (20,207) (90,764) 90,764 - (90,764) 90,764 90,764
- - - (70,557) 70,557 70,557
- - - - - - - - - - - (491,009)
- - - - - (491,009)
$ 10,591,337 $ 491,009 $ 11,082,346 $ 10,609,092 $ 473,254 (194,166)
6,048,494
$ 5,854,328
(concluded)
Lower Pioneer Valley Educational Collaborative 69 Comprehensive Annual Financial Report

Lower Pioneer Valley Educational Collaborative 70 Comprehensive Annual Financial Report
Collaborative Pension Plan Schedules Collaborative pension plan schedules The Schedule of the Special Funding Amounts of the Net Pension Liability for the Massachusetts State Employees Retirement System presents multi-year trend information on the liability and expense assumed by the Commonwealth of Massachusetts on behalf of the Collaborative along with related ratios. The Schedule of the Special Funding Amounts of the Net Pension Liability for the Massachusetts Teachers Retirement System presents multi-year trend information on the liability and expense assumed by the Commonwealth of Massachusetts on behalf of the Collaborative along with related ratios. The Schedule of Collaborative’s Contributions presents multi-year trend information on the Collaborative’s required and actual contributions to the pension plan and related ratios. These schedules are intended to present information for ten years. Until a ten year trend is compiled, information is presented for those years for which information is available.

Fiscal Year
LPVEC's Statutory
Required and Actual
Contribution for Normal Cost
LPVEC's Covered Payroll
The Amount of Contributions
Recognized by the Pension Plan in Relation to the Covered Payroll
2015…………………………………………$ 426,191 $ 7,610,554 5.60%
Note: this schedule is intended to present information for 10 years.Until a 10-year trend is compiled, information is presented for those years forwhich information is available.
See notes to required supplementary information.
SCHEDULE OF CONTRIBUTIONSMASSACHUSETTS STATE EMPLOYEES' RETIREMENT SYSTEM
A special funding situation was created by Massachusetts General Laws for all educational collaboratives in the Commonwealth. Collaboratives contribute amounts equal to the normal cost of employees’ benefits at a rate established by PERAC, currently 5.6% of covered payroll. Legally, the collaboratives are only responsible for contributing the annual normal cost of their employees’ benefits (i.e., the present value of the benefits earned by those employees in any given year) and are not legally responsible for the past service cost attributable to those employees or previously retired employees of the collaboratives. The Commonwealth as a nonemployer is legally responsible for the entire past service cost related to the collaboratives and therefore has a 100% special funding situation. Since the collaborative does not contribute directly to MSERS for the past service cost, there is no net pension liability to recognize. This schedule discloses the collaborative's required and actual contribution for the normal cost; covered payroll; and contributions recognized by the pension plan in relation to the covered payroll.
Lower Pioneer Valley Educational Collaborative 71 Comprehensive Annual Financial Report

Fiscal Year
Commonwealth's 100% Share of the
Net Pension Liability Associated with
LPVEC
LPVEC's Expense and
Revenue Recognized for
the Commonwealth's
Support
Plan Fiduciary Net Position as a Percentage of
the Total Liability
2015……………………………………………………$ 10,665,423 $ 758,423 76.32%
Note: this schedule is intended to present information for 10 years.Until a 10-year trend is compiled, information is presented for those years forwhich information is available.
See notes to required supplementary information.
SCHEDULE OF THE SPECIAL FUNDING AMOUNTSOF THE NET PENSION LIABILITY
MASSACHUSETTS STATE EMPLOYEES' RETIREMENT SYSTEM
The Collaborative's teachers and retired teachers pensions are covered under the Massachusetts Teachers Retirement System while all other employees and retirees are covered under the Massachusetts State Employees Retirement System. This schedule only reports on the non teacher employees and retirees covered under the Massachusetts State Employees Retirement System.
A special funding situation was created by Massachusetts General Laws for all educational collaboratives in the Commonwealth. Collaboratives contribute amounts equal to the normal cost of employees’ benefits at a rate established by PERAC, currently 5.6% of covered payroll. Legally, the collaboratives are only responsible for contributing the annual normal cost of their employees’ benefits (i.e., the present value of the benefits earned by those employees in any given year) and are not legally responsible for the past service cost attributable to those employees or previously retired employees of the collaboratives. The Commonwealth as a nonemployer is legally responsible for the entire past service cost related to the collaboratives and therefore has a 100% special funding situation. Since the collaborative does not contribute directly to MSERS for the past service cost, there is no net pension liability to recognize. This schedule discloses the Commonwealth's 100% share of the collective net pension liability that is associated with the collaborative; the portion of the collective pension expense as both a revenue and pension expense recognized by the collaborative; and the Plan's fiduciary net position as a percentage of the total liability.
Lower Pioneer Valley Educational Collaborative 72 Comprehensive Annual Financial Report

Fiscal Year
Commonwealth's 100% Share of the
Net Pension Liability
Associated with the LPVEC
LPVEC's Expense and Revenue
Recognized for the
Commonwealth's Support
Plan Fiduciary Net Position as a
Percentage of the Total Liability
2015………………………………… $ 10,417,880 $ 723,780 61.64%
Note: this schedule is intended to present information for 10 years.Until a 10-year trend is compiled, information is presented for those years forwhich information is available.
See notes to required supplementary information.
SCHEDULE OF THE SPECIAL FUNDING AMOUNTSOF THE NET PENSION LIABILITY
MASSACHUSETTS TEACHERS' RETIREMENT SYSTEM
The Collaborative's teachers and retired teachers pensions are covered under the Massachusetts Teachers Retirement System while all other employees and retirees are covered under the Massachusetts State Employees Retirement System. This schedule only reports on the teacher and retired teachers covered under the Massachusetts Teachers' Retirement System.
The Commonwealth of Massachusetts is a nonemployer contributor and is required by statute to make all actuarially determined employer contributions on behalf of the member employers which creates a special funding situation. Since the collaborative does not contribute directly to MTRS, there is no net pension liability to recognize. This schedule discloses the Commonwealth's 100% share of the collective net pension liability that is associated with the collaborative; the portion of the collective pension expense as both a revenue and pension expense recognized by the collaborative; and the Plan's fiduciary net position as a percentage of the total liability.
Lower Pioneer Valley Educational Collaborative 73 Comprehensive Annual Financial Report

Lower Pioneer Valley Educational Collaborative 74 Comprehensive Annual Financial Report
Other Postemployment Benefits Plan Schedules
Other postemployment benefits plan schedules The Schedule of Funding progress compares, over time, the actuarial accrued liability for benefits with the actuarial value of accumulated plan assets. The Schedule of Employer Contributions presents multiyear trend information for required and actual contributions related to the plan. The Schedule of Actuarial Methods and Assumptions presents factors that significantly affect the identification of trends in the amounts reported.

SCHEDULE OF FUNDING PROGRESS AND EMPLOYER CONTRIBUTIONS
Actuarial UAAL as aActuarial Accrued Unfunded Percentage
Actuarial Value of Liability (AAL) AAL Funded Covered of CoveredValuation Assets Entry Age Normal (UAAL) Ratio Payroll Payroll
Date (A) (B) (B-A) (A/B) (C) ((B-A)/C)
7/1/2013 $ - $ 16,224,660 $ 16,224,660 0% $ 9,699,867 167.3%7/1/2011 - 23,376,661 23,376,661 0% 8,995,595 259.9%
12/31/2009 - 21,395,988 21,395,988 0% 11,620,462 184.1%12/31/2007 - 17,871,412 17,871,412 0% 10,720,941 166.7%
Fiscal Annual ActualYear Required Contributions Percentage
Ended Contribution Made Contributed
6/30/2015 $ 2,337,145 $ 472,195 20.2%6/30/2014 2,196,466 138,926 6.3%6/30/2013 2,112,822 161,403 7.6%
See notes to required supplementary information.
OTHER POSTEMPLOYMENT BENEFIT PLAN
Schedule of Funding Progress
Schedule of Employer Contributions
Lower Pioneer Valley Educational Collaborative 75 Comprehensive Annual Financial Report

ACTUARIAL METHODS AND ASSUMPTIONS
Actuarial Methods:
Valuation date………………………………………… July 1, 2013 Actuarial cost method………………………………… Costs are based on the entry age normal method.Amortization method………………………………… Amortization is based on payments increasing at 4%Remaining amortization period……………………… 26 years, closedAsset valuation method……………………………… Market value
Actuarial Assumptions:
Investment rate of return……………………………… 4.00% Medical/drug cost trend rate………………………… 8.0% decreasing to an ultimate level of 5% in 2019. Annual payroll increase……………………………… 2.50%
Plan Membership:
Current retirees, beneficiaries, and dependents…… 41 Current active members……………………………… 234
Total…………………………………………………… 275
See notes to required supplementary information.
OTHER POSTEMPLOYMENT BENEFIT PLAN
Lower Pioneer Valley Educational Collaborative 76 Comprehensive Annual Financial Report

Notes to Required Supplementary Information Year Ended June 30, 2015
Lower Pioneer Valley Educational Collaborative 77 Comprehensive Annual Financial Report
NOTE A – STEWARDSHIP, COMPLIANCE AND ACCOUNTABILITY Notes to required supplementary information A. Budgetary Information The Collaborative adopts a balanced budget that is approved by the District Board. The Director of Finance presents an annual budget to the Board, which includes estimates of revenues and other financing sources and recommendations of expenditures and other financing uses. The Board, which has the full authority to amend and/or reject the budget or any line item, adopts the expenditure budget by majority vote. Increases to the budget subsequent to the approval of the annual budget require majority Board approval. The majority of appropriations are non-continuing which lapse at the end of each year. Others are continuing appropriations for which the governing body has authorized that an unspent balance from a prior year be carried forward and made available for spending in the current year. These carry forwards are included as part of the subsequent year’s original budget. The Collaborative adopts an annual budget for the General Fund in conformity with the guidelines described above. The original year 2015 approved budget for the General Fund authorized approximately $11,018,600 in appropriations. Additions to the budget of $1.7 million made by the Board were funded by the use of prior year fund balance. The Collaborative’s accounting office has the responsibility to ensure that budgetary control is maintained. Budgetary control is exercised through the Collaborative’s accounting system. B. Budgetary - GAAP Reconciliation For budgetary financial reporting purposes, a budgetary basis of accounting is followed, which differs from the GAAP basis of accounting. For the year ended June 30, 2015, there were no net differences between the budgetary and GAAP basis of accounting for the Collaborative. NOTE B – PENSION PLAN Pension Plan Schedules A. Schedule of Collaborative’s Contributions A special funding situation was created by Massachusetts General Laws for all Educational Collaboratives in the Commonwealth. Collaboratives contribute amounts equal to the normal cost of non-teaching employees’ benefits at a rate established by the Public Employees’ Retirement Administration Commission (PERAC), currently 5.6% of covered payroll. Legally, the collaboratives are only responsible for contributing the annual normal cost of their employees’ benefits (i.e., the present value of the benefits earned by those employees in any given year) and are not legally responsible for the past service cost attributable to those employees or previously retired employees of the Collaboratives.

Notes to Required Supplementary Information Year Ended June 30, 2015
Lower Pioneer Valley Educational Collaborative 78 Comprehensive Annual Financial Report
B. Schedules of the Special Funding Amounts of the Net Pension Liabilities The Commonwealth of Massachusetts is a nonemployer contributor and is required by statute to make all actuarially determined employer contributions on behalf of the Collaborative which create two special funding situations.
• The MSERS schedule discloses the Commonwealth's 100% share of the collective net pension liability that is associated with the Collaborative; the portion of the collective pension expense as both revenue and pension expense recognized by the Collaborative; and the Plan's fiduciary net position as a percentage of the total liability.
• The MTRS schedule discloses the Commonwealth's 100% share of the collective net pension liability that
is associated with the Collaborative; the portion of the collective pension expense as both revenue and pension expense recognized by the Collaborative; and the Plan's fiduciary net position as a percentage of the total liability.
NOTE C – POSTEMPLOYMENT BENEFITS OTHER THAN PENSIONS The Collaborative administers a single-employer defined benefit healthcare plan (“the Retiree Health Plan”). The plan provides lifetime healthcare, dental and life insurance for eligible retirees and their spouses through the Collaborative’s health insurance plan, which covers both active and retired members, including teachers. The Collaborative currently finances its other postemployment benefits (OPEB) on a pay-as-you-go basis. As a result, the funded ratio (actual value of assets expressed as a percentage of the actuarial accrued liability) is 0%. In accordance with Governmental Accounting Standards, the Collaborative has recorded its OPEB cost equal to the actuarial determined annual required contribution (ARC) which includes the normal cost of providing benefits for the year and a component for the amortization of the total unfunded actuarial accrued liability of the plan. The Schedule of Funding Progress presents multi-year trend information which compares, over time, the actuarial accrued liability for benefits with the actuarial value of accumulated plan assets. Projections of benefits for financial reporting purposes are based on the substantive plan and included the types of benefits provided at the time of each valuation and the historical pattern of sharing of benefit cost between the employer and plan members to that point. The actuarial methods and assumptions used include techniques that are designed to reduce the effects of short-term volatility in actuarial accrued liabilities and the actuarial value of assets, consistent with the long-term perspective of the calculations. The Schedule of Actuarial Methods and Assumptions presents factors that significantly affect the identification of trends in the amounts reported.

Lower Pioneer Valley Educational Collaborative 79 Comprehensive Annual Financial Report
Other Supplementary Information Other Supplementary Information

Lower Pioneer Valley Educational Collaborative 80 Comprehensive Annual Financial Report
This page intentionally left blank.

Lower Pioneer Valley Educational Collaborative 81 Comprehensive Annual Financial Report
Combining and Individual Fund Statements
Combining and Individual Fund Statements

Lower Pioneer Valley Educational Collaborative 82 Comprehensive Annual Financial Report
Nonmajor Governmental Funds Nonmajor governmental funds Special Revenue Funds Special revenue funds are used to account for specific revenues that are legally restricted to expenditure for particular purposes. Brush Hill Bistro – This culinary arts program prepares students for careers in hotels, restaurants, resorts, institutions and corporations. Students operate a fully equipped commercial kitchen and dining room encompassing restaurant, banquet, and buffet services through the two student run restaurants: the morning Java Café, serving breakfast, and the Brush Hill Bistro, serving lunch, which are open to the general public two days a week. This fund is used to account for sales generated through these restaurants. Early Education and Care Program – The Early Education and Care (EEC) program is new to the Collaborative in 2015. Students in this program will experience a combination of classroom instruction and hands on experience with children from ages 6 weeks through 6 years of age. Students will also understand and be familiar with many aspects of child development from infancy through elementary school years. The students who are in the EEC program use the Early Learning Center as their work-related experience to receive licensure as an Early Education and Care provider. The Early Learning Center is a part of the Collaborative, and is licensed by the Massachusetts Department of Early Education and Care. Landscaping – This program offers a comprehensive competency based course that explores career areas in landscape maintenance, construction and design, greenhouse production, nursery production, floriculture, and retail garden center operation. This fund is used to account for sales generated through residential landscaping projects, greenhouse sales, and floral projects. School Lunch – This fund is used to account for all cafeteria activities and is funded by user charges. School Store – This fund is used to account for all school store activities and is funded by sales from the school store. Building Rental – This fund is used to account for school space leased to the Preschool Enrichment Team. Rental income is used to offset rental fees paid to the Corporation and associated utility costs. Graphic Communication – This program prepares students for a wide range of career opportunities in the graphic arts and communications industry. This fund is used to account for shop sales generated from this program. Professional Development – This fund is used to account for professional development programs offered through the Collaborative. Other Revolving - This fund is used to account for other nonmajor revolving funds. Grants – This fund is used to account for the educational programs specifically financed by federal, state, and other grants which are designed for specific programs.

Lower Pioneer Valley Educational Collaborative 83 Comprehensive Annual Financial Report
This page intentionally left blank.

Brush Hill Early Education SchoolBistro and Care Landscaping Lunch
ASSETSCash and cash equivalents……………………………………………… $ 18,952 $ - $ 29,461 $ 12,535 Receivables, net of allowance for uncollectibles:
Grants receivable…………………………………………………… - - - Departmental and other……………………………………………… - - - -
Due from other funds…………………………………………………… - - - -
TOTAL ASSETS………………………………………………………… $ 18,952 $ - $ 29,461 $ 12,535
LIABILITIESAccounts payable…………………………………………………… $ - $ 598 $ - $ 75 Other accrued expenses…………………………………………… - 10,617 - - Other liabilities………………………………………………………… - - - - Due to other funds…………………………………………………… - 7,469 - -
TOTAL LIABILITIES……………………………………………………… - 18,684 - 75
DEFERRED INFLOWS OF RESOURCESUnavailable revenues………………………………………………… - - - -
FUND BALANCESRestricted……………………………………………………………… 18,952 - 29,461 12,460 Unassigned…………………………………………………………… - (18,684) - -
TOTAL FUND BALANCES……………………………………………… 18,952 (18,684) 29,461 12,460
TOTAL LIABILITIES, DEFERRED INFLOWS OF RESOURCES,AND FUND BALANCES……………………………………………… $ 18,952 $ - $ 29,461 $ 12,535
(continued)
NONMAJOR GOVERNMENTAL FUNDSCOMBINING BALANCE SHEET
JUNE 30, 2015
Special Revenue Funds
Lower Pioneer Valley Educational Collaborative 84 Comprehensive Annual Financial Report

TotalNonmajor
School Building Graphic Professional Other GovernmentalStore Rental Communication Development Revolving Grants Funds
$ 2,129 $ 99,443 $ 6,107 $ 48,534 $ 14,119 - $ 231,280
- - - - - 286,362 286,362 - - - - 3,000 - 3,000 - 63,005 - - - - 63,005
$ 2,129 $ 162,448 $ 6,107 $ 48,534 $ 17,119 286,362 $ 583,647
$ - $ - $ - $ - $ 157 15,023 $ 15,853 - - - - - - 10,617 - - - - - - - - - - - - 55,536 63,005
- - - - 157 70,559 89,475
- - - - - 215,803 215,803
2,129 162,448 6,107 48,534 16,962 - 297,053 - - - - - - (18,684)
2,129 162,448 6,107 48,534 16,962 - 278,369
$ 2,129 $ 162,448 $ 6,107 $ 48,534 $ 17,119 286,362 $ 583,647
(concluded)
Special Revenue Funds
Lower Pioneer Valley Educational Collaborative 85 Comprehensive Annual Financial Report

Brush Hill Early Education SchoolBistro and Care Landscaping Lunch
REVENUES: Member district assessments………………………………………… $ - $ - $ - $ - Intergovernmental……………………………………….…………… - - - - Departmental and other……………………………………………… 11,712 84,647 12,735 30,986
TOTAL REVENUES…………………………………………… 11,712 84,647 12,735 30,986
EXPENDITURES:
Current: Special education………………………………………………… - - - - Occupational education…………………………………………… - - - - Supplemental services…………………………………………… 5,634 96,878 7,981 23,527 Professional development………………………………………… - - - -
TOTAL EXPENDITURES……………………………………… 5,634 96,878 7,981 23,527
EXCESS (DEFICIENCY) OF REVENUES OVER (UNDER) EXPENDITURES………………………………… 6,078 (12,231) 4,754 7,459
OTHER FINANCING SOURCES (USES):
Transfers in…………………………………………………………… - - - 6,749 Transfers out…………………………………………………………… - - - -
TOTAL OTHER FINANCING SOURCES (USES)………… - - - 6,749
NET CHANGE IN FUND BALANCES………………………………… 6,078 (12,231) 4,754 14,208
FUND BALANCES AT BEGINNING OF YEAR……………………… 12,874 (6,453) 24,707 (1,748)
FUND BALANCES AT END OF YEAR………………………………… $ 18,952 $ (18,684) $ 29,461 $ 12,460
(continued)
GOVERNMENTAL FUNDSSTATEMENT OF REVENUES, EXPENDITURES AND CHANGES IN FUND BALANCES
YEAR ENDED JUNE 30, 2015
Special Revenue Funds
Lower Pioneer Valley Educational Collaborative 86 Comprehensive Annual Financial Report

TotalNonmajor
School Building Graphic Professional Other GovernmentalStore Rental Communication Devlopment Revolving Grants Funds
$ - $ 24,825 $ - $ - - - $ 24,825 - - - - - 484,834 484,834
2,256 - 3,683 16,654 643 - 163,316
2,256 24,825 3,683 16,654 643 484,834 672,975
- - - - - 1,440 1,440 - - - - - 242,402 242,402
4,142 5,534 2,420 7,122 529 215,436 369,203 - - - - - 25,556 25,556
4,142 5,534 2,420 7,122 529 484,834 638,601
(1,886) 19,291 1,263 9,532 114 - 34,374
- 113,028 - 39,002 - - 158,779 - (6,749) - - (152,030) - (158,779)
- 106,279 - 39,002 (152,030) - -
(1,886) 125,570 1,263 48,534 (151,916) - 34,374
4,015 36,878 4,844 - 168,878 - 243,995
$ 2,129 $ 162,448 $ 6,107 $ 48,534 16,962 - $ 278,369
(concluded)
Special Revenue Funds
Lower Pioneer Valley Educational Collaborative 87 Comprehensive Annual Financial Report

Lower Pioneer Valley Educational Collaborative 88 Comprehensive Annual Financial Report
Agency Fund Agency Fund This fund is used primarily to account for student activity transactions.

Beginning Endof Year Additions Deletions of Year
ASSETSCash and cash equivalents………………………….…$ 42,949 $ 25,018 $ (24,087) $ 43,880 Receivables, net of allowance for uncollectibles:
Departmental and other…………………………… 15 2,720 (2,345) 390
TOTAL ASSETS…………………………………………… $ 42,964 $ 27,738 $ (26,432) $ 44,270
LIABILITIESLiabilities due depositors……………………………… $ 42,964 $ 27,738 $ (26,432) $ 44,270
YEAR ENDED JUNE 30, 2015
STATEMENT OF CHANGES IN ASSETS AND LIABILITIESFIDUCIARY FUND
Lower Pioneer Valley Educational Collaborative 89 Comprehensive Annual Financial Report

Lower Pioneer Valley Educational Collaborative 90 Comprehensive Annual Financial Report
This page intentionally left blank.

Statistical Section
The Lower Pioneer Valley Machine Technology Construction program.

Lower Pioneer Valley Educational Collaborative 91 Comprehensive Annual Financial Report
Statistical Section This part of the comprehensive annual financial report presents detailed information as a context for understanding what the information in the financial statements, note disclosures, and required supplementary information says about the Collaborative’s overall financial health. Financial Trends
• These schedules contain trend information to help the reader understand how the Collaborative’s financial performance and well-being have changed over time.
Revenue Capacity
• These schedules contain information to help the reader assess the Collaborative’s most significant local revenue source.
Debt Capacity
• These schedules present information to help the reader assess the affordability of the Collaborative’s current levels of outstanding debt and the Collaborative’s ability to issue additional debt in the future.
Demographic and Economic Information
• These schedules offer demographic and economic indicators to help the reader understand the environment within which the Collaborative’s financial activities take place.
Operating Information
• These schedules contain service and infrastructure data to help the reader understand how the information in the Collaborative’s financial report relates to the services the Collaborative provides and the activities it performs.
SOURCES: Unless otherwise noted, the information in these schedules is derived from the Collaborative’s annual financial statements and budget reports for the relevant year.

2006 2007 2008 2009 2010 2011 2012 2013 2014 2015
Governmental activitiesNet investment in capital assets…………………$ 429,914 $ 256,065 $ 75,752 $ 9,859 $ 73,187 $ 192,518 $ 3,963,084 $ 4,165,536 $ 4,402,478 $ 4,776,373 Restricted………………………………………… 12,603 13,376 13,376 11,116 - 316,105 - - - - Unrestricted……………………………………… 1,333,711 1,704,038 2,136,364 1,943,710 2,808,404 1,306,625 1,812,428 2,198,999 1,745,553 1,060,508
Total governmental activities net position…………$ 1,776,228 $ 1,973,479 $ 2,225,492 $ 1,964,685 $ 2,881,591 $ 1,815,248 $ 5,775,512 $ 6,364,535 $ 6,148,031 $ 5,836,881
Business-type activitiesNet investment in capital assets…………………$ 1,711,773 $ 2,010,778 $ 1,233,771 $ 1,085,902 $ 1,219,653 $ 1,554,475 $ 2,206,350 $ 2,908,479 $ 3,263,981 $ 3,259,242 Restricted………………………………………… - - 300,000 300,000 300,000 - - - - - Unrestricted……………………………………… (110,123) (132,653) 558,267 (250,907) (273,692) (3,395,446) (6,217,414) (8,350,548) (9,612,898) (10,067,381)
Total business-type activities net position…………$ 1,601,650 $ 1,878,125 $ 2,092,038 $ 1,134,995 $ 1,245,961 $ (1,840,971) $ (4,011,064) $ (5,442,069) $ (6,348,917) $ (6,808,139)
Primary governmentNet investment in capital assets…………………$ 2,141,687 $ 2,266,843 $ 1,309,523 $ 1,095,761 $ 1,292,840 $ 1,746,993 $ 6,169,434 $ 7,074,015 $ 7,666,459 $ 8,035,615 Restricted………………………………………… 12,603 13,376 313,376 311,116 300,000 316,105 - - - - Unrestricted……………………………………… 1,223,588 1,571,385 2,694,631 1,692,803 2,534,712 (2,088,821) (4,404,986) (6,151,549) (7,867,345) (9,006,873)
Total primary government net position……………$ 3,377,878 $ 3,851,604 $ 4,317,530 $ 3,099,680 $ 4,127,552 $ (25,723) $ 1,764,448 $ 922,466 $ (200,886) $ (971,258)
Note: Prior to year 2012, the Corporation was not reported as a blended component unit.
Last Ten Years
Net Position By Component
Lower Pioneer Valley Educational Collaborative 92 Comprehensive Annual Financial Report

2006 2007 2008 2009 2010 2011 2012 2013 2014 2015ExpensesGovernmental activities:
Administration…………………………………………………… $ 1,303,700 $ 1,092,270 $ 1,288,749 $ 1,563,743 $ 1,103,423 $ 1,979,641 $ 994,074 $ 408,610 $ 960,520 $ 1,824,395 Special education………………………………………………… 4,135,928 4,011,308 4,173,854 4,312,604 4,024,707 4,326,385 4,166,537 4,438,334 4,495,610 3,754,926 Occupational education………………………………………… 3,337,702 3,817,717 3,822,074 4,005,363 3,924,582 4,341,067 4,058,627 4,139,596 4,839,278 4,488,967 Supplemental services…………………………………………… 1,074,930 882,052 762,542 1,241,868 1,227,919 1,607,836 1,946,926 2,091,291 2,201,398 2,279,491 Professional development……………………………………… 202,775 136,510 131,747 100,407 153,443 189,064 73,580 5,380 3,596 44,043 Unallocated depreciation………………………………………… 188,053 296,361 287,675 250,276 191,240 136,263 645,345 706,876 652,293 655,988 Interest expense………………………………..………………… - - - - - - 337,620 339,449 320,095 290,465
Total government activities expenses…………………………… 10,243,088 10,236,218 10,466,641 11,474,261 10,625,314 12,580,256 12,222,709 12,129,536 13,472,790 13,338,275
Business-type activities:Transportation…………………………………...……………… 9,572,925 9,832,486 9,822,661 11,210,104 10,386,757 11,942,954 12,816,989 12,571,053 12,433,554 12,282,493 Cooperative purchasing………………………………………… 37,504 21,513 15,801 10,439 5,178 - - - - - Other enterprise funds…………………………………………… - - 4,724 19,577 243,444 - - - - -
Total business-type activities expenses…………………………… 9,610,429 9,853,999 9,843,186 11,240,120 10,635,379 11,942,954 12,816,989 12,571,053 12,433,554 12,282,493
Total primary government expenses………………………………$ 19,853,517 $ 20,090,217 $ 20,309,827 $ 22,714,381 $ 21,260,693 $ 24,523,210 $ 25,039,698 $ 24,700,589 $ 25,906,344 $ 25,620,768
Program RevenuesGovernmental activities:
Charges for services: Occupational education………………………………………$ - $ - $ - $ - $ - $ 546,494 $ 601,278 $ 640,123 $ 786,080 $ 910,397 Supplemental services……………………………………… - - - - - 545,893 597,858 660,312 644,772 664,116 Other charges for services…………………………………… - - - - - 358,305 258,948 169,201 231,942 839,477 Operating grants and contributions…………………………… 558,270 853,583 965,597 891,731 813,602 1,439,189 939,901 1,067,811 1,651,515 1,974,005
Total government activities program revenues...………………… 558,270 853,583 965,597 891,731 813,602 2,889,881 2,397,985 2,537,447 3,314,309 4,387,995
Business-type activities:Charges for services…………………………………………… 10,148,987 10,130,474 10,057,099 10,283,077 10,746,344 10,128,575 10,646,896 11,140,048 11,515,465 11,823,271
Total primary government program revenues…………………… $ 10,707,257 $ 10,984,057 $ 11,022,696 $ 11,174,808 $ 11,559,946 $ 13,018,456 $ 13,044,881 $ 13,677,495 $ 14,829,774 $ 16,211,266
Net (Expense)/Program RevenueGovernmental activities………………………………………………$ (9,684,818) $ (9,382,635) $ (9,501,044) $ (10,582,530) $ (9,811,712) $ (9,690,375) $ (9,824,724) $ (9,592,089) $ (10,158,481) $ (8,950,280) Business-type activities……………………………………………… 538,558 276,475 213,913 (957,043) 110,965 (1,814,379) (2,170,093) (1,431,005) (918,089) (459,222)
Total primary government net (expense)/program revenue…………………………………………………………… $ (9,146,260) $ (9,106,160) $ (9,287,131) $ (11,539,573) $ (9,700,747) $ (11,504,754) $ (11,994,817) $ (11,023,094) $ (11,076,570) $ (9,409,502)
General Revenues and other Changes in Net PositionGovernmental activities:
Member district assessments……………………………………$ 9,421,556 $ 9,558,156 $ 9,714,860 $ 10,291,165 $ 10,705,106 $ 9,418,562 $ 9,367,822 $ 9,968,721 $ 9,509,825 $ 8,186,225 Unrestricted investment income………………………………… 22,895 21,730 38,196 30,558 23,512 15,363 10,587 6,164 2,542 2,307 Miscellaneous…………………………………………………… - - - - - - 287,355 206,227 440,851 450,598 Transfers, net…………………………………………………… - - - - - - - - (11,241) -
Total governmental activities……………………………………… 9,444,451 9,579,886 9,753,056 10,321,723 10,728,618 9,433,925 9,665,764 10,181,112 9,941,977 8,639,130
Business-type activities:Transfers…………………………………………………………… - - - - - - - - 11,241 -
Total primary government general revenues and other changes in net position……………………………………………$ 9,444,451 $ 9,579,886 $ 9,753,056 $ 10,321,723 $ 10,728,618 $ 9,433,925 $ 9,665,764 $ 10,181,112 $ 9,953,218 $ 8,639,130
Changes in Net PositionGovernmental activities………………………………………………$ (240,367) $ 197,251 $ 252,012 $ (260,807) $ 916,906 $ (256,450) $ (158,960) $ 589,023 $ (216,504) $ (311,150) Business-type activities……………………………………………… 538,558 276,475 213,913 (957,043) 110,965 (1,814,379) (2,170,093) (1,431,005) (906,848) (459,222)
Total primary government changes in net position………………$ 298,191 $ 473,726 $ 465,925 $ (1,217,850) $ 1,027,871 $ (2,070,829) $ (2,329,053) $ (841,982) $ (1,123,352) $ (770,372)
Prior to year 2012, the Corporation was not reported as a blended component unit.Prior to year 2011, the Collaborative included nonmember program charges in member district assessments.
Last Ten Years
Changes in Net Position
Lower Pioneer Valley Educational Collaborative 93 Comprehensive Annual Financial Report

2006 2007 2008 2009 2010 2011 2012 2013 2014 2015
General FundReserved……………………………… $ 521,467 $ 640,467 $ - $ - $ - $ - $ - $ - $ - $ - Unreserved………………..…………… 1,077,878 1,107,052 2,189,383 2,965,972 3,844,257 - - - - - Assigned………………………………… - - - - - 3,722,455 2,988,011 4,008,699 2,209,417 1,275,000 Unassigned…………………………… - - - - - 462,253 1,568,178 2,027,519 3,839,077 4,579,328
Total general fund………………………… $ 1,599,345 $ 1,747,519 $ 2,189,383 $ 2,965,972 $ 3,844,257 $ 4,184,708 $ 4,556,189 $ 6,036,218 $ 6,048,494 $ 5,854,328
All Other Governmental FundsReserved……………………………… $ 12,603 $ 13,376 $ - $ - $ - $ - $ - $ - $ - $ - Unreserved, reported in:
Special revenue funds…………… - - 12,115 4,857 (1,480) - - - - - Restricted……………………………… - - - - - 178,106 178,926 213,414 265,562 297,053 Unassigned…………………………… - - - - - - (55,447) (2,142) (21,567) (18,684)
Total all other governmental funds………$ 12,603 $ 13,376 $ 12,115 $ 4,857 $ (1,480) $ 178,106 $ 123,479 $ 211,272 $ 243,995 $ 278,369
Note: The Collaborative implemented GASB 54 in year 2011, fund balances prior to year 2011 have been reported in the pre-GASB 54 format.
Last Ten Years
Fund Balances, Governmental Funds
Lower Pioneer Valley Educational Collaborative 94 Comprehensive Annual Financial Report

2006 2007 2008 2009 2010 2011 2012 2013 2014 2015
Revenues:Member district assessments…………………………$ - $ $ - $ - $ - $ 9,418,562 $ 9,448,683 $ 9,985,785 $ 9,512,718 $ 8,992,559 Nonmember assessments…………………………… - - - - - 1,377,014 1,241,503 1,336,709 1,543,713 1,444,340 Intergovernmental……………………………………… 558,270 853,583 965,597 891,731 1,049,061 1,151,087 1,175,245 1,075,622 1,489,553 1,967,036 Investment income…………………………………… 22,895 21,730 38,196 30,558 23,512 15,363 9,941 5,200 2,034 1,650 Departmental and other……………………………… - - - - - 73,678 87,262 117,885 145,692 164,518 Administration………………………………………… 994,632 1,050,983 996,068 1,062,436 1,016,949 - - - - - Special education……………………………………… 4,301,547 4,145,599 4,316,183 3,898,856 3,997,756 - - - - - Occupational education……………………………… 3,026,149 3,355,283 3,497,142 3,737,802 3,946,830 - - - - - Supplemental services………………………………… 1,028,945 876,351 790,789 1,495,509 1,432,580 - - - - - Professional development…………………………… 70,283 129,940 114,678 96,563 71,907 - - - - -
Total Revenue…………………………………… 10,002,721 10,433,469 10,718,653 11,213,455 11,538,595 12,035,704 11,962,634 $ 12,521,201 $ 12,693,710 $ 12,570,103
Expenditures: Administration………………………………………… 1,243,016 1,314,423 1,280,471 1,400,480 1,014,248 1,550,540 2,457,132 222,069 891,418 1,683,991 Special education……………………………………… 4,135,928 4,011,308 4,173,854 3,744,499 3,903,183 3,836,614 3,476,969 4,054,059 4,202,158 3,572,338 Occupational education……………………………… 4,456,216 3,932,979 3,938,236 3,873,352 4,130,792 4,084,085 4,193,891 4,544,799 5,299,337 5,111,502 Supplemental services………………………………… 1,074,930 889,302 761,842 1,335,422 1,349,737 1,605,547 1,443,365 2,125,352 2,239,304 2,316,301 Professional development…………………………… 202,775 136,510 123,647 90,371 68,688 186,229 74,423 7,100 5,253 45,763
Total Expenditures……………………………… 11,112,865 10,284,522 10,278,050 10,444,124 10,466,648 11,263,015 11,645,780 10,953,379 12,637,470 12,729,895
Excess of revenues over (under) expenditures……… (1,110,144) 148,947 440,603 769,331 1,071,947 772,689 316,854 1,567,822 56,240 (159,792)
Other Financing Sources (Uses)
Refunds to member districts…………………………… - - - - - (350,000) - - - - Capital lease financing………………………………… 850,000 - - - - - - - - - Transfers in……………………………………………… - - - - - - - - 97,651 158,779 Transfers out…………………………………………… - - - - (200,000) - - - (108,892) (158,779)
Total other financing sources (uses)…………… 850,000 - - - (200,000) (350,000) - - (11,241) -
Net change in fund balance……………………………… $ (260,144) $ 148,947 $ 440,603 $ 769,331 $ 871,947 $ 422,689 $ 316,854 $ 1,567,822 $ 44,999 $ (159,792)
Note: Prior to year 2011, the Collaborative allocated assessments by program.
Last Ten Years
Changes in Fund Balances, Governmental Funds
Lower Pioneer Valley Educational Collaborative 95 Comprehensive Annual Financial Report

2015 2006
Percentage of Percentage ofTotal Total
Name Revenue Revenue
Special EducationAgawam 28% 18%East Longmeadow 8% 22%Hampden-Wilbraham 25% 17%Longmeadow 6% 15%Ludlow 9% 16%Southwick Tolland Granville 2% 2%West Springfield 18% 8%Out of District 3% 3%Total Special Education 100% 100%
Occupational EducationAgawam 24% 27%East Longmeadow 6% 6%Hampden-Wilbraham 4% 5%Longmeadow 3% 8%Ludlow 9% 13%Southwick Tolland Granville 14% 12%West Springfield 20% 22%Out of District 19% 8%Total Occupational Education 100% 100%
Supplemental ServicesAgawam 9% 3%East Longmeadow 2% 1%Hampden-Wilbraham 5% 2%Longmeadow 1% 7%Ludlow 4% 4%Southwick Tolland Granville 1% 1%West Springfield 3% 3%Out of District 74% 78%Total Supplemental Services 100% 100%
Transportation ServicesAgawam 19% 20%East Longmeadow 4% 4%Hampden-Wilbraham 28% 31%Longmeadow 9% 8%Ludlow 14% 17%Southwick Tolland Granville 1% 0%West Springfield 24% 20%Out of District 1% 0%Total Transportation Services 100% 100%
Source: Collaborative finance department
Revenue by Member Communities
Current Year and Nine Years Ago
Lower Pioneer Valley Educational Collaborative 96 Comprehensive Annual Financial Report

2014 2004
Nature ofName Business City/Town Rank Rank
Baystate Health System Health Services Springfield 1 1
MassMutual Financial Services Financial Services Springfield 2
Big Y Supermarkets Retail Springfield 3 5
Sisters of Providence Health System Health Services Springfield 4
Smith & Wesson Manufacturing Springfield 5 3
Holyoke Medical Center Health Services Holyoke 6 2
Hasbro Manufacturing E. Longmeadow 7
Verizon Communications Springfield 8
Noble Hospital Health Services Westfield 9 8
Wing Memorial Hospital Health Services Palmer 10
Milton Bradley Company (Hasbro) Manufacturer East Longmeadow 4
Springfield College Education Springfield 6
Westover Air Reserve Base Military Chicopee 7
Top Flight Golf Manufacturer Chicopee 9
Peter Pan Bus Lines Transportation Services Springfield 10
Note: Each of the Collaborative 10 member communities are located in Hampden County, MA. Data for 2015 and 2006 was not available.Source: Collaborative finance department
Hampden County Principal Employers
Current Year and Nine Years Ago
Lower Pioneer Valley Educational Collaborative 97 Comprehensive Annual Financial Report

General General Total Major DebtObligation Capital Obligation Capital Debt Program per
Year Bonds and Notes Leases Bonds and Notes Leases Outstanding Enrollment Enrollment
2006 -$ 834,001$ 650,000$ 439,335$ 1,923,336$ 556 3,459$ 2007 -$ 718,739$ 519,000$ 778,314$ 2,016,053$ 562 3,587$ 2008 -$ 611,377$ 388,000$ 592,956$ 1,592,333$ 561 2,838$ 2009 -$ 497,185$ 258,000$ 1,531,628$ 2,286,813$ 622 3,677$ 2010 -$ 375,729$ 128,000$ 2,734,348$ 3,238,077$ 652 4,966$ 2011 -$ 287,890$ -$ 3,561,361$ 3,849,251$ 652 5,904$ 2012 13,205,577$ -$ -$ 4,034,302$ 17,239,879$ 648 26,605$ 2013 12,551,472$ -$ -$ 2,458,779$ 15,010,251$ 654 22,951$ 2014 11,848,868$ -$ -$ 1,246,459$ 13,095,327$ 634 20,655$ 2015 11,141,471$ -$ -$ 417,345$ 11,558,816$ 634 18,232$
Note: Prior to year 2012, the Corporation was not reported as a blended component unit.The effects of blending the Corporation with the primary government have not been presented prior to year 2012.Source: Audited Financial Statements, Collaborative finance department
Ratios of Outstanding Debt and General Bonded Debt
Last Ten Years
Governmental Activities Business-type Activities Total Primary Government
Lower Pioneer Valley Educational Collaborative 98 Comprehensive Annual Financial Report

2006 2007 2008 2009 2010 2011 2012 2013 2014 2015Demographic and Economic Statistics
Agawam:Population………………………………………… 28,717 28,757 28,289 28,485 28,438 28,438 28,438 28,438 27,438 27,438 Labor force………………………………………… 16,083 15,979 15,843 15,774 15,828 15,480 15,399 15,224 15,684 15,999 Unemployed……………………………………… 748 696 826 1,241 1,282 1,080 990 1,089 985 771 Unemployment rate……………………………… 4.7% 4.4% 5.2% 7.9% 8.1% 7.0% 6.4% 7.2% 6.3% 4.8%
West Springfield:Population………………………………………… 28,476 28,501 27,982 28,137 28,391 28,391 28,391 28,391 28,391 28,391 Labor force………………………………………… 14,613 14,507 14,497 14,587 14,820 14,500 14,427 14,178 14,588 14,732 Unemployed……………………………………… 728 706 891 1,281 1,359 1,173 1,092 1,097 979 797 Unemployment rate……………………………… 5.0% 4.9% 6.1% 8.8% 9.2% 8.1% 7.6% 7.7% 6.7% 5.4%
Hampden-Wilbraham Regional:Enrollment………………………………………… 3,661 3,626 3,514 3,440 3,396 3,545 3,420 3,356 3,356 3,356 Labor force………………………………………… N/A N/A N/A N/A N/A N/A N/A N/A N/A N/AUnemployed……………………………………… N/A N/A N/A N/A N/A N/A N/A N/A N/A N/AUnemployment rate……………………………… N/A N/A N/A N/A N/A N/A N/A N/A N/A N/A
Ludlow:Population………………………………………… 21,209 21,209 21,209 21,209 21,103 21,103 21,103 21,103 21,103 21,103 Labor force………………………………………… 11,311 11,325 11,541 11,207 10,740 10,633 10,525 10,413 10,680 11,025 Unemployed……………………………………… 694 625 769 1,039 1,034 1,025 911 982 889 706 Unemployment rate……………………………… 6.1% 5.5% 6.7% 9.3% 9.6% 9.6% 8.7% 9.4% 8.3% 6.4%
East Longmeadow:Population………………………………………… 14,100 14,100 14,100 14,100 15,720 15,720 15,720 15,720 15,720 15,720 Labor force………………………………………… 7,797 7,982 8,019 8,100 8,078 7,921 7,909 7,793 8,052 8,672 Unemployed……………………………………… 297 318 367 523 572 489 472 498 427 353 Unemployment rate……………………………… 3.8% 4.0% 4.6% 6.5% 7.1% 6.2% 6.0% 6.4% 5.3% 4.1%
Southwick-Tolland-Granville Regional:Enrollment………………………………………… N/A N/A N/A N/A N/A N/A N/A N/A N/A N/ALabor force………………………………………… N/A N/A N/A N/A N/A N/A N/A N/A N/A N/AUnemployed……………………………………… N/A N/A N/A N/A N/A N/A N/A N/A N/A N/AUnemployment rate……………………………… N/A N/A N/A N/A N/A N/A N/A N/A N/A N/A
Longmeadow:Population………………………………………… 15,633 15,633 15,633 15,633 15,633 15,784 15,784 15,784 15,784 15,784 Labor force………………………………………… 7,883 7,801 7,771 7,668 7,841 7,690 7,675 7,579 7,796 8,147 Unemployed……………………………………… 277 255 286 444 466 389 369 413 365 287 Unemployment rate……………………………… 3.5% 3.3% 3.7% 5.8% 5.9% 5.1% 4.8% 5.4% 4.7% 3.5%
Note: Information provided for member communities.Source: Massachusetts Labor and Workforce Development, New England School Development Council
N/A: Regional school district information not available
Calendar Year
Last Ten Calendar Years
Demographic and Economic Statistics
Lower Pioneer Valley Educational Collaborative 99 Comprehensive Annual Financial Report

2006 2007 2008 2009 2010 2011 2012 2013 2014 2015Full-Time Equivalents
Administration…………………… 18 17 16 17 21 23 23 21 21 21
Special Education……………… 82 85 74 76 76 76 74 80 71 71
Occupational Education………… 36 35 37 36 38 39 39 39 44 50
Supplemental Services………… 6 6 6 5 5 5 5 6 4 7
Transportation…………………… 243 236 237 242 248 247 236 264 272 238
Total ……………………………… 385 379 370 376 388 390 377 410 412 387
Source: Collaborative finance department
Last Ten Years
Full-Time Equivalent Employees
Year
Lower Pioneer Valley Educational Collaborative 100 Comprehensive Annual Financial Report
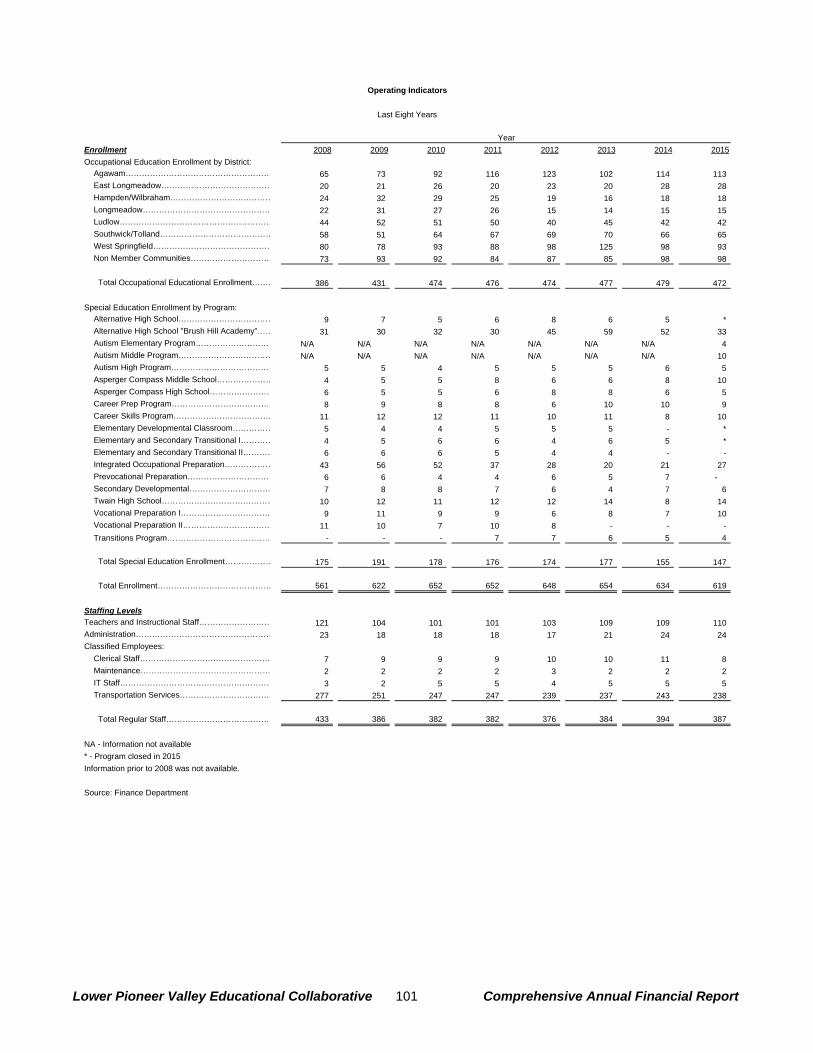
Enrollment 2008 2009 2010 2011 2012 2013 2014 2015Occupational Education Enrollment by District:
Agawam……………………………………………… 65 73 92 116 123 102 114 113 East Longmeadow…………………………………… 20 21 26 20 23 20 28 28 Hampden/Wilbraham………………………………… 24 32 29 25 19 16 18 18 Longmeadow………………………………………… 22 31 27 26 15 14 15 15 Ludlow………………………………………………… 44 52 51 50 40 45 42 42 Southwick/Tolland…………………………………… 58 51 64 67 69 70 66 65 West Springfield……………………………………… 80 78 93 88 98 125 98 93 Non Member Communities………………………… 73 93 92 84 87 85 98 98
Total Occupational Educational Enrollment……… 386 431 474 476 474 477 479 472
Special Education Enrollment by Program:
Alternative High School……………………………… 9 7 5 6 8 6 5 *Alternative High School "Brush Hill Academy"…… 31 30 32 30 45 59 52 33 Autism Elementary Program………………………… N/A N/A N/A N/A N/A N/A N/A 4 Autism Middle Program……………………………… N/A N/A N/A N/A N/A N/A N/A 10 Autism High Program………………………………… 5 5 4 5 5 5 6 5 Asperger Compass Middle School………………… 4 5 5 8 6 6 8 10 Asperger Compass High School…………………… 6 5 5 6 8 8 6 5 Career Prep Program………………………………… 8 9 8 8 6 10 10 9 Career Skills Program……………………………… 11 12 12 11 10 11 8 10 Elementary Developmental Classroom…………… 5 4 4 5 5 5 - *Elementary and Secondary Transitional I………… 4 5 6 6 4 6 5 *Elementary and Secondary Transitional II………… 6 6 6 5 4 4 - - Integrated Occupational Preparation……………… 43 56 52 37 28 20 21 27 Prevocational Preparation…………………………… 6 6 4 4 6 5 7 - Secondary Developmental………………………… 7 8 8 7 6 4 7 6 Twain High School…………………………………… 10 12 11 12 12 14 8 14 Vocational Preparation I…………………………… 9 11 9 9 6 8 7 10 Vocational Preparation II…………………………… 11 10 7 10 8 - - - Transitions Program………………………………… - - - 7 7 6 5 4
Total Special Education Enrollment……………… 175 191 178 176 174 177 155 147
Total Enrollment…………………………………… 561 622 652 652 648 654 634 619
Staffing LevelsTeachers and Instructional Staff……………………… 121 104 101 101 103 109 109 110 Administration…………………………………………… 23 18 18 18 17 21 24 24 Classified Employees:
Clerical Staff………………………………………… 7 9 9 9 10 10 11 8 Maintenance………………………………………… 2 2 2 2 3 2 2 2 IT Staff………………………………………………… 3 2 5 5 4 5 5 5 Transportation Services……………………………… 277 251 247 247 239 237 243 238
Total Regular Staff………………………………… 433 386 382 382 376 384 394 387
NA - Information not available * - Program closed in 2015Information prior to 2008 was not available.
Source: Finance Department
Year
Last Eight Years
Operating Indicators
Lower Pioneer Valley Educational Collaborative 101 Comprehensive Annual Financial Report

Town/LocationYear
AcquiredSquare Footage
% Occupied
Buildings (1):Career and Technical Education Center and Administration Building………………………West Springfield 2005 106,029 100%
Twain school………………………..…………………West Springfield 1992 3,348 100%
Modular Buildings (1): Clark Modulars in Agawam………………………… Agawam 2003 NA 100%Cambridge Glenbrook Modular in Longmeadow…Longmeadow 2006 NA 100%Mt. View Modular in East Longmeadow……………East Longmeadow 1999 NA 100%Mapleshade Modular in East Longmeadow……… East Longmeadow 1999 NA 100%
Transportation Facilities (2): Denslow Road Garage………………………………East Longmeadow 2004 5,184 100%Dollar Avenue Garage……………………………… Wilbraham 2001 2,773 100%Carmelina Circle Garage…………………………… Ludlow 2001 4,320 100%Shoemaker Lane Garage……………………………Agawam 2012 13,100 100%
NA - Information not available
(1) The Collaborative leases these buildings from the Lower Pioneer Valley Educational Corporation.(2) The Collaborative also owns and operates approximately 250 vehicles through the Transportation Program.
Source: Finance Department
Capital Asset Statistics
Lower Pioneer Valley Educational Collaborative 102 Comprehensive Annual Financial Report
Lower Pioneer Valley Educational Collaborative 103 Comprehensive Annual Financial Report
Schedule of Cumulative Surplus and Required Disclosures for Massachusetts
Educational Collaboratives Schedule of Cumulative Surplus and Required Disclosures for Massachusetts Educational Collaboratives

ANNUAL LIMITATION ON SURPLUS FUNDS: Fiscal year 2014 General Fund Expenditures……………………… $ 11,564,362 Fiscal year 2014 Enterprise Fund Expenditures,
(modified cash basis)……………………………………………… 11,733,585
Subtotal………………………………………………………… 23,297,947
25% Limitation on Surplus Funds for Fiscal Year 2015…………… 5,824,487
Unassigned General Funds at June 30, 2015……………………… 4,579,328
Transportation Enterprise Fund Deficit at June 30, 2015: Full Accrual Balance (deficit)……………………………………… $ (6,808,139) Less:
Capital assets…………………………………………………… (3,676,587) Inventory………………………………………………………… (41,464)
Add: OPEB accrual…………………………………...……………… 8,566,979 Compensated absences……………………………………… 44,546 Capital lease obligations……………………………………… 417,345
Transportation Enterprise Fund Modified cash basis (deficit)…… (1,497,320)
Early Education and Care Fund (deficit)……………………………… (18,684)
Adjusted Surplus Funds at June 30, 2015…………………………… 3,063,324
Surplus funds over (under) limit………………………………………… $ (2,761,163)
YEAR ENDED JUNE 30, 2015
SCHEDULE OF CUMULATIVE SURPLUS
Lower Pioneer Valley Educational Collaborative 104 Comprehensive Annual Financial Report

Required Disclosures for Massachusetts Educational Collaboratives Year Ended June 30, 2015
Lower Pioneer Valley Educational Collaborative 105 Comprehensive Annual Financial Report
The following supplementary information is provided to conform with the requirements of the Massachusetts Session Law, Chapter 43 of the Acts of 2012: An Act Relative to Improving Accountability and Oversight of Education Collaboratives. This law was adopted in March of 2012 and constitutes a comprehensive amendment Massachusetts General Law, Chapter 40, Section 4E which establishes the requirements for the formation and administration of Education Collaboratives in Massachusetts. Required Disclosures for Massachusetts Educational Collaboratives NOTE 1 – TRANSACTIONS BETWEEN RELATED ORGANIZATIONS The Collaborative leases various facilities from the Corporation under operating lease agreements for use in their programs. Rental payments made to the Corporation during 2015 totaled $1,144,180. During 2015, the Collaborative also remitted reimbursements and lease finance payments to the Corporation totaling $68,903. The Collaborative also contributed for expenditures related to the building repairs project, machine technology construction project, Wilbraham garage expenditures, and other expenditures for $39,869, $75,676, $127,078, and $73, respectively. Total payments from the Collaborative to the Corporation during year 2015 are as follows:
Purpose Amount
Operating Leases……………………………… $ 1,144,180 Capital Lease Principal………………………… 60,978 Capital Lease Interest…………………………… 7,925 Building Repairs Project………………………… 39,869 Machine Technology Construction Project…… 75,676 Wilbraham Garage Expenditures……………… 127,078 Other……………………………………………… 73
Total………………………………………………$ 1,455,779
The Collaborative has restructured the current operating leases with the Corporation, effective July 1, 2014. Under the new terms, all of the operating leases will expire on June 30, 2017 with various options for extensions. Based on the renegotiated operating lease agreements, future operating lease payments to the Corporation will be as follows:
Years Governmental Business-TypeEnding June 30 Activities Activities Total
2016………………………………………………$ 915,000 $ 215,000 $ 1,130,000 2017……………………………………………… 915,000 215,000 1,130,000
Total lease payments……………………………$ 1,830,000 $ 430,000 $ 2,260,000

Required Disclosures for Massachusetts Educational Collaboratives Year Ended June 30, 2015
Lower Pioneer Valley Educational Collaborative 106 Comprehensive Annual Financial Report
NOTE 2 – PURCHASE, SALE, RENTAL OR LEASE OF REAL PROPERTY The Collaborative has entered into several lease agreements to finance the acquisition of equipment and vehicles. These lease agreements qualify as capital leases for accounting purposes and, therefore, have been recorded at the present value of their future minimum lease payments as of the inception date. The Governmental leases relate to equipment and technology leased from the Corporation. The Corporation purchased the equipment and technology through long-term notes and is leasing the assets back to the Collaborative through a capital lease. The Business-type capital leases represent capital leases for vehicles and busses purchased through capital leases for the operation of the transportation enterprise fund. The remaining net value of assets acquired through capital leases totaled $4,534,631. The future minimum lease obligations and the present value of these minimum lease payments as of June 30, 2015 are listed below:
Years Business-TypeEnding June 30 Activities
2016……………………………………………………$ 425,608
Less: amounts representing interest……………… (8,263)
Present value of minimum lease payments………$ 417,345
NOTE 3 – MOST HIGHLY COMPENSATED EMPLOYEES The following table presents the total compensation for the Collaborative’s five most highly compensated employees for the year ended June 30, 2015:
AccruedName Position Salary Annuities Buyback Total
Andrew Churchill Executive Director………………………… $ 120,000 $ - $ - $ 120,000 Anna Bishop Director of Finance………………………… 100,230 1,500 3,855 105,585 Donald Jarvis Director of Occupational Education……… 97,565 - - 97,565 Laurie Oyler Director of Medical Reimbursement……… 90,546 - - 90,546 Marisa Ross Director of Special Education……………… 90,299 - - 90,299
Total………………………………………… $ 498,640 $ 1,500 $ 3,855 $ 503,995
Compensation

Required Disclosures for Massachusetts Educational Collaboratives Year Ended June 30, 2015
Lower Pioneer Valley Educational Collaborative 107 Comprehensive Annual Financial Report
NOTE 4 – ADMINISTRATION AND OVERHEAD For year ended June 30, 2015, the Collaborative expended approximately $2,617,541 for amounts related to administration and overhead. NOTE 5 – STUDENT ACTIVITY ACCOUNTS At June 30, 2015, there are no accounts held by the Collaborative that may be spent at the discretion of another person or entity. The Collaborative does maintain one student activity account from which all expenditures are paid through the Collaborative’s warrant process. NOTE 6 – SERVICES FOR PUPILS AGE 22 AND OLDER During year 2015, the Collaborative did not provide services for individuals over the age of 22. NOTE 7 – SCHEDULE OF CUMULATIVE SURPLUS State regulations limit the amount of cumulative surplus that may be retained by collaboratives at the end of a fiscal year to no more than 25% of the prior year’s general fund expenditures. For the Collaborative this includes the activities of the Transportation fund.