low‐dose suramin in autism spectrum disorder: a...
TRANSCRIPT

RESEARCH ARTICLE
Low-dose suramin in autism spectrum disorder: a small,phase I/II, randomized clinical trialRobert K. Naviaux1,2,3,4,, Brooke Curtis5, Kefeng Li1,2, Jane C. Naviaux1,6, A. Taylor Bright1,2, Gail E.Reiner1,6, Marissa Westerfield7, Suzanne Goh8, William A. Alaynick1,2, Lin Wang1,2, Edmund V.Capparelli13, Cynthia Adams9, Ji Sun9, Sonia Jain10, Feng He10, Deyna A. Arellano9, Lisa E. Mash7,11,Leanne Chukoskie7,12, Alan Lincoln5 & Jeanne Townsend6,7
1The Mitochondrial and Metabolic Disease Center, University of California, San Diego School of Medicine, 214 Dickinson St., Bldg CTF, Rm C102,
San Diego, 92103-8467, California2Department of Medicine, University of California, San Diego School of Medicine, 214 Dickinson St., Bldg CTF, Rm C102, San Diego, 92103-
8467, California3Department of Pediatrics, University of California, San Diego School of Medicine, 214 Dickinson St., Bldg CTF, Rm C102, San Diego, 92103-
8467, California4Department of Pathology, University of California, San Diego School of Medicine, 214 Dickinson St., Bldg CTF, Rm C102, San Diego, 92103-
8467, California5Alliant International University, 10455 Pomerado Road, San Diego, California, 921316Department of Neurosciences, University of California, San Diego School of Medicine, 9500 Gilman Drive., La Jolla, CA, 92093-06627The Research in Autism and Development Laboratory (RAD Lab), University of California, 9500 Gilman Drive, La Jolla, CA, 92093-09598Pediatric Neurology Therapeutics, 7090 Miratech Dr, San Diego, CA, 921219Clinical and Translational Research Institute (CTRI), University of California, San Diego, La Jolla, CA, 9203710Department of Family Medicine and Public Health, University of California, San Diego, La Jolla, CA, 9209311Department of Psychology, San Diego State University, 5500 Campanile Drive, San Diego, CA, 9218212Institute for Neural Computation, University of California, 9500 Gilman Drive, La Jolla, 92093-052313Department of Pediatrics, and Skaggs School of Pharmacy and Pharmaceutical Sciences, University of California, San Diego School of Medicine,
9500 Gilman Drive, La Jolla, CA, 92093-0657
Correspondence
Robert K. Naviaux, The Mitochondrial and
Metabolic Disease Center, University of
California, San Diego School of Medicine,
214 Dickinson St., Bldg CTF, Rm C102, San
Diego, CA 92103-8467. Tel: 619-543-2904;
Fax: 619-543-7868;
E-mail: [email protected]
Funding Information
All funding for this study was philanthropic.
This work was supported in part by gifts
from the William Wright Family Foundation,
the UCSD Christini Fund, the Autism
Research Institute (ARI), the Lennox
Foundation, the Gupta Family and Satya
Fund, the Agrawal Family, Linda Clark, the N
of One Autism Research Foundation, the
Rodakis Family, the It Takes Guts Foundation,
the UCSD Mitochondrial Disease Research
Fund, Dr. Elizabeth Mumper Cooper, and the
Daniel and Kelly White Family. Funding for
the mass spectrometers was provided by a
gift from the Jane Botsford Johnson
Foundation. The funders of the study had no
role in study design, data collection or
analysis, decision to publish, or preparation
of the manuscript.
Abstract
Objective: No drug is yet approved to treat the core symptoms of autism spec-
trum disorder (ASD). Low-dose suramin was effective in the maternal immune
activation and Fragile X mouse models of ASD. The Suramin Autism Treat-
ment-1 (SAT-1) trial was a double-blind, placebo-controlled, translational pilot
study to examine the safety and activity of low-dose suramin in children with
ASD. Methods: Ten male subjects with ASD, ages 5–14 years, were matched by
age, IQ, and autism severity into five pairs, then randomized to receive a single,
intravenous infusion of suramin (20 mg/kg) or saline. The primary outcomes
were ADOS-2 comparison scores and Expressive One-Word Picture Vocabulary
Test (EOWPVT). Secondary outcomes were the aberrant behavior checklist,
autism treatment evaluation checklist, repetitive behavior questionnaire, and
clinical global impression questionnaire. Results: Blood levels of suramin were
12 � 1.5 lmol/L (mean � SD) at 2 days and 1.5 � 0.5 lmol/L after 6 weeks.
The terminal half-life was 14.7 � 0.7 days. A self-limited, asymptomatic rash
was seen, but there were no serious adverse events. ADOS-2 comparison scores
improved by �1.6 � 0.55 points (n = 5; 95% CI = �2.3 to �0.9; Cohen’s
d = 2.9; P = 0.0028) in the suramin group and did not change in the placebo
group. EOWPVT scores did not change. Secondary outcomes also showed
improvements in language, social interaction, and decreased restricted or repeti-
tive behaviors. Interpretation: The safety and activity of low-dose suramin
showed promise as a novel approach to treatment of ASD in this small study.
ª 2017 The Authors. Annals of Clinical and Translational Neurology published by Wiley Periodicals, Inc on behalf of American Neurological Association.
This is an open access article under the terms of the Creative Commons Attribution-NonCommercial-NoDerivs License, which permits use and
distribution in any medium, provided the original work is properly cited, the use is non-commercial and no modifications or adaptations are made.
1
Received: 25 February 2017; Revised: 18
April 2017; Accepted: 20 April 2017
doi: 10.1002/acn3.424
Clinical Trial Registration: https://clinicaltria
ls.gov/ct2/show/NCT02508259
Introduction
Autism affects 1–2% of children in the United States.1,2
Dozens of single genes and chromosomal copy number
variants (CNVs)3 increase the relative risk of autism spec-
trum disorder (ASD) nearly 5–50 times over the current
background risk. Yet no single gene or CNV causes ASD
in 100% of children who carry the mutation,4 and no sin-
gle DNA mutation accounts for more than 1–2% of all
ASD.5 Specific environmental factors have also been
shown to increase the risk of ASD.6,7 However, no single
child has all of the known genetic risk factors for ASD, or
is exposed to all the same environmental risks. Although
the noncore symptoms of ASD are highly heterogeneous
from child to child, making each child unique, the same
core features used for diagnosis – abnormalities in social
communication, restricted interests, repetitive behaviors,
adherence to routine, and/or atypical sensory behaviors –are by definition expressed in every child. One approach
to addressing the challenge of many etiologies of ASD is
to define a common pathophysiology that can contribute
to the core diagnostic symptoms, regardless of the initiat-
ing genetic and environmental triggers. We hypothesized
that there is a conserved cellular response to metabolic
perturbation or danger that is shared by all children with
ASD. This is called the cell danger hypothesis.8 Aspects of
the cell danger response (CDR) are also referred to as the
integrated stress response.9–11 Preclinical studies showed
that the cell danger response in mice produced a treatable
metabolic syndrome that was maintained by purinergic
signaling. Antipurinergic therapy with suramin corrected
both the behavioral and metabolic features of these
genetic and environmental mouse models of ASD.12–14
The formulation of the cell danger hypothesis was
based on the recognition that similar metabolic pathways
were coordinately regulated as an adaptive response to
cellular threat regardless of whether the perturbation was
caused by a virus,15 a bacterium,16 genetic forms of mito-
chondrial disease,10 or neurodevelopmental disorders with
complex gene–environment pathogenic mechanisms like
autism.17 These metabolic pathways traced to mitochon-
dria. Mitochondria are responsible for initiating and
coordinating innate immunity18 and produce stereotyped
changes in oxidative metabolism under stress19 that lead
to the regulated release of purine and pyrimidine
nucleotides like ATP and UTP through cell membrane
channels.20 Inside the cell, ATP is an energy carrier. Out-
side the cell, extracellular ATP (eATP) is a multifunc-
tional signaling molecule, a potent immune modulator,21
and a damage-associated molecular pattern (DAMP) that
can activate microglia, and trigger IL-1b production and
inflammasome assembly.22 Extracellular purines like ATP,
ADP, and adenosine, and pyrimidines like UTP are
ligands for 19 different purinergic (P2X, P2Y, and P1)
receptors.23 The intracellular concentration of ATP
(iATP) in mammalian cells is typically 1–5 mmol/L,24 but
drops when ATP is released through membrane channels
under stress. Typical concentrations of extracellular ade-
nine nucleotides in the unstirred water layer at the cell
surface where receptors and ligands meet are about 1–10 lmol/L, near the effective concentration for most
purinergic receptors,25 but can increase when ATP is
released during cell stress. Concentrations of eATP in the
blood are another 500 times lower (10–20 nmol/L).26
Purinergic effectors like ATP are also coreleased with
canonical neurotransmitters like glutamate, dopamine,
and serotonin during depolarization at every synapse in
which they have been studied23 and play key roles in
activity-dependent synaptic remodeling.27 These and other
features28–30 led us to test the hypothesis that the CDR8
was maintained by purinergic signaling.12–14
Suramin has many actions. One of its best-studied
actions is as an inhibitor of purinergic signaling. It is the
oldest member of a growing class of antipurinergic drugs
(APDs) in development.31 Suramin was first synthesized
in 1916,32 making it one of the oldest manmade drugs
still in medical use. It is used to treat African sleeping
sickness (trypanosomiasis), and remains on the World
Health Organization list of essential medications. Con-
cerns about the toxicity of high-dose suramin arose when
the cumulative antitrypanosomal dose was increased 5
times or more over several months to treat AIDS or kill
cancer cells during chemotherapy. When blood levels
were maintained over 150 lmol/L for 3–6 months at a
time to treat cancer, a number of dose-limiting side
effects were described.32 These included adrenal insuffi-
ciency, anemia, and peripheral neuropathy. In contrast,
mouse studies suggested that high-dose suramin was not
necessary to treat autism-like symptoms. These studies
showed that low-dose suramin that produced blood levels
2 ª 2017 The Authors. Annals of Clinical and Translational Neurology published by Wiley Periodicals, Inc on behalf of American Neurological Association.
The Suramin Autism Treatment-1 Trial R. K. Naviaux et al.
of about 5–10 lM was effective in treating ASD-like
symptoms and did not produce toxicity even when used
for at least 4 months.12,14
Here, we report the findings of the Suramin Autism
Treatment-1 (SAT-1) trial, the first direct test of suramin,
the cell danger hypothesis, and the relevance of abnormal
purinergic signaling in children with ASD. These data help
form the foundation for future studies that will test the
safety and efficacy of suramin, provide fresh directions for
the development of new antipurinergic drugs, and add sup-
port to the hypothesis that a potentially treatable metabolic
syndrome may contribute to the pathogenesis of autism.
Materials and Methods
Study design and participants
The SAT-1 trial was an investigator-initiated, phase I/II,
double-blind, placebo-controlled, randomized clinical trial
to examine the safety and activity of single-dose suramin or
placebo in 10 children with autism spectrum disorders
(ASD). All children met DSM-5 diagnostic criteria for aut-
ism spectrum disorder, and received confirmatory testing by
Autism Diagnostic Observation Schedule, 2nd edition
(ADOS-2) examination. Inclusion criteria were male sub-
jects, ages 4–17 years, living in the San Diego, California
region, with a confirmed diagnosis of ASD. Exclusion crite-
ria included children who weighed less than the 5th per-
centile for age, took prescription medications, or had
laboratory evidence of liver, kidney, heart, or adrenal abnor-
malities. Children living more than a 90-min drive from the
testing sites in La Jolla, CA were excluded to eliminate the
possibility of aberrant behaviors resulting from extended car
travel. Children with known syndromic forms of ASD
caused by DNA mutation or chromosomal copy number
variation (CNV) were excluded in this first study. Families
were asked not to change their children’s therapy (e.g., sup-
plements, speech, and behavioral therapies) or diet through-
out the study period. The study was conducted between 27
May 2015 (date of the first child to be enrolled) and 3 March
2016 (date of the last child to complete the study).
Regulatory approvals, registration,CONSORT, and informed consent
The research plan, clinical trial protocol, informed con-
sents, advertising, and amendments were approved by the
University of California, San Diego (UCSD) Institutional
Review Board (IRB Project #150134) before implementa-
tion. The study was authorized by the U.S. Food and Drug
Administration (IND#118212), and conformed to the
World Medical Association Declaration of Helsinki–EthicalPrinciples for Medical Research Involving Human
Subjects,33 and the International Council for Harmoniza-
tion (ICH) E6 Good Clinical Practice (GCP) guidelines.
The trial was registered with clinical trials.gov (https://clini
caltrials.gov/ct2/show/NCT02508259). Reporting of the
SAT-1 trial conformed to CONSORT 2010 guidelines.34
Signed informed consent, with additional consent for video
and still image photography, were obtained from the par-
ents of all participants before enrollment and randomiza-
tion. Storyboards and social stories were created to review
with parents, help children visualize and prepare for the
study, and create the opportunity to ask questions (Fig-
ure S1, Data S2).
Randomization and masking
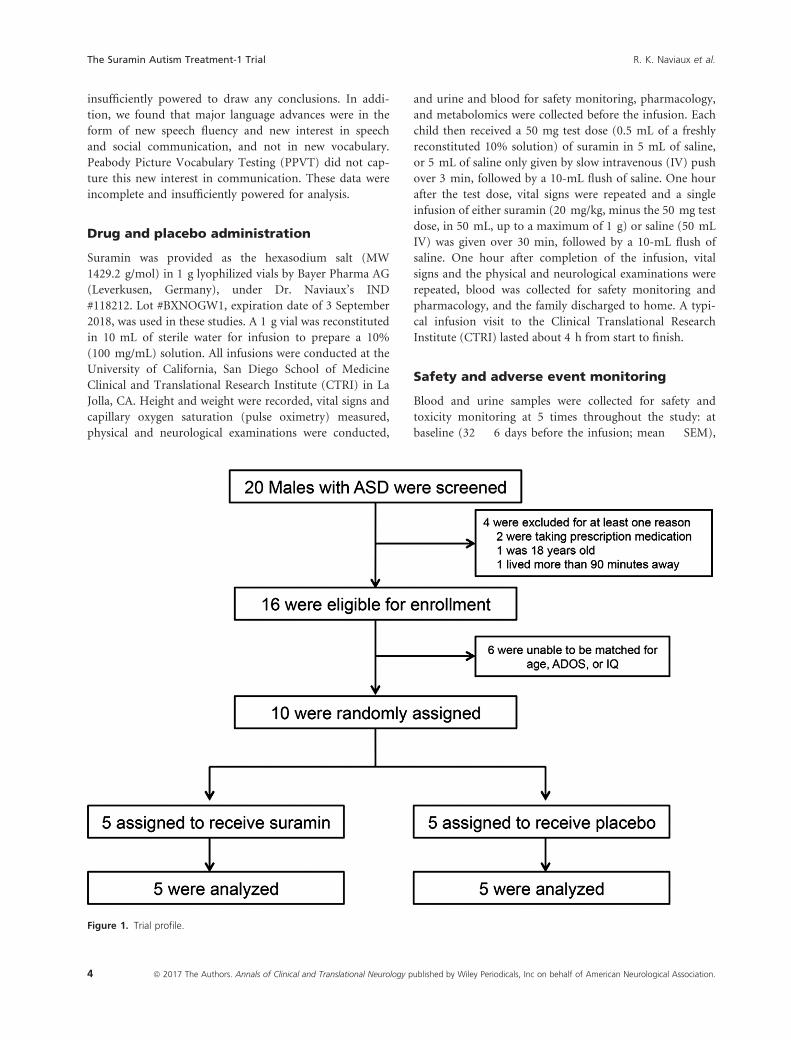
Twenty male subjects with ASD were screened. Sixteen met
entry criteria. Ten participants could be matched by age,
nonverbal IQ, and ADOS scores into five pairs. The ran-
domization sequence was generated electronically by the
biostatistical team. Subjects within each pair were allocated
to receive suramin or saline according to the prospectively
determined randomization sequence. The randomization
sequence was concealed from the clinical team and imple-
mented by the UCSD investigational pharmacy, which pre-
pared drug and placebo for infusion. The design was
double blind. The mask was not broken until all subjects
had completed the study and all clinical data had been
collected.
Diagnostic and outcome procedures
The diagnosis of each of the enrolled participants was con-
firmed by ADOS-235 comparison scores of ≥7. Nonverbal IQwas tested by Leiter-3 examination.36 The primary behavioral
outcomes were ADOS scores and language assessed by stan-
dardized vocabulary testing. Expressive vocabulary was assessed
by Expressive One-Word Picture Vocabulary Test
(EOWPVT).37 Primary outcomes were measured at baseline,
and 2 days and 6 weeks after infusion. Secondary outcomes
were the Aberrant Behavior Checklist (ABC),38 Autism Treat-
ment Evaluation Checklist (ATEC),39,40 Clinical Global Impres-
sion of Improvement (CGI)41 (Data S1), and Repetitive
Behavior Questionnaire (RBQ).42 Secondary outcomes were
measured at baseline, and 7 days and 6 weeks after infusion.
Protocol deviations
The original protocol was designed to collect electroen-
cephalography (EEG), heart rate variability (HRV), bal-
ance, gait, fine motor, and sensory motor data as
secondary outcomes. However, the wide range in ages
and abilities, small subject numbers, and task compliance
difficulties made collection of these data incomplete and
ª 2017 The Authors. Annals of Clinical and Translational Neurology published by Wiley Periodicals, Inc on behalf of American Neurological Association. 3
R. K. Naviaux et al. The Suramin Autism Treatment-1 Trial
insufficiently powered to draw any conclusions. In addi-
tion, we found that major language advances were in the
form of new speech fluency and new interest in speech
and social communication, and not in new vocabulary.
Peabody Picture Vocabulary Testing (PPVT) did not cap-
ture this new interest in communication. These data were
incomplete and insufficiently powered for analysis.
Drug and placebo administration
Suramin was provided as the hexasodium salt (MW
1429.2 g/mol) in 1 g lyophilized vials by Bayer Pharma AG
(Leverkusen, Germany), under Dr. Naviaux’s IND
#118212. Lot #BXNOGW1, expiration date of 3 September
2018, was used in these studies. A 1 g vial was reconstituted
in 10 mL of sterile water for infusion to prepare a 10%
(100 mg/mL) solution. All infusions were conducted at the
University of California, San Diego School of Medicine
Clinical and Translational Research Institute (CTRI) in La
Jolla, CA. Height and weight were recorded, vital signs and
capillary oxygen saturation (pulse oximetry) measured,
physical and neurological examinations were conducted,
and urine and blood for safety monitoring, pharmacology,
and metabolomics were collected before the infusion. Each
child then received a 50 mg test dose (0.5 mL of a freshly
reconstituted 10% solution) of suramin in 5 mL of saline,
or 5 mL of saline only given by slow intravenous (IV) push
over 3 min, followed by a 10-mL flush of saline. One hour
after the test dose, vital signs were repeated and a single
infusion of either suramin (20 mg/kg, minus the 50 mg test
dose, in 50 mL, up to a maximum of 1 g) or saline (50 mL
IV) was given over 30 min, followed by a 10-mL flush of
saline. One hour after completion of the infusion, vital
signs and the physical and neurological examinations were
repeated, blood was collected for safety monitoring and
pharmacology, and the family discharged to home. A typi-
cal infusion visit to the Clinical Translational Research
Institute (CTRI) lasted about 4 h from start to finish.
Safety and adverse event monitoring
Blood and urine samples were collected for safety and
toxicity monitoring at 5 times throughout the study: at
baseline (32 � 6 days before the infusion; mean � SEM),
Figure 1. Trial profile.
4 ª 2017 The Authors. Annals of Clinical and Translational Neurology published by Wiley Periodicals, Inc on behalf of American Neurological Association.
The Suramin Autism Treatment-1 Trial R. K. Naviaux et al.

immediately before the infusion, 1 h after the infusion,
2 days after, and 45 days after the infusion. Unexpected
and adverse events were recorded as they occurred and
graded in severity according to the National Cancer Insti-
tute Common Terminology Criteria for Adverse Events
v4.03 (CTCAE) scale. Additional pharmacovigilence mon-
itoring included daily scripted phone calls in the first
week, then 4 weekly calls until the exit examinations at
6 weeks. Each child received a formal neurological exami-
nation by a board-certified pediatric neurologist at base-
line and at the end of the study. An independent data
safety monitoring board (DSMB) reviewed the data and
IRB communications for the study.
Pharmacokinetics
Plasma samples were collected for suramin pharmacoki-
netics (PK) before the infusion, at 1 h, 2 days, and
45 days postinfusion. Suramin concentrations were mea-
sured by high-performance liquid chromatography and
tandem mass spectrometry (LC-MS/MS) as described pre-
viously.13 See Supplemental Methods for details. The
small number of PK samples per subject prevented a stan-
dard, noncompartmental analysis in individual subjects.
The suramin drug concentrations were analyzed using a
population PK approach with post hoc empiric Bayesian
estimate of PK parameters in individual subjects. The PK
data were fit to a two-compartment model using the com-
puter program NONMEM (ICON, Dublin, Ireland).43 PK
parameters were scaled allometrically with volume terms
scaled to linear body weight (kg1.0) and clearance terms
scaled to weight (kg0.75). Scaled adult suramin parameters
of compartmental volumes of distribution and clearance
were used as initial parameter estimates and between sub-
ject variability only estimated for clearance (CL) and the
peripheral volume of distribution (Vd).
Pharmacometabolomics
Targeted, broad-spectrum, plasma metabolomic analysis,
covering 63 biochemical pathways, was performed by LC-
MS/MS as described previously44 with minor modifications.
In all, 431 of 610 targeted metabolites were measureable in
plasma. See Supplemental Methods for details.
Table 1. Group characteristics.
Parameter
Suramin group
Mean � SD (range)
or Number
Placebo group
Mean � SD (range)
or Number P value2
Number (male subjects) 5 5 N/A
Age (years) 8.9 � 3.3 (5.7–13.6) 9.2 � 3.8 (6.2–14.7) 0.88
Leiter IQ 82 � 7.8 (75–92) 79 � 8.8 (66–87) 0.69
ADOS Score 8.6 � 0.9 (8–10) 9.4 � 1.3 (7–10) 0.30
Weight (kg) 32 � 14 (23–55) 40 � 23 (24–80) 0.53
Weight percentile 64 � 16 (42–84) 78 � 30 (25–98) 0.40
Height (cm) 136 � 23 (118–174) 137 � 28 (113–180) 0.92
BSA1 (m2) 1.09 � 0.32 (0.87–1.63) 1.21 � 0.46 (0.87–1.99) 0.64
Body mass index (kg/m2) 16.8 � 1.1 (15.5–18.1) 19.9 � 3.1 (16.2–24.7) 0.07
Head circumference (cm) 54.3 � 2.8 (51.5–57.5) 54.5 � 2.3 (51.5–57) 0.90
HC percentile 75 � 30 (35–99) 75 � 27 (42–97) 0.97
Age at ASD diagnosis (yrs) 3.2 � 0.5 (2.5–3.75) 2.7 � 0.3 (2.5–3.0) 0.10
Paternal age at birth (yrs) 37 � 3.2 (35–41) 43 � 12 (33–64) 0.62
Maternal age at birth (yrs) 35 � 2.8 (32–38) 41 � 6 (33–47) 0.053
Sibling with ASD 0 1 0.99
History of GI issues – current 0 1 0.99
Maintains a gluten-free diet 0 1 0.99
IVF conception 1 0 0.99
C-section delivery 1 1 0.99
History of premature birth 0 1 0.99
History of epilepsy3 – current 0 0 0.99
History of developmental regression(s) 3 2 0.99
History of asthma – current 0 0 0.99
ASD symptom improvement with fever 2 1 0.99
BSA, body surface area; HC, head circumference; GI, gastrointestinal; IVF, in vitro fertilization; ASD, autism spectrum disorder.1Mosteller method.2Student’s t-test for continuous data; Fisher’s exact test for categorical data.3Patients taking prescription drugs were excluded from the study. This included anticonvulsant medications.
ª 2017 The Authors. Annals of Clinical and Translational Neurology published by Wiley Periodicals, Inc on behalf of American Neurological Association. 5
R. K. Naviaux et al. The Suramin Autism Treatment-1 Trial
Sample size calculation and statisticalanalysis
This was a pilot study designed to obtain activity data
and effect size estimates upon which future sample size
calculations could be based. No data on suramin in aut-
ism were available for sample size calculations prior to
this study. Each child was used as his own control to
examine before and after treatment effects in a paired
t-test design for the analysis of the ADOS, EOWPVT,
ABC, ATEC, RBQ, and blood and urine safety data.
Paired, nonparametric analysis was done by Wilcoxon
signed-rank sum test. Categorical data, such as the pres-
ence or absence of adverse events or historical symptoms,
was analyzed by Fisher’s exact test. Two-way ANOVA
(treatment 9 time), with Sidak post hoc correction, was
used to analyze the 6-week summaries captured by the
ADOS, CGI, and blood and urine safety analysis. Cohen’s
d – calculated as the mean difference of the paired,
within-subject scores before and after treatment, divided
by the standard deviation of the differences – was used as
an estimate of effect size. Metabolomic data were log-
transformed, scaled by control standard deviations, and
analyzed by multivariate partial least squares discriminant
analysis (PLSDA), with pairwise comparisons and post
hoc correction for multiple hypothesis testing using Fish-
er’s least significant difference method in MetaboAna-
lyst,45 or the false discovery rate (FDR) method of
Benjamini and Hochberg. Metabolites with variable
importance in projection (VIP) scores determined by
PLSDA that were greater than 1.5 were considered signifi-
cant. Methods were implemented in Stata (Stata/SE12.1,
StataCorp, College Station, TX), Prism (Prism 6, Graph-
Pad Software, La Jolla, CA), or R. Significant metabolites
were grouped into pathways and their VIP scores
summed to determine the rank-ordered significance of
each biochemical pathway.
Results
Participant disposition and demographics
Figure 1 illustrates the CONSORT flow diagram for patient
recruitment, allocation, and analysis in the SAT-1 study.
The two treatment groups were well matched (Table 1).
The mean age was 9.1 years (range = 5–14). The mean
nonverbal Leiter IQ was 80 (range = 66–92). The mean
ADOS-2 comparison score was 9.0 (range = 7–10).
Safety monitoring and adverse events
Extensive monitoring revealed no serious toxicities
(CTCAE grades 3–5). Neurologic examinations showed
there was no peripheral neuropathy (Table 2). Analysis of
free cortisol, hemoglobin, white blood cell count (WBC),
platelets, liver transaminases, creatinine, and urine protein
showed no differences in children who received suramin
and placebo (Fig. 2). Five children who received suramin
Table 2. Summary of adverse or unanticipated events.
No. Events Suramin (N = 5) CTCAE1 grade Placebo (N = 5) CTCAE1 grade P value2
1 Asymptomatic rash 5 1 0 – 0.0079
2 Uncomplicated URI3 2 1 2 1 0.99
3 Headache 1 1 0 – 0.99
4 Emesis 9 1 14 1 15 1 0.99
5 Hyperactivity 26 1 1 1 0.99
6 Hypoglycemia7 1 2 1 2 0.99
7 Leukocytosis 0 – 18 1 0.99
8 Enuresis 19 1 0 – 0.99
9 Peripheral neuropathy 0 – 0 – 0.99
Total: 13 – 6 – 0.12
Nonrash AEs: 8 – 6 – 0.77
1CTCAE, common terminology criteria for adverse events v4.03. Mild to moderate = Grades 1–2; Serious = Grades 3–5.2Fisher’s exact test.3URI, upper respiratory tract infection, common cold. Infusions occurred October–February.4In 7-year-old after pizza and slushee consumption after playing youth league basketball.5In a 6-year-old after a car ride.6In a 5- and 14-year-old intermixed with periods of calm focus in first week (the 14-year-old) or first 3 weeks (the 5-year-old).7Six weeks after the infusion, after several days of a URI and fasting before lunch. Hypoglycemia was asymptomatic and corrected after a normal
lunch.8Leukocytosis (12.2k WBC) occurred on the day of the saline infusion and preceded a URI.9In a 7-year-old briefly for a few days while sick with a cold. None of the events required medical intervention. No serious adverse events (SAEs)
occurred in this study.
6 ª 2017 The Authors. Annals of Clinical and Translational Neurology published by Wiley Periodicals, Inc on behalf of American Neurological Association.
The Suramin Autism Treatment-1 Trial R. K. Naviaux et al.
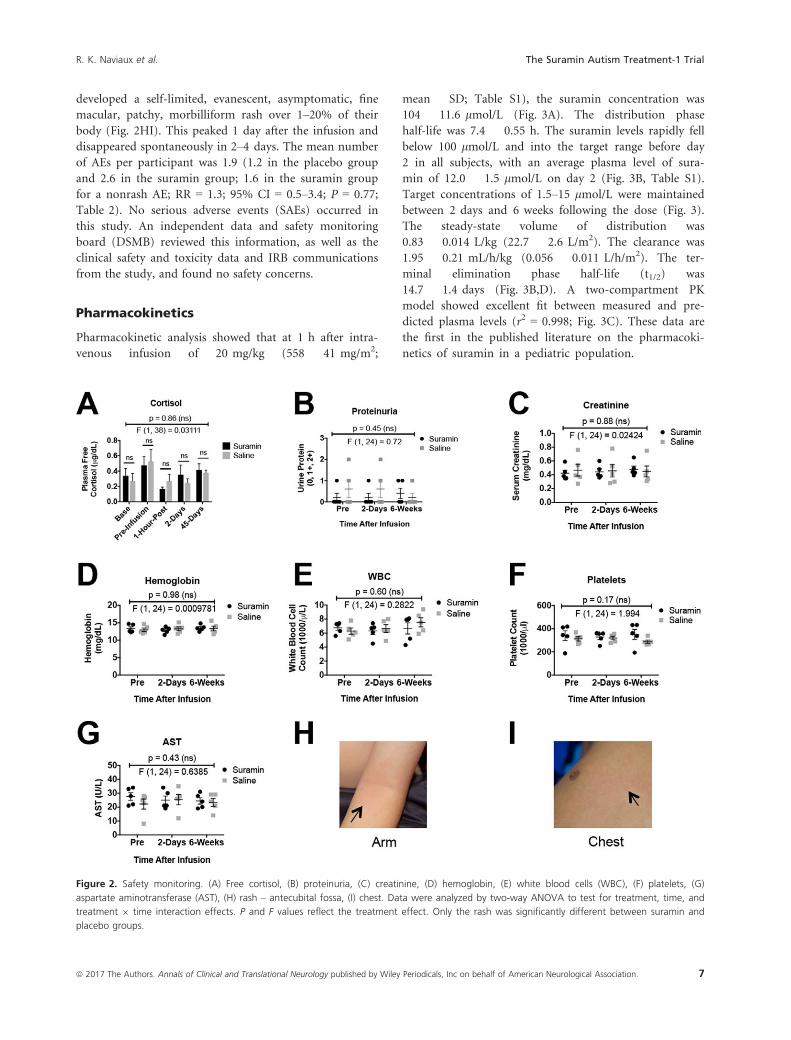
developed a self-limited, evanescent, asymptomatic, fine
macular, patchy, morbilliform rash over 1–20% of their
body (Fig. 2HI). This peaked 1 day after the infusion and
disappeared spontaneously in 2–4 days. The mean number
of AEs per participant was 1.9 (1.2 in the placebo group
and 2.6 in the suramin group; 1.6 in the suramin group
for a nonrash AE; RR = 1.3; 95% CI = 0.5–3.4; P = 0.77;
Table 2). No serious adverse events (SAEs) occurred in
this study. An independent data and safety monitoring
board (DSMB) reviewed this information, as well as the
clinical safety and toxicity data and IRB communications
from the study, and found no safety concerns.
Pharmacokinetics
Pharmacokinetic analysis showed that at 1 h after intra-
venous infusion of 20 mg/kg (558 � 41 mg/m2;
mean � SD; Table S1), the suramin concentration was
104 � 11.6 lmol/L (Fig. 3A). The distribution phase
half-life was 7.4 � 0.55 h. The suramin levels rapidly fell
below 100 lmol/L and into the target range before day
2 in all subjects, with an average plasma level of sura-
min of 12.0 � 1.5 lmol/L on day 2 (Fig. 3B, Table S1).
Target concentrations of 1.5–15 lmol/L were maintained
between 2 days and 6 weeks following the dose (Fig. 3).
The steady-state volume of distribution was
0.83 � 0.014 L/kg (22.7 � 2.6 L/m2). The clearance was
1.95 � 0.21 mL/h/kg (0.056 � 0.011 L/h/m2). The ter-
minal elimination phase half-life (t1/2) was
14.7 � 1.4 days (Fig. 3B,D). A two-compartment PK
model showed excellent fit between measured and pre-
dicted plasma levels (r2 = 0.998; Fig. 3C). These data are
the first in the published literature on the pharmacoki-
netics of suramin in a pediatric population.
Figure 2. Safety monitoring. (A) Free cortisol, (B) proteinuria, (C) creatinine, (D) hemoglobin, (E) white blood cells (WBC), (F) platelets, (G)
aspartate aminotransferase (AST), (H) rash – antecubital fossa, (I) chest. Data were analyzed by two-way ANOVA to test for treatment, time, and
treatment 9 time interaction effects. P and F values reflect the treatment effect. Only the rash was significantly different between suramin and
placebo groups.
ª 2017 The Authors. Annals of Clinical and Translational Neurology published by Wiley Periodicals, Inc on behalf of American Neurological Association. 7
R. K. Naviaux et al. The Suramin Autism Treatment-1 Trial

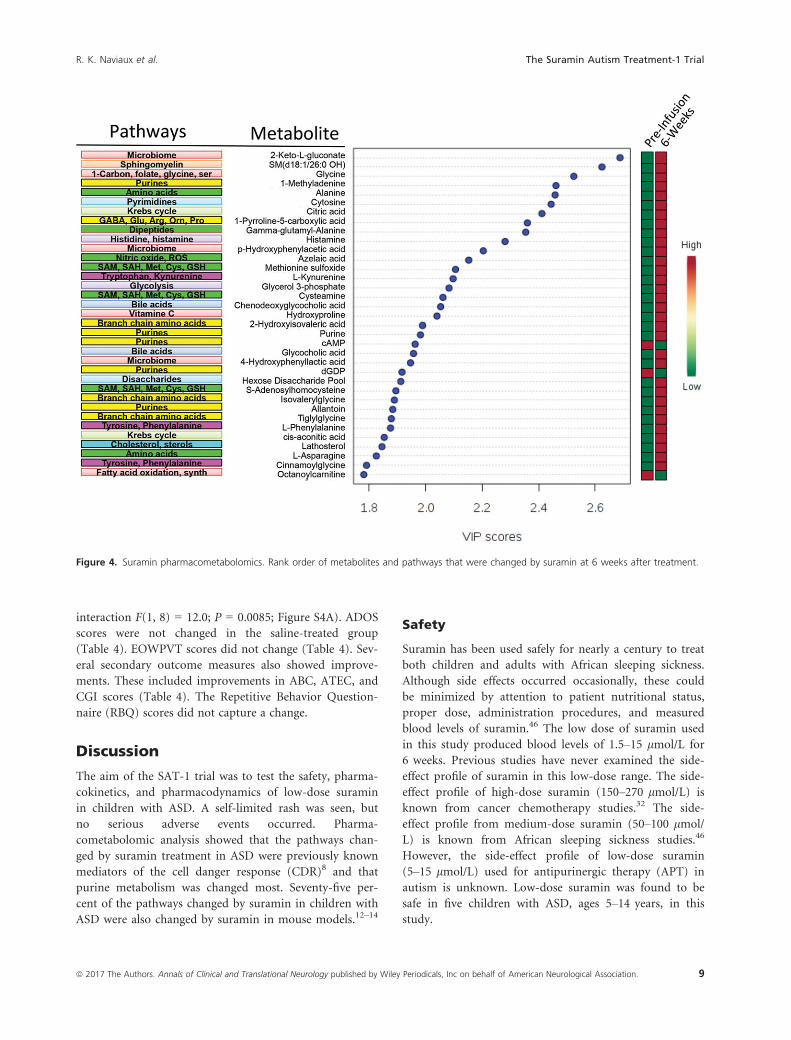
Pharmacometabolomics
Targeted plasma metabolomics was performed immedi-
ately before infusion, at 2 days, and 6 weeks after the
infusion. The rank order of the top 35 of 48 significant
metabolites 6 weeks after suramin treatment is illustrated
in Figure 4. The rank order after 2 days is illustrated in
Figure S2. Consistent with our previously published work
using mouse models, the metabolic effects of suramin
resulted in a decrease of the cell danger response8 and
restored more normal metabolism.12,13 Purine metabolism
was the single most changed pathway (Table 3, Table S2).
Suramin increased healthy purines such as AICAR, which
is an activator of the master metabolic regulator AMP-
dependent protein kinase (AMPK). 1-Methyl-adenine
(1-MA) was also increased. 1-MA is derived from 1-
methyl-adenosine, a recently recognized marker of new
protein synthesis and cell growth. Suramin decreased
other purines in the plasma such as cAMP and dGDP
(Fig. 4, Tables S3 and S4). Improvements in 1-carbon,
folate, methionine, and cysteine metabolism were also
found (Table 3, and Figure S3). Figure 5 illustrates the
similarities found in the pharmacometabolomic response
to suramin in MIA13 and Fragile X mouse models12 and
in children with ASD in this study. Twenty-one of the 28
(75%) pathways changed in ASD were also changed by
suramin treatment in the mouse models of ASD (Fig. 5).
Outcomes
The primary outcome measures were ADOS-2 and Expres-
sive One-Word Picture Vocabulary (EOWPVT) scores
(Table 4). Parents reported that after suramin treatment,
the rate of language, social, behavioral, and developmental
improvements continued to increase for 3 weeks, then
gradually decreased toward baseline over the next 3 weeks.
The blood levels of suramin at 3 weeks were estimated to
be 4.2 � 0.5 lmol/L using our PK model. ADOS-2 com-
parison scores at 6 weeks improved by an average of
�1.6 � 0.55 points (mean � SD; n = 5; 95% CI = �2.3
to �0.9; Cohen’s d = 2.9; P = 0.0028) in the suramin
treatment group and did not change in the saline group.
We calculated P values by both parametric and nonpara-
metric methods (Table 4). The mean ADOS comparison
score in the suramin-treated group was 8.6 � 0.4 at base-
line and 7.0 � 0.3 at 6 weeks. Two-way ANOVA of ADOS
scores of suramin and placebo groups measured at baseline
and at 6 weeks were also significant (treatment 9 time
Figure 3. Pharmacokinetics of single-dose suramin in children with autism spectrum disorders. (A) Two-compartment model of suramin blood
concentrations. The first 48 h were dominated by the distribution phase. Over 90% of the model is described by the elimination phase. (B)
Plasma suramin concentrations. (C) A two-compartment model correlated well with measured values. (D) Pediatric PK parameters of suramin.
8 ª 2017 The Authors. Annals of Clinical and Translational Neurology published by Wiley Periodicals, Inc on behalf of American Neurological Association.
The Suramin Autism Treatment-1 Trial R. K. Naviaux et al.
interaction F(1, 8) = 12.0; P = 0.0085; Figure S4A). ADOS
scores were not changed in the saline-treated group
(Table 4). EOWPVT scores did not change (Table 4). Sev-
eral secondary outcome measures also showed improve-
ments. These included improvements in ABC, ATEC, and
CGI scores (Table 4). The Repetitive Behavior Question-
naire (RBQ) scores did not capture a change.
Discussion
The aim of the SAT-1 trial was to test the safety, pharma-
cokinetics, and pharmacodynamics of low-dose suramin
in children with ASD. A self-limited rash was seen, but
no serious adverse events occurred. Pharma-
cometabolomic analysis showed that the pathways chan-
ged by suramin treatment in ASD were previously known
mediators of the cell danger response (CDR)8 and that
purine metabolism was changed most. Seventy-five per-
cent of the pathways changed by suramin in children with
ASD were also changed by suramin in mouse models.12–14
Safety
Suramin has been used safely for nearly a century to treat
both children and adults with African sleeping sickness.
Although side effects occurred occasionally, these could
be minimized by attention to patient nutritional status,
proper dose, administration procedures, and measured
blood levels of suramin.46 The low dose of suramin used
in this study produced blood levels of 1.5–15 lmol/L for
6 weeks. Previous studies have never examined the side-
effect profile of suramin in this low-dose range. The side-
effect profile of high-dose suramin (150–270 lmol/L) is
known from cancer chemotherapy studies.32 The side-
effect profile from medium-dose suramin (50–100 lmol/
L) is known from African sleeping sickness studies.46
However, the side-effect profile of low-dose suramin
(5–15 lmol/L) used for antipurinergic therapy (APT) in
autism is unknown. Low-dose suramin was found to be
safe in five children with ASD, ages 5–14 years, in this
study.
Figure 4. Suramin pharmacometabolomics. Rank order of metabolites and pathways that were changed by suramin at 6 weeks after treatment.
ª 2017 The Authors. Annals of Clinical and Translational Neurology published by Wiley Periodicals, Inc on behalf of American Neurological Association. 9
R. K. Naviaux et al. The Suramin Autism Treatment-1 Trial
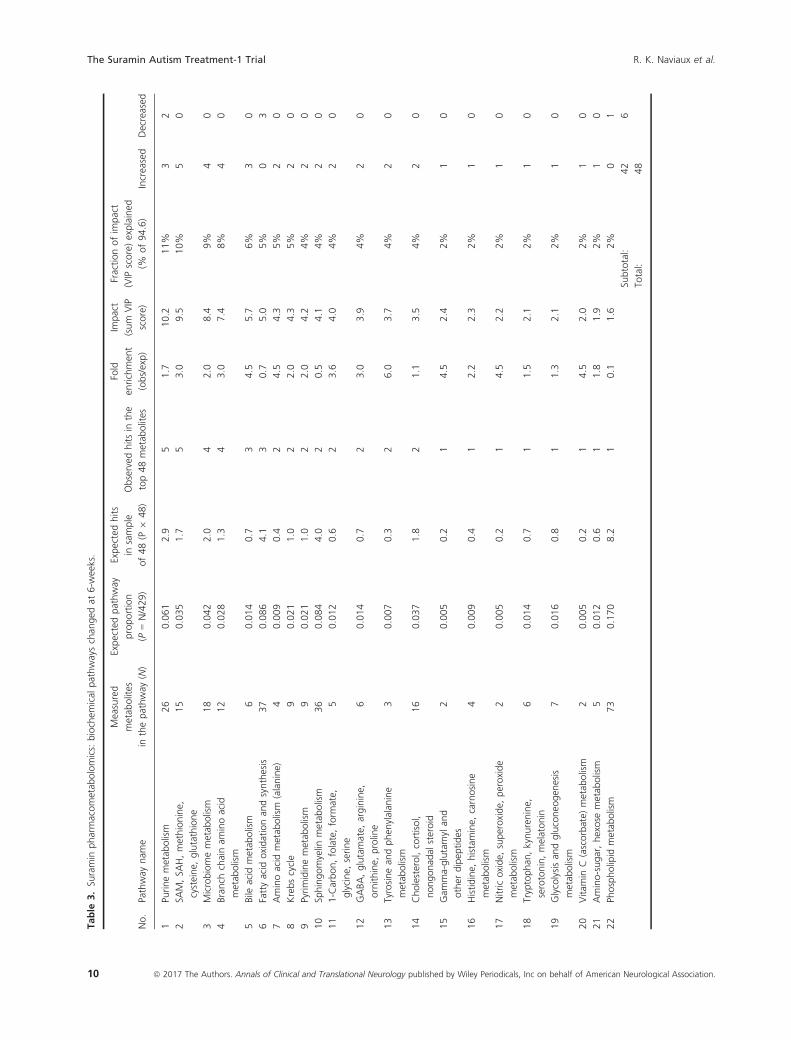
Table
3.Su
ramin
pharmacometab
olomics:
biochem
ical
pathwayschan
ged
at6-w
eeks.
No.
Pathway
nam
e
Measured
metab
olites
inthepathway
(N)
Expectedpathway
proportion
(P=N/429)
Expectedhits
insample
of48(P
948)
Observed
hitsin
the
top48metab
olites
Fold
enrichmen
t
(obs/exp)
Impact
(sum
VIP
score)
Fractionofim
pact
(VIP
score)explained
(%of94.6)
Increased
Decreased
1Pu
rinemetab
olism
26
0.061
2.9
51.7
10.2
11%
32
2SA
M,SA
H,methionine,
cysteine,
glutathione
15
0.035
1.7
53.0
9.5
10%
50
3Microbiomemetab
olism
18
0.042
2.0
42.0
8.4
9%
40
4Branch
chainam
inoacid
metab
olism
12
0.028
1.3
43.0
7.4
8%
40
5Bile
acid
metab
olism
60.014
0.7
34.5
5.7
6%
30
6Fattyacid
oxidationan
dsynthesis
37
0.086
4.1
30.7
5.0
5%
03
7Aminoacid
metab
olism
(alanine)
40.009
0.4
24.5
4.3
5%
20
8Krebscycle
90.021
1.0
22.0
4.3
5%
20
9Pyrimidinemetab
olism
90.021
1.0
22.0
4.2
4%
20
10
Sphingomyelin
metab
olism
36
0.084
4.0
20.5
4.1
4%
20
11
1-Carbon,folate,form
ate,
glycine,
serine
50.012
0.6
23.6
4.0
4%
20
12
GABA,glutamate,
arginine,
ornithine,
proline
60.014
0.7
23.0
3.9
4%
20
13
Tyrosinean
dphen
ylalan
ine
metab
olism
30.007
0.3
26.0
3.7
4%
20
14
Cholesterol,cortisol,
nongonad
alsteroid
16
0.037
1.8
21.1
3.5
4%
20
15
Gam
ma-glutamyl
and
other
dipep
tides
20.005
0.2
14.5
2.4
2%
10
16
Histidine,
histamine,
carnosine
metab
olism
40.009
0.4
12.2
2.3
2%
10
17
Nitricoxide,
superoxide,
peroxide
metab
olism
20.005
0.2
14.5
2.2
2%
10
18
Tryptophan
,kynurenine,
serotonin,melatonin
60.014
0.7
11.5
2.1
2%
10
19
Glycolysisan
dgluconeo
gen
esis
metab
olism
70.016
0.8
11.3
2.1
2%
10
20
Vitam
inC
(ascorbate)
metab
olism
20.005
0.2
14.5
2.0
2%
10
21
Amino-sugar,hexose
metab
olism
50.012
0.6
11.8
1.9
2%
10
22
Phospholipid
metab
olism
73
0.170
8.2
10.1
1.6
2%
01
Subtotal:
42
6
Total:
48
10 ª 2017 The Authors. Annals of Clinical and Translational Neurology published by Wiley Periodicals, Inc on behalf of American Neurological Association.
The Suramin Autism Treatment-1 Trial R. K. Naviaux et al.

Study limitations
Limitations of the SAT-1 study included its small size and
the suboptimal timing of the outcome measurements.
Parents reported that the rate of new behavioral and
developmental improvements continued to increase for
the first 3 weeks after the single dose of suramin, as blood
levels of suramin fell from 12 to 4 lmol/L, then gradually
decreased toward baseline over the next 3 weeks, as blood
levels fell further from 4 to 1.5 lmol/L. This pattern of
response suggested a threshold effect at about 4 lmol/L
that could not have been predicted on the basis of what
was known about suramin before this study, and out-
comes were not measured at 3 weeks.
Another potential limitation of the trial was the self-
limited rash. The rash was asymptomatic and resolved
spontaneously in a few days. In theory, the rash may have
biased parents in a way that caused them to either
improve their scores on the ABC, ATEC, RBQ, and CGI,
or to report more side-effects or adverse behaviors at
both the 7-day and 6-week reports. Examiner-based
ADOS scoring was more resistant to this potential bias,
since the rash was not visible on exposed skin to the out-
come examiners at any time. However, a design limitation
of the study was that one of the two ADOS examiners
was also assigned to conduct scripted phone interviews
with the families, and might have been susceptible to
unconscious bias even though the study remained blinded
and the rash preceded any significant examiner-based
outcomes by one and a half months.
Another potential weakness of this study was that
ADOS scoring was not designed to be, and is not typically
used as, a repeated measure of outcomes in autism treat-
ment studies. This has occurred historically for two coun-
terbalancing reasons: (1) because it is generally believed
that ADOS scores are diagnostic and are not sensitive to
change once the diagnosis is established, and (2) because
training effects have the potential to produce improve-
ments that are artifactual. With regard to the first point,
under the right circumstances ADOS scores can be sensi-
tive to change and have recently been used successfully as
an outcome measure in a large autism treatment study.47
With regard to the second point, if training effects
occurred, they were asymmetric, since improvements were
only observed in the suramin treatment group and were
not observed in the placebo group (Table 4).
Psychopharmacology
Suramin has objective central nervous system (CNS) effects
in animal models12–14 and children with autism despite
being unable to penetrate the blood–brain barrier.48 Sura-
min also has a number of peripheral effects on innate
immunity, metabolism, pain, gut, autonomic, inflamma-
tory, and other pathways regulated by purinergic signaling
that may contribute to the beneficial effects observed.8,23
Previous studies have shown that suramin is taken up into
the CNS at the level of the brainstem, although not appre-
ciably into the cerebrum or cerebellum.13 There are eight
circumventricular organs (CVOs) in the brain that contain
neurons that lack a blood–brain barrier.49 The area post-
rema in the brainstem is one of these CVOs that monitors
the chemistry of the blood and transduces this information
to higher centers in the brain for neuroendocrine, affective,
cognitive, and behavioral integration. Rather than being a
disadvantage, the peripheral actions and indirect CNS
effects of suramin may have certain advantages by mini-
mizing the risk of CNS toxicity. While new antipurinergic
drugs (APDs) may soon be developed that can pass the
blood–brain barrier, this appears not to be required to
produce the behavioral effects of suramin in ASD.
Conclusions
The SAT-1 trial examined the effects of low-dose suramin
or placebo in 10 children with autism spectrum disorder.
No safety concerns were found. A two-compartment
pharmacokinetic model permitted accurate forecasting of
plasma drug levels from 1 h to 6 weeks after the infusion.
Metabolomic studies confirmed the importance of the cell
danger response (CDR)8 and purinergic signaling.12–14 A
single intravenous dose of suramin was associated with
improved scores for language, social interaction, and
Figure 5. Shared biochemical pathways. 75% of the pathways that
were altered by suramin in children with ASD were also altered in the
mouse models. Asterisks (*) indicate pathways that were changed at
2 days, but not at 6 weeks after treatment.
ª 2017 The Authors. Annals of Clinical and Translational Neurology published by Wiley Periodicals, Inc on behalf of American Neurological Association. 11
R. K. Naviaux et al. The Suramin Autism Treatment-1 Trial

Table
4.Outcomes.
Outcome
Suramin
Placeb
o
Instrumen
t
Factoror
beh
avior
Timeafter
treatm
ent
(days)
Difference
from
baseline(m
ean�
SD)
95%
CI
d1
NP2
P3Difference
from
baseline(m
ean�
SD)
95%
CI
d1
NP2
P3
Prim
aryoutcomes
ADOS-2
Comparison
45
�1.6
�0.55
�2.3
to�0
.92.9
50.0028
0.038
�0.4
�0.55
�1.1
to+0.28
0.7
50.18
0.16
Raw
45
�4.6
�1.9
�7.0
to�2
.22.4
50.0062
0.039
�0.4
�1.8
�2.7
to+1.9
0.22
50.65
0.58
Social
45
�3.2
�1.9
�5.6
to�0
.81.7
50.020
0.043
0.0
�1.7
�2.2
to+2.2
05
0.99
0.71
Restr/Rep
45
�1.4
�0.89
�2.5
to�0
.29
1.6
50.025
0.059
�0.4
�2.1
�3.0
to+2.2
0.19
50.69
0.58
EOWPV
TVocabulary
45
�4.2
�8.3
�14.5
to+6.1
�0.51
50.32
0.50
+2.0
�4.6
�3.8
to+7.8
0.43
50.39
0.50
Secondaryoutcomes
ABC
Stereo
typy
7�3
.6�
2.1
�6.2
to�1
.01.7
50.018
0.043
+0.4
�1.9
� 2.0
to+2.8
�0.21
50.67
0.68
Stereo
typy
45
�4.0
�2.3
�6.9
to�1
.11.7
50.019
0.042
+1.0
�4.3
�4.3
to+6.3
�0.23
50.63
0.69
ATEC
Total
7�1
0�
7.7
�20to
�0.46
1.3
50.044
0.043
+7.2
�14
�10to
+25
�0.51
50.32
0.35
Languag
e7
�2.2
�1.5
�4.0
to�0
.36
1.4
50.021
0.059
0.0
�4.1
�5.0
to+5.0
05
0.99
0.89
Sociab
ility
7�3
.6�
2.6
�6.8
to�0
.36
1.4
50.025
0.063
�0.8
�2.8
�4.3
to+2.6
0.29
50.55
0.58
Languag
e45
�2.0
�1.4
�2.7
to�0
.49
1.4
50.034
0.059
�0.2
�2.9
�3.8
to+3.4
0.07
50.88
0.79
CGI
OverallASD
45
�1.8
�1.04
�3.4
to�0
.15
1.7
50.05
n/a
0.0
�0.34
�0.55to
+0.55
05
0.99
n/a
E.Languag
e45
�2.0
�1.04
�3.6
to�0
.35
1.9
50.01
n/a
0.0
�0.34
�0.55to
+0.55
05
0.99
n/a
Social
Inter.
45
�2.0
�1.04
�3.6
to�0
.35
1.9
50.01
n/a
0.0
�0.34
�0.55to
+0.55
05
0.99
n/a
RBQ
Total
45
�3.2
�5.8
�10.4
to+4.0
0.55
50.28
0.22
�0.8
�3.3
�4.9
to3.3
0.24
50.62
0.47
ADOS-2,au
tism
diagnosticobservationsched
ule,2nded
ition;EO
WPV
T,ExpressiveOne-Word
Picture
Vocabulary
Test;ABC,ab
errantbeh
aviorchecklist;ATEC,au
tism
treatm
entevaluationcheck-
list;CGI,clinical
global
impressionsurvey;RBQ,repetitivebeh
aviorquestionnaire;Restr/Rep
,restricted
orrepetitivebeh
aviors;OverallASD
Sx,overallASD
symptoms;
E.Languag
e,expressivelan-
guag
e;So
cial
Inter.,social
interaction.Analysis.ADOS,
EOWPV
T,ABC,ATEC,an
dRBQ
scoreswerean
alyzed
bypaired
analysis
before
and
aftertreatm
entusing
each
subject
astheirown
control.CGIwas
analyzed
bytw
o-w
ayANOVA
(sym
ptom
9timebefore
andaftertreatm
ent)withpost
hoccorrection.Nonparam
etricPvalues
werenotcalculated(n/a).Interpretation.ADOS,
ABC,ATEC,CGI,an
dRBQ
areseverity
scores;
neg
ativedifferencesfrom
baselinereflectdecreased
severity,that
is,im
provemen
t.EO
WPV
Tisaperform
ance
score;neg
ativedifferencesreflecta
decrease.
1A
positive
Cohen
’sdreflects
improvemen
t,an
daneg
ativedreflects
adecreasebyconvention.Cohen
’sdislikelyan
overestim
ateoftheactual
treatm
enteffect
based
onthelargemeandiffer-
encesan
dsm
allstan
darddeviationsfoundbefore
andaftertreatm
entin
thissm
allstudy.
2Pvaluefrom
param
etricpairedt-test
analysis.
3Pvaluefrom
nonparam
etricpairedWilcoxonsigned
-ran
ksum
analysis.
12 ª 2017 The Authors. Annals of Clinical and Translational Neurology published by Wiley Periodicals, Inc on behalf of American Neurological Association.
The Suramin Autism Treatment-1 Trial R. K. Naviaux et al.
decreased restricted or repetitive behaviors measured by
ADOS, ABC, ATEC, and CGI scores. None of these
improvements occurred in the five children who received
placebo. The generalizability of these findings is unknown.
Future studies will be needed to confirm these findings in
larger numbers of children with ASD, and to evaluate
whether a few doses of suramin given over a few months
are safe and might facilitate continued improvements.
Special note from the authors
Suramin is not approved for the treatment of autism.
Like many intravenous drugs, when administered improp-
erly by untrained personnel, at the wrong dose and sched-
ule, without careful measurement of drug levels and
monitoring for toxicity, suramin can cause harm. Careful
clinical trials will be needed over several years at several
sites to learn how to use low-dose suramin safely in aut-
ism, and to identify drug–drug interactions and rare side
effects that cannot currently be predicted. We strongly
caution against the unauthorized use of suramin.
Acknowledgments
RKN thanks the patients and families who gave their time
and effort in helping to make this study possible. We
thank Dr. Richard Haas, Dr. Doris Trauner, and Dr. Ste-
phen Edelson for their advice in planning the study. We
thank Dr. Judy S. Reilly for critical reading of the manu-
script and suggestions for improvements. RKN also
thanks Jonathan Monk for assistance with the Cytoscape
visualizations, Marlene Samano and Nicole Suarez, and
Maeve Taaffe, Lee Vowinkel, Dennis Perpetua, Jessica
Nasca, Peewee Buquing, and Patricia Moraes for their
expert clinical assistance at the UCSD Clinical Transla-
tional Research Institute, and Thaine Ross and Melinda
Stafford for their expert assistance in the Investigational
Pharmacy. RKN extends a special thanks to graphic artists
Suzanne Parlett and Qamdyn Hale for help in creating
the storyboards used in the study.
Author Contributions
Dr. Robert Naviaux raised the funding, obtained the reg-
ulatory approvals, conceived, designed, and directed the
trial, analyzed the data, prepared the figures, and wrote
the manuscript. Dr. Curtis, Dr. Westerfield, and Ms.
Mash performed the neurodevelopmental testing, pro-
vided clinical coordination, and edited the manuscript.
Dr. Reiner helped design the study, coordinated patient
infusions and clinical care, and edited the manuscript.
Dr. Li, Dr. Jane Naviaux, and Dr. Wang performed the
metabolomic and pharmacokinetic analysis, analyzed the
data, prepared the figures, and wrote parts of the manu-
script. Dr. Jain and Ms. He helped design the study, pre-
pared the randomization key, performed biostatistical
analyses, and edited the manuscript. Dr. Bright directed
the data compilation, integrity, and completeness analy-
sis, provided independent biostatistical analysis, and edi-
ted the manuscript. Dr. Goh helped design the study,
performed neurologic examinations, and edited the
manuscript. Dr. Alaynick helped design the study and
edited the manuscript. Dr. Capparelli analyzed the phar-
macokinetic data, prepared the figures, and wrote parts
of the manuscript. Dr. Sun and Ms. Adams provided
investigational pharmacy support, implemented the clini-
cal mask, and edited the manuscript. Ms. Arellano pro-
vided clinical coordination and edited the manuscript.
Dr. Chukoskie helped design the study, analyzed the
data, critically reviewed and edited the manuscript. Dr.
Lincoln and Dr. Townsend helped design the study,
directed the neurodevelopmental studies, wrote and
edited the manuscript.
Conflict of Interest
RKN has filed a provisional patent application related to
antipurinergic therapy of autism and related disorders
and is a scientific advisory board member for the Autism
Research Institute and the Open Medicine Foundation.
EVC is a DSMB member for Cempra Pharmaceuticals
and The Medicines Company, and a consultant for Alex-
ion. SG is co-owner of MitoMedical. The other authors
declare no conflicts of interest.
References
1. Zablotsky B, Black LI, Maenner MJ, et al. Estimated
prevalence of autism and other developmental disabilities
following questionnaire changes in the 2014 National
Health interview survey. Natl Health Stat Report
2015;13:1–20.
2. Christensen DL, Baio J, Van Naarden Braun K, et al.
Prevalence and Characteristics of Autism Spectrum
Disorder Among Children Aged 8 Years–Autism and
Developmental Disabilities Monitoring Network, 11 Sites,
United States, 2012. MMWR Surveill Summ 2016;65:1–23.3. Pinto D, Pagnamenta AT, Klei L, et al. Functional impact
of global rare copy number variation in autism spectrum
disorders. Nature 2010;466:368–372.
4. Richards C, Jones C, Groves L, et al. Prevalence of autism
spectrum disorder phenomenology in genetic disorders: a
systematic review and meta-analysis. Lancet Psychiatry
2015;2:909–916.5. Talkowski ME, Minikel EV, Gusella JF. Autism spectrum
disorder genetics: diverse genes with diverse clinical
outcomes. Harv Rev Psychiatry 2014;22:65–75.
ª 2017 The Authors. Annals of Clinical and Translational Neurology published by Wiley Periodicals, Inc on behalf of American Neurological Association. 13
R. K. Naviaux et al. The Suramin Autism Treatment-1 Trial

6. Kalkbrenner AE, Schmidt RJ, Penlesky AC. Environmental
chemical exposures and autism spectrum disorders: a
review of the epidemiological evidence. Curr Probl Pediatr
Adolesc Health Care 2014;44:277–318.
7. Zerbo O, Iosif AM, Walker C, et al. Is Maternal Influenza
or Fever During Pregnancy Associated with Autism or
Developmental Delays? Results from the CHARGE
(CHildhood Autism Risks from Genetics and
Environment) Study. J Autism Dev Disord 2013;43(1):
25–33.8. Naviaux RK. Metabolic features of the cell danger
response. Mitochondrion 2014;16:7–17.9. Silva JM, Wong A, Carelli V, Cortopassi GA. Inhibition of
mitochondrial function induces an integrated stress
response in oligodendroglia. Neurobiol Dis 2009;34:
357–365.10. Nikkanen J, Forsstrom S, Euro L, et al. Mitochondrial
DNA Replication Defects Disturb Cellular dNTP Pools and
Remodel One-Carbon Metabolism. Cell Metab
2016;23:635–648.11. Green DR, Galluzzi L, Kroemer G. Mitochondria and the
autophagy-inflammation-cell death axis in organismal
aging. Science 2011;333:1109–1112.
12. Naviaux JC, Wang L, Li K, et al. Antipurinergic therapy
corrects the autism-like features in the Fragile X (Fmr1
knockout) mouse model. Mol Autism 2015;6:1.
13. Naviaux JC, Schuchbauer MA, Li K, et al. Reversal of
autism-like behaviors and metabolism in adult mice with
single-dose antipurinergic therapy. Transl Psychiat 2014;4:
e400.
14. Naviaux RK, Zolkipli-Cunningham Z, Nakayama T, et al.
Antipurinergic Therapy Corrects the Autism-Like Features
in the Poly(IC) Mouse Model. PLoS ONE 2013;8(3):
e57380.
15. Wikoff WR, Kalisak E, Trauger S, et al. Response and
recovery in the plasma metabolome tracks the acute
LCMV-induced immune response. J Proteome Res
2009;8:3578–3587.16. Degtyar E, Zusman T, Ehrlich M, Segal G. A Legionella
effector acquired from protozoa is involved in
sphingolipids metabolism and is targeted to the host cell
mitochondria. Cell Microbiol 2009;11:1219–1235.
17. James SJ, Cutler P, Melnyk S, et al. Metabolic biomarkers
of increased oxidative stress and impaired methylation
capacity in children with autism. Am J Clin Nutr
2004;80:1611–1617.
18. West AP, Shadel GS, Ghosh S. Mitochondria in innate
immune responses. Nat Rev Immunol 2011;11:
389–402.19. Naviaux RK. Oxidative shielding or oxidative stress? J
Pharmacol Exp Ther 2012;342:608–618.20. Lohman AW, Isakson BE. Differentiating connexin
hemichannels and pannexin channels in cellular ATP
release. FEBS Lett 2014;588:1379–1388.
21. Trautmann A. Extracellular ATP in the immune system:
more than just a “danger signal”. Sci Signal 2009;2:pe6.
22. Riteau N, Baron L, Villeret B, et al. ATP release and
purinergic signaling: a common pathway for particle-mediated
inflammasome activation. Cell Death Dis 2012;3:e403.
23. Burnstock G. The Paton Lecture: Purinergic signalling:
from discovery to current developments. Exp Physiol
2014;99(1):16–34.24. Imamura H, Nhat KP, Togawa H, et al. Visualization of
ATP levels inside single living cells with fluorescence
resonance energy transfer-based genetically encoded
indicators. Proc Natl Acad Sci USA 2009;106:15651–15656.25. Jacobson KA, Balasubramanian R, Deflorian F, Gao ZG. G
protein-coupled adenosine (P1) and P2Y receptors: ligand
design and receptor interactions. Purinergic Signalling
2012;8:419–436.26. Adams JB, Audhya T, McDonough-Means S, et al.
Nutritional and metabolic status of children with autism
vs. neurotypical children, and the association with autism
severity. Nutr Metab 2011;8:34.
27. Jia M, Li MX, Fields RD, Nelson PG. Extracellular ATP in
activity-dependent remodeling of the neuromuscular
junction. Dev Neurobiol 2007;67:924–932.
28. Naviaux RK. Mitochondria and Autism. In: Buxbaum JD,
Hof PR, eds. The Neuroscience of Autism Spectrum
Disorders. Waltham, MA: Academic Press, Elsevier,
2012:179–193.
29. Naviaux RK. Mitochondrial control of epigenetics. Cancer
Biol Ther 2008;7:1191–1193.
30. Wallace DC, Fan W. Energetics, epigenetics, mitochondrial
genetics. Mitochondrion 2010;10:12–31.
31. Burnstock G. Pathophysiology and therapeutic potential of
purinergic signaling. Pharmacol Rev 2006;58:58–86.
32. Stein CA. Suramin: a novel antineoplastic agent with
multiple potential mechanisms of action. Can Res 1993;53
(10 Suppl):2239–2248.33. World Medical A. World Medical Association Declaration
of Helsinki: ethical principles for medical research
involving human subjects. JAMA 2013;310:2191–2194.34. Schulz KF, Altman DG, Moher D, Group C. CONSORT
2010 Statement: updated guidelines for reporting parallel
group randomised trials. Trials 2010;11:32.
35. Gotham K, Risi S, Pickles A, Lord C. The Autism
Diagnostic Observation Schedule: revised algorithms for
improved diagnostic validity. J Autism Dev Disord
2007;37:613–627.
36. Grondhuis SN, Mulick JA. Comparison of the Leiter
International Performance Scale-Revised and the Stanford-
Binet Intelligence Scales, 5th Edition, in children with
autism spectrum disorders. Am J Intellect Dev Disabil
2013;118:44–54.37. Adams-Chapman I, Bann C, Carter SL, et al. Language
outcomes among ELBW infants in early childhood. Early
Hum Dev 2015;91:373–379.
14 ª 2017 The Authors. Annals of Clinical and Translational Neurology published by Wiley Periodicals, Inc on behalf of American Neurological Association.
The Suramin Autism Treatment-1 Trial R. K. Naviaux et al.
38. Kaat AJ, Lecavalier L, Aman MG. Validity of the aberrant
behavior checklist in children with autism spectrum
disorder. J Autism Dev Disord 2014;44:1103–1116.39. Geier DA, Kern JK, Geier MR. A Comparison of the
Autism Treatment Evaluation Checklist (ATEC) and the
Childhood Autism Rating Scale (CARS) for the
quantitative evaluation of autism. J Mental Health Res
Intellect Disabil 2013;6:255–267.40. Rimland B, Edelson S. Autism treatment evaluation
checklist. Autism Research Institute 2000 https://www.a
utism.com/ind_atec [cited 2016 June 15].
41. Busner J, Targum SD. The clinical global impressions
scale: applying a research tool in clinical practice.
Psychiatry (Edgmont). 2007;4:28–37.42. Honey E, McConachie H, Turner M, Rodgers J. Validation
of the repetitive behaviour questionnaire for use with
children with autism spectrum disorder. Res Autism Spectr
Disord 2012;6:355–364.43. Sheiner LB, Beal SL. Evaluation of methods for estimating
population pharmacokinetic parameters. II. Biexponential
model and experimental pharmacokinetic data. J
Pharmacokinet Biopharm 1981;9:635–651.44. Naviaux RK, Naviaux JC, Li K, et al. Metabolic features of
chronic fatigue syndrome. Proc Natl Acad Sci USA
2016;113(37):E5472–E5480.
45. Xia J, Sinelnikov IV, Han B, Wishart DS. MetaboAnalyst
3.0-making metabolomics more meaningful. Nucleic Acids
Res 2015;43(W1):W251–W257.
46. Hawking F. Suramin: with special reference to
onchocerciasis. Advances Pharmacol Chemother
1978;15:289–322.
47. Pickles A, Le Couteur A, Leadbitter K, et al. Parent-
mediated social communication therapy for young
children with autism (PACT): long-term follow-up of a
randomised controlled trial. Lancet 2016;388:2501–2509.
48. Hawking F. Concentration of Bayer 205 (Germanin) in
human blood and cerebrospinal fluid after treatment.
Trans R Soc Trop Med Hyg 1940;34:37–52.49. Siso S, Jeffrey M, Gonzalez L. Sensory circumventricular
organs in health and disease. Acta Neuropathol
2010;120:689–705.
Supporting Information
Additional Supporting Information may be found online
in the supporting information tab for this article:
Table S1. Single-dose suramin pharmacokinetics.
Table S2. Suramin pharmacometabolomics. Pathways
changed at 2 days.
Table S3. Suramin pharmacometabolomics. Metabolites
changed at 2 days.
Table S4. Suramin pharmacometabolomics. Metabolites
changed at 6 weeks.
Figure S1. Storyboard illustration of each step of the
infusion day visit.
Figure S2. Suramin pharmacometabolomics. Rank order
of metabolites and pathways that were changed by sura-
min at 2 days after treatment.
Figure S3. Suramin pharmacometabolomics pathway
visualization. (A) After 2 days. (B) After 6 weeks.
Metabolites indicated in red were increased, and those in
green were decreased compared to controls (see z-score
scale in upper right).
Figure S4. Outcomes. (A) 6 Weeks ADOS comparison
scores by two-way ANOVA. (B) 6 Weeks ADOS compar-
ison score improvement after suramin. (C) 6 Weeks
ADOS social affect score improvement after suramin. (D)
6 Weeks ADOS restricted and repetitive behavior score
improvement after suramin. (E) 2 days ADOS compar-
ison scores were not changed. (F) no change in 6 weeks
ADOS scores in subjects receiving saline placebo. (G) no
change in 6 weeks ADOS social affect scores in subjects
receiving placebo. (H) no change in 6 weeks ADOS
restricted and repetitive behavior scores in subjects receiv-
ing placebo. (I) no change in 6 weeks Expressive One-
Word Picture Vocabulary scores. (J) 7-day improvement
in ABC stereotypy scores after suramin. (K) 6-week
Improvement in ABC stereotypy scores after suramin. (L)
7-day Improvement in ATEC total scores after suramin.
(M) no change in 6 weeks EOWPVT scores after saline.
(N) no change in 7 days ABC stereotypy scores after sal-
ine. (O) no change in 6 weeks ABC stereotypy scores after
saline. (P) no change in 7 days ATEC total scores after
saline. (Q) improved ATEC speech, language, and com-
munication scores 7 days after suramin. (R) improved
ATEC sociability scores 7 days after suramin. (S)
improved ATEC speech, language, and communication
scores 6 weeks after suramin. (T) improved ADOS com-
parison scores after dropping a subject who missed the 6-
week visit (N = 4). (U) no change in 7 days ATEC
speech, language, and communication after saline. (V) no
change in 7 days ATEC sociability after saline. (W) no
change in 6 weeks ATEC speech, language, and commu-
nication scores 6 weeks after saline (X) no change in
EOWPVT scores after dropping subject who missed the
6-week visit (N = 4). (Y) no change in 2 days ADOS
scores after suramin. (Z) no change in 6 weeks RBQ total
scores after suramin. (aa) improved core symptoms of
ASD and other behaviors by CGI at 6 weeks after sura-
min. P values: *0.05, **0.01, ***0.001. (bb) Top 3, most
changed symptoms named by parents in the 6-week CGI.
(cc) no change in 2 days ADOS scores after saline. (dd)
no change in 6 weeks RBQ total scores after saline.
Data S1. Clinical Global Impression (CGI) questionnaire.
Data S2. Social Stories to Accompany the Storyboard
Panels Describing Each Step of the Infusion Day Visit.
ª 2017 The Authors. Annals of Clinical and Translational Neurology published by Wiley Periodicals, Inc on behalf of American Neurological Association. 15
R. K. Naviaux et al. The Suramin Autism Treatment-1 Trial