low temperature measurements for detecting magnetic … · low temperature measurements for...
TRANSCRIPT
Low Temperature Measurements for Detecting Magnetic Spin Interactions in Transition Metals
Angela Stewart
Department of Physics, Benedict College July 30, 2003
Abstract
The magnetic properties of inorganic materials compounded with transition metals such as manganese, iron, copper, and cobalt have been the subject of experimental study this summer. Determining the magnetic susceptibility as a function of temperature and discovering whether these samples are liquid crystals have heightened interest on how these materials behave at temperatures greater than or equal to 2 K. The aim of the present work is to investigate the magnetic spin interactions in the specimen, thereby determining whether they experience long- range ordering by measuring the magnetism as a function of temperature and magnetic field.
Introduction
An electron in a magnetic field with an electron orbital may be characterized by two
parameters, a spin value and a g value. The spin value denotes the direction of the electron spin
and describes the angular momentum of an electron. The g value describes the combination of
the total momentum, the angular momentum, and the orbital momentum and its effect on the net
magnetic moment [1]. Three spin dimensions for the effective magnetic moment: the Ising, the
XY or planar, and the Heisenberg. The Ising dimension denotes that an electron can only point in
one direction, up or down, whereas the XY dimension indicates that an electron’s movement is
confined to the XY plane. The Heisenberg dimension signifies that an electron can move in
three-dimensional coordinates. The sign of the spin interaction strength J determines whether the
material is ferromagnetic or antiferromagnetic [1].
Liquid crystals are a phase matter whose order is intermediate between that of a liquid
and that of a crystal. A liquid crystal is fluid- like but is anisotropic in its optical and electro-
1
magnetic characteristics like a solid [2]. In the crystalline solid state there exists a rigid
arrangement of molecules that stay in a fixed position and orientation with a small amount of
variation from molecular vibration. To maintain this arrangement, large forces hold the
molecules in place, and, therefore, a solid is difficult to deform. In the liquid phase, the
molecules have no fixed position or orientation and are free to move in a random fashion; the
liquid state has less order than the solid state. The random motions of the molecules mean that
the intermolecular attractive forces that kept a solid together are now only strong enough to keep
the liquid molecules fairly close together. A liquid can therefore easily be deformed. The
differences between the states can be attributed to the temperature of the substance [3].
Temperature is a measure of the randomness of the molecules, and therefore less order exists at
higher temperatures. When the liquid crystal is formed from the isotropic state, some amount of
the positional or orientational order is gained. It is this order that accounts for the anisotropies of
the substance. Some examples of liquid crystals are the LCD displays on the faces of watches
and calculators [4]. The purpose of this work, is to investigate the magnetic properties of the
Mn(bipyridine)Cl2, Mn(bipyridine)Br2, and their liquid crystal derivatives.
Materials and Crystal Structures
The samples of Manganese (Mn) provided by Williams College consist of two parent
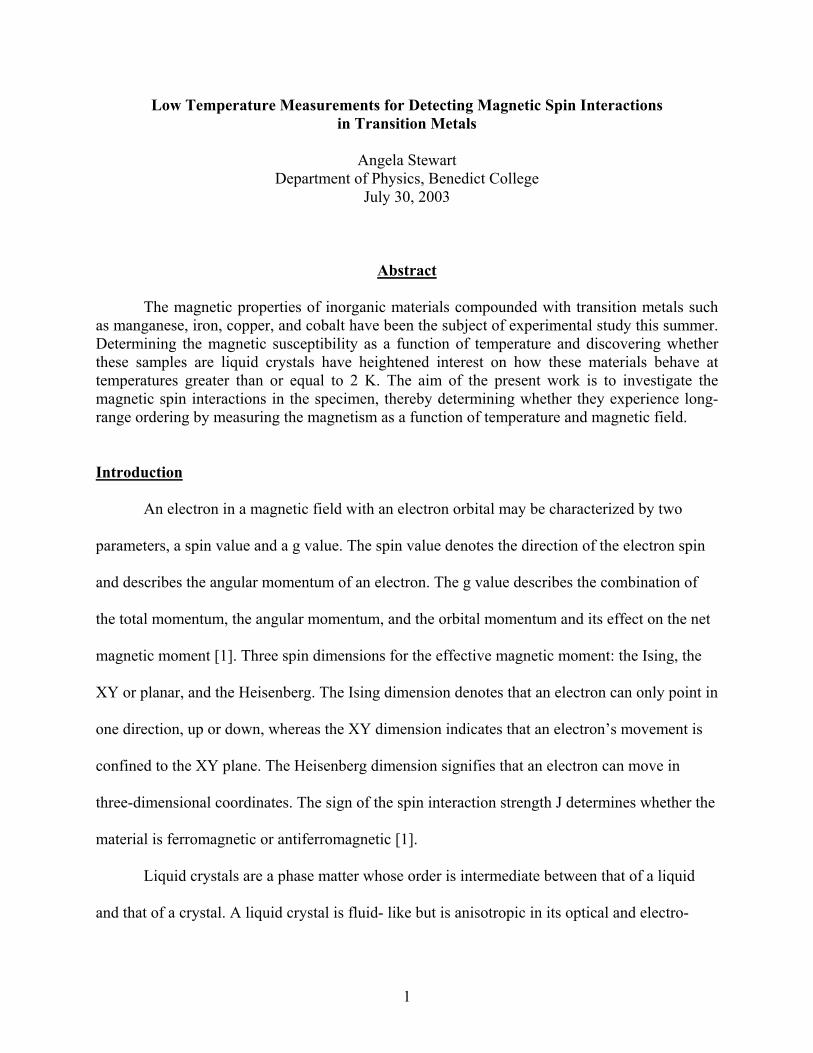
materials and four derivatives of the parent. The crystal structure of the parent specimen is
shown in Fig. 1, where M is the transition metal, Mn, X is the Bromine (Br) or Chlorine (Cl), and
the complex attached by Nitrogen (N) is Bipyridine (bipy) [5].
2
.
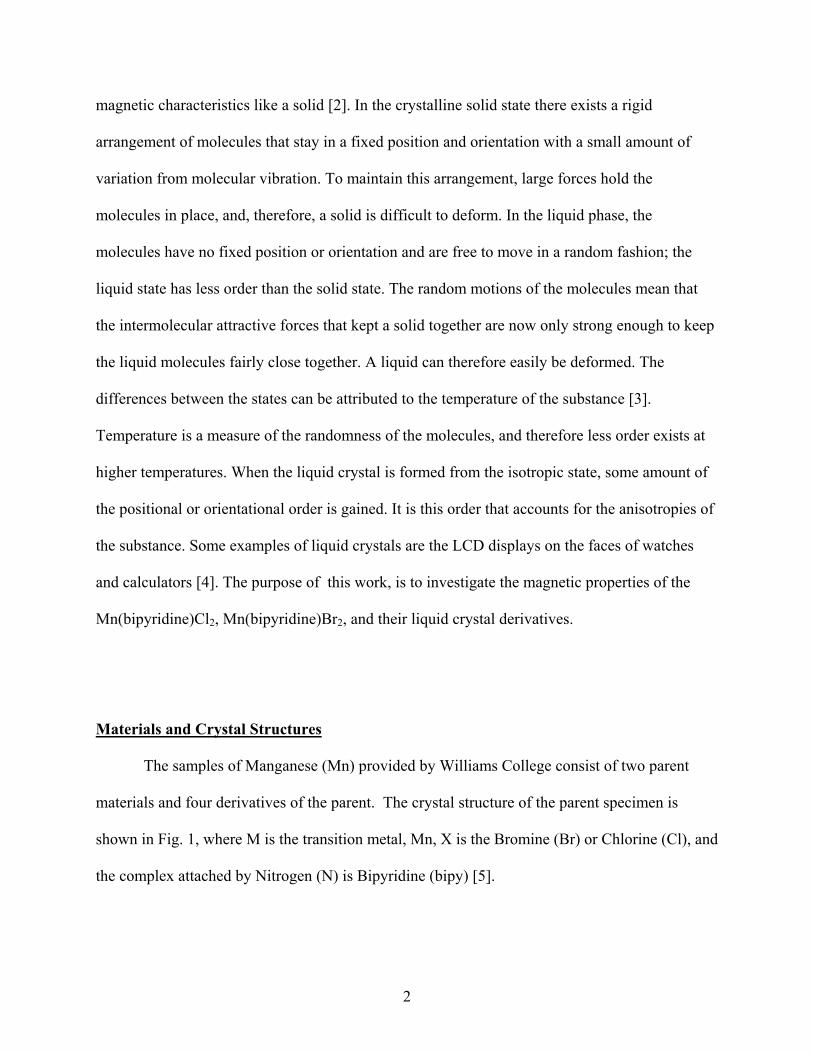
The derivatives are similar to the parent in crystal structure except it has a Carbon- 14 (C-14) polymer attached as seen in Fig. 2., where M is the metal Mn, 5-5’ is the position of the polymer hanging from the parent, and X is the Br or Cl [5].
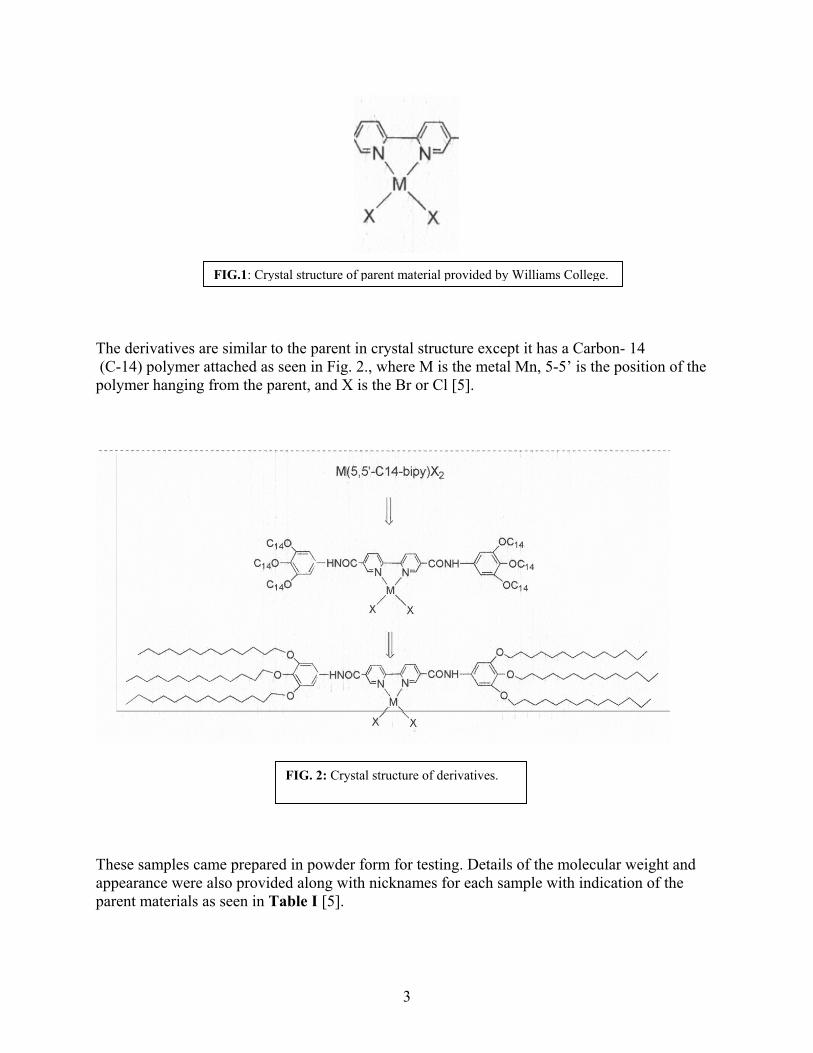
. These samples came prepareappearance were also providparent materials as seen in T
FIG. 2: Crystal structure of derivatives
FIG.1: Crystal structure of parent material provided by Williams College
d in powder form for testing. Details of the molecular weight and ed along with nicknames for each sample with indication of the able I [5].
3
TABLE I : Sample names, labels, molecular weights, and appearances.
SAMPLE LABEL MOLECULAR
WEIGHT APPEARANCE
Mn(bipy)Br2 EAM1-16 (Parent)
371.06 g/mol yellow –green powder
Mn(4-4’-C14 bipy)Br2
EAM1-24 1823.13 g/mol pale gold powder
Mn(5-5’-C14 bipy)Br2
EAM1-26
1823.13 g/mol beige powder
Mn(bipy)Cl2 STS1-8 (Parent)
282. 154 g/mol beige powder
Mn(4-4’-C14 bipy)Cl2
STS1-14 1734.22 g/mol beige powder
Mn(5-5’-C14 bipy)Cl2
STS1-15 1734.22 g/mol beige powder
Experimental Measurements
All materials were measured using a device known as a Superconducting Quantum
Interference Device (SQUID). This measurement system is a complex analytical apparatus made
specifically to study the magnetic properties of small experimental samples over a broad range of
temperatures starting at 2 K and magnetic fields from 0 to 7 T. Automatic control and data
collection are provided by a computer and two independent subsystem controllers. Within the
dewar, a cryogenic probe integrates a superconducting magnet with a SQUID detection system
4
and a high performance temperature control system. The SQUID provides prompt measurements
over a temperature range of 2 to 300 K, and has an inside coil of 3 cm, a sensing loop, a
superconducting transformer, a SQUID sensor, and control electronics. The coils are designed to
be insensitive to any changes of the uniform field from the superconducting magnet to a
precision of approximately 0.1%, making the SQUID detector relatively insensitive to drifts in
the magnet, even following very large field changes [6].
Procedure
A small gelcap and plastic straw were used as the sample holder during the
measurements. The samples were weighed and packed in the gelcap, which was then placed
inside the straw so that measurements could be taken. Magnetizations versus temperature
measurements were taken from 2 to 300 K. The sample was then zero-field cooled to 2 K before
a measuring field of 0.01 T (100 G) was applied. Data were then recorded while the sample was
warmed from the lowest temperature. The sample was then cooled again to 2 K, but in the
presence of a 0.01 T field, and additional field-cooled (FC) data were acquired. Any difference
between the FC and ZFC magnetizations is must arise from long-range ordering. The specimen
was then ZFC to 5 K where a magnetic field was then applied between 0-7 T and the temperature
was fixed at 5 K. The diamagnetic contribution of each sample was estimated from Pascal
constants [7].
5
0 50 100 150 200 2500.0
0.1
0.2
0.3
0.4
0.5
EAM 1-16 (parent) Curie - Weiss Fit
χ(em
u/m
ol)
Temperature (K)
EAM 1-24
EAM 1-26
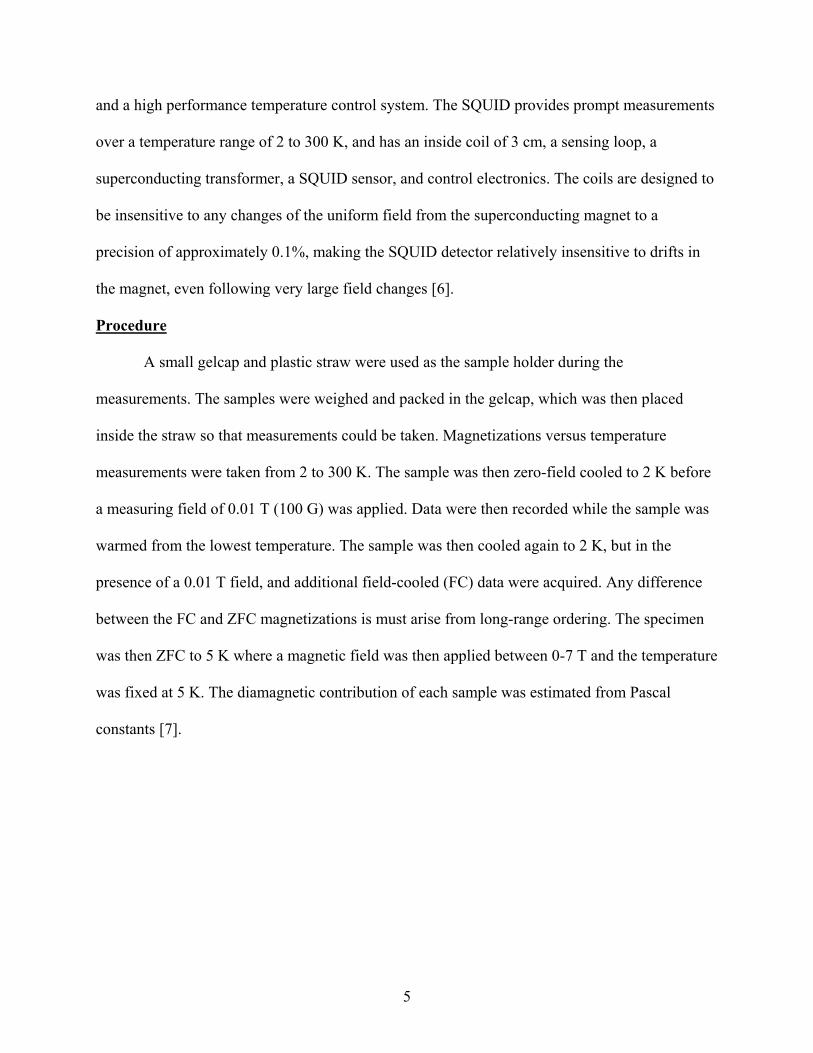
FIG. 3: Magnetic data for the three Mn(Br2) substances, presented as molar paramagnetic susceptibility versus temperature. A best fit line is also shown to
see if the data fits the Curie-Weiss Law.
Results and Discussion
The salient features of the results of the magnetic susceptibility studies are presented in
Fig. 3, which indicates that all three Mn(Br2) specimens are paramagnetic in nature between 2
and 300K. Fitting the parent data to the Curie-Weiss Law
χ = C/ (T – θ) (1)
where χ is the magnetic susceptibility, C is the Curie constant, T is the absolute temperature, and
θ is the Weiss temperature in units of temperature suggests that there are no magnetic spin
interactions in the parent material [8]. Fits were also acquired for the derivatives and are typical
to the fit in the parent material; therefore, these fits were not shown. Parameters were extracted
indicating the g value, θ, spin, mass of material, and the mass of the gelcap for each sample as
shown in Table II.
6
tempera
hether l
e tenden
M
The val
have be
the resu
at any te
The graph
w
th
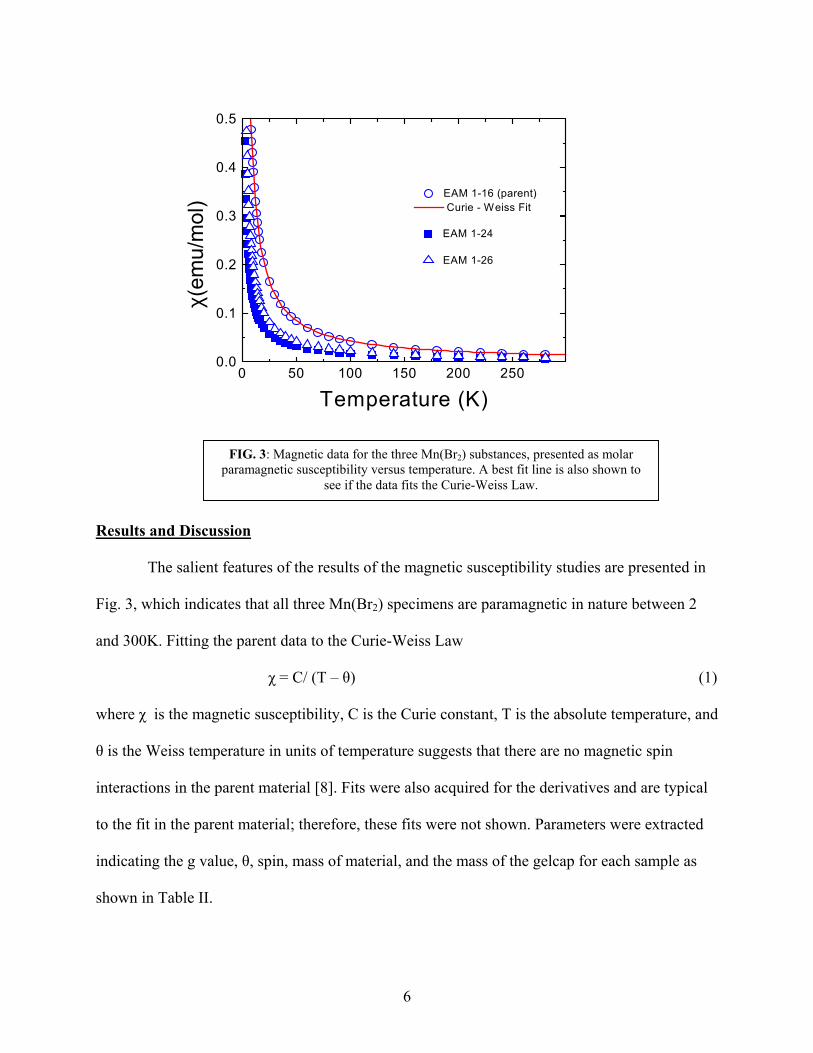
TABLE II: Data table consisting of the spin, g value, correction term θ, material mass, and gelcap mass.
netism
ture at room
tur he stal state
2 2
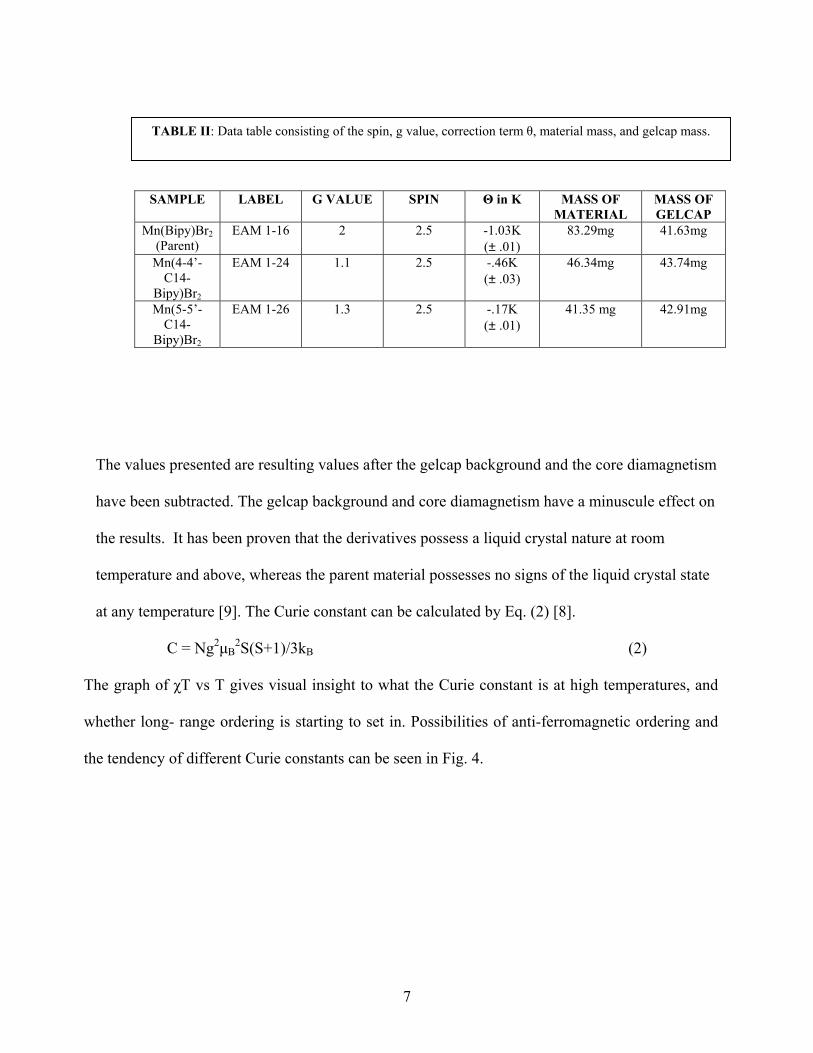
nstant is at high temperatures, and
ong- range ordering is starting to set in. Possibilities of anti-ferromagnetic ordering and
cy of different Curie constants can be seen in Fig. 4.
SAMPLE LABEL G VALUE SPIN Θ in K MASS OF MATERIAL
MASS OF GELCAP
n(Bipy)Br2 (Parent)
EAM 1-16 2 2.5 -1.03K (± .01)
83.29mg 41.63mg
Mn(4-4’-C14-
Bipy)Br2
EAM 1-24 1.1 2.5 -.46K (± .03)
46.34mg 43.74mg
Mn(5-5’-C14-
Bipy)Br2
EAM 1-26 1.3 2.5 -.17K (± .01)
41.35 mg 42.91mg
ues presented are resulting values after the gelcap background and the core diamag
en subtracted. The gelcap background and core diamagnetism have a minuscule effect on
lts. It has been proven that the derivatives possess a liquid crystal na
e and above, whereas t parent material possesses no signs of the liquid cry
mperature [9]. The Curie constant can be calculated by Eq. (2) [8].
C = Ng µB S(S+1)/3kB (2)
of χT vs T gives visual insight to what the Curie co
7
0 50 100 150 200 2500.0
0.5
1.0
1.5
2.0
2.5
3.0
3.5
4.0
4.5
EAM 1-16 (parent)
χT (e
mu
K /m
ol) EAM 1-24
EAM 1-26
Temperature (K)
p
FIG. 4: Magnetic data for the three Mn(Br2) substances, presented as molar paramagnetic susceptibility times tem erature versus temperature.
8
0 50 100 150 200 250 3000.0
0.1
0.2
0.3
0.4
0.5STS 1-8 (parent) Curie-Weiss Fit
χ(em
u/m
ol)
STS 1-14 (4-4') Curie -Weiss Fit
STS 1-15 (5-5') Curie-Weiss Fit
As h
also
spin
sam
extr
show
Temperature (K)
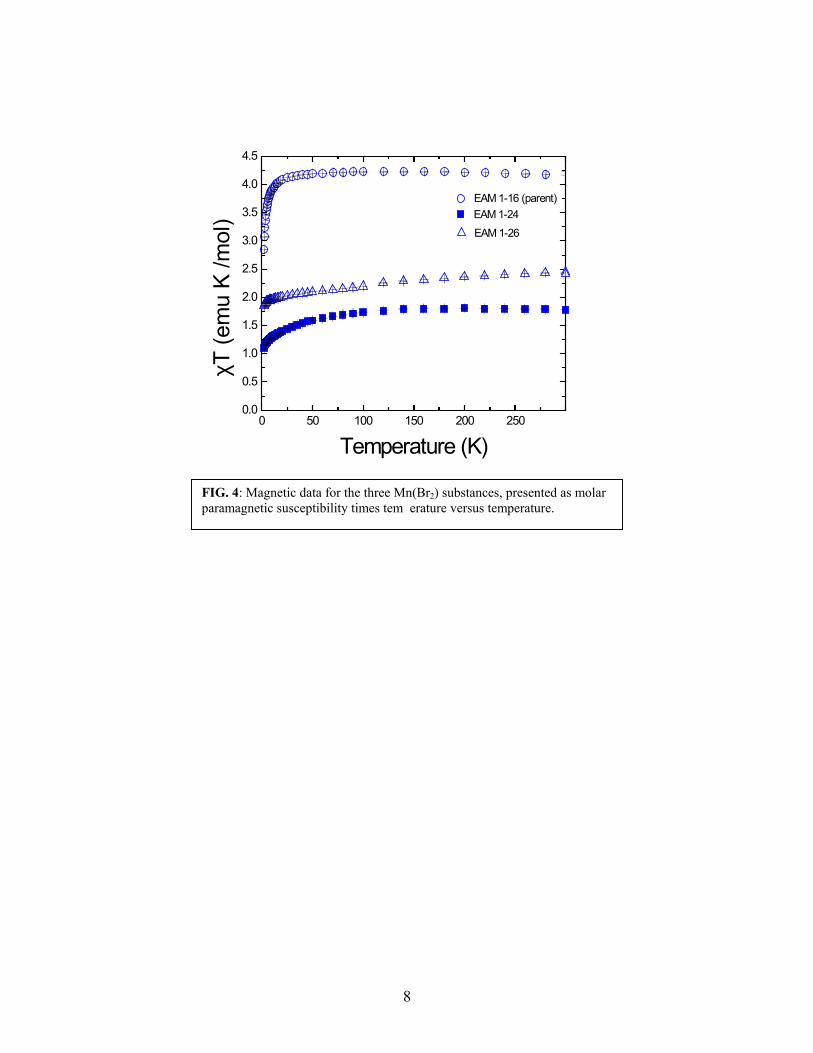
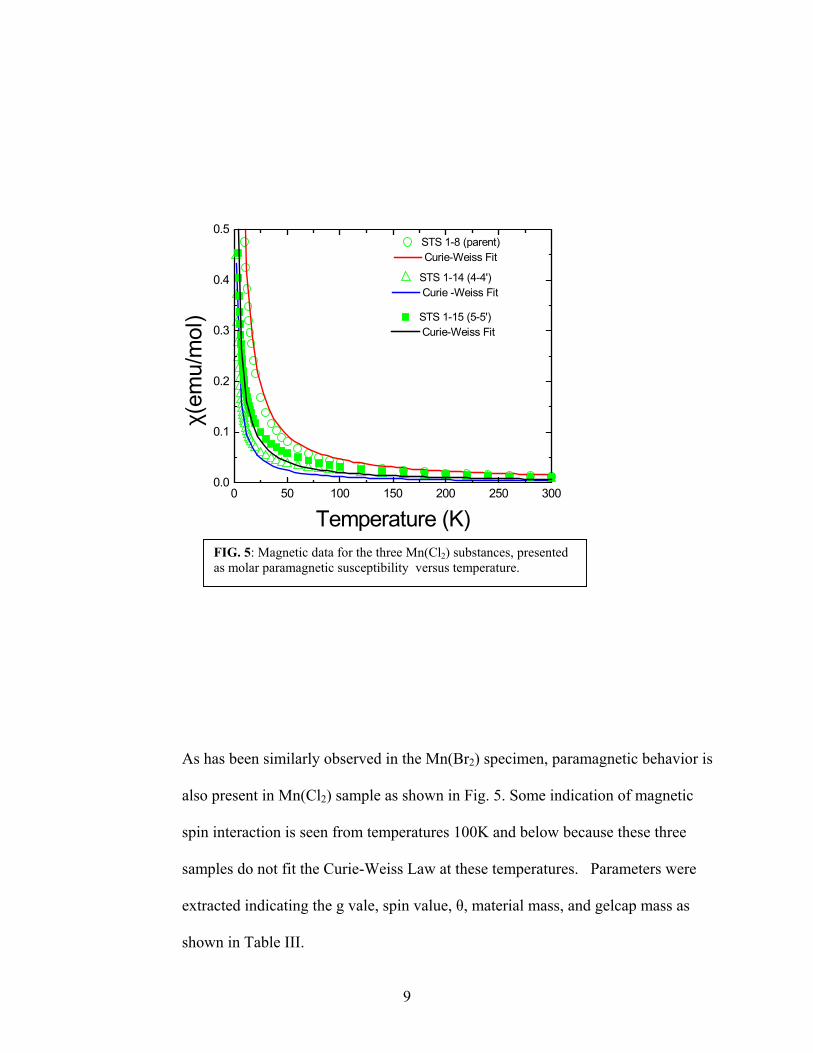
FIG. 5: Magnetic data for the three Mn(Cl2) substances, presentedas molar paramagnetic susceptibility versus temperature.
as been similarly observed in the Mn(Br2) specimen, paramagnetic behavior
present in Mn(Cl2) sample as shown in Fig. 5. Some indication of magnetic
interaction is seen from temperatures 100K and below because these three
ples do not fit the Curie-Weiss Law at these temperatures. Parameters were
acted indicating
is
the g vale, spin value, θ, material mass, and gelcap mass as
n in Table III.
9
es
on
id crystal
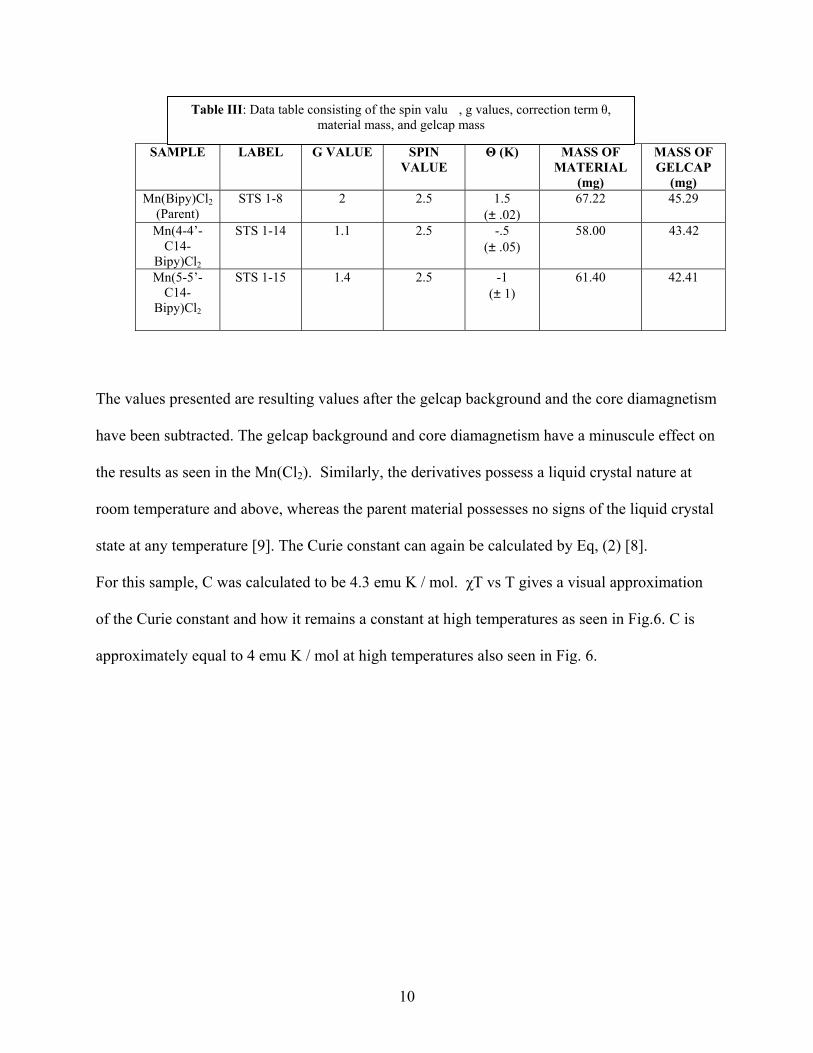
in Fig.6. C is
pproximately equal to 4 emu K / mol at high temperatures also seen in Fig. 6.
SAMPLE LABEL G VALUE SPIN VALUE
Θ (K) MASS OF MATERIAL
(mg)
MASS OF GELCAP
(mg) Mn(Bipy)Cl2
(Parent) STS 1-8 2 2.5 1.5
(± .02) 67.22 45.29
Mn(4-4’-C14-
Bipy)Cl2
STS 1-14 1.1 2.5 -.5 (± .05)
58.00 43.42
Mn(5-5’-C14-
Bipy)Cl2
STS 1-15 1.4 2.5 -1 (± 1)
61.40 42.41
Table III: Data table consisting of the spin valu , g values, correction term θ, material mass, and gelcap mass
The values presented are resulting values after the gelcap background and the core diamagnetism
have been subtracted. The gelcap background and core diamagnetism have a minuscule effect
the results as seen in the Mn(Cl2). Similarly, the derivatives possess a liquid crystal nature at
room temperature and above, whereas the parent material possesses no signs of the liqu
state at any temperature [9]. The Curie constant can again be calculated by Eq, (2) [8].
For this sample, C was calculated to be 4.3 emu K / mol. χT vs T gives a visual approximation
of the Curie constant and how it remains a constant at high temperatures as seen
a
10
0 50 100 150 200 250 300123456789
STS 1-8 (parent)STS 1-14STS 1- 15
XT (e
mu
K / m
ol)
Temperature (K)
50
100
150
200
250
M (
emu
G /
mol
)
As the applied field in
is typical of all Mn sam
FIG. 6: Magnetic data for the three Mn(Cl2) substances, presented paramagnetic susceptibility times temperature versus temperature.
0 1 2 3 4 5 6
0
0
0
0
0
0
STS 1-8 (parent) Brillouin Fit
B (Tesla)
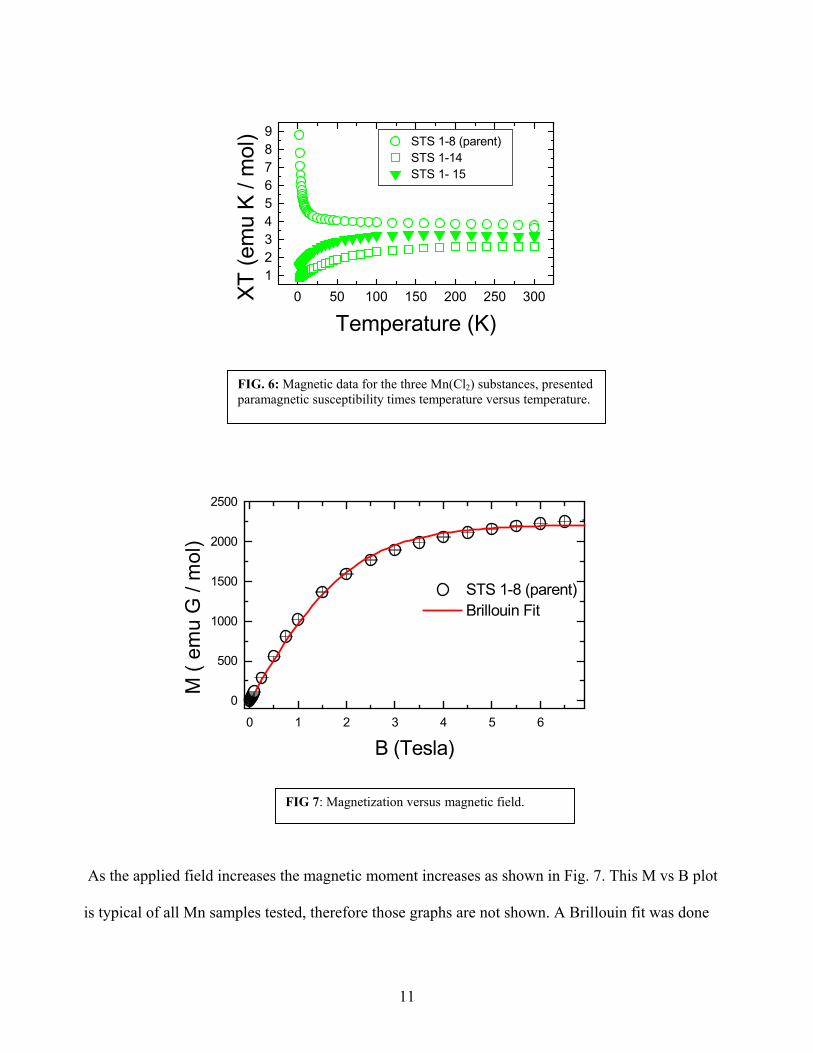
FIG 7: Magnetization versus Magnetic Field FIG 7: Magnetization versus magnetic field.
creases the magnetic moment increases as shown in Fig. 7. This M vs B plot
ples tested, therefore those graphs are not shown. A Brillouin fit was done
11
to determine the g-value of the materials. The spin value, S, was fixed at 5/2 and the temperature
was fixed at 5 K. The experimental g–value is 2 with an error of ±.02.
Conclusion
These results are typical and expected of Mn2+ because the spin value is usually 5/2 which
produces a strong magnetic signal even at temperatures greater than or equal to 2 K. The Mn
produces standard paramagnetic behavior with some possibilities of magnetic spin interactions and
long range ordering. All samples proved to be antiferromagnetic with the exception of the
Mn(bipy)Cl2. This material proved to be ferromagnetic, a result that is consistent in the
literature (10). More accurate results of the low temperature behavior of these samples can be
obtained by testing a sample of the C-14 polymer alone between 2 and 300 K.
Acknowledgements
I would like to thank the National Science Foundation and the University of Florida for
funding my research this summer. I would like to thank Dr. Kevin Ingersent and Dr. Alan Dorsey
for giving me the opportunity for a new experience. I would especially like to thank Dr. Mark W.
Meisel for allowing me to collaborate with him this summer. Last but not least, I would like to
thank Dr. Dan Talham, Ju-Hyun Park, Erik Cizmar, David Elam, and James Davis for their
invaluable help and Williams College for supplying the samples and literature. These people made
my summer both enjoyable and educational.
12
References
[1] C. Kittel, Solid State Physics, 5th ed. (John Wiley and Sons, New York, 1976), pp. 435-440. [2] Akira Isihara, Condensed Matter Physics (Oxford University Press, Oxford, 1991), pp. 285 –287. [3] P.M. Chaikin and T.C. Lubensky, Principles of Condensed Matter Physics, (Cambridge University Press, Cambridge, 1995), pp. 58 –71. [4] Mark W. Meisel (private communication). [5] Lee Y. Park, Department of Chemistry, Williams College, Williamstown, Massachusetts 01267 (private communication). [6] Magnetic Property Measurement System, Hardware Reference Manual (Quantum Design, San Deigo 1996), pp. (1-1), (1-8). [7] Olivier Kahn, Molecular Magnetism, (Wiley-VCH Inc. New York, 1993), pp.3-4. [8] Richard Carlin, MagnetoChemistry, (Springer-Verlag, New York, 1986), pp. 10 –12. [9] L. Park and J.M. Rowe, Chem Mater. 10, 1069, (1998).
[10] B. W. Dockum and W. M. Reiff, Inorg. Chem. 21, 2613, (1982).
13