low-temperature atmospheric discharge plasma and its
TRANSCRIPT

Vol.:(0123456789)
Reviews of Modern Plasma Physics (2021) 5:3https://doi.org/10.1007/s41614-021-00050-4
1 3
REVIEW PAPER
Low‑temperature atmospheric discharge plasma and its applications for the surface treatment
Masuhiro Kogoma1 · Kunihito Tanaka1
Received: 3 July 2018 / Accepted: 16 April 2021 / Published online: 7 June 2021 © The Author(s) 2021
AbstractThe atmospheric pressure low-temperature homogeneous discharge using helium and nitrogen, both known for industrial applications, was reviewed. In case of helium, metastable atoms (21s and 23s) produced in the glow discharge were able to dissociate mixed molecular gases to produce radicals or atoms. Radical species undergo chemical reactions, such as oxidation or nitration reaction and form prod-ucts on the electrode surfaces. Applications of helium atmospheric pressure glow discharge including surface treatment of plastic films to enhance adhesibility with glue, weakening strength with pressure-sensitive glue, and deposition of solid mate-rial on a flat plate or powder surfaces, were described. Moreover, the microwave low-temperature discharge using nitrogen, as a cost-saving carrier gas, were intro-duced for the surface cleaning of silicon wafer.
Keywords Helium · APGD · Surface treatment · Fluorination · Powder coating · Tubing discharge
AbbreviationsAPGD Atmospheric pressure glow dischargeAPTD Atmospheric pressure glow-like Townsend dischargesccm Standard cubic cm/minslm Standard liter/minCA Contact angle of water dropCASING Cross-linking by activated species of inert gasCVD Chemical vapor depositionDV Desired valuesFEP Tetrafluoroethylene-hexafluoropropylene, co-polymerFPP Fluorinated plasma polymerFTIR Fourier-transform infrared spectroscopy
* Masuhiro Kogoma [email protected]
1 Department of Materials and Life Sciences, Faculty of Science and Technology, Sophia University, 7-1 Kioi-cho, Chiyoda-ku, Tokyo 102-8554, Japan

Reviews of Modern Plasma Physics (2021) 5:3
1 3
3 Page 2 of 65
GCDR Gas-phase chemical derivatization reactionsHFP HexafluoropropyleneH.V. High voltageIAA Tris(2,4-pentanedionato)ironPE PolyethyleneLDPE Low density PELF Low frequencyLPD Low pressure dischargeNY NylonPCR Polymerase chain reactionPEG or PEO Polyethylene glycolPET Polyethylene terephthalatePFA Perfluoroalkoxy alkanePFBA PentafluorobenzaldehydePP PolypropylenePSA Pressure-sensitive adhesivePTFE PolytetrafluoroethylenePVC PolyvinylchlorideRF Radio frequency (13.56 MHz)SEM Scanning electron microscopeTEM Transmission electron microscopeTd Townsend, 1 Td = 1 × 10–17 V·cm2
TFAA Trifluoroacetic acidTFE TetrafluoroethyleneUT UntreatedVOC Volatile organic compoundXPS X-ray photoelectron spectrometry
1 Introduction to the Atmospheric Pressure Glow Discharge (APGD)
Plasma chemical vapor deposition (CVD) and etching or surface treatment using glow discharge in low pressure are experimental techniques widely applied in high-technology research industries. However, there is yet for commercial use since the operations are done in a vacuum system thus the apparatus will be extraordinarily expensive. Therefore, plasma application, such as the surface treatment on large-sized film materials in low pressure was not so easy in practice. In the same way, the reason of the maintenance difficulty at the pumping system, the surface treatment of powder will be also difficult to treat in low pressure discharge system. The plasma CVD and surface treatment or powder treatment at atmospheric pressure are a prom-ising approach for not only a reduction of costs for mass-production systems but also to add a new functionality. For example, APGD system can treat nearly all kind of industrial plastics, such as polyimide, polytetrafluoroethylene, and so on, but could not attain in the industrial corona treatment using air fed barrier discharge (DBD) system that is commonly used for surface treatment of consumer plastics.

1 3
Reviews of Modern Plasma Physics (2021) 5:3 Page 3 of 65 3
The APGD which has homogeneous and low-temperature glow region was first proposed by M. Kogoma and S. Okazaki (Kanazawa et al. 1987). In the system, they used dielectric barrier discharge (DBD) to have short length pulse discharge and helium mixed with small amount of monomer gases to realize the lowest start-ing voltage in the discharge. Short length pulse discharges in helium gas will inter-cept the gas temperature rising which can realize low-temperature glow discharge in the atmospheric pressure. APGD is categorized as non-thermal equilibrium plasma, electron temperature (Te) is higher than 10,000 K, gas temperature (Tg) is nearly room temperature, and the maximum electron density is about 3 × 1010 cm−3 as same as in the low-pressure glow discharge (Kogoma 2011).
The theoretical approach of the APGD in helium gas has been proposed by Tochikubo et al. (1996). The reason why APGD in helium is easy to be generated glow discharge is due to the ionization coefficient in low reduced electric field. The advantage of helium is its larger ionization rate at the low electric field than other gases. The atmospheric discharge in helium, the reduced electric filed at the ionization region that is near of the starting voltage is at most 30 Townsend (1 Td = 1 × 10–17 V·cm2) or so which is much lower than that of the nitrogen (− 1000 Td). In this case, since the multiple ionization proceeds rather slowly, the discharge will not be non-uniform like as in a streamer discharge. However, even used He as a carrier gas, the continual discharge brought about arc discharge by the thermal accu-mulation in the plasma. They have also suggested that the trace impurity of nitro-gen in helium helps in easy ionization by the Penning ionization reaction shown in Eq. (1) with helium metastable atoms (He 21s and He 23s) that produced in the for-mer discharge. The metastable atoms (Hem) which has high electronic state energy (21s, 20.7 eV and 23s, 19.8 eV), can dissociate the mixed gas, such as monomer molecule M2 as shown in Eq. (2) in addition with the ionization process (Eq. (1)).
Therefore, enough concentration of radical species can be expected that proceeds the chemical reactions as like as in the low-pressure glow discharge. When we use nitrogen instead of helium for carrier gas, we will have a glow-like discharge, the so-called Atmospheric Pressure Glow-like Townsend Discharge (APTD) that was first proposed by Massines et al. (2000). The APTD is a kind of diffused discharge that functions similarly to APGD. The N2 discharge will arise to contamination of nitro-gen atom or nitrogen oxide in the discharge system, although APTD is useful for the surface treatment of plastic film, especially for the industry that needs surface modi-fication for products. Normally, APGD or APTD treatment system are applicable for approximately flat substrate, such as paper, film, and printed circuit board, because the electrode gap is restricted shorter than 10 mm except of using the plasma jet reactor.
In the following chapters, several applications, such as surface treatment of plas-tic films, silica deposition on the powder materials and so on, will be described which have been achieved by the author’s group using the APGD system.
(1)Hem + N2 → N+2+ He + e−
(2)Hem +M2 → 2M + He

Reviews of Modern Plasma Physics (2021) 5:3
1 3
3 Page 4 of 65
2 Plasma systems in APGD
For the realization of APGD, three conditions are generally needed to produce the glow discharge (Kanazawa et al. 1987).
(1) The presence of solid dielectric material between discharge electrodes.(2) The suitable kinds of dilution gases, such as He, Ar passing between the elec-
trodes.(3) The electric source frequency over 1 kHz.
In the first condition, dielectric plate (barrier electrode) inserted between two electrodes assists pulse formation at low frequency applied voltage, in the same way as in the air fed ozone generator system in which many fine filament discharges are generated on the dielectric plate. If we use high voltage, very short length pulse electric source, such as a Nano-Pulse Discharge System, we could eliminate the dielectric plate between the electrodes. When we introduce helium to the barrier discharge system, only one pulse current should be found (Tanaka et al. 1999) as shown in Fig. 1. The pulse time duration is about 100 times longer than that of the air fed DBD. This is attributed to the formation and extinction of positive column in the glow discharge system same as in low-pressure glow discharge, because the electric field in positive column is very weak compared with a streamer discharge system. In weak field plasma, the ions and electrons need long time to away off to the electrodes.
After stopping the current, a proportion of the metastable atom (Hem) is still retained which initiates the next glow discharge. In frequencies lower than 1 kHz, Hem concentration decreased in no plasma period, which becomes unstable during plasma period, needing to consider a third condition.
The atmospheric pressure low-temperature plasma described in the following chapters of the applications, is a notable topic of the research since there are needs for developing some novel ways of plasma generation.
Fig. 1 Current pulses in atmos-pheric pressure He discharge using 3 kHz power source
Time
Current/m
A
333�s

1 3
Reviews of Modern Plasma Physics (2021) 5:3 Page 5 of 65 3
3 Equipment of atmospheric pressure glow discharge system
Figure 2 shows a typical discharge tube with parallel plate electrodes for the atmos-pheric pressure glow discharge treatment. One of the two electrodes can be a metal plate. In that case, shower type gas inlet nozzle electrodes are available. However, if both of them are covered with dielectrics, such as glass plates, filamentary dis-charges like as streamers are not easily generated. The gap should generally be thin-ner than 10 mm so that the uniformity of the plasma can be sustained. When a paral-lel plate electrode type is used, a substrate is usually placed on either upper or lower electrode surfaces. If a specimen is an insulator, such as a polymer, the discharge current will pass through the substrate, even if it is floating. If a specimen is a con-ductor, some care has to be taken. Namely when the plasma density is high, a high electric field at the edge of the specimen or at a print pattern can induce locally high-density discharge. In the case, when a parallel plate electrodes type is used, the uniformity of feeding gas in a gap affects the uniformity of the treatment. Apart from the discharge tube with parallel plate electrodes, the researchers have devel-oped a remote-type or jet-type discharge tube as shown in Fig. 3. If helium or argon is used as a carrier gas of the remote-type discharge tube, the activated neutral spe-cies generated in the discharge can blow out in to the air.
By exposing a substrate into the downstream which includes the activated spe-cies, such as fluorine atom, one can chemically treat its surface. Utilizing this remote type, Nagata, Horiike et al. (Nagata et al. 1989) successfully etched a surface of a silicon substrate using CF4 with He carrier gas in the atmosphere. The concentration of the activated species decreases as the samples stay in atmospheric pressure air. Using the remote type typically requires higher gas flow rate than using the paral-lel plate type. However, the remote type is free from direct exposure in a discharge, and thus there is no influence of charged particles, such as ions and electrons. On
Exhaust
Powersupply
Dielectric
Specimen
Gas
Fig. 2 Discharge apparatus with parallel-plate type electrode for surface treatment

Reviews of Modern Plasma Physics (2021) 5:3
1 3
3 Page 6 of 65
the other hand, the treatment in a parallel plate type is significantly influenced by the charged particles. The remote type is therefore applicable to direct cleaning of substrates on which semiconductor devices and various chips are attached. In addi-tion, it can be easily installed for inline treatment where the plasma device is placed within the existing process. This is one of the marvelous advantages of APGD which enables the treatment in atmosphere. This technique can be applied to the surface cleaning of liquid crystal display panels in the mass production line using Ar or N2 instead of He for carrier gas.
4 Feasible studies and applications
4.1 Copper–polypropylene facial adhesion using various gas mixtures and surface analysis using gas phase chemical derivatization reactions of atmospheric pressure glow discharge (APGD)‑treated polypropylene (PP)
4.1.1 Introduction
The objective of this work (Prat et al. 1998) is 1) to determine the chemical func-tionalities which are responsible for the adhesive strength of the treated polymer by following the amounts of the different functionalities at the treated-polymer surfaces with the Gas-phase Chemical Derivatization Reactions (GCDR) method and com-paring them with adhesive strength and surface treatment; 2) to study the aging of these functionalities and these properties with elapsed time after treatment. In the
Discharge Area
H.V.Cooling Water
Gas
Electrode
Sample
Glass Filter
d
<Side View> <Cross Section>
Quartz Glass
Optical Fiber Head
ElectrodeHeight
Variable
Fig. 3 Side and cross-sectional views of an after-glow type discharge set up for in line surface treatment (Tochikubo et al. 1996)

1 3
Reviews of Modern Plasma Physics (2021) 5:3 Page 7 of 65 3
case of the polymer surface treatment, the silent discharges were produced in the same effect as with the industrial corona discharge apparatus that is generally used in the industry. We made a comparison the aging effects of the treated surfaces with using APGD and the dielectric barrier discharge systems (DBD).
In the first part of the review, we describe the effects of APGD treatments on the adhesion capability of polypropylene for different gas mixtures and treatment times. The adhesion capability was determined using in situ copper metallization (200 nm-thick) immediately after APGD treatment in a parallel established vacuumed cham-ber using copper–metal vaporization. After copper metallization, a diamond stylus is used to scratch the copper surface and the minimum value of the load necessary to scratch the surface is measured (described as critical load). We assumed this value to be related to the adhesive properties of the polymer.
In the second part, we report the study of the gas phase chemical functionali-zation of the plasma treated surfaces and their aging in ambient atmosphere. After the treatment of a polymer in the APGD, numerus different chemical functionali-ties are created on the surface. These functionalities are very difficult to detect and quantify by X-ray photo electron spectroscopy (XPS), the oxygen containing ones in particular, mainly due to the small chemical shift differences in C1s region. With the chemical modification technique different functional groups can be labeled. Fluorine substituted labeling reagents are used because of the high chemical shift induced by fluorine, its high cross section and because it is not present on the original polymer. The gas phase chemical modifications utilized are listed in Scheme I.
The details gas chemical procedures, the estimation of chemical functionalities and their precision has been reported in the papers (Nakayama et al. 1988; Suther-land et al. 1994; Chitoki et al. 1990).
The C = O evaluation is based on the amount of N atoms on the polymer sur-face after the reaction between hydrazine and the carbonyl functionalities as shown in Eq. (4). This evaluation is impossible in the case of N2/He discharge treatment because of the incorporation of nitrogen atoms during the discharge treatment. The –NH2 evaluation in N2/He discharge has been done by reaction between –NH2 and C6F5CHO which attributed to Eq. (6).
4.1.2 Results and discussion
4.1.2.1 Copper adhesion with polypropylene film surface The best adhesive proper-ties (corresponding to the highest critical load (CL) necessary to scratch the surface) is obtained for the N2/He plasma (Fig. 4). CL increases with increasing treatment time until three minutes and then slightly decreases. It is always higher than the line for He or O2/He discharge treatments. The strong adhesive properties after He/N2 plasma treatment can be explained by following the amount of primary amines versus treatment times (Fig. 5). Primary amine concentration was followed by XPS after pentafluorobenzaldehyde (PFBA) labeling (Eq. (6)). In the same way, trifluoroaceti-cacid (TFAA) was used for –OH group, hydrazine was used for RC = O and trifluoro-ethanole (TFE) was used for COOH group. The N/C and NH2/C ratios increase with increasing of treatment time. NH2 is the main nitrogen-containing functionality on

Reviews of Modern Plasma Physics (2021) 5:3
1 3
3 Page 8 of 65
the surface. For longer treatment time, the NH2/N total ratio decreases but the total amount of NH2 still grows.
After copper depositions that performed on N2/He, O2/He discharge treated PP, and untreated PP, we tried to peel off the polymer. Then, performed XPS analysis on both metal and polymer peeled off side. In the case of the untreated PP, the wide scan spectrum (WS) of the metal side is the same as that of the metal copper and the polymer side is the same as the PP in WS.
R--OH
(CF3CO)2O (TFAA)
R--OCOCF3 + CF3COOH
R--C=ONH2NH2 (Hydrazine)
R--C=N--NH2 + H2O
R’ R’
R--COOH R--COOCH2CF3 + H2O
CF3CH2OH (TFE)
R--NH2
C6F5CHO (PFBA)
R--N=CHC6F5 + H2O
(3)
(4)
(5)
(6)
Scheme I The gas phase chemical modifications to add the labels for the different functions
0
20
40
60
80
100
0 60 120 180 240 300 360
Crit
ical
load
/ g
Treatment time / s
Fig. 4 Critical load as a function of treatment time. Dotted line: plasma untreated surface. ■, N2/He 100 W; □, O2/He 50 W; △, O2/He 100 W; ●, He 50 W

1 3
Reviews of Modern Plasma Physics (2021) 5:3 Page 9 of 65 3
On the other hand, for both of N2/He and O2/He discharge treated PP, the WS of the metal and the polymer side are identical to that of PP. These results show that the separation of the two layers occurs into the polymer and not the Cop-per–PP interface. The morphological changes that measured by SEM (Photo 1), are found for every treatment, but in the case of treated in N2/He, particularly sig-nificant changes were found since the polymer is deeply modified.
The combination of the following two factors could explain the strong adhe-sion capability of the He–treated PP.
1) Primary amine functionalities detected on the polymer surface can form chelates with copper and improve the adhesion dramatically as shown in Fig. 6.
2) The profound change of morphological shapes can result in an anchoring effect. In this case, the only way to the peeling of copper trapped between the surface projections is to break the polymer. The loss of adhesive power for durations of
Fig. 5 N/C and NH2/C ratios as a function of treatment time (N2/He discharge). ○, N/C; □, NH2/C
Photo 1 SEM photography of treated in He/N2 plasma

Reviews of Modern Plasma Physics (2021) 5:3
1 3
3 Page 10 of 65
longer than 3 min could be due to the degradation of the surface and creation of weak boundary layers well known effect in the low-pressure plasma treatment.
3) After the plasma treatments, PP samples stayed in atmosphere for aging until the measuring of the functions. At the N-containing group, NH2/N rations were decreased from 0.7 to 04 in 60 days.
4.1.3 Conclusion
The important adhesion capability of treated PP in N2/He-APGD can be explained by the formation of chelates between copper and primary amines by an “anchor effect” due to the substantial change in the surface morphology.
4.2 Formation of highly releasing PET surfaces by atmospheric pressure glow discharge fluorination and surface roughening (Masutani et al. 2007)
4.2.1 Introduction
Pressure-sensitive adhesive (PSA) tapes are generally kept in rolls. PSA tapes consist of three layers: the adhesive layer, the base film and the release coating. We would like to peel the tape off smoothly when we use it, so the release coat-ing needs to be present. Commonly, the release coating has been made of some silicone polymers that have quite low surface energy. However, these silicone release coatings have some defects; for example, these polymers become seri-ous impurities for the semiconductor industry and some alternative material to replace silicone is desired. Although the fluorinated polymers as coating agents have low peel strength just like the silicone polymers, they need some special sol-vent for applying the release coating, so they are rarely used. Furthermore, some experts believe that polytetrafluoroethylene (PTFE), which is a typical fluorinated
CH2 CH CH CH CH CH
CH3
NH2Cu
NH2
CH2 CH CH
NH2
NH2
CH
CH3
NH2Cu
NH2
NH2
NH2
CH CH
Fig. 6 Molecular structure of chelate bonding with Cu metal

1 3
Reviews of Modern Plasma Physics (2021) 5:3 Page 11 of 65 3
polymer, should be chosen as the base film of PSA tape instead of polyethylene terephthalate (PET), but PTFE is also rarely used because there are several prob-lems, such as expensiveness, difficulty of fabrication, and waste disposal. From these points of view, we have been concerned with the fluorinated polymer thin coating of PET by plasma.
Although many investigators (Millard et al. 1973; Yagi et al. 1982; Anand et al. 1981) have carried out the fluorinated polymer coating of polymeric mate-rials by low pressure plasma polymerization, we would like to achieve it by the APGD technique, because it is a useful technology for the surface treatment without using a vacuum pump that is needed with low pressure plasma devices (Yokoyama et al. 1990). In our previous study, we have reported that some fluori-nated plasma-polymer (FPP) depositions of PET using the APGD technique had low enough adhesive strength for use. However, we could not completely pre-vent the peeling off of deposited FPP, because those depositions were essentially fragile (Tanaka et al. 2000, 2001; Nakajima et al. 2001; Babukutty et al. 1999; Tanaka and Kogoma 2003a,b). In this study, we have focused on the APGD fluor-ination of PET surfaces, which was different from the FPP deposition, to solve this problem. However, it seems that the fluorination alone would not make the peel property higher. Generally, the adhesive strength between PSA tape and sol-ids depends on not only the surface energy but also the surface morphology of the solids (Karmann and Kummer 2001). Mann et al. (1998) reported that the roughening of the solid surface over 0.1 μm makes the adhesive strength weaker. Therefore, we also investigated whether a combination of two surface treatments, the fluorination and the surface roughening, would make the peel property higher.
4.2.2 Experimental
The smooth surface PET film (Diafoil S-100-25, Mitsubishi Polyester Film Co. Ltd., thickness: 25 μm) was used for this study. And we also prepared seven rough surface PET (matte PET) films, whose roughnesses are shown in Table 1. Further details regarding the manufacturing process of the matte PET films are not able to be described because of a confidentiality agreement. No.31B PSA tape (Nitto Denko Co., Ltd, width = 20 mm) was used for peeling test. This PSA tape has the following properties: the base film is a 25 μm-thick PET, and the adhesive is an acrylic PSA (thickness = 30 μm). This PSA tape is widely used as the evaluation tape of the peel test in the release-related industry. A schematic diagram of the reactor used in this study is shown in Fig. 7 (reactor type A). The reactor was made of a Pyrex glass tube whose inner diameter was 46 mm The high voltage electrode was made of a copper mesh that wrapped around the Pyrex reactor. The inner stainless electrode, with a diameter of 44 mm, was the ground electrode. Cooling water flowed in the inner stainless electrode during the discharge.
The PET film or the matte PET film, which was wrapped around the inner stain-less electrode whose height was 130 mm, was used as the specimen for various measurements.
The discharge gap between Pylex galss and inner erectrode was 2 mm. He car-rier gas flow rate was 5 l min−1 (slm) that mixed with 20 cm−3 min−1 (sccm) of

Reviews of Modern Plasma Physics (2021) 5:3
1 3
3 Page 12 of 65
CF4 or SF6. The reactor was vacuumed with a rotary pump until 3 Pa to remove impurity gas. As soon as the pressure reached 3 Pa, the vacuuming was finished. He gas was then admitted into the reactor and the reactor pressure was restored to atmospheric pressure. Afterwards, the high voltage at a frequency of 100 kHz was applied into the reactor for 30 s; and this introduces radical sites on the PET film. Finally, the CF4 or the SF6 gas was added while the discharge was maintained and the PET film surface was fluorinated. After the fluorination, the PET film was taken from the reaction chamber, and pieces of film served as specimens for XPS studies, scanning electron microscope (SEM) studies to measure the morphology,
Table 1 Surface roughness of the matte PET films
rms represent “root mean square”
Sample number Surface roughness (rms)
# 1 2.74# 2 2.02# 3 1.22# 4 3.71# 5 2.79# 6 3.94# 7 5.64
Fig. 7 Cylinder type discharge apparatus for film surface treat-ment (reactor type A)
H.V.
N2+He
Exhaust
Rotary pump
Cu meshelectrode
Polymer Film
Shower headgas inlet
Pyrex glassreactor
Stainlesselectrode
< Reactor type A >

1 3
Reviews of Modern Plasma Physics (2021) 5:3 Page 13 of 65 3
and for peel tests. The peel strength was measured with a 180º peel test: No.31B PSA tape was pressed onto the fluorinated film using a 2 kg roller and then peeled off at a speed of 300 mm min−1. Although peel strength was formerly presented in units of grams strength per 20 mm, the SI unit, N m−1, is used in this article, the relationship between these units is 1.0 gf (20 mm)−1 ≈ 4.9 × 10⁻¹ N m−1.
The chemical state of the fluorinated films was determined by XPS (ESCA-5800ci, ULVAC-Phi Co. Ltd.). XPS was carried out using ex situ measurements, and the specimen was exposed in the air after plasma treatment for approximately one hour. The take-off angle of the X-ray source position was 45˚. The XPS spec-trum binding energy was corrected by shifting the hydrocarbon component (CHx, x = 0 to 3) peak in the C1s spectrum to 284.6 eV. Then we carried out curve fit-ting with the XPS program of ULVAC-Phi by reference to the interval energies between each chemical group observed from references Gelius et al. (1970) and Clark et al. (1973).
The surface morphology of the fluorinated matte PET film was observed using SEM (JSM-6100, JEOL Ltd.) at 20 kV accelerating voltage.
4.2.3 Results and discussion
(1) SurfSace fluorination of PET film To examine whether the surface fluorination of PET film made the peel prop-
erty of PET surfaces higher, we tried to treat PET film by CF4/He or SF6/He-APGD.
Figures 8a and b show the peel strengths between PSA tape and the PET treated by CF4/He and SF6/He discharge, respectively. Both CF4/He and SF6/He discharge treatments decreased the peel strength with increasing the treatment time, but the peel strength of SF6/He plasma-treated PET did not decrease in the value of the CF4/He plasma-treated one. Since the emission of the SF6/He plasma was weaker than that of the CF4/He discharge, the discharge power was changed from 100 to 150 W. However, there were no significant differences in the resulting peel strengths. The comparison between the peel strength of pol-ytetrafluoroethylene (PTFE, dotted line) and that of the CF4/He plasma-treated PET shows that the peel strength in the CF4/He discharge was not lower than that of PTFE. The electrostatic force between no adhesive side of PSA tape and fluorinated PET film were measured. From the experiments, the electrostatic force was considered negligible, and was excluded from the peel force on the PSA adhesive side.
Next, we investigated why there were changes in the peel strength due to the plasma. It is well-known that the adhesive strength affects not only surface chemistry (functionality) but also surface physics (roughness and configura-tion). However, we did not consider the change in the surface physics by plasma treatment. This reason is as follows: our previous study (Kosugi et al. 1992) has shown that the surface roughness, Ra, of polyimide after CF4/He-APGD treat-

Reviews of Modern Plasma Physics (2021) 5:3
1 3
3 Page 14 of 65
ment for 60 min was changed from 0.027 (untreated) to 0.023 μm. This result indicates that only a minor change in surface roughness occurs during APGD treatment under fluorine gases, such as CF4 and SF6. Therefore, we only inves-tigated the relationship between surface chemistry and peel property. Figure 9a and b shows the atomic ratios F/C and O/C obtained from the XPS spectra of the PET treated with the CF4/He and the SF6/He plasma as a function of the treatment time, respectively.
Although the XPS spectra of the SF6/He-APGD treated PET contained sul-fur, we neglected it because S/C < 0.1. The F/C ratio in the CF4/He plasma was higher than that in the SF6/He discharge, but lower than that of PTFE (F/C = 2.0). We also found that oxygen atoms still remained in the discharge-treated PET films. That were the reasons why the peel strength of plasma treated one was higher than that of PTFE. To make the difference between the two discharge treatments in the peel strength clear, the PET films treated with each plasma were investigated using the C1s XPS spectra.
The C1s XPS spectra of untreated and the discharge -treated PET films are shown in Fig. 10. The C1s spectra of the discharge -treated PET films were decomposed into five components, which were assigned to C–C, –C–CFn (and/or –C–O), –CF (and, or –COO), –CF2, and –CF3 groups. This result indicated that C–C, C–O, and COO groups were modified into C–CFn, CF, CF2, and CF3 groups during the plasma treatments. When the effects of the two plasmas on these modifications were compared, we found that the concentrations of CF2 and
Treatment time / min
Pee
l stre
ngth
/ N
m-1
(b)
0
100
200
300
400
500
0 2 4 6 8 10 12
Treatment time / min
Pee
l stre
ngth
/ N
m-1
(b)
0
100
200
300
400
500
0 2 4 6 8 10 12
Treatment time / min
Pee
l str
engt
h / N
m-1
(a)
0
100
200
300
400
500
0 2 4 6 8 10 12
Treatment time / min
Pee
l str
engt
h / N
m-1
(a)
0
100
200
300
400
500
0 2 4 6 8 10 12
CF4/He SF6/He
Fig. 8 Effects of the treatment time on peel strengths between PSA tape and PET films treated with a CF4/He and b SF6/He using APGD. The symbols designate different discharge powers: ○, 100 W; □, 120 W; △, 150 W. The dotted line shows the value of untreated PTFE surfaces

1 3
Reviews of Modern Plasma Physics (2021) 5:3 Page 15 of 65 3
CF3 groups, which bring lower surface energies than C–C, C–O, COO, and CF groups, in the CF4/He discharge were higher than those in the SF6/He discharge.
Furthermore, we examined the relationship between the atomic ratios, F/C and O/C, and the peel strength. These results are shown in Fig. 11. The peel strength showed a nearly linear relationship with F/C. When the straight line depicted in Fig. 11 was extrapolated, the F/C value at the peel strength = 20 N m−1 (PTFE) was 1.58. This result suggested that the peel strength about equal to that of PTFE could be obtained if the F/C value was raised up to 1.58. However, a higher dis-charge power or a higher discharge frequency might be needed to increase F/C using the plasma treatments. Since PET film is weak against heat, we considered that it would be difficult to achieve such an increase only by the plasma treat-ments.
Finally, we investigated whether the treated layer could be peeled off from the PET film and moved to the PSA tape glue side after the peeling test. Figure 12 shows the variation of the F/C values of CF4/He discharge -treated PET side and of PSA tape glue side after peeling tests with the treatment time. The F/C values of the PSA tape glue side as peeled off from the plasma-treated PET were near zero. Those of the PET side as peeled off from the treated PET were almost identical to those of the treated PET. These results indicate that part of the plasma-treated layers was not peeled from the PET. Therefore, we concluded that the surface fluorination of PET by APGD could prevent the peeling from the treated layer.
Treatment time / min
Ato
mic
ratio
s, F
/C a
nd O
/C(a)
0
0.5
1
1.5
2
0 2 4 6 8 10 12
Treatment time / min
Ato
mic
ratio
s, F
/C a
nd O
/C(a)
0
0.5
1
1.5
2
0 2 4 6 8 10 12
Treatment time / min
Atom
ic ra
tios,
F/C
and
O/C
(b)
0
0.5
1
1.5
2
0 2 4 6 8 10 12
Treatment time / min
Atom
ic ra
tios,
F/C
and
O/C
(b)
0
0.5
1
1.5
2
0 2 4 6 8 10 12
SF6/HeCF4/He
Fig. 9 The variation of the atomic ratios F/C (○) and O/C (□) of the PET films treated with a CF4/He and b SF6/He APGD with the treatment time. F/C and O/C values on the ordinate axis correspond to PET. The values of discharge power in the case of Sub-Figures a and b are 100 and 150 W, respectively

Reviews of Modern Plasma Physics (2021) 5:3
1 3
3 Page 16 of 65
(2) Surface fluorination of PET films with different surface roughness values We tried to combine the APGD fluorination and the surface roughening for
the formation of the surface with high peel property on PET film. The seven matte PET films (Table 1) were treated with the CF4/He APGD at a discharge power of 100 W for 10 min. Figure 13 shows the peel strength of the matte PET films with and without the fluorination. The peel strengths of smooth surface PET films with and without the fluorination and of PTFE film are also shown in Fig. 13. We found that the peel strength of the matte PET films without the plasma treatment showed lower peel strengths than the value of the untreated smooth surface PET. This result indicates that the surface roughening made the peel property higher. Moreover, the matte PET peel strengths were decreased by the fluorination; especially the roughest matte PET, #7, showed lower peel
Fig. 10 XPS C1s spectra of PET films treated with plasmas as a function of the treatment time: a untreated; b and c treated with CF4/He APGD for 1 and 10 min, respectively; d and e treated with SF6/He APGD for 1 and 10 min, respectively. The values of discharge power in the CF4/He and SF6/He APGD are 100 and 150 W, respectively
280284288292296300Binding energy / eVBinding energy / eV
(a)
C-C
C-CFn or, and C-OCF or, and COO
CF3 CF2
Inte
nsity
(a. u
.)
(b)
(c)
(d)
(e)

1 3
Reviews of Modern Plasma Physics (2021) 5:3 Page 17 of 65 3
Fig. 11 Relationship between atomic ratios F/C (circle symbols) and O/C (square symbols) of the PET films treated with plasmas and peel strengths; open symbols: CF4/He, closed symbols: SF6/He, double symbols: untreated. The dotted line shows the peel strength of PTFE (20 N m−1). The values of discharge power in the CF4/He and SF6/He APGD are 100 and 150 W, respectively. When the straight line of F/C depicted in Fig. 11 was extrapolated, its value at the peel strength = 20 N m−1 (PTFE) was 1.58
Peel strength / N m-1
Atom
ic ra
tios,
F/C
and
O/C
0
0.5
1
1.5
2
0 100 200 300 400 500
1.58
Peel strength / N m-1
Atom
ic ra
tios,
F/C
and
O/C
0
0.5
1
1.5
2
0 100 200 300 400 500
1.58
Fig. 12 The variation of the atomic ratios F/C of the PET side and of the PSA tape glue side peeled off from the CF4/He APGD-treated PET/PSA tape adhesive joint. The symbols des-ignate different surfaces: ○, as-treated; □, after 180˚ peel test (PET side); △, after 180˚ peel test (adhesive tape glue side)
Treatment time / min
Atom
ic ra
tio, F
/C
0
0.5
1
1.5
2
0 2 4 6 8 10 12
Treatment time / min
Atom
ic ra
tio, F
/C
0
0.5
1
1.5
2
0 2 4 6 8 10 12

Reviews of Modern Plasma Physics (2021) 5:3
1 3
3 Page 18 of 65
strength than that of PTFE. The peel strength of the roughest matte PET with fluorination was 3.0 N m−1. Therefore, from the viewpoint of the formation of the high peel property, our expectation was achieved.
4.2.4 Conclusion
The surface fluorination of PET films by APGD could prevent the peeling off of the treated layer but did not lead to high enough peel property. The combination of the surface fluorination and the surface roughening made the peel property higher than the value needed for use as a release coating of PSA tapes. Since the relationships between the surface roughness parameters or the surface configurations and the peel property were not clear, we intend to examine them in further research.
4.3 New adhesive‑free lamination using a plasma surface treatment at atmospheric pressure (Tanaka et al. 2008)
4.3.1 Introduction
The laminated polymer films are widely used for the packaging materials of foods, cosmetics, pharmaceutical products and so on. These laminated films are generally pasted two or more kinds of polymer films with an organic adhesive diluted by an organic solvent. The adhesives and/or solvents, which remain between the films,
0
100
200
300
400
500
Number of matte PET sample
Peel
stre
ngth
/ Nm
-1
#1 #2 #3 #4 #5 #6 #7 PET PTFE
Fig. 13 Peel strengths of the matte PET films fluorinated with (gray bar) and without (white bar) CF4/He plasma for 10 min. The matte PET samples (#1 ~ #7) used for the peel tests have different surface rough-ness, as shown in Table 1

1 3
Reviews of Modern Plasma Physics (2021) 5:3 Page 19 of 65 3
sometimes exude into the package content. And the organic solvent is cause of the environmental pollution in the manufacturing plant as a volatile organic compound (VOC). Thus, a new adhesive-free lamination technique is desired. In this study, an adhesive-free lamination technique was investigated using the atmospheric pressure glow discharge surface treatment and thermo-compression.
4.3.2 Experimental
The popular lamination materials, such as polyethylene terephthalate (PET), nylon (NY), low density polyethylene (LDPE) films, were used as samples for the adhe-sive-free lamination. These films were first treated by N2/He or He APGD. Low frequency (LF; 100 kHz) and Radio Frequency (RF; 13.56 MHz) were used as dis-charge frequency.
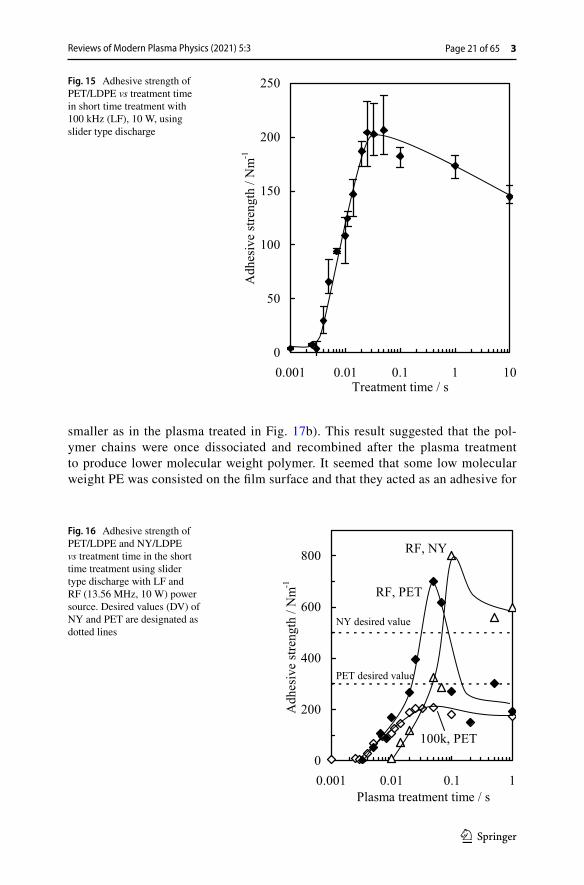
In this experiment, the tubular type discharge apparatus was used as shown in Fig. 7 (reactor type A) for long time (10–90 s) treatment of sample films which wind round on the inner electrode. Figure 14 shows a slider type discharge appa-ratus (reactor type B) for brief time (1 ms–10 s) treatment in the air ambient. In the apparatus, plasma is kept between upper electrode and lower sliding electrode. The treatment time with the slider type discharge apparatus (reactor type B) was varied by changing the velocity of the slider. Then, the treated films of each combinations, such as PET/LDPE and NY/LDPE were laminated by the thermo-compression (140–180 °C, 0.4 MPa, 10 s). An adhesive strength of the laminated film was meas-ured 180º peel strength with tensile tester.
When we measured the adhesive strength by heat pressing of LDPE with PET or NY film, once PET or NY film side was fixed on a steel plate with epoxy glue and then LDPE was pulled. The chemical state of the films was determined by XPS (ULVAC-Phi Co., Ltd., ESCA-5800ci); light source was monochromatic Al Kα ray and take-off angle was 5º. The details of the discharge conditions are shown in Table 2.
4.3.3 Results and discussions
All combinations of the untreated films were not stuck only by the heat press. Although the adhesion strength values of the treated films that used the reactor type A did not exceed the industrial desired values, they exhibited higher values than those of the untreated as shown in Table 3.
We obtained small increasing effect on the adhesion strength value with decreas-ing the treatment time from 15 s. However, when we use the reactor type A, we can-not have the treatment time shorter than 10 s, so we used the reactor type B.
In Fig. 15, we obtained the maximum adhesion strength for times including those under 0.04 s. After passing the maximum point, adhesion strength is decreased with decreasing of the time. The insufficient plasma irradiation on the sample surface results in the reduction of adhesive strength.

Reviews of Modern Plasma Physics (2021) 5:3
1 3
3 Page 20 of 65
As shown in Fig. 16, the adhesive strength of PET/ LDPE and NY/LDPE using RF power source is obviously refined compare with LF discharge treatment and attained extremely higher values than that of the desired values shown by the dot-ted lines in the figures. In the high frequency discharge higher than 1 MHz, ions with heavy masses cannot move across the gap causing loss on the electrodes in the half cycle. High density ions built in the intensive electric field in the plasma that causes higher density plasma than those of LF discharge. Since the plasma density in RF discharge is much higher than those of the LF discharge, our exper-imental results exhibited high adhesion ability in the short time treatment with RF discharge.
Figure 17a and b shows the XPS–valence band spectra of untreated and the N2/He plasma treated LDPE. The adhesion strength of plasma treated films is much higher than that of the untreated film as indicated by the adhesion strength (AS) marks in the figures.
The main peak of Fig. 17a obtained around 15 eV is related to C–C bonds of the PE structure (Delhalle et al. 1974; Foerch et al. 1991). This peak became
< Reactor type B >
H.V.
Sample film
Insulator
Sliding electrode
N2+HeUpper Electrode
Slider
Plasma area
Fig. 14 Discharge apparatus that has sliding electrode for rapid film scanning (reactor type B)
Table 2 The discharge conditions Discharge Frequency 100 kHz (LF) or 13.56 MHz (RF)
Discharge Power/W 10 or 100N2 Flow Rate/sccm 0 or 20He Flow Rate/slm 5Pressure Atmospheric pressureTreating time 15–90 s (Type A) or 1 ms–10 s (Type B)
Table 3 Adhesive strength of each combination in LF discharge
Discharge time: 90 s
Films Plasma gas Adhesive strength/Nm−1
UT PT DV
PET/LDPE N2/He 0 87 300NY/LDPE N2/He 434 500
1 3
Reviews of Modern Plasma Physics (2021) 5:3 Page 21 of 65 3
smaller as in the plasma treated in Fig. 17b). This result suggested that the pol-ymer chains were once dissociated and recombined after the plasma treatment to produce lower molecular weight polymer. It seemed that some low molecular weight PE was consisted on the film surface and that they acted as an adhesive for
Fig. 15 Adhesive strength of PET/LDPE vs treatment time in short time treatment with 100 kHz (LF), 10 W, using slider type discharge
0
50
100
150
200
250
0.001 0.01 0.1 1 10Treatment time / s
Adh
esiv
e st
reng
th /
Nm
-1
Fig. 16 Adhesive strength of PET/LDPE and NY/LDPE vs treatment time in the short time treatment using slider type discharge with LF and RF (13.56 MHz, 10 W) power source. Desired values (DV) of NY and PET are designated as dotted lines
0
200
400
600
800
0.001 0.01 0.1 1Plasma treatment time / s
Adh
esiv
e st
reng
th /
Nm
-1 RF, PET
RF, NY
100k, PET
PET desired value
NY desired value

Reviews of Modern Plasma Physics (2021) 5:3
1 3
3 Page 22 of 65
the heat-press lamination with lowering of the glass-transition temperature. That is confirmed using atomic force microscope (AFM). The glass-transition temper-ature of the surface was clearly decreased after plasma irradiation (Dobashi et al. 2011). This mechanism was extended for polymers, such as nylon-polypropylene or polyethylene terephthalate-polypropylene. The altered layer depth from the surface by plasma irradiation was about 0.9–7 nm that measured by take-off angle method (Dobashi et al. 2011).
4.3.4 Conclusion
The adhesive-free lamination technique was successfully developed using the atmos-pheric pressure discharge. The adhesive strength for PET/LDPE and NY/LDPE are strongly depended with the discharge frequency and the treatment time.
4.4 Surface treatment of fluorinated polymers using APGD system
4.4.1 Introduction
Fluorinated polymers, such as poly vinyl fluoride (PVF), tetrafluoroethylene-hex-afluoropropylene copolymer (FEP), tetrafluoroethylene-perfluoro alkylvinylether copolymer (PFA), and polytetrafluoroethylene (PTFE) have many unique character-istics, for example, high chemical resistance, high heat resistance, low coefficient of friction and so on. Thus, they have been used as typical inert materials for many hard situations. Nevertheless, they have problems, such as difficulty of adhesion and hydrophobic nature. In general, fluorinated polymers cannot treat with a conveni-ent process, such as corona discharges, because they can add only low effects to the
Binding Energy (eV)50 40 30 20 10 0
C-C bond
UntreatedTreatment time
50 ms
AS, 206 Nm-1
TOA, 5º
0
Binding Energy (eV)
Inte
nsity
(a.u
.)
10
20
30
40
50
60
50 40 30 20 10 0
Fig. 17 XPS valence band spectra of the untreated and N2/He plasma treated LDPE in the valence band region. In the figures, AS means the adhesion strength of each sample

1 3
Reviews of Modern Plasma Physics (2021) 5:3 Page 23 of 65 3
chemically inert surfaces. Some agents, which contain metal sodium, are usually used to add the adhesibility or the hydrophilicity to the fluorinated polymers. How-ever, this treatment needs a large amount of cleaning water and thus the disposal of much waste fluid. Moreover, the treated surfaces become blackish. From the reason, a new dry process had been desired instead of the wet treatments. Several studies of the surface treatment with low-pressure glow discharge (LPD) were reported (Badey et al. 1996; Hirotsu and Ohnishi 1980). However, this method has not been widely used for industry because of the low through put and difficulty of applying it to an assembly line directly.
At first, we will examine three fluorinated polymers (PVF, FEP, and PFA) other than PTFE. The changes of their adhesion strength and chemical states measured by XPS will be shown (Tanaka and Kogoma 2003b).
In the case of PTFE, it has only-CF2 bonds that are surrounded on the strait car-bon chain. From the reason, it is most difficult substance to eliminate the fluorine atom from the carbon chain. Hence, we needed to use a different system and gas to treat PTFE (Tanaka et al. 2001; Kogoma et al. 2015) other than those above three fluoropolymers. At final, we will try to compare the APGD and the LPD (Wenfeng et al. 2015) in which is better plasma system for the PTFE treatment.
4.4.2 Experimental
(1) Treatment of PVF, FEP, and PFA In the case of the treatment for three polymers, PVF, FEP, PFA, we used
parallel plate electrode (diameter: 125 mm, the gap length: 2 mm, 1 atm) dis-charge system as shown in Fig. 2, that stored in a glass chamber. The plasma was generated with a 100 kHz power supply at 50 W. Treatment mixture gases were O2, N2, and Ar gases diluted with large amounts of He or He alone. The flow rates of gas mixture were as follows, He: 2 slm, and O2, N2, Ar were each 5 sccm. A rotary pump first evacuated the chamber and the pressure was then restored with a treatment mixture gas at atmospheric pressure. Treatment time was 0.5 ~ 5 min. Polymer sample (NILACO Co. Ltd., 0.05 mm films, sizes: 20 × 40 mm) was placed on the lower electrode that connected with the ground. Water contact angle was measured using contact angle meter. A treated sample film was glued on an aluminum plate with epoxy glue. Peeling force of the test piece was measured by 180° tensile tester (HEIDON-14). XPS (ULVAC-Phi, ESCA5800ci) was used for the surface analysis. The details of the schematics were shown in reference (Kogoma et al. 2015).
(2) Treatment of polytetrafluoroethylene (PTFE) with diborane–plasma system Boron trifluoride (BF3) is the gaseous fluorine compounds at room tempera-
ture and the bond enthalpy of fluorine with boron (757 kJ mol−1) is much bigger than that of fluorine with hydrogen or carbon (570 or 552 kJ mol−1) (Lide 2000). It seemed that defluorination of PTFE will be possible with using diborane (B2H6) dissociation plasma.
Figure 18 shows the discharge apparatus which have two discharge areas. The discharge areas were bounded for quartz glass plates, and so H2/He mixture gas

Reviews of Modern Plasma Physics (2021) 5:3
1 3
3 Page 24 of 65
flowed in one direction. The upstream discharge was used for the reaction of hydrogen and boron plate to have the diborane generation and the downstream discharge was used for PTFE surface treatment with boron atom by dissociation of diborane which was transferred from the upstream, respectively. The boron plate (thickness, about 0.1 mm) was prepared by solidification of boron powder (0.3 g) with inorganic adhesive (0.3 g, Aron Alpha Inc., Aron Ceramic D). PTFE sheet, whose sizes were 20 mm × 20 mm × 0.2 mm was used.
The treated sample surface was evaluated as same as in the 2.1. Discharge power for diborane generation was 27.12 MHz, 500 W, and for diborane dis-sociation plasma was 300 kHz, 50 W. The flow rates of gas mixture were as follows, He: 2 slm, H2: 10 sccm. Treatment time was 0.5 ~ 5 min.
(3) Treatment of PTFE with NH3-H2O/He in low pressure discharge (LPD) and APGD systems
RF (13.56 MHz, 100 W) discharge and parallel electrodes were used in the both plasma systems as same as in Fig. 2. The electrode gaps were 15 mm for low pressure (0.6 Torr) system and 2 mm for APGD (1 atm) system respectively. The sample film (PTFE, 0.5 mm × 2 cm × 3 cm) was placed on the grounded electrode. Sample gas was introduced to the chamber path troughed the bubbling system of NH3 (10%) aqueous solution with 10 sccm of He flow. The sample gas conditions were followed with in the reference (Tanaka and Kogoma 2003b). In the case of the APGD, NH3 + H2O (10%) vapor with 10 sccm of He flow that was diluted by 2 slm of He.
4.4.3 Results and discussion
(1) PVF, FEP and PFA treatments
5 mm
H2+He
Cooling water
RFGenerator
LFGenerator
Boron plate
1 mm
PTFE sheetQuartz glass
< Sectional view >
Fig.18 Side sectional view of discharge apparatus for dual plasma treatment using hydrogen and boron

1 3
Reviews of Modern Plasma Physics (2021) 5:3 Page 25 of 65 3
Figure 19a–c) shows the variation of the atomic composition ratios of F/C and O/C + N/C calculated from XPS measurement. Figure 19a shows the untreated PVF and they were slightly oxidized. The variation of F/C shows the reduc-tion of fluorine atoms. And O/C + N/C show some additional atoms due to the plasma treatments. In the case of PVF, the ratios of O/C + N/C were saturated for a brief time treatment. We assumed that PVF had only one fluorine atom in its unit structure and that PVF was oxidized more easily than other fluorinated polymers. On the other hand, the ratios of O/C + N/C of FEP and PFA increased as the treatment time increased. Especially, those of He plasma-treated samples increased significantly, and the ratios of F/C decreased simultaneously. All the results of O2/He discharge treatment showed relatively low ratios of O/C + N/C and high ratios of F/C. It seemed that O atom has lower reactivity than that of the N2/He plasma on the fluorinated polymers. Figure 20 shows adhesive strength of FEP and PFA treated in APGD.
The peel forces of plasma-treated PVF could not be measured because their adhesive forces were beyond the value of the measurement instrument limit (2.00 kg∙20 mm−1). Moreover, it was higher than that of the target level, whose value was 1.06 kg∙20 mm−1. The adhesive forces of FEP and PFA treated by plasma were approximately 180 and 80 times stronger than the forces of untreated films, whose values were 0.4 and 0.6 kg∙20 mm−1. In addition, the results of FEP showed the higher force values than the target level, while those of PFA showed slightly lower than that of the target level. For the treatment of PFA, further harder system will be needed, because PFA has no hydrogen in the structure.
(2) Treatment of polytetrafluoroethylene (PTFE) with diborane plasma system Figure 21 shows the variation of the atomic content ratios of F/C and O/C
calculated from XPS results of the diborane/H2/He plasma treated PTFE. The O/C values of the treated PTFE were quite low as shown in Fig. 21. This result suggested that the chemical state of the treated PTFE surface came close to that of polyethylene because of defluorination of PTFE and additional reaction of hydrogen atoms. It is certain that the surface morphology of the treated PTFE became rougher that provides the increasing of the adhesive force. Although the fluorine atoms on the treated PTFE surface were not removed completely, the F/C value was decreased to about twentieth of that of untreated PTFE.
Next, the adhesive strength between treated PTFE and epoxy glue was exam-ined. Figure 22 shows the variation of the adhesive strength. The adhesive strength became stronger linearly as increasing the treatment time. And those treated longer than 2 min showed higher values than that of target value. The adhesive strength of 5 min treated PTFE was about twice as higher as that of target value treated with Tetra-Etch (DuPont, sodium-naphthalene), and it was high enough adhesive strength for practical use.
(3) Treatment of PTFE with NH3-H2O/He in low pressure discharge (LPD) and APGD systems
For a reaffirmation, a comparative study has been done with the LPD and APGD systems. Figure 23 shows the surface wettability of PTFE as a changing of the treated time in LPD and APGD. When we use LPD with NH3-H2O/He, water contact angle was decreased with increasing of the elapse time. In the

Reviews of Modern Plasma Physics (2021) 5:3
1 3
3 Page 26 of 65
longer treating time than 30 min, the contact angle was going to lower than 5°. Thus, the appearance of the super hydrophilicity on the PTFE surface which is shown in the reference (Wenfeng et al. 2015) has been demonstrated. On the PTFE treated with NH3-H2O/He in LPD system, O1s or N1s spectra were found that for certain assigned as carboxyl or amide group which was measured by XPS
0.0
0.1
0.2
0.3
0.4
0.5
0.6
-0.3
-0.2
-0.1
0.0
0.1
0.2
0.3
0 10
Ato
mic
ratio
of F
/C
Ato
mic
ratio
of O
/C+N
/C
Treatment time / min
(a)
0.0
0.5
1.0
1.5
2.0
2.5
3.0
-0.4
-0.2
0.0
0.2
0.4
0 5 10
Ato
mic
ratio
of F
/C
Ato
mic
ratio
of O
/C+N
/C
Treatment time / min
(b)
0.0
0.5
1.0
1.5
2.0
2.5
3.0
-0.5
-0.3
-0.1
0.1
0.3
0.5
0 5 10
Ato
mic
ratio
of F
/C
Ato
mic
ratio
of O
/C+N
/C
Treatment time / min
(c)
Fig. 19 The variation of the atom number ratios of F/C and O/C + N/C observed from XPS. Sub-figures a, b and c are the results of PVF, FEP and PFA, respectively. Treatment gases were He, O2/He, N2/He and Ar/He

1 3
Reviews of Modern Plasma Physics (2021) 5:3 Page 27 of 65 3
(not shown). Normally, an electro negativity of the carboxyl group is enhanced by containing of amide group that arise the enhancement of hydrophilicity in the molecule. This is one of the reasons why we see the super hydrophilicity at longer treatment time of PTFE in LPD in Fig. 23. In contrary, in the APGD, the water contact angle shows almost no change with changing of the elapse time even using the same gas composition and discharge power in low pressure discharge, except of the operating pressure. It is well known that some kinds of radicals cannot easy react with PTFE, such as O atom, H atom, OH and NHn.
0
0.5
1
0 2 4 6 8 10Treatment time / min
Peel
forc
e / k
g·20
mm
-1
Control
(a) (b)0
0.5
1
0 2 4 6 8 10Treatment time / min
Peel
forc
e / k
g·20
mm
-1 Control
Fig. 20 The variation of the peel force. Sub-figures a and b are the results of FEP and PFA, respectively. Treatment gases were He, O2/He, N2/He and Ar/He
Fig. 21 The variation of the atomic content ratios F/C (●) and O/C (□) as a function of the treatment time on the diborane/H2/He plasma
0
0.1
0.2
0.3
0.4
0.5
0.6
0.7
0 1 2 3 4 5
F/C
, O/C
Treatment time/min
2

Reviews of Modern Plasma Physics (2021) 5:3
1 3
3 Page 28 of 65
Because, –CF2 bond is too strong to react with such radicals. Hence, in LPD, some supporting reaction should be expected, such as sputtering reaction to enhance the radical reaction on the PTFE in LPD. The peeling force which treated in APGD with NH3-H2O/He was the same as that of the untreated PTFE. Figure 24 shows the peeling force which treated in low pressure discharge with NH3-H2O/He. In the fig., also shows the surface treated in the diborane–APGD system.
In the LPD treated surfaces, H2O/He system shows faster increasing rate than that of NH3-H2O/He, but it shows much slower rate than that of the treated in boron compound–APGD system. Suppose the rate determining step will be attributed to the slow sputtering reaction on the PTFE even in the NH3-H2O/He LPD. On the other hand, at the diborane–APGD system, the atomic boron produced in APGD directly extracts the fluorine atom from –CF2 bond of PTFE
Fig. 22 The variation of the adhesive strength as a function of the treatment time. The dashed line shows the target value
0100200300400500600700800900
1000
0 1 2 3 4 5
Adh
esiv
e st
reng
th /
Nm
-1
Treatment time / min
Fig. 23 Water contact angle θ as a function of treatment times of PTFE that treated in LPG (0.6 Torr) and APGD (1 atm)
0
20
40
60
80
100
120
140
0 20 40 60 80
θ / d
eg
t / min
NH3-H2O/He (APGD)
NH3-H2O/He (LPD)

1 3
Reviews of Modern Plasma Physics (2021) 5:3 Page 29 of 65 3
and then post oxidation will be occurred by the exposing in the air. In the case of PFA, also it could attain good adhesibility with boron–APGD system.
4.4.4 Conclusion
For PVF and FEP, they are relatively easy to obtain good adhesibility with O2, N2, and Ar in He, or He only in APGD. In the PFA and PTFE, from the reason of the perfluorinated polymers, diborane–APGD is better system than that of the LPD to refine the surface adhesion strength.
4.5 Polymerization of allyl alcohol using atmospheric pressure glow discharge
4.5.1 Introduction
The creation of hydroxyl chemical group on the solid surfaces is especially useful as the pre-activation step before the surface coating, such as silane coupling reac-tion to insert functional chains, grafting of PEG for biocompatible surface and hydrophilic surface to take wettable surface.
We previously reported the surface oxidation to have the wettability on the polyethylene powder using APGD (Kogoma et al. 2008). The plasma oxida-tion of the polymer will produce mixture of –COOH, –CO, and –OH groups as the hydrophilic groups on the treated surfaces. From the reason, it is difficult to obtain –OH group without of production of any other oxidants on the treated
0
200
400
600
800
1000
1200
0 50
Peel
ing
forc
e / N
m-1
Treating time / min
Boron-APGD
NH3/He
NH3-H2O/HeH2O/He
Fig. 24 The peering force with epoxy adhesion treated in LPD with variation of treating gas and boron compound-APGD

Reviews of Modern Plasma Physics (2021) 5:3
1 3
3 Page 30 of 65
surfaces. Gombotz et al. (1991) introduced hydroxyl group by low pressure glow discharge CVD of allyl alcohol on the PET film to activate the surface before immobilizing the PEG on the surface. However, they could not obtain the com-plete surface coverage of hydroxyl group by low pressure PCVD. In the low-pres-sure glow discharge, ion impact to the deposited surface is too active to keep the hydroxyl group that is comprised in the monomer molecule. Hence, the low pressure PCVD of allyl alcohol could not have enough concentration of hydroxyl group on the surfaces. On the other hands, because of the low ion energy in high pressure discharge, APGD-CVD can eliminate the possibility of any reaction which attributed to the ion impact reaction on the surface. We will report the thin layer deposition on the glass surface by the APGD-CVD using allyl alcohol.
4.5.2 Experimental
LF (300 kHz) discharge power from 10 to 40 W is applied to the discharge appa-ratus that is composed by parallel Pyrex glass plates and outer metal electrodes as shown in Fig. 2. Allyl alcohol was used as a monomer substance for the simplest alcohol molecule which has a double bond in the structure. The 2 slm of He gas is mixed with few ten sccm of ally alcohol vapor then introduced to the discharge zone. The glass plate (0.5 mm × 10 mm × 30 mm) is used as the substrate which inserted between the electrodes. The discharge gap is 2 mm. The deposited films are investigated by surface roughness profiler, wettability measurement using water contact angle method, elemental analysis, XPS for the chemical derivatiza-tion techniques to measure the absolute concentration of hydroxyl groups on the deposited surfaces.
4.5.3 Results and discussions
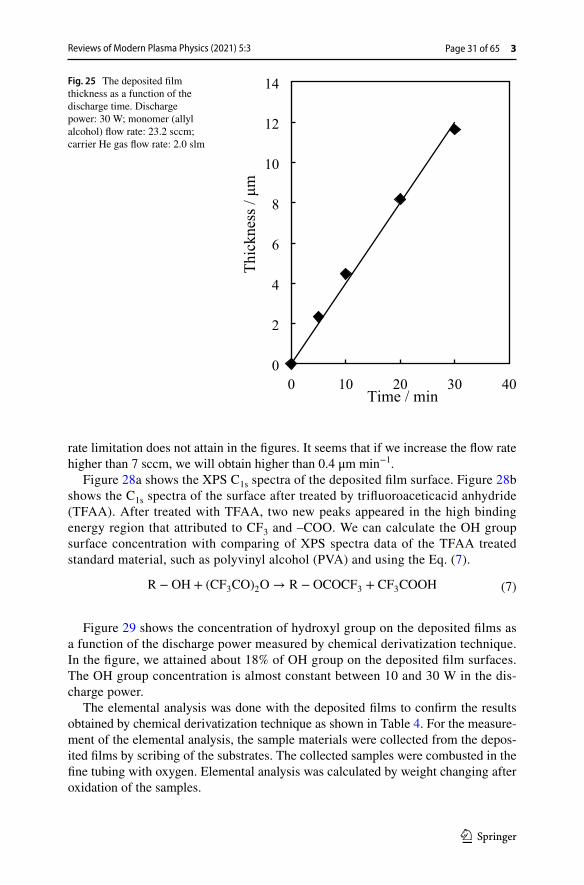
Deposited film surfaces show slightly yellowish-brown collar and are not soluble in water and ethanol. Figure 25 shows the deposition thickness as a function of the discharge time at 30 W of the discharge power and 23.2 sccm of the monomer flow rate. The film thickness is almost linear dependent with the discharge time. The deposition rate is attained about 0.4 μm min−1 which is 30 times faster than that obtained in low pressure discharge (Rinsch et al. 1996). This means that APGD-chemical vapor deposition is very efficient deposition system for polymer deposi-tion. We suppose that the reason of high deposition rate in APGD is attributed to no ion effect on the surface, because the fast ion impact in the low-pressure glow discharge will bring the etching effect for the deposition film.
Figure 26 shows the deposition thickness as a function of the discharge power. The deposition rate is little bit decreased at the high-power region. This means that monomer flow limitation will be attained at high power region.
Figure 27 shows the film thickness as a function of the monomer flow rate. The thickness is almost linear dependent with the flow rate of the monomer. Even in the highest flow rate, the thickness is still increasing linearly. This means that the flow
1 3
Reviews of Modern Plasma Physics (2021) 5:3 Page 31 of 65 3
rate limitation does not attain in the figures. It seems that if we increase the flow rate higher than 7 sccm, we will obtain higher than 0.4 μm min−1.
Figure 28a shows the XPS C1s spectra of the deposited film surface. Figure 28b shows the C1s spectra of the surface after treated by trifluoroaceticacid anhydride (TFAA). After treated with TFAA, two new peaks appeared in the high binding energy region that attributed to CF3 and –COO. We can calculate the OH group surface concentration with comparing of XPS spectra data of the TFAA treated standard material, such as polyvinyl alcohol (PVA) and using the Eq. (7).
Figure 29 shows the concentration of hydroxyl group on the deposited films as a function of the discharge power measured by chemical derivatization technique. In the figure, we attained about 18% of OH group on the deposited film surfaces. The OH group concentration is almost constant between 10 and 30 W in the dis-charge power.
The elemental analysis was done with the deposited films to confirm the results obtained by chemical derivatization technique as shown in Table 4. For the measure-ment of the elemental analysis, the sample materials were collected from the depos-ited films by scribing of the substrates. The collected samples were combusted in the fine tubing with oxygen. Elemental analysis was calculated by weight changing after oxidation of the samples.
(7)R − OH + (CF3CO)2O → R − OCOCF3 + CF3COOH
Fig. 25 The deposited film thickness as a function of the discharge time. Discharge power: 30 W; monomer (allyl alcohol) flow rate: 23.2 sccm; carrier He gas flow rate: 2.0 slm
0
2
4
6
8
10
12
14
0 10 20 30 40
Thic
knes
s / μ
m
Time / min

Reviews of Modern Plasma Physics (2021) 5:3
1 3
3 Page 32 of 65
Fig. 26 Film thickness as a function of the discharge power. Monomer flow rate: 23.2 sccm; carrier He gas flow rate: 2.0 slm; discharge time: 10 min
0
1
2
3
4
5
0 10 20 30 40
Thic
knes
s / �
m
Power / W
Fig. 27 Film thickness as a function of monomer flow rate. Discharge time: 10 min; carrier He gas flow rate: 2.0 slm; Dis-charge power: 30 W
0
1
2
3
4
5
0 10 20 30
Thic
knes
s / �
m
Allyl alcohol flow rate / sccm

1 3
Reviews of Modern Plasma Physics (2021) 5:3 Page 33 of 65 3
Table 4 shows the mean data of the elemental analysis of the deposited material.Difference between XPS data and elemental analysis data will be attributed to the
small amount of carbonyl group which included in the deposited materials and the structure changing by the cross linking of the allyl alcohol polymer.
279Binding energy / eV
282285288291294
Inte
nsity
(a. u
.)
CF3 COO
(b)
279Binding energy / eV
282285288291294
Inte
nsity
(a. u
.)(a)
Fig. 28 XPS C1s spectra of a the deposited film surface and b the deposited film surface after treated by TFAA
Fig. 29 Concentration of hydroxyl functionality on the deposited films as a function of discharge power
0
4
8
12
16
20
0 10 20 30 40
OH
con
tent
/ %
Power / W

Reviews of Modern Plasma Physics (2021) 5:3
1 3
3 Page 34 of 65
4.5.4 Conclusion
We succeed to deposit the cross-linked solid polymer film which shows very anal-ogous composition of the allyl alcohol. The deposition rate was attained 30 times higher than in low pressure plasma CVD. Obtained films contained about 18% of the hydroxyl group on the deposited surfaces.
4.6 Silica coating of TiO2 fine powder using atmospheric pressure glow discharge
4.6.1 Introduction
Some kinds of pigments that are used for cosmetics give rise to a skin irritation problem when they contact the skin directly. TiO2 is an UV reflective white pigment powder for cosmetics. However, naked TiO2 is a kind of photosensitive catalyst, so the powder easily attacks a human skin surface and oxidizes oil in the sweat as a squalene. Oxidized squalene molecules will produce many kinds of peroxy-organic compounds that may cause an allergy or cancer, needing to avoid such effects caused by the catalytic ability of TiO2 particles.
Previous studies reported the possibility of powder handling with atmospheric pressure glow discharge (Yokoyama et al. 1990; Mori et al. 1998; Ogawa et al. 2001). Then, at the first stage in this experiment, we will try to develop some SiO2 coating on the TiO2 powder pigments by means of APGD using tetraethoxysilane (TEOS) adsorbing and plasma oxidation to prevent the oxidation of squalene oil in the UV irradiation. On the other hand, the SiO2-coated TiO2 powders will not have only a very high refractive index for the UV region but also high transparency for visible and IR regions. For such reasons, silica-treated powders will have too white a tint to use for the cosmetics and cannot prevent IR penetration through the pow-der, which is also a cause of human skin irritation. We can expect that some metal ion doping can achieve wide band light absorption in TiO2. At the second stage, we will try to obtain a thin deposition layer of iron between the TiO2 surface and the silica layer to eliminate the photo-catalytic ability and to suppress the wide band light transparency of bulk TiO2.
Finally, we measure the catalytic effect and light absorption of the new material iron doped silica-coated TiO2.
Table 4 Elemental analysis of the sample of deposited materials collected from the substrates
Residual part of % is nitrogen
Elements Carbon/% Hydrogen/% Oxygen/%
Deposited 63.97 8.65 25.47Calc. value of AA 62.04 10.41 27.55

1 3
Reviews of Modern Plasma Physics (2021) 5:3 Page 35 of 65 3
4.6.2 Experimental
The mean diameter of TiO2 particles is two hundred nm; they contain 80% of anatase and 20% of rutile (Toho Titanium Corporation, HT-170R). For iron doping, we used tris (2, 4-pentanedionato) iron (IAA). In this study, we employed the Adsorb and Dry method to achieve the coated surface. The schematics of the discharge reactor are shown in Fig. 30. The discharge conditions are as follows: discharge frequency, 13.56 MHz; power, 1.5–2.5 kW; O2/He gas flow rate, 100 ml min−1/10 l min−1. Treat-ing rate is about 2 g min−1 for the powder.
To examine the photo catalyst ability of the powders, we irradiated the squalene oil (2,6,10,15,19,23-hexamethyl-2,6,10,14,18,22-tetracosahexaene) that contained the powder samples by UV in a Pyrex glass bottle. After 1-h UV-irradiation by Xe lamp, the gas products were measured by GC–MS (Shimazu QP5050).
4.6.2.1 Process 1) Silica coating on TiO2 using adsorb and dry method At first, we tried to make sure of the possibility of the Adsorb and Dry method with TEOS to coat SiO2 on the bulk TiO2. In this treatment, adsorbed TEOS is partly reacted with naturally adsorbed water on the TiO2 surfaces to deposit SiO2. The percentages of SiO2 on the sample TiO2 powders are calculated using the next Eq.:
(8)Y = Xa∕100 ×W∕M
Exhaust
Mesh electrode
Quartz glass
Gas
Ultrasonic horn
H.V.
Discharge area
Powder
Cooling water
Cooling water
Fig. 30 Discharge apparatus for TiO2 powder coating

Reviews of Modern Plasma Physics (2021) 5:3
1 3
3 Page 36 of 65
Y,SiO2 wt% on TiO2 powders; X,sample powder weight/g; a,wt. % of SiO2 on the sample powder; W,Molecular weight of SiO2 (60); M,Molecular weight of TEOS (208).
Weighed TEOS is diluted in ethanol (lower than 10%); then the powder was dried in air ambience. Adsorbed powder was treated in the atmospheric pressure glow plasma in He–O2 system to eliminate the organic part from the adsorbed TEOS molecules.
4.6.2.2 Process 2) Iron ion doping TiO2 powders were pre-treated with IAA–etha-nol mixture to adsorb organic metal molecules on the surfaces of the particles. The amount of IAA in ethanol is calculated on the pattern of Eq. (7). After the evaporation of the ethanol, the IAA adsorbed powders are treated to have iron ion doped TiO2 using atmospheric pressure glow plasma in He–O2 system to eliminate the organic part from the adsorbed IAA molecules.
4.6.2.3 Process 3) Silica–Iron–TiO2 multicoating After process 2, the iron-doped TiO2 powders were pre-treated with TEOS (tetraethoxysilane–ethanol) mixture aero-sol to adsorb TEOS on the surfaces of the particles. After the ethanol evaporation, the powders are oxidized in APGD. Using the plasma treatment, SiO2 was deposited on the iron-doped TiO2 surface as an inorganic fine layer. The thickness of SiO2 depos-ited can be controlled by the concentration of TEOS in the solvent ethanol during the adsorbing process.
4.6.3 Results and discussion
4.6.3.1 Process 1) From the XPS analysis, we found Si2p and Ti2p spectra for TiO2 that adsorbed TEOS (b), and for TiO2 that adsorbed TEOS and then was oxidized in the He–O2 plasma (c), as shown in Fig. 31. After plasma oxidation (c), Si atomic concentration is increased because the naked TiO2 surfaces are completely covered by an inorganic SiO2 thin layer.
In Fig. 32, sharp peaks of O1s were obtained in the spectra of (a), (b) and (c). In the spectrum of (a) only one peak (529.9 eV) assigned to TiO2 existed. On the other hand, in the spectrum of (b) the peak (532.5 eV) assigned to SiO2 newly appeared while the peak assigned to TiO2 decreased. Therefore, we concluded that the surface of (b) was coated with SiO2, but the coating was not enough. The surface of TiO2 is still partly covered by half-dissociated TEOS molecules that are reacted with adsorbed water on the surface of TiO2. In the spectrum of (c), the peak assigned to TiO2 has almost disappeared and the shape of the peak looked like that of pure SiO2. We could confirm that the surface of (c) was almost com-pletely coated with an inorganic SiO2 layer without any organic contamination.
A transmission electron microscope (TEM) image of silica-coated TiO2 parti-cles is shown in photo 2. In the photo, homogeneous SiO2 thin layer (1–2 nm in thickness) is found on the particles. Hence, we attained a very homogeneous SiO2 layer with the TEOS Adsorb and Dry method.

1 3
Reviews of Modern Plasma Physics (2021) 5:3 Page 37 of 65 3
4.6.3.2 Process 2) Figure 33 shows the XPS Fe2p spectra of IAA-treated TiO2 particles oxidized in the O2/He plasma. In the fig., we can find Fe2p1/2 and Fe2p3/2 peaks assigned as Fe ion, but the binding energies of Fe2+ and Fe3+ ions are remarkably similar to each other rising to difficulty to distinguish ions on the TiO2. The amount of deposited Fe ion can be controlled by the concentration of IAA in the solvent ethanol at the adsorbing process.
Figure 34 show the UV–VIS reflection spectra of naked TiO2, IAA 1% adsorbed TiO2; adsorbed, then plasma-treated TiO2; and pure IAA powder. Naked TiO2 show a high and flat reflectivity from near IR region to UV region. Light incident to the surface partly penetrates the bulk and is absorbed in the solid, and then it reflects to the surface boundary, so the reflection spectra contain the absorption characteristics. IAA-adsorbed TiO2 shows small peaks attributed to adsorbed IAA on the TiO2 but such a peak is lost in the plasma-irradiated IAA itself. It seemed that plasma-treated IAA on the TiO2 was completely oxidized to inorganic Fe ion.
Figure 35 show the gas chromatography mass spectrometer (GCMS) spectra of gas products in squalene which contained the powders after being irradiated by a Xe lamp for one hour. Untreated TiO2 produces many kinds of organic oxides, such as ethanol, acetone and long chain oxidant compounds that should be harmful mate-rials for human skin. Also, the oil emits a foul odor. The product concentrations decreased with increasing of the concentration of the doped iron. However even for 2.5% iron-doped TiO2, we still have a small amount of alcohol in the spectrum.
4.6.3.3 Process 3) However, using silica-coated iron-doped TiO2 which is produced in process 3), we have almost no signal assigned as an organic oxide in the GCMS spectra of the UV irradiated squalene, except for a very small amount of ethanol signal. Normally the anatase-type TiO2 crystals have small rectangular open spaces, such a few angstroms in size, in the structure. It seemed that the iron ions are partly inserted into the open spaces of the TiO2 lattice. However, the crystal lattice of iron-doped TiO2 is the same as that of untreated one measured by XRD. Therefore, we could not infer whether the iron ion is in solid solution in TiO2.
0
3.61
10.56
0 2 4 6 8 10 12Si/Ti
(a) Untreated TiO2
(b) TiO2 that adsorbed 10 % TEOS
(c) Plasma oxidation of sample (b)
Fig. 31 Atomic concentration ratios of Si/Ti on the treated TiO2 powder surfaces

Reviews of Modern Plasma Physics (2021) 5:3
1 3
3 Page 38 of 65
The treated powder shows fine and flesh color with pearl-like glowing, that should be caused from a multi-reflection effect from the thin layer boundaries of sil-ica–iron–TiO2. Especially, the powder can cover the skin furrows and prevent easy drop-off of the powder from the skin surface by sweat, because of the high reflection for the incident light in the skin furrow and the strong absorbing ability of the nano-powder to absorb the skin oil.
4.6.4 Conclusion
We attained Fe ion doped TiO2 particles by means of atmospheric pressure glow dis-charge plasma oxidation using IAA and TEOS adsorption. The particles were coated by a silica protection layer to avoid the UV catalytic ability of TiO2. The plasma-treated TiO2 powders will provide many functional contributions for future cosmetics.
Inte
nsity
(a.u
.)
546 542 534538 530
(a)
(b)
(c)
Binding energy/eV526
529.9 eV TiO2
532.5 eVSiO2
Fig. 32 O1s spectra of XPS: a untreated TiO2, b TiO2 that adsorbed 10 wt% TEOS c Plasma oxidation of TiO2 that adsorbed 10 wt% TEOS

1 3
Reviews of Modern Plasma Physics (2021) 5:3 Page 39 of 65 3
Photo 2 TEM photography of TiO2 particle treated by SiO2 in plasma oxidation
Fig. 33 XPS Fe2p spectra of tris(2,4-pentanedionato)iron (IAA)—treated TiO2 particles oxidized in the O2/He plasma
Binding energy/eV
Inte
nsity
(au)
Fe3+
710.9 eV
740 732 724 716 708 700
Fe2p1/2
Fe2p3/2
Fe2+
709.6 eV
Fe0
706.9 eV

Reviews of Modern Plasma Physics (2021) 5:3
1 3
3 Page 40 of 65
Fig. 34 Reflection spectra of TiO2; IAA adsorbed TiO2; adsorbed, then plasma-treated TiO2; and pure IAA powder
0
10
20
30
40
50
60
70
80
90
100
400 500 600 700 800Wavelength / nm
Ref
lect
ion
/ %
TiO2
TiO2+IAA
TiO2+IAA after Plasma treatment
IAA
3.5 5 6.5 8Retention time / min
Inte
nsity
(a.u
.)
Squaren only (none powder)
IAA 2.5 % + SiO2
10%
IAA 2.5 %
IAA 1.0 %
Untreated TiO2
C5H10OAcetoneEthanol
Fig. 35 GCMS spectra of gas products in squalene which contained the powders after one hour irradiated by Xe lamp

1 3
Reviews of Modern Plasma Physics (2021) 5:3 Page 41 of 65 3
4.7 Fabrication of Polyethylene glycol (PEG) thin films by irradiation of atmospheric pressure glow discharge on the polyethylene powder (Kogoma et al. 2010)
4.7.1 Introduction
Polyethylene glycol (PEG or PEO) has a non-fouling property by inhibition of pro-tein or cell adsorption. However, to obtain the bio-compatibility surface, strong chemical bonds between the substance and PEG is required, because PEG is soluble in water or some organic solvent.
Few kinds of process to fix the PEG was developed in the plasma processing technology. A method of grafting of PEG on to deposited amorphous silica film obtained by plasma CVD was developed by Alcantara et al. (2000). However, the grafting of PEG needs long time to achieve the desirable thick film. From the point of view, the method of CASING (cross-linking by activated species of inert gas) was adopted to take the cross-link reaction of physically coated low molecular PEG to have a thicker film in one time (Sheu et al. 1992). The cross-linked PEG films on the low-density polyethylene (LDPE) films by irradiation of Ar plasma in low pressure show a significant increase of the hydrophilicity and reduction of baboon fibrinogen adsorption. PEG film has not only anti-fouling of protein but also hydrophilicity. From the reason, we can apply the PEG film for some enzyme reaction as a car-rier layer with out of any protein adsorption on the surface. However, the catalytic chemical reaction needs much larger surface area than that of the film. Moreover, polyethylene fine powder surface oxidation treatment using APGD was reported by our group. If we obtain the PEG film on the fine powder surface, we can enlarge the surface area than that of the plane film to improve the catalytic process and to improve the biocompatibility of the powder. We will report the combination study of the both processes to attain the PEG fixation on the fine polyethylene powder sur-face by using raw PEG adsorption and irradiation of APGD.
4.7.2 Experimental
4.7.2.1 Scheme 1. Polyethylene (PE) powder oxidation in APGD Before the PEG adsorption, polyethylene powder surfaces should be oxidized because polyethylene is one of the most difficult materials to absorb hydrophilic material on the surfaces hence the non-oxidized polyethylene powder will not absorb PEG. The powder is oxidized by APGD in advance of PEG absorption on the powder to refine the surface wettability of PE.
He (3 slm) gas was mixed with 50 sccm of O2, and then introduced in to the discharge zone with PE powder which was introduced from powder pool and 1.8–2.5 kW of RF (13.56 MHz) high voltage is applied to have APGD.
4.7.2.2 Scheme 2. PEG adsorption on PE powders 1–10% of PEG 2000 MW (raw-PEG) was dissolved in ethanol (99.5%, Kantou Kagaku Co, LTD). The oxidized poly-ethylene powder (8 μm∅, high density PE) is charged in to the solution and kept dur-ing 30 min to two hours in room temperature to absorb raw-PEG. The PEG adsorbed

Reviews of Modern Plasma Physics (2021) 5:3
1 3
3 Page 42 of 65
PE powder is separated with filter then dried. The dried powder will be irradiated in APGD to take cross linking reaction of the adsorbed raw-PEG.
4.7.2.3 Scheme 3. Cross‑linking reaction using APGD Figure 36 shows the schemat-ics of the plasma system to treat the powder by CASING reaction in the atmospheric pressure. Some weighted raw-PEG absorbed PE powder is introduced from the pow-der pool to the plasma reaction zone using He flow. We used RF (13.56 MHz) dis-charge to treat the powder. The RF power is modulated by 10 kHz pulse of 50% on time and 50% of off time to decrease the gas temperature in the plasma zone. The plasma activated particles passing through the He discharge are collected in the ves-sel. Table 5 show the discharge conditions for the cross linking of the raw-PEG that absorbed on the powder.
4.7.3 Results and discussion
Figure 37 shows the XPS C1s spectra of the oxide PE. In Fig. 37, oxygen content is about 10% in atomic composition on the surfaces. Oxide surface absorb hydro-philic molecules, such as PEG.
Figure 38 shows XPS C1s spectra of PEG on the oxide PE powder that adsorbed in 10% of PEG 2000 (raw PEG) ethanol solution. In Fig. 38, almost the same spectra as shown in Fig. 37 were obtained except of increasing of –CO bond. The –CO bond peak is increased with increasing of the concentration of PEG in ethanol solution. However, other bonds, such as –C = O, –COO were not increased with increasing of the concentration of PEG. Therefore, the –CO bonds in Fig. 38 will be assigned as that of in raw PEG structure of H(OCH2CH2)nOH.
Figure 39 shows the XPS C1s spectra of 10% absorbed PEG that treated in He cross-linking plasma. The height of –CO bonds is slightly decreased in Fig. 39 than that of in Fig. 38. We suppose that a part of –CO bonds of the surfaces were dissociated by charged of meta-stable exited He atom.
Figure 40 shows the ATR-FTIR spectra of untreated and treated PE surfaces. Oxide PE (b) shows some increasing of C = O stretching peak at 1704 cm−1, but if adsorbed by PEG in (c), strong C–O–C stretching peak at 1114 cm−1 will be appeared attributed to the chemical structure of raw PEG. When the plasma irradiation takes place on the surface of (c), CH stretching peaks at 2915 and 2850 cm−1 in (d) are modified and deformation by cross linking structure on the PEG film surfaces.
Finally, we measured the surface wettability of the treated and untreated pow-ders using with capillary raise method as shown in Fig. 41. Surface wettability is normally measured by contact angle measurement of liquid droplet on the flat surface. However, the method is not usable for the particle surface.
Figure 41 shows the capillary raise method for the surface wettability measure-ment of the powder.
The powder is stuffed in the tube then the bottom is stopped by the filter paper and soaked in the test liquid. The liquid is raising path through the clink of the powder

1 3
Reviews of Modern Plasma Physics (2021) 5:3 Page 43 of 65 3
particles then the raising height is measured with soaking time. In the method, the rais-ing rate (dl/dt) of the liquid is shown by the Eq. (9). In the equation, r is the inside radius of the tube (6 mmϕ), η is the liquid viscosity, γl is the liquid surface tension, θ is the contact angle of the surface, ∆p is the pressure difference between the outside and inside of the tube.
If ∆p is enough lower than outer pressure,
(9)u =dl
dt=
r2
8�l
[
2�lcos�
r+ Δp
]
(10)l2 =
[
2�lcos�
r
]
t
Fig. 36 Discharge apparatus for polyethylene (PE) powder treatment
He flow
Powder trap
Powder pool
Powder vessel
Cooling water
Cooling water
Inner electrode
Plasma zone
Gas out
Outer electrode
HV
Table 5 Discharge conditions for 5 g of sample powder Discharge frequency/MHz 13.56
Discharge power/kW 1.8–2.5Discharge time/min 30He flow rate/slm 3

Reviews of Modern Plasma Physics (2021) 5:3
1 3
3 Page 44 of 65
Thus, l2 is in proportion to the increasing time because the other factors (r, γl cosθ, η) are constant. In the measurement, benzyl alcohol is used as the test liquid. The slope of Fig. 42 is attributed to the surface energy that contained constants in Eq. (10). As shown in Fig. 42, oxide PE has highest surface energy in the figure. Although the cross-linked PEG PE shows second higher value, it
Fig. 37 XPS C1s spectra of oxide PE powder
290 288 286 284 282 280
Inte
nsity
(a.u
.)
Binding energy / eV
Oxide PE
Fig. 38 XPS C1s spectra of 10% PEG absorbed PE powder
290 288 286 284 282 280
Inte
nsity
(a.u
.)
Binding energy / eV
PEG on the PE

1 3
Reviews of Modern Plasma Physics (2021) 5:3 Page 45 of 65 3
should be chemically stable and biocompatible polymer layer in the air environ-ment than that of oxide PE surfaces. Raw-PEG adsorbed PE show close values as in untreated PE. Probably adsorbed raw PEG molecule was dissolved in the benzyl alcohol.
The solubility in the water of the cross-linked PEG layer fabricated on the solid surface was tested by water resistance of the spin coated raw PEG layer on the glass surface. After APGD surface treatment, the raw-PEG surface became insoluble in the water.
4.7.4 Conclusion
We succeed the water insoluble polyethylene glycol films as a core shell of polymer powder by the combination techniques of adsorption of PEG on the powder sur-faces and atmospheric glow discharge irradiation to the surface. The cross-linked PEG layer fabricated on the polymer powder show very hydrophilic nature on the surfaces.
4.8 Fluorinated polymer deposition on the inner surface of tubing using atmospheric pressure glow discharge (Prat et al. 2000)
4.8.1 Introduction
A fluoro-polymer layer on the inner surface of poly-vinyl chloride (PVC) tube increases its blood compatibility and suppresses the bleeding of plasticizers pre-sent in the commercial PVC. Furthermore, it is so difficult for the conventional
Fig. 39 XPS C1s spectra of PEG absorbed PE powder irradi-ated by APGD in the discharge apparatus
290 288 286 284 282 280
Inte
nsity
(a.u
.)
Binding energy / eV
Cross linked PEG

Reviews of Modern Plasma Physics (2021) 5:3
1 3
3 Page 46 of 65
low-pressure glow plasma to coat the inner surface of soft tubular structures due to the pressure differences between the tube inside and outside which will distort the walls (d’Agostino 1990; Ratner 1992; Yasuda 1985; Occhiello et al. 1991; Suzuki et al. 1986; Griesser et al. 1994). The APGD system is useful in modifying materials by way of surface treatment, deposition, and surface etching similar to low pressure glow plasmas (Suwa et al. 1996; Breitbarth et al. 1990) even for inside of the fine tube. We report the application of APGD to fluorinate the inner surface of com-mercial poly(vinyl chloride) (PVC) tubes to enhance biocompatibility for a blood circulating tube.
2
CH stretchingC-O-C stretching
CH2 bending
C=O stretching
(d) Cross linked PEG
(c) PEG adsorbed PE
(b) Oxide PE
(a) Untreated PE
Abs
orba
nce
(AU
)
Wave number / cm-1
Fig. 40 ATR-FTIR spectra of PE surfaces of a Untreated PE, b Oxide PE, c PEG adsorbed PE, and d cross-linked PEG PE

1 3
Reviews of Modern Plasma Physics (2021) 5:3 Page 47 of 65 3
4.8.2 Experimental
(1) Plasma treatment Figure 43 is a schematic representation of the system we used for the plasma
polymer deposition. In the figure, double helix Cu electrodes are attached on the inside of the glass tubing. The sample PVC tubing is inserted in to the glass tubing. The mixture gas of monomer/He is introduced in the sample tubing. One side of the double helix Cu electrode is connected to the high voltage and the
Fig. 41 Schematics of Capillary Raise Method
Liquid
l: raising height
r
Powder
Fig. 42 Square of l as a function of raising time
0
2
4
6
8
10
12
14
16
0 500 1000
l2 / 1
04 m2
Time / sec
Oxide PE
Cross linked PEG PE
PEG adsorbed PE
PE

Reviews of Modern Plasma Physics (2021) 5:3
1 3
3 Page 48 of 65
other side was connected to the ground. APGD between the electrodes will be immediately appeared in the sample tubing by turn on the high voltage power source. If we use the wind-up system of the tubing at the end side of the tube, we could apply for longer tubing treatment. We used 5 kV, 20 kHz power source to have the APGD for PVC tubing.
The helium carrier gas and the monomer-tetrafluoroethylene (TFE) or hex-afluoropropylene (HFP) pass through flow meters before being introduced into the mixing chamber, and then flow directly at atmospheric pressure into the PVC tubing, thereby APGD is limited in the inner surface of the PVC tubing. The standard conditions of treatment used to deposit the fluorocarbon layer are: the voltage was 5 kV and the frequency 20 kHz unless otherwise indicated. The frequency range is hugely different from that of the low-pressure plasma which is in the order of MHz (RF). The tubular discharge needs pair coil type electrodes. In the case, high frequency radio-wave cannot penetrate in to the pair coil elec-trodes because of the induction of itself. In the point of view of the convenient system, tube treatment system in APGD should be much better than that of used in the low-pressure discharge.
(2) Materials The monomer gases used, TFE and HFP, were obtained from PCR Inc.
(Gainesville, FL). Both molecules have a double bond between two carbons. Their chemical compositions are C2F4 and C3F6, respectively. Commercially available soft PVC tubes having internal diameter 6.5 mm and outer diameter 8.4 mm were used as received.
(3) Surface analysis techniques X-ray Photoelectron Spectroscopy (XPS) analyses were performed within a
few days after plasma treatment with an ESCALAB 220i-XL XPS (VG instru-ments), using aluminum Kα monochromatized X-ray source. The binding energy shift from the surface charging of the polymers was compensated with an elec-tron flood gun set at 4 eV. The compositions of the surface were determined, in terms of chemical functionalities, with a Janssen Micro FT/IR-200 with ATR attachment (JASCO Corporation, Tokyo, Japan). The contact angles were meas-
Gas outlet
Sample tube (PVC)
Earth sideelectrode
Spiral type electrodes Glass tube
He and Monomer(Gas inlet)
High voltage sideelectrode
Power supply
<Sectional view> <Side view>
Fig. 43 APGD treatment system for inner tube coating. A part of the figure shows cross sectional view

1 3
Reviews of Modern Plasma Physics (2021) 5:3 Page 49 of 65 3
ured by the sessile-drop technique. Briefly, a 2 μl droplet of redistilled water was placed onto the surface to be studied by a syringe with a micrometer driven plunger. The contact angles were then measured with a contact angle meter (FACE Contact Angle Meter, Kyowa Interface Science Co., Ltd, Tokyo, Japan). Contact angles were measured before and just after treatment on PVC tubes exposed to HFP/He or TFE/He APG plasmas for different treatment periods while all other parameters, flow rates, plasma frequency and plasma power were kept constant. Angles were averaged for 25 measurements (five essays at five different sites on a tube).
(4) Biocompatibility of the surface To demonstrate the surface biocompatibility, the brood adhesion test was done
using with fresh rabbit brood soaking of the treated surface. After brood soaking, the surface was analyzed by SEM observation.
4.8.3 Results and discussion
The change in contact angle on treatment with HFP/He APGD is presented in Fig. 44 (He flow rate: 1000 sccm; HFP flow rate: 2 sccm). It is observed from this Fig. that a layer of hydrophobic polymer, i.e., fluoro-polymer, is deposited rapidly on the PVC surface. The contact angles increased significantly in the first 3 min of plasma treat-ment. As treatment continued, the thickness of the layer increased but the degree of hydrophobicity of the outer surface remained the same. The contact angle of untreated commercial PVC tube was 90° and after helium plasma (i.e., etching pro-cessing without monomer) it was decreased to 75°. The contact angles of the surface after APG plasma treatment were about 98°, not as high as pure polytetrafluoro-ethylene (PTFE, 115°). The contact angles after each experiment were constant along the tube or within the same section, indicating a homogeneous deposition. The results after TFE/He APGD also showed a similar trend (data not shown). The change in contact angles from 75°to about 98° in the absence and presence, respec-tively, of the fluorine containing monomers showed that the hydrophobic behavior of the plasma-treated PVC is entirely due to the fluorinated monomers. The Fourier transform infrared (FTIR) attenuated total internal reflection (ATR) spectra (FTIR-ATR) of untreated PVC tube (Fig. 45, lower) showed an absorbance peak at about 1720 cm−1 which is due to carbonyl groups (C = O) in additives, such as plasticizers present in the commercial PVC. The peaks due to C–Cl bonds occurred at about 650–700 cm−1. After both HFP/He (Fig. 45, upper) and TFE/He APG (Fig. 45, mid-dle) plasma treatments, the carbonyl peak due to plasticizers decreased significantly. Since the analysis depth of the FTIR-ATR is about 1 μm, the thickness of the depo-sition was assumed to be very close to this value. We also observed a very intense absorption at about 1200 cm−1 due to fluorine-containing functional groups. The FTIR-ATR spectrum of the treated PVC tube which had undergone TFE/He APG plasma treatment resembled that of the HFP/He APG plasma treated PVC tube. However, the main peak of the TFE/He APG treated PVC surface was at 1200 cm−1, while that of the HFP/He-treated PVC surface was at 1130 cm−1, indicating that the structures of fluorine-containing plasma-deposited polymers differ slightly from each other. As to the TFE/He APG plasma treated PVC, the main peak consisted of

Reviews of Modern Plasma Physics (2021) 5:3
1 3
3 Page 50 of 65
two different absorbance bands from CF2υasym and υsym modes. The separation of these two absorbance bands indicates a rather linear polymer (Mackie et al. 1997). We calculated the ratio of absorbance of peaks typical of polymer deposition (at about 1200 or 1130 cm−1) to that of the carbonyl peak (plasticizer) typical of the commercial PVC tube to study the degree of polymer deposition. Figure 46 shows the absorbance ratio of the PVC surface after HFP/He APG plasma treatment with
Fig. 44 Water contact angle as a function of treatment time. He: 1 slm; HFP: 2 sccm
Fig. 45 FTIR-ATR spectra of untreated and treated PVC. Upper spectrum: HEP/He APGD treated PVC; (He: 1 slm; HFP: 2 sccm; treatment time: 40 min. Intermediate spectrum: TFE/He APGD treated PVC; He: 600 sccm; TFE: 2 sccm; treatment time: 20 min. Lower spectrum: untreated PVC

1 3
Reviews of Modern Plasma Physics (2021) 5:3 Page 51 of 65 3
different HFP flow rates for treatment times, 20 and 40 min. All other plasma treat-ment parameters (voltage, frequency, He flow rate (1000 sccm)) were kept constant.
As the HFP flow rate was increased from 0 to 4 sccm, the deposition of fluoro-polymer was increased. However, as the percentage of HFP in the gas mixture was increased further, the fluoro-polymer deposition was decreased. At a flow rate of HFP greater than 6 sccm, the absorbance ratio was reduced to that of an untreated sample, i.e., there was hardly any deposition. When the monomer flow rate is very low, deposition is limited by the monomer supply (the so-called “monomer-deficient region” (Nomura et al. 1984)). Deposition behavior at high monomer flow rates is related with APGD stability; that is, a large HFP/He ratio decreases the stability and efficiency of the APGD, and thus decreases the number of active species capable of effecting the polymer deposition. PVC tube was subjected to HFP/He APG treat-ment for different time intervals between 20 and 60 min at optimum gas flow condi-tions (2 sccm of HFP with 1000 sccm of helium). The optimum gas flow rate and treatment time for polymer deposition with TFE/He-APGD (i.e., 2.5 sccm of TFE with 600 sccm of helium for 20 min) have been investigated and reported earlier (Tanaka et al. 2001).
XPS is widely used for the analysis of polymer surfaces and especially plasma-treated or plasma-deposited polymers. With this technique we can obtain informa-tion on the chemical content of the surface up to a few nanometer depths of the poly-mer. Wide scan spectra of XPS were used to determine to identify and to estimate the amount of the elements present on the surface, and the high-resolution spec-tra of XPS were used to reveal the element-bonding environment. The XPS wide scan untreated and treated PVC are presented in Fig. 47. The untreated PVC XPS spectrum Fig. 47c showed a C1s peak at about 285 eV. Cl peaks appear at 199 and 201 eV for Cl2p, and 272 eV for Cl2s. The weak intensity of the Cl peaks and the presence of the O1s peak at 532 eV confirm the presence of plasticizers and other additional products in commercial PVC. In the XPS spectra of PVC tubes sub-jected to HFP/He APGD treatment and TFE/He APGD treatment, an intense peak occurred at 688.8 eV, corresponding to F1s, with no trace of Cl peaks (Fig. 47a and b). The absence of Cl atoms at the surface of APGD- treated PVC is due to: (1) etch-ing of chlorine atoms (the XPS wide scan spectrum of the He only plasma treated-PVC shows a decreased intensity of the Cl peak; not shown); and (2) concealment by polymer deposition. The weak O1s peak which indicates the presence of a small amount of oxygen at the surface (about 3% of the atomic composition), is mainly due to post-plasma reactions between oxygen from the air and the freshly prepared and still-reactive surface.
Table 6 shows the F/C ratio and relative percentages of the chemical functional-ity groups which is measured by high-resolution XPS (Prat et al. 2000) in APGD-deposited polymers. After TFE/He APGD treatment, the main contribution to the C1s peak is from CF2 (57.1% of total carbons), as expected, but small contributions from CF and CF3 which arise from secondary reactions or to degradation of the newly deposited polymer, are also observed (18.6 and 11.3%, respectively, of total carbons). Nevertheless, these contributions (CF and CF3) remain weak, as does the C–CF contribution indicating a rather weakly crosslinked surface. This is in contrast

Reviews of Modern Plasma Physics (2021) 5:3
1 3
3 Page 52 of 65
HFP flow rate / sccm
Abs
orba
nce
ratio
(113
0cm
-1/1
720c
m-1
)
6
0
1
2
3
4
5
0 2 4 6 8 10
Fig. 46 FTIR-ATR absorbance ratio as a function of HFP flow rate. ♦: 40 min treatment; ■: 20 min treatment
Fig. 47 XPS wide-scan spectra of untreated and treated PVC. a TFE/He APG treated PVC; gas flows: 600/2 sccm; treatment time: 20 min; 4 kV; 20 kHz. b HFP/He APG treated PVC; gas flows: 600/2 sccm; treatment time: 20 min; 4 kV; 20 kHz. c Untreated PVC
Table 6 F/C ratio and relative percentages of the chemical functionality groups in APG plasma-depos-ited polymers
Monomer F/C –CF3 (%) –CF2 (%) –CF (%) C–CF (%) CH (%)
293.8 eV 291.7 eV 289.4 eV 287.0 eV 285.0 eVHFP 1.46 26.0 25.6 22.7 26.6 –TFE 1.70 11.3 57.1 18.6 13.0 –

1 3
Reviews of Modern Plasma Physics (2021) 5:3 Page 53 of 65 3
with fluorocarbons deposited by low-pressure plasma treatments which show a highly cross-linked surface.
Normally, the fluorocarbons deposited by low-pressure plasma treatments show a highly cross-linked surface. On the other hand, the ion bombardment, which enhances cross-linking in low pressure plasmas (Yasuda 1985), can be neglected in the APGD due to the decrease of ion velocity. From the reason, in the APGD, the weakly cross-linked surface will be mainly occupied. As with HFP/He APGD treat-ment, the PVC surface after TFE/He APGD is completely covered by the fluoropol-ymer (Kogoma et al. 1997) (i.e., hydrocarbons no longer contribute to the spectra), but chemical compositions and structure of the two deposited polymers are slightly different from each other. Although plasma treatment is an effective way of devel-oping surface-specific novel materials, the experimental conditions of conventional low-pressure glow discharge treatment limit the nature and size of the materials to be modified. Continuous treatment, uneven materials, selectivity of treatment area etc. are some of those limitations. Even though plasticized PVC is commonly used for biomedical purposes, the presence of plasticizers (mainly di-2-ethylhexyl phtha-late (DEHP)) is of much concern to the biological system. Hence, we attempted in this study to develop PVC supported biomaterials with fluoro-polymer surface coat-ing by the APGD treatment of monomers like HFP and TFE onto the inner surface of PVC tubes. The characteristics of fluoro-polymers obtained using APGD treat-ment were similar in nature to those of other fluoro-polymers obtained by radio fre-quency glow discharge in low pressure (Kiaei et al. 1992; Castner et al. 1997; Golub et al. 1996) as reported earlier.
Finally, we have tried to test the biocompatibility of the treated surface using the adhesibility of fresh rabbit brood PRP. Photo 3 show SEM photographs of plasma coated PVC inner surfaces soaked with the fresh rabbit brood PRP. In the photo-graphs, they are many adhesive platelets are found on the untreated PVC surface (a). On the other hand, on the TFE plasma treated surface (b), we have noting of adhe-sive platelets except of small amount of inactive one.
4.8.4 Conclusion
APG plasma treatment is a simple, inexpensive process that is useful in a wide vari-ety of applications including the coating of the inner surface of commercial flexible PVC tubes with a PTFE-like polymer formed from HFP or TFE gaseous monomer. The tube discharge system can treat exceptionally long tubes even longer than 100 m with simply winding the tube. Deposition by APGD is homogeneous and its thick-ness is about 1 μm. The deposited fluorinated polymer layer can suppress the bleed-ing of plasticizers which are present in commercial PVC tubes. Small structural var-iations between HFP-treated surfaces and TFE-treated surfaces were clear from XPS and FTIR/ATR results. APGD-TFE plasma treated PVC shows excellent biocompat-ibility for the adhesion of brood platelet on the surface. To elucidate the unique fea-tures of the APGD, we are currently studying the gas phase with mass spectrometry and optical emission spectroscopy. The APGD-derived fluoro-polymers were similar

Reviews of Modern Plasma Physics (2021) 5:3
1 3
3 Page 54 of 65
to the conventional low-pressure plasma fluoro-polymers in properties even though the APGD is moderate in energy characteristics.
4.9 Solid surface treatment using low‑temperature microwave remote plasma at atmospheric pressure (Kogoma et al. 2004)
4.9.1 Introduction
Microwaves are incredibly attractive power sources from the points of view of the system convenience and the cost of power to produce discharges at atmospheric pressure. However, the temperature in a microwave discharge in atmospheric pres-sure is finally going to several thousand degrees of K even use of rare gas, such as in high pressure induction coupled plasma (Reed 1961). That should be due to the GHz high frequency discharge. The high temperature plasma needs a thermal ionization mechanism to retain high electric conductivity. Otherwise, the plasma cannot gain a high enough current to heat the plasma itself. Owing to this reason, the microwave plasma is not useful for the surface treatment for soft materials, such as polymers or organic materials in the atmosphere. To overcome the plasma instability from the insufficient ionization rate in low-temperature condition in microwave plasma, we need some other way to maintain electric conductivity. The use of metal electrodes is one of the most convenient devices to exhaust thermal electrons from the surface in moderate temperature conditions. In this study, we used several kinds of metal electrodes, such as tungsten and tantalum which one inserts into the plasma zone to create stable plasma at moderate temperature. Solid surface treatment or ashing of organic contamination on the silicon wafer that is placed in the atmospheric ambi-ence was done in the after-glow plasma region.
4.9.2 Experimental
Figure 48 shows the schematics of the microwave discharge system in atmospheric pressure. The outer diameter of the quartz discharge tube is 15 mm. A discharge
Photo 3 SEM photographs of plasma coated PVC inner surfaces soaked with the fresh rabbit brood PRP. a untreated PVC surface, b TFE plasma treated surface

1 3
Reviews of Modern Plasma Physics (2021) 5:3 Page 55 of 65 3
tube is inserted in the center of the wave-guide type cavity. The end of the discharge tube which is made by quarts glass is taper-shaped to make rectangular slit nozzle (2 mm × 13 mm). We used a 1 kW, 2.45 GHz magnetron generator for the discharge power source. Pulse width modulation (PWM) of the anode current of magnetron tube is applied to control the discharge power.
Nitrogen (commercial grade and five-nine pure grades) is used for carrier gas and small amount of oxygen is introduced to produce active species for oxidation of organic impurities on the silicon substrate. A metal rod electrode (2 mmϕ, 20 mm-long) is inserted into the discharge tube to start and to maintain the discharge during the experiment. We tested several kinds of metals, such as W, Mo, Zr, Ta, Si, and 20% Th-containing W, for the electrodes. In the metals, because they need to have higher melting temperatures (− 3000 °C) and are protective against attacks of active nitrogen or oxygen atoms, only W and Ta are available for the microwave discharge as the electrodes. The flow gas is cooled by the water jacket surrounding the tube at the downstream position of the discharge part. The substrate is set in the atmosphere and is exposed to blown gas that exhausted from the nozzle; then one measures the thickness using the surface roughness meter (Dektak 3, Sloan Co. LTD).
The treated surfaces were analyzed using XPS (ULVAC-Phi, ESCA 5800ci). The temperatures of blown gas and substrate surface are measured using a thermo-couple. Photoemission from the discharge zone is measured using an optical fiber multi-spectrometer (Solar Co. LTD, type TII). Spin-coated OFPR-800 (photo-resist, 1200 nm thick) on a silicon wafer is used as model organic contamination to meas-ure the ashing rate. Experimental conditions are shown in Table 7.
Fig. 48 Cross sectional view of microwave discharge system for surface cleaning of silicon wafer
N2O2
MWGenerator
Wave-guide cavity
Sample
Quartz tube
2 - 20 mm
200
mm
Metal rod electrode
Water
Silicon wafer

Reviews of Modern Plasma Physics (2021) 5:3
1 3
3 Page 56 of 65
4.9.3 Results and discussion
When the power was introduced to the system, the discharge immediately started with strong light emission and noisy sound. Figure 49 shows the blown nitrogen gas temperature vs. distance from the edge as a function of discharge power in 15 slm of flow rate. The gas temperature increases with increasing of the discharge power. The maximum temperature at 600 W is lower than 180 °C even at 2 mm as the shortest distance in the experimental conditions. We attained a relatively low-tem-perature plasma gas flow with this system. The blown gas temperature decreases with increasing of the distance from the edge or transit time, this is caused by gas diffusing to the surrounding and mixing with air in atmosphere. Figure 50 shows the ashing rates vs. discharge power in 15 slm of nitrogen gas flow at the position 2 mm from the edge. In the figures, the ashing rates increase with increasing of discharge power. The ashing rates are at least about 300 nm·min−1 at 600 W. The ashing rate in this system is almost the same rate related to that of the low-pressure oxygen plasma (Fujimura et al. 1991).
Figure 51 shows the ashing rates vs nitrogen gas flow rate or transit time to the substrate as a function of discharge power. The half -life of the active flow is about 0.2 ms in air ambience. The decreasing of the flow rate slower than 7.8 slm in 600 W, it raises discharge instability and causes rapid dispersion in the air ambience.
Figure 52 shows the ashing rates vs. distance (d/mm) from the substrate to the tube edge at the power of 500 W with using commercial grade nitrogen. In the figure, the ashing rates show almost no change between 2 and 6 mm and decrease with further increasing of the distance. The main reason of decreasing for distances longer than 6 mm will be the diffusion of after-glow flow in to the air. On the other hand, in case of He after-glow in the atmospheric pressure ambience, the ashing rates are rapidly decreased with increasing of transit time; the decrease is about 4–5 orders of magnitude with increasing of the transit distance from 2 to 6 mm (Tanaka and Kogoma 2001). In this regard, the life time of the active species should be very long in nitrogen after-glow. The difference of the life time of active species in the after-glow flow between nitrogen and He will be attributed to the difference of the molecular weight.
From the point of the view of oxidation of organic impurities, a question will arise about what is the active agent in the discharged nitrogen is. In the case of the commercial grade nitrogen, a trace amount of oxygen molecule will be mixed in the system. To resolve the question, we tried to measure the ashing rates in three differ-ent concentrations of oxygen mixed in pure nitrogen. Figure 53 shows the ashing
Table 7 Experimental conditions Discharge power 200–600 W
Nitrogen flow rates 5–16 slmDistance from the plasma center to the edge of tube 200 mmDistance from the edge of gas nozzle to substrate 2—20 mmDischarge time 1—5 min

1 3
Reviews of Modern Plasma Physics (2021) 5:3 Page 57 of 65 3
Fig. 49 Temperatures of the flowing gas vs distance from edge to the sample as a function of discharge power
0
20
40
60
80
100
120
140
160
180
200
0 5 10 15 20
600 W500 W400 W300 W200 W
Tem
pera
ture
/
Distance / mm
Fig. 50 Ashing rates vs discharge power at 15 slm commercial grade nitrogen gas flow rate
0
200
400
600
800
1000
0 500 1000
Ash
ing
rate
/ nm
min
-1
Power / W

Reviews of Modern Plasma Physics (2021) 5:3
1 3
3 Page 58 of 65
Fig. 51 Ashing rates vs transit time or flow rate with different discharge power using commer-cial grade N2
0
50
100
150
200
250
0 0.2 0.4 0.6 0.8
Ash
ing
rate
/ nm
min
-1
Transit time / msec
Flow rate / slm3.95.215.6 7.8
600 W
400 W
Fig. 52 Ashing rates vs distance from edge to the substrate using commercial grade N2
0
50
100
150
200
250
0 4 8 12
Ash
ing
rate
/ nm
min
-1
Distance, d / mm

1 3
Reviews of Modern Plasma Physics (2021) 5:3 Page 59 of 65 3
rates vs. discharge power for different oxygen concentration in nitrogen. We used pure nitrogen (5-nine grade), commercial grade (about lower than 100 ppm of oxy-gen impurity) and 1300 ppm of oxygen mixture. Even in different concentrations of oxygen mixed in nitrogen, the ashing rates are not so much affected. It seems as if the nitrogen active species only works in the oxidation kinetics on the substrate. On the other hand, as shown in Fig. 54, in the ashing rate vs. oxygen concentration in pure nitrogen, we can find a sharp increasing attained at around of 130 ppm oxygen concentration. From both figures, it seems that the active species in oxygen-mixed nitrogen are not only active nitrogen (S), such as meta-stable molecules (nitrogen atoms do not have high enough activities to the organic reactant) but also oxygen atoms.
Figure 55a shows the photo emission spectra of 130 ppm oxygen-mixed nitro-gen discharge in 500 W of the power. We can find nitrogen 1st positive band (503.0–750.3 nm), 2nd positive band (281.4–497.6 nm) and small peak of oxygen atom emission at 502 nm. Figure 55b) shows the spectra between 200 and 350 nm region with three different oxygen concentrations. In the 1300 ppm oxygen mixed nitrogen, NO γ system was found in region from 231 to 290 nm. In general, NO γ system will due to the reaction (14):
Fig. 53 Ashing rates vs dis-charge power as a function of oxygen concentration. ♦: com-mercial grade N2, □: pure N2, △: 1300 ppm O2 in N2
0
50
100
150
200
250
300
350
0 200 400 600 800
Ash
ing
rate
/ nm
min
-1
Power / W

Reviews of Modern Plasma Physics (2021) 5:3
1 3
3 Page 60 of 65
The fact confirms that the meta-stable molecules exist in the nitrogen discharge. However, the NO γ system disappears in concentrations lower than 130 ppm of oxy-gen. This disappearance should be attributed to the lack of NO concentration in the discharge zone. Ashing reaction on the treated surface should be mainly attributed to the oxidation by oxygen atoms. Figure 56 shows the intensity ratios between nitro-gen emissions (388 nm) to oxygen atom emission (502 nm) as a function of oxy-gen concentration. Because Figs. 54 and 56 show very analogous configurations, the oxygen atom should be an important etching specie in relatively low concentration
(11)N2 + e− → N2(A3Σu) + e−
(12)→ 2N + e−
(13)N + O2 → NO + O
(14)NO + N2(A3Σu) → NO + N2 + h�(NO � system)
(15)N2(A3Σu) + O2 → N2 + 2O
Fig. 54 Ashing rates vs concen-tration of oxygen in nitrogen. Input power and flow rate are 500 W and 15 slm, respectively
0
100
200
300
400
500
600
700
0 1000 2000
Ash
ing
rate
/ nm
min
-1
Concentration of O2 in N2 / ppm

1 3
Reviews of Modern Plasma Physics (2021) 5:3 Page 61 of 65 3
oxygen mixtures. When we increase the oxygen concentration at least higher than 130 ppm, oxygen atoms will be consumed by increasing of the NO chain reactions that consume O atoms in Eqs. (16) and (17):
0
200
400
600
800
1000
1200
200 300 400 500 600 700 800 900 1000Wave length / nm
Inte
nsity
(a.u
.)
(a)
200 250 300 350Wave length / nm
Inte
nsity
(a.u
.)
(b)
1300ppm
130ppm
Pure N2
NO γ
Fig. 55 a Photoemission spectra of 130 ppm O2-mixed nitrogen discharge. b Photoemission spectra of 1300 ppm, 130 ppm O2-mixed nitrogen and pure nitrogen discharge

Reviews of Modern Plasma Physics (2021) 5:3
1 3
3 Page 62 of 65
Treated sample surface was analyzed by XPS to estimate the erosion of metal electrode which will be deposited on the treated surface. In the case of the com-mercial grade N2 as for carrier gas, trace amount of tungsten oxide was found on the treated sample surface because small amount of O2 that was mixed in the N2 as the impurity, eroded the electrode. On the other hand, nothing of tungsten oxide was found on the treated surface with using pure N2.
4.9.4 Conclusions
We succeeded in producing a low-temperature remote plasma system using micro-wave discharge and atmospheric pressure nitrogen flow. Relatively high ashing rates of about 600 nm·min−1 for organic contamination were attained in the system. We assumed that the main active species for ashing reaction should be oxygen atoms in the oxygen mixed nitrogen flow. Nitrogen is a very promising material as a car-rier gas for ashing or cleaning of the surfaces at atmospheric pressure without of
(16)NO + O → NO2
(17)NO2 + O → NO + O2
Fig. 56 Photoemission intensity ratios of oxygen atom (502 nm) and nitrogen (380 nm) vs con-centration of oxygen in nitrogen. Input power and flow rate are 500 W and 15 slm, respectively
0
0.02
0.04
0.06
0.08
0.1
0.12
0.14
0.16
0 1000 2000 3000Concentration of O2 in N2 / ppm
Inte
nsity
ratio
(O/N
2)

1 3
Reviews of Modern Plasma Physics (2021) 5:3 Page 63 of 65 3
electrode erosion, because the gas cost is much cheaper than that of He (1/20) or Ar (1/10).
5 General conclusion
Applicable frequency for generating the APGD ranges from several kHz to higher than hundred MHz. It should be noted that the gas temperature during the treatment generally increases as the frequency increases. In the atmospheric pressure low-temperature discharge, a pulse modulated discharge will be recommended to drive down the gas temperature. It will be important to control the plasma density and the increasing of the gas temperature, for instance, by adding on–off pulse modulated signals on a simple continuous sinusoidal wave of high voltage. Films can be treated by placing them on the electrode using parallel type or at the after-glow region in the remote type. However, several types of treatments have been developed to fulfill the requirements for treating substrates of different shapes (e.g., tube, continuous film, small sphere, powder, printed circuit board, fiber, etc.).
Open Access This article is licensed under a Creative Commons Attribution 4.0 International License, which permits use, sharing, adaptation, distribution and reproduction in any medium or format, as long as you give appropriate credit to the original author(s) and the source, provide a link to the Creative Com-mons licence, and indicate if changes were made. The images or other third party material in this article are included in the article’s Creative Commons licence, unless indicated otherwise in a credit line to the material. If material is not included in the article’s Creative Commons licence and your intended use is not permitted by statutory regulation or exceeds the permitted use, you will need to obtain permission directly from the copyright holder. To view a copy of this licence, visit http:// creat iveco mmons. org/ licen ses/ by/4. 0/.
References
N.A. Alcantara, E.S.J.N. AydilIsraelachvil, J Biomed Mater Res 51, 343 (2000)M. Anand, R.E. Cohen, R.F. Baddour, Polymer 22, 361 (1981)Y. Babukutty, R. Prat, K. Endo, M. Kogoma, S. Okazaki, M. Kodama, Langmuir 15, 7055 (1999)J.P. Badey, E. Espuche, Y. Jugnet, B. Chabert, T.M. Duc, Int J Adhesi Adhesive 16, 173 (1996)F.W. Breitbarth, E. Ducke, H.J. Tiller, Plasma Chem Plasma Process 10(3), 377 (1990)D.G. Castner, in Plasma processing polymers. ed. by R. d’Agostino, P. Favia, F. Fracassi (Springer, Neth-
erlands, London, 1997), pp. 221–230A. Chitoki, D.G. Castner, B.D. Ratner, D. Briggs, J Vac Sci Technol A 8(3), 2274–2282 (1990)D.T. Clark, W.J. Feast, D. Kilcast, W.K.R. Musgrave, J Polym Sci 11, 389 (1973)R. d’Agostino, Plasma Deposition, Treatment, and Etching of Polymers (Academic Press, San Diego, CA,
1990).J. Delhalle, J.M. Andre, S. Delhalle, J.J. Pireaux, R. Caudano, J.J. Verbist, J Chem Phys 60, 595 (1974)Y. Dobashi, M. Kogoma, A. Manabe, K. Tanaka, 24th Symp (Plasma Sci, Mater, 2011).R. Foerch, G. Beamson, D. Briggs, Surf Interface Anal 17, 842 (1991)S. Fujimura, K. Shinagawa, M.T. Suzuki, M. Nakamura, J Vac Sci Technol B 9, 357 (1991)U. Gelius, P.F. Heden, J. Hedman, B.J. Lindberg, R. Manne, R. Nordberg, C. Nordling, K. Siegbahn,
Phys Scr 2, 70 (1970)M.A. Golub, T. Wydeven, L.S. Finney, Plasma Polym 1(2), 173 (1996)W.R. Gombotz, W. Guaghui, T.A.A.S. HorbettHoffman, J Biomed Mater Res 25, 1547 (1991)

Reviews of Modern Plasma Physics (2021) 5:3
1 3
3 Page 64 of 65
H.J. Griesser, R.C. Chatelier, T.R. Gengenbach, G. Johnson, J.G. Steele, J Biomater Sci Polym Ed 5, 531 (1994)
T. Hirotsu, S. Ohnishi, J Adhesion 11, 57 (1980)S. Kanazawa, M. Kogoma, T. Moriwaki, S. Okazaki, Proc 8th Int Symp Plasma Chem 3, 1839–1844
(1987)W. Karmann, A.B. Kummer, Adhesive tapes, in Adhesives and adhesive tapes. ed. by G. Gierenz, W.
Karmann (WILEY-VCH, Weinheim, 2001), p. 97D. Kiaei, A.S. Hoffman, T.A. Horbett, J Biomater Sci Polym ED 4, 35 (1992)M. Kogoma, F. Tochikubo et al., Generation and Applications of Atmospheric Pressure Plasmas (Nova
Science Publishers Inc, 2011)M. Kogoma, K. Tanaka, Proc. 9th Int. Symp. High Pressure Low Temp. Plasma Chem. (2004)M. Kogoma, K. Tuji, K. Tanaka, Proc. 11th Inter. Symp. High Press. Low Temp. Plasma Chem., 460–463
(2008)M. Kogoma, K. Tsuji, K. Tanaka, J. Photopolymer Sci Tech 23(4), 575–578 (2010)M. Kogoma, K. Furuse, K. Takahashi, K. Tanaka, Proc. 9th Asia-Pacific Inter. Symp. Basics Appl.
Plasma Tech. (2015)Some unpublished data were presented in this program: T. Kosugi, S. Okazaki, H. Jinno, M. Kogoma,
Proc. 5th Jpn. Symp. Plasma Chem., 5, 77 (1992)D.R. Lide (ed.), Handbook of Chemistry and Physics, 81st edn. (CRC Press, USA, 2000)M. Kogoma, R. Prat, T. Suwa, A. Takeda, S. Okazaki, T. Inomata, NATO Advanced Study Institute Pro-
gram: Plasma Processing of Polymers, NATO ASI Series (Kluwer, Dordrecht, 1997), pp. 379–393N.M. Mackie, E.R. Fisher, Polym. Prepr. (Am. Chem. Soc. Div. Polym. Chem.) 38, 1059 (1997)R.H. Mann, J.T. Tse, Proc. 21st Annual Meeting Adhesion Soc., 360 (1998)F. Massines, G. Gouda, N. Gherardi, E.Croquesel, Proc. 7th Int. Symp. High Pressure Low Temp. Plasma
Chem., (2000)Y. Masutani, N. Nagai, S. Fujita, M. Hayashi, M. Kogoma, K. Tanaka, Plasma Process Polym 4, 41–47
(2007)M.M. Millard, J.J. Windle, A.E. Pavlath, J Appl Polym Sci 17, 2501 (1973)T. Mori, K. Tanaka, T. Inomata, A. Takeda, M. Kogoma, Thin Solid Films 89, 316 (1998)A. Nagata, S. Takehiro, H. Sumi, M. Kogoma, S. Okazaki, Y. Horiike, Proc Jpn Symp Plasma Chem 2,
109–112 (1989)T. Nakajima, K. Tanaka, T. Inomata, M. Kogoma, Thin Solid Films 386, 208 (2001)Y. Nakayama, T. Takahagi, F. Soeda, K. Hatada, J. Suzuki, A. Ishitani, J Polym Sci Part A Polym Chem
26, 559–572 (1988)H. Nomura, P.W. Kramer, H. Yasuda, Thin Solid Films 118, 187 (1984)E. Occhiello, M. Morra, G. Morini, F. Garbassi, P. Humphrey, J Appl Polym Sci 42, 551 (1991)S. Ogawa, K. Kiuchi, K. Tanaka, M. Kogoma, Proc. 18th Symp. Plasma Process., 449 (2001)R. Prat, T. Suwa, M. Kogoma, S. Okazaki, J. Adhesion 66, 163–182 (1998)R. Prat, Y.J. Koh, Y. Babukutty, M. Kogoma, S. Okazaki, M. Kodama, Polymer 41, 7355–7360 (2000)B.D. Ratner, J Biomater Sci Polym Ed 4(1), 3 (1992)T.B. Reed, J Appl Phys 32, 821 (1961)C.L. Rinsch, X. Chen, V. Panchalingam, R.C. Eberhart, J.H. Wang, R.B. Timmons, Langmuir 12, 2995–
3002 (1996)M.S. Sheu, A.S. Hoffman, J. Feijen, J Adh Sci B 4, 995 (1992)I. Sutherland, E. Sheng, D.M. Brewis, R.J. Heath, J Mat Chem 4(5), 683–687 (1994)T. Suwa, S. Okazaki, T. Inomata, M. Kogoma, Proc. 13th Symp. Plasma Process., 283 (1996)M. Suzuki, A. Kishida, H. Iwada, Y. Ikada, Macromolecules 19, 1804 (1986)K. Tanaka, M. Kogoma, Plasma and Polymers 6, 27–33 (2001)K. Tanaka, M. Kogoma, Plasmas Polym. 8, 199 (2003a)K. Tanaka, M. Kogoma, Inter J. Adhesion Adhesives 23(6), 515–519 (2003b)K. Tanaka, T. Inomata, M. Kogoma, Plasma Polym 4, 269–281 (1999)K. Tanaka, T. Inomata, M. Kogoma, Proc 7th Int Symp High Pressure Low Temp Plasma Chem 2, 422
(2000)K. Tanaka, T. Inomata, M. Kogoma, Thin Solid Films 386, 217 (2001)K. Tanaka, A. Manabe, M. Kogoma, Proc. 11th Inter. Symp. High Press. Low Temp. Plasma Chem., PDF
file (2008)F. Tochikubo, T. Chiba, T. Watanabe, Proc. 5th Int. Symp. High Pressure Low Temp. Plasma Chem.,
225–229 (1996)

1 3
Reviews of Modern Plasma Physics (2021) 5:3 Page 65 of 65 3
H. Wenfeng, H. Tei, K. Shimizu, T. Yajima, J Photopolymer Sci Tech 28(3), 479–483 (2015)T. Yagi, A.E. Pavlath, A.G. Pittmann, J Appl Polym Sci 27, 4019 (1982)H. Yasuda, Plasma Polymerisation (Academic Press, New York, 1985).T. Yokoyama, M. Kogoma, T. Moriwaki, S. Okazaki, J Phys D 23, 1125 (1990)T. Yokoyama, M. Kogoma, S. Kanazawa, T. Moriwaki, S. Okazaki, J Phys D 23, 374 (1990)
Publisher’s Note Springer Nature remains neutral with regard to jurisdictional claims in published maps and institutional affiliations.