low-speed wind-tunnel measurements of the lift, drag...
TRANSCRIPT

e~
Z
R. & M. No. 3744
: • ,[jr
P R O C U R E M E N T EXECUTIVE MINISTRY
AERONAUTICAL RESEARCH COUNCIL
REPORTS AND MEMORANDA
OF DEFENCE
Low-Speed Wind-Tunnel Measurements of the Lift, Drag and Pitching Moment of a Series of
Cropped Delta Wings
By D. A. KIRBY
Aerodynamics Dept., R.A.E., Farnborough
LONDON' HER MAJESTY'S STATIONERY OFFICE 1974
PRICE £1 .45 NET

Low-Speed Wind-Tunnel Measurements of the Lift, Drag and Pitching Moment of a Series of
Cropped Delta Wings By D. A. KIRBY
Aerodynamics Dept., R.A.E., Farnborough
f
Reports and Memoranda No. 3744* November, 1972
Summary
Measurements of lift, drag and pitching moment have been made on a series of cropped delta wings of aspect ratio 1.4, 1.2, 1.0 and 0-8 formed by successively cropping a delta-wing model of aspect ratio 1-6. These tests extended earlier work on sharp-edged slender wings of the same chordwise section and maximum thickness/ chord ratio, 4 per cent.
From the earlier tests empirical curves were derived for predicting the low-speed characteristics of slender wings at zero sideslip and the results of the tests on the cropped series are analysed and compared with these correlation curves. Certain differences are noted which are linked with the improved performance of a cropped delta compared with a pure delta planform of the same aspect ratio.
* Replaces R.A.E. Technical Report 72211--A.R.C. 34 598

LIST OF CONTENTS
1. Introduction
2. Details of Models and Tests
3. Calculation of Results
4. Nature of Flow and Scale Effect
5. Discussion and Analysis of Results
5.1. Lift and normal force
5.1.1. Lift
5.1.2. Normal force
5.2. Drag and axial force
5.3. Pitching moment and longitudinal stability
5.4. Linear and non-linear contributions to pitching moment
6. Comparison with Estimates from Data Sheets
7. Conclusions
List of Symbols
References
Appendix Formulae for Principal Geometric Parameters
Tables 1 to 12
Illustrations--Figs. 1 to 17
Detachable Abstract Cards

I. Introduction
The investigation of the effect of planform shape on the subsonic longitudinal characteristics of slender wings reported in Ref. 1 included several planforms with streamwise tips but, since the leading-edges of these plan- forms were defined entirely by equations of the form y = Ax + Bx" + Cx", the streamwise direction of the leading-edge was attained only at the full span. The analysis made in Ref. 1 showed that correlation curves could be derived from which the lift, drag and pitching moment of slender planforms with a smooth leading- edge development could be predicted for a wide range of planform type. There are, however, both manufacturing and structural advantages in avoiding thin curved or triangular tip shapes and for an aircraft design some cropping of the planform often occurs. Many further variations in planform shape can thus be obtained-- whole families of new shapes can be derived from each basic curved or delta planform and a comprehensive investigation of the effects of cropping is not feasible.
In the work presented in this Report, which was done in 1967 but has hitherto not been reported, only a brief exploration of the effects of cropping a planform was attempted. To find if any aerodynamic advantages accrued from large streamwise edges, a model with a pure delta planform of aspect ratio 1.6 was progressively cropped to give a series of models of lower aspect ratio, and the results of low-speed tunnel tests compared with those of Ref. 1 to see whether any use can be made of the correlation curves, there derived, to predict the characteristics of cropped planforms.
Details of the models and the experimental procedure are described in Section 2 and of the calculation of results in Section 3. In Section 4 the nature of the flow and the possibility of scale effect are briefly discussed but the main discugsion and analysis of the results are in Section 5 where the reasons for the improved perfor- mance of cropped delta wings compared with pure delta wings of the same aspect ratio and thickness distribution are established. Comparisons with estimates from the Engineering Sciences Data Sheets 2 on slender wings and suggestions for adapting them to cropped planforms are made in Section 6.
2. Details of Models and Tests
The basic model was a sharp-edged symmetrical wing of aspect ratio 1.6 and maximum thickness/chord ratio of 4 per cent. The form of the thickness distribution, defined in Table 1, was identical with that used in Ref. 1 and the wing thus provided an extension to the range of delta planforms previously tested. This model was made of laminated teak and a series of models was generated by progressively cropping the planform in a streamwise direction as shown in Fig. 1. The algebraic relationships between the various geometric parameters used to define the planforms of slender wings are summarised in the Appendix for this cropped series. The values of the parameters are given in Table 1.
Since the cropping was done by straightforward saw cuts the new wings were formed with thick square-cut tips whereas all the edges on the original wing were sharp. In order to investigate the effect of sharpening the streamwise tips the tests on two of the wings, those of aspect ratio 1.2 and 0.8, were repeated with all their edges sharp. The sharpening of the tips was achieved by paring them to have the same section at right angles to the edge as had the swept leading-edges ; and the two further models thus created are referred to as wings with bevelled tips throughout the Report. By definition, the original model of aspect ratio 1-6 is a member of both the square-cut and bevelled series.
For the force and moment measurements the models were supported by the normal wire rig of the 4 ft x 3 fl wind-tunnel overhead balance and the measurements were made over a range of incidence from c~ = - 5 to 26 degrees at a wind-tunnel speed of 60.7 m/s, which corresponded to a Reynolds number of 2-23 × 106 based on the centreline chord of 0.53 m. For the original model only, the tests were extended to c~ = 41 degrees but safety considerations necessitated a reduction in tunnel speed to 30 m/s. This lower speed was also used when- ever the models were mounted on a sting support for flow visualization tests. Transition was left free throughout the tests but some evidence of scale effect was noted in the results of the tests on the A = 1.6 model--see Section 4.
3. Calculation of Results
In non-dimensionalising the results the true plan area and the centreline chord were used for each wing. Although the models were nominally symmetrical the small distortions inevitable with wooden models gave rise to small asymmetries, such that for most of the wings a finite lift and pitching moment were apparent at nominal zero incidence. Corrections for these distortions were made to the angle of incidence and pitching moment coefficient. The largest value of JAil was 0.12 degree and the largest value of [AfmJ was 0-0006, but for most of the models IAc~l was less than 0-05 degree and IACml was less than 0.0001.

The effects of tunnel constraint were allowed for by the methods recommended in Ref. 3. This meant that for the wing of aspect ratio 1.6 at high angles of incidence, substantial corrections were made to allow for the increased wake blockage when the flow over a wing has broken down. For slender wings with sharp edges, the flow is always separated at incidences other than the attachment incidence but the flow is a controlled one and the conditions which give rise to the necessity for using the Maskell wake blockage correction are not attained until vortex breakdown occurs (see Ref. 4 for a description of this phenomenon). The importance of this extra correction is not always appreciated, so in Fig. 2 curves of the lift and pitching moment coefficient of the A = 1.6 wing, both with and without the correction applied, are plotted as an example.
At the highest incidence the correction amounts to 11 per cent but the coefficients below a = 27 degrees are not affected and no extra wake blockage correction was needed for the other wings.
The fully corrected coefficients for all the models tested are tabulated in Tables 2 and 3. Pitching-moment coefficients are expressed about the moment centre of 0.58c o already used for delta wings in Refs. 1 and 5.
In studies of the influence of the various factors which govern the forces on a slender wing, it is more con- venient, from both theoretical and experimental standpoints, to consider the flow relative to body rather than wind axes. The corrected lift and drag coefficients were therefore used to calculate the normal force coefficient
and the axial coefficient
CN = CLCOS~ + C o sin
CA = - - C L s i n ~ + C o c o s
and these coefficients are also included in Tables 2 and 3.
4. Nature of Flow and Scale Effect
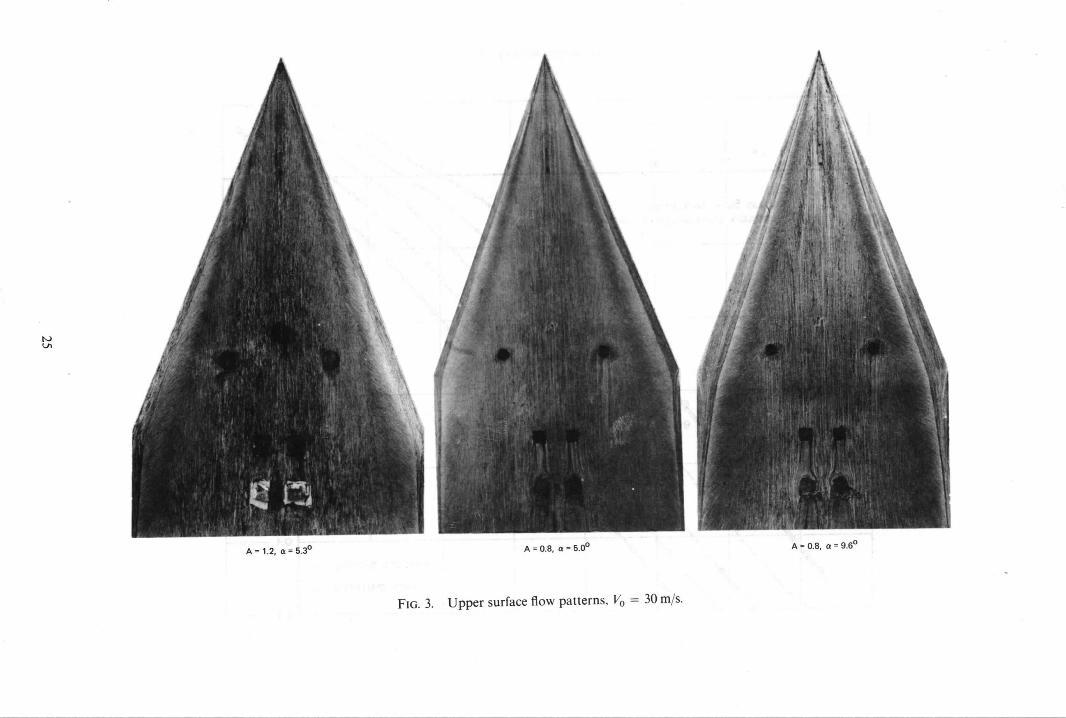
As is usual with symmetrical sharp-edged slender wings the flow separated from the leading-edges at angles of incidence other than zero and formed thin vortex sheets which rolled up above the upper surface of the wings for positive incidences. It was noticeable from surface-flow observations, made using a suspension of lampblack in kerosene, that the continuity of the rolled-up vortices was maintained over the whole length of the cropped wings despite the abrupt change in direction of the leading-edge cum tip from which the flow separated, see
Fig. 3. Also the change in tip shape from the square-cut to the bevelled tips on the wings of aspect ratio 1.2 and 0.8 caused only minute differences in surface flow pattern.
Because the flow visualisation experiments were made at 30 m/s the proportion of wing over which the secondary separation took a laminar rather than a turbulent form (see Fig. 4 of Ref. 1 for a good example of the difl'erence in surface flow pattern) was greater than it would have been at 60.7 m/s, the tunnel speed for the balance measurements. The impact of such differences in secondary-separation behaviour is slight and usually there is no effect at all on the lift coefficient, as is shown by Fig. 2 of this Report; but, there is often some scale effect on the pitching-moment coefficient which is naturally more sensitive to any changes in fore and aft loading. In Fig. 2 there is a difference in pitching-moment coefficient for the two tunnel speeds which is of a similar form to that obtained on the ogee wings in Ref. l, where it was demonstrated that roughness applied to the upper surface near the nose could influence the pitching moment. For the present series of tests at a tunnel speed of 60.7 m/s only the uncropped wing exhibited a step in the pitching-moment curve below e = 26 degrees (Fig. 15) and the transition-free conditions are considered to provide a fair basis for comparing the characteristics of the cropped wings with those of other shapes and higher Reynolds numbers.
Fig. 2 shows the effect of another phenomenon viz vortex breakdown, which can complicate the analysis of force and moment data on slender wings. Marked kinks in the lift and pitching-moment development with incidence, followed shortly afterwards by the occurrence of maximum lift, are observed as the point of break- down of the vortices from their tightly coiled state moves over the wing. Fortunately, for the leading-edge sweepback and aspect ratios under discussion, this happens at angles of incidence beyond the practical range.
5. Discussion and Analysis of Results
5A. Lift and Normal Force
5.1.1. Lift. The variation of lift coefficient with angle of incidence is shown in Fig. 4 for all the shapes tested. Sharpening the tips made negligible difference at an aspect ratio of 1-2 but at 0.8 the lift measured with the bevelled tips was about 1.5 per cent less than that measured with the square tips--between aspect ratios of 1.2 and 0.8 the tip chord/centreline chord ratio increased from 0.143 to 0-333. °

Comparison of the lift curves for the various aspect ratios ~hows that cropping the model from an aspect ratio of 1.6 to 1.2 had very little effect on the lift coefficient developed at the higher angles of incidence but with further cropping to A = 0.8 reductions in lift coefficient occurred at all angles of incidence. This effect of aspect ratio is demonstrated more clearly by Fig. 5 where the lift coefficients at s = 16 degrees for the series of cropped wings are compared with those for the ogee, delta and gothic planforms, all of t / c o = 0.04, tested previously in the 4 ft × 3 ft tunnel. 1 In Ref. 1 it was noted that there was no particular simple geometric parameter which would correlate the overall lift coefficient at a fixed angle of incidence for the whole range of planform shapes. The extent of this difficulty is highlighted by a series of the type discussed in this Report where successive cropping generates planforms with a wide variation of the principal parameters A, p and s /c o previously considered, see Figs. 5 and 6. If however only the delta and cropped delta planforms are studied a further parameter, namely, taper ratio can be utilised. In Fig. 7 the ratios of the lift coefficient of each cropped planform to the lift coefficient of the delta wing of either equivalent aspect ratio A, Fig. 7a, or slenderness ratio s /c o,
Fig. 7b, are plotted against taper ratio for specific incidences of 8, 12, 16, 20 and 24 degrees. Mean curves are drawn through the points and it is seen that there is slightly less variation with incidence and a much smoother curve when constant aspect ratio rather than constant slenderness ratio is used as a basis for comparison. This method is therefore suggested as a useful way of obtaining the lift of other cropped wings with leading-edge vortex flows.
The curves in Fig. 7a are drawn for wings with both types of tips on the basis of the present results which show that at the higher taper ratio the lift would be 1.5 per cent more when the tips are square than when they are bevelled.
5.1.2. N o r m a l f o r c e . For the planform study reported in Ref. 1 a clearer understanding of the influence of the various geometric parameters on the lifting force on slender wings was obtained when the normal force coefficient was resolved into a linear and a non-linear component. With this form of breakdown the linear term is associated with the attached flow round a wing assumed to occur in slender wing theory 6 and yields a lifting force which is directly proportional to the angle of incidence. The non-linear component is associated with the effects of the flow separation at the leading edges and is induced by the thin vortex sheets which spring from these edges and roll up above the wing.
This procedure is again used for the series of cropped models, the normal force coefficient being written as
C N = C ~ , . . . . . + C N . . . . ~i . . . . = a s + C N . . . . , . . . . .
and a(= d C N / d s at s = 0 degree) found by plotting CN/s against s and reading the intercept of the curve with the CN/s axis. Values of a determined in this manner are given in Fig. 8 and are compared with the values for the delta wings of Ref. 1 in Fig. 9. This shows that beyond the first change from A = 1.6 to A = 1.4 the further reduction of aspect ratio caused changes in a with aspect ratio at the same rate as that obtained for pure delta shapes.* The artifice employed in Ref. 1 of using a factor (= 1 + chord at 0.99 span/centreline chord) to modify the aspect ratio, and thus collapse the data for a whole range of planform shapes, is consequently less useful for cropped deltas since Co.99/c o varies too much through the aspect-ratio range, from 0.076 at A = 1.4 to 0.340 at A = 0.8 for the present series.
The non-linear component of the normal force coefficient ( = CN - as) associated with the separated flow field is plotted in the form (C~/s ) - a against angle of incidence in Fig. 8 and against aspect ratio for two particular incidences, s = 8 and 16 degrees in Fig. 10. These figures show for cropped wings a growth of the non-linear component with decreasing aspect ratio compared with the almost constant value of (CN/s) - a at constant incidence for pure deltas. In Ref. 1 a correlation between the non-linear components of the normal force was achieved by assuming that the coefficients would depend, as in first-order theory, on s / A and then introducing an empirical factor to allow for the influence of the trailing edge. Repeating this process for the present cropped wings shows that this type of analysis compensates for most of the increased non-linear component, Fig. 11. Bearing in mind the differences in the length and sweepback of the edges shedding the vortices and in the areas under the vortices for cropped and pure delta planforms of the same aspect ratio, it is unlikely that a better correlation can be achieved in the absence of a theory which allows adequately for both leading-edge separations and the effect of the trailing-edge.
An example of the complexity of the problem is provided by the contributions of the two normal force components to the changes in overall lift between pure and cropped delta wings discussed in Section 5.1.1. Thus Figs. 9 and 10 show that, whereas, at A = 0.8, s = 16 degrees over 70 per cent of the increase in lift is
* The small change in a when a delta is first cropped was confirmed by some calculations of lift curve slope made using Multhopp's lifting surface theory. 7

associated with the growth of the non-linear component, at A = 1.4, c~ = 16 degrees only 30 per cent of the increase is attributable to this cause.
5.2. Drag and Axial Force
As stated previously transition was left free for all the tests. Consequently a laminar drag bucket occurred in the Co vs. ~ relationship over the limited range of incidence near c~ = 0 where transition was far back on the wings. This affects the analysis of the drag at the higher angles of incidence appropriate to low-speed flight only insofar as the value of CDo used in determining the lift-dependent drag factor K = ~A/C2(CD - Co, ,) needs to be related to the transition conditions at the higher incidences. The values of CDo quoted in Table 3 used for calculating K have therefore been obtained by extrapolation of the drag coefficients at moderate angles of incidence.
For a 4 per cent thick wing alone at a lift coefficient appropriate to take-offand the initial climb, say, CL = 0.5, the lift-dependent drag amounts to over 90 per cent of the total wing drag so this is the component of drag most relevant to achieving good field performance. In Ref. 5 it was shown that the lift-dependent drag factor could be approximated as
7rA ( CDo -- CA) K = ~ - L tan~z C~ '
but for this series of cropped wings, since (CD, , - C A ) / C N varies only slightly with aspect ratio, the variation in the values of K/A for a given lift coefficient is determined almost entirely by the angles of incidence at which that lift coefficient is realized. CA and K are plotted for all the wings in Figs. 12 and 13 respectively and a breakdown of the various constituents of K at a lift coefficient of 0.5 is given in Table 4.
The inclusion of the aspect ratio in the standard definition of the lift-dependent drag factor makes it difficult to identify the effects of planform shape on the drag. These, including their variation with lift coefficient can be seen more directly if (C D - CDo)/C 2 is used as in Fig. 14. This figure shows that for a given wing span and area, i.e. aspect ratio, the cropped deltas tested had lower drags than any other shape over the whole of the range of lift coefficient normally used in low-speed operations, provided the cropped wing had a high value of the planform area parameter p. In general it can be inferred that provided the basic wing, whatever its shape, has a sufficiently high aspect ratio to allow cropped wings of high p to be formed, then lower values of lift dependent drag than those measured on pure deltas or other uncropped wings could be achieved.*
If only span and length are considered, i.e. slenderness ratio is held constant, the example at (S/Co) = 0-3, given in Table 5, shows that a cropped delta would still be a low-drag shape.
In this table the cropped delta is assumed to be one formed from an A = 1.6 delta and cropped wings with still lower values of (C o - CDo)/C 2 could be designed if other basic shapes were used but many other factors such as the cruise performance, longitudinal and lateral stability and control aspects would naturally influence the final choice of planform.
5.3. Pitching Moment and Longitudinal Stability
Pitching moment coefficients about a moment centre at 0.58%, that chosen for the delta wings of Ref. 1, are plotted against lift coefficient in Fig. 15. As expected, progressive cropping reduced the load in the trailing-edge region and caused an increasing nose-up tendency. The greater positive moment for the A = 0.8 wing with bevelled tips compared with that for the same wing with square tips is consistent with the lower lift coefficient of the wing with bevelled tips (Fig. 4) proving that the cha~lges in loading occur in the tip region.
For the aircraft designer the position of the aerodynamic centre ofa planform is of vital concern in determining the layout of the major components of the aircraft and in fixing the empty aircraft's centre of gravity and the permissible variation in cg position with various fuel loads and payloads. The aerodynamic-centre position has been calculated for all the models by measuring the slope dC,,/dCN at fixed values of lift coefficient and using the equation
dC . . . . . . . . . . . d ( c N A h . - Ax.I dCN - dC N C"°~c° - Co /
* Always assuming that in achieving high aspect ratio the leading-edge sweep has not been reduced to such an extent that vortex breakdown is occurring within the working range of lift coefficient.

where Ah n is the distance of the aerodynamic centre ahead of the centre of area, which is itself Ax~ behind the moment centre at 0.58%.
The results of the calculations of Ah, are tabulated in Table 6 and plotted in Fig. 16. For the delta wing of aspect ratio 1.6 the results show the same trend as for the delta planforms of 4 per cent
thickness/chord ratio previously tested--the aerodynamic centre moving forward steadily as angle of incidence is increased. But for the cropped wings the movement was first rearward and then forward with increasing incidence, a behaviour similar to that found for the near gothic wings in Ref. 1. The reasons for these variations are discussed in Section 5.4. The results of a check of the efficacy of the correlation curves of Ref. l, Fig. 28a in giving a direct forecast of the aerodynamic-centre positions for the cropped wings are summarised in Table 7, using lift coefficients of 0.1 and 0.5 as examples. The values of Ahn/c o measured for the delta of A = 1.6 were used to extend the correction for slenderness ratio deduced in Ref. 1 to the higher values of s/c o of the present tests.
The discrepancy between estimated and measured values of up to Ah,/c o = 0.012 is rather larger than the level of the scatter of the data used in Ref. 1 and the change with lift coefficient is also different, so there are evidently some differences compared with uncropped wings of the separate effects of the linear and non-linear contribution to pitching moment. These effects are discussed in the following section.
5.4. Linear and Non-Linear Contributions to Pitching Moment
The variation of the pitching-moment coefficient with angle of incidence on a slender wing is controlled by the relative values and points of action of the linear and non-linear contributions to the normal force. Thus the pitching-moment coefficient about a moment centre at 0.58Co can be expressed as :
c ossco cNnar(058 xa .... / hnoolinear • 1 - - + + CN .. . . . . . . . . 0 "58 - -Xa+ " Co Co / Co Co !
where x, is the distance of the centre of plan area aft of the wing apex and Ah~i .. . . (= AhL) and Ahnon.li . . . . (= AhNL) are the distances of the points of action of the linear and non-linear force components ahead of the centre of area.
AhL/C o is given by the limiting value of C,,/C N at c~ = 0 degree and by definition is the aerodynamic-centre position at zero incidence. In Ref. 1 it was found that for a given slenderness ratio the values of AhL/c o for a whole range of planform types with sharp-edges could be linearly correlated by the planform-area parameter p. Using this empirical relationship to estimate AhL/c o for the cropped wings gives the values shown in Table 8.
By using the measured values ofAhL/c o and the values of the linear and non-linear components of the normal force coefficient deduced in the normal force analysis, the distance of the position of action of the non-linear normal force ahead of the centre of area, AhNL/Co, can be calculated. The values of AhNL/c o so obtained at 4 degree intervals of incidence are plotted against angle of incidence in Fig. 17. Also shown on the graphs are the points of action of the linear component.
This set of curves demonstrates the reasons for the different forms of the pitching-moment curves plotted in Fig. 15 which in turn represents a cross-section of the various types of curves found in the whole slender wing range. Thus for the pure delta of A = 1-6 (with the possible exception of a limited range of incidence near ~ = 0 degree where the non-linear force is so small that its effect is negligible) the non-linear force acts ahead of the linear and the pitching-moment curve exhibits an increasing pitch-up tendency, as the angle of incidence is increased, relative to the line given by (dCm/dCL), = o i.e. the line which defines the linear point of action. When the planform is cropped to A = 1.4 the non-linear point of action does not move ahead of the linear one until ct = 10 degrees, so at low angles of incidence there is a pitch-down tendency and then a pitch-up. With further cropping the linear force acts ahead of the non-linear force over the whole range of incidence and the pitch-down tendency is strengthened and extended to moderate angles of incidence, but because the non-linear component moves forward with increasing incidence the nose-down tendency relative to the line given by (dCm/dCL),= o is still followed eventually by a nose-up trend although it was insufficient for this line to be crossed in the test range of incidence for the wings of lower aspect ratio.
These variations in the interplay between the points of action of the linear and non-linear components of normal force account for the differences in aerodynamic-centre movement with increase of lift observed for the various wings in Fig. 16. Furthermore there are differences in AhlvL/Co compared with the results of Ref. 1 which account for the slightly different behaviour of the aerodynamic-centre position with increase of lift coefficient noted in Section 5.3.

6. Comparison with Estimates from Data Sheets
For several characteristics in previous sections of this Report comparisons have been made with the results of the work presented in Ref. 1. The correlation curves of that reference were used as a basis for an Engineering Sciences Data Item 2 on the estimation of ~the low-speed longitudinal aerodynamic characteristics of slender wings' and in Table 9 the lift, drag and pitching-moment coefficient at ~ = 16 degrees, estimated directly from the Data Sheets, are compared with measured values for the two cropped wings with bevelled tips.
The agreement is quite good but the errors in lift and drag coefficient are of different signs for the two plan- forms. This mainly arises from errors in estimating the linear-normal-force slope when the correlating factor I + Co.,~,~/Co, discussed in Section 5.1.2, is applied to cropped wings. If~ instead, the total normal-force coefficient is calculated by using the curve of Fig. 7a, which relates the lift of cropped and uncropped wings with bevelled edges, in combination with an estimate of the uncropped wing of the same aspect ratio, and the linear-normal- force coefficient is then determined by the difference between the total and the estimated non-linear coefficients then the agreement for the lift and drag coefficients is improved as shown in Table 10.
Further comparisons using the two methods are given in Tables I1 and 12, again showing the improved agreement. The second method is therefore suggested as an addendum to the Data Sheets for use with cropped wings but because the curves of Fig. 7, forming part of this method, are derived from the wings being estimated a more rigorous check, preferably including wings with curved leading-edges before cropping, is needed before its adoption. This would also provide the data necessary to widen the scope of the methods for estimating the positions at which the various components of the normal force act so that the accuracy of estimating pitching- moment coefficients could be improved.
7. Conclusions
The tests described in this Report were made to extend the range of earlier work on the effect of planform shape on the subsonic characteristics of slender wings. The results show that despite the discontinuity in the leading-edge cum tip of a cropped wing, the development of the leading-edge vortices with increasing angle of incidence is very similar to that obtained on the pure delta and other planform types investigated previously. As a consequence the growth in the linear and non-linear components of the normal force with incidence, and the points of action of those components, can be forecast fairly accurately from the correlation curves derived in the earlier work, so that the lift and drag coefficients of the cropped deltas tested can be estimated to within 5 per cent and the aerodynamic-centre positions to about 0-01 of the centreline chord. By using the further information on the effect of planform shape provided by these tests on cropped deltas formed from an A = 1.6 delta in conjunction with the existing correlation curves, better estimates for other cropped shapes will be possible in the future.
Finally the tests demonstrated the advantages of the cropped, compared with the pure delta planform of the same aspect-ratio or slenderness ratio, both in the substantial increase of lift coefficient at a given incidence and consequently in the reduction of lift-dependent drag.

APPENDIX
F o r m u l a e for P r i n c i p a l G e o m e t r i c P a r a m e t e r s
If a delta wing of semispan So and centreline chord c o is cropped to have a new semispan s and a tip chord parallel to the centreline chord and equal to 2Co, then
(i) the new slenderness ratio
s _ So( 1 _ 2), CO CO
(ii) the planform area parameter
p = S 1 + 2
2SCo 2 where S is the wing area,
(iii) the aspect ratio
4s 2 2s 4 s A - - - and
S pc o 1 + R c o
(iv) the aerodynamic mean chord
2 / _ 1 + 2 + 22 /
Co 1 / '
so the position of the centre of area aft of the apex is given by
c o-x"-l- --31( 1 + 2 + 2 2 ) 1 + ) . "
To obtain a particular aspect ratio A, the original delta wing of aspect ratio A o must be cropped so that
s 2A
So A o + A"
9

A
A0
a
CA
Co
Co o
CL
CN
Cm
CO
¢ 0 - 9 9
AhL
AhNL
Ahn
K
P
q
S
S
S O
S x
Vo
x , y , z
X a
Ax~
O~
2
LIST OF SYMBOLS
Aspect ratio
Aspect ratio of uncropped wing
dCN Linear normal force slope ~ at ~ = 0 per radian
Axial force coefficient (non-dimensionalised relative to q and S)
Drag coefficient (non-dimensionalised relative to q and S)
Drag coefficient at zero lift coefficient
Lift coefficient (non-dimensionalised relative to q and S)
Normal force coefficient (non-dimensionalised relative to q and S)
Pitching-moment coefficient (non-dimensionalised relative to q, S and Co)
Wing centreline chord
Wing chord at 0.99 s
Aerodynamic mean chord
Distance linear normal force acts ahead of the centre of plan area
Distance ~on-linear normal force acts ahead of the centre of plan area
Distance of the aerodynamic centre ahead of the centre of plan area
Lift-dependent drag factor
area parameter = 2~Co for wings with unswept trailing edges Planform
Free-stream dynamic pressure
Wing planform area
Wing semispan at x = Co
Wing semispan of uncropped wing
Wing semispan at distance x behind the apex
Free-stream velocity
Orthogonal system of axes, x measured in chordal plane downstream from apex of wing (used in non-dimensional form with x and y non-dimensionalised relative to c o and s respectively)
Distance of centre of area behind apex of wing
Distance of centre of area behind the moment centre
Angle of incidence
Taper ratio X S
Ratio of local semispan/overall semispan at - - = 1 - - - C o C O
10

1 D.A. Kirby . . . . . .
2
H. C. Garner, E. W. E. Rogers, W. E. A. Acum and E. C. Maskell
4 N.C. Lambourne and D. W. Bryer ..
5 D.A. Kirby and D. L. I. Kirkpatrick
6 R.T. Jones . . . . . . . .
7 H. Multhopp . . . . . . . .
REFERENCES
An experimental investigation of the effect of planform shape on the subsonic longitudinal stability characteristics of slender wings.
A.R.C.R. & M. 3568 (1967)
Low-speed longitudinal aerodynamic characteristics of slender wings.
Engineering Sciences Data 1tern No. 71006 ( 1971)
Subsonic wind-tunnel wall corrections. AGARDograph 109 (1966)
The bursting of leading-edge vortices--some observations and discussion of the phenomenon.
A.R.C.R. & M. 3282 (1961)
An experimental investigation of the effect of thickness on the subsonic longitudinal stability characteristics of delta wings of 70 degrees sweepback.
A.R.C.R. & M. 3673 (1969)
Properties of low-aspect-ratio pointed wings at speeds below and above the speed of sound.
N.A.S.A. Technical Note 1032 A.R.C. 9483 (1946)
Methods for calculating the lift distribution of wings (subsonic lifting surface theory).
A.R.C.R. & M. 2884 (1950)
11

TABLE 1
Details of Models
A p
1.6 0.5 1-4 0-5333 1.2 0.5714 1.0 0.6135 0.8 0.6667
S/Co
0.4 0-3733 0-3429 0.3077 0.2667
0 0.0667 0.1429 0.2307 0.3333
Xa/CO
0.6667 0.6653 0.6607 0-6522 0-6389
C 0
m
0.5334 0.5334 0.5334 0.5334 0.5334
S m 2
0.1138 0.1133 0.1115 0.1077 0.1012
The chordwise thickness distribution was defined by the relationship
( half thickness = ~ - ( ~ -- Xo) 1 Xl
Co 2 c o '
where the wing apex is the origin for the x axis and Xl = any point on a wing chord, x o = leading-edge of wing chord and Co = centreline chord.
TABLE 2
Coefficients for Delta Wing at High Angles of Incidence Vo = 30 m/s
(~deg C L C o C N C A Cmo. 58
Aspect 0.31 5-43
10.64 15.86 21.11 26.34 27.39 28.42 29.44 30.47 31.50 32.53 33-55 34-58 35-59 36.55 37.61 38.61 39.61 40.50 41.53
ratio = 1.6 0.0085 0.1927 0.4201 0.6612 0.9308 1.1791 1-2263 1.2548 1.2668 1.2934 1.3162 1.3433 1.3612 1-3756 1-3769 1-3736 1.3655 1-3584 1.3361 1.3127 1.2662
0-0055 0.0223 0.0784 0.1816 0.3452 0-5608 0.6119 0.6552 0.6912 0.7348 0.7815 0.8254 0-8720 0-9184 0.9552 0.9873 1.0186 1.0505 1-0761 1.0950 1.0847
Ij 0.0085 0.1939 0.4274 0-6857 0.9926 1.3055 1.3703 1.4154 1.4429 1-4875 1.5306 1.5764 1.6164 1.6538 1.6756 1.6916 1.7034 1.7170 1-7154 1.7093 1-6671
O.0055 +0.0040 -0.0005 -0 .0060 -0 .0132 -0 .0206 -0.0208 -0 .0210 -0.0207 -0.0225 -0 .0214 -0-0264 -0 .0256 -0 .0246 -0 .0246 -0 .0248 -0 .0264 -0.0268 -0 .0228 -0 .0199 -0.0275
+0-00018 -0-00307 -0.00474 -0.00091 +0.00418
0.01727 0-01997 0.02634 0.03042 0.03206 0.03382 0.03536 0-03618 0-03603 0.03630 0.03618 0.03634 0.03692 0.03551 0.03457 0.03331
12

TABLE 3
C o e f f i c i e n t s f o r D e l t a a n d C r o p p e d D e l t a W i n g s
V o = 6 0 - 7 m / s
~deg CL Co CN CA Cmo.~
Aspectratio = 1.6 - 3-87 - 3.35 - 2.84 -2 .42 - 1.86 - 1.29 -0 .74 -0 .28 - +0.28 +
0.77 1.32 1.80 2.32 2.84 3.36 3.88 4.43 4.96 5.40 6.52 7.51 8.55 9.59
10.67 11.63 12.73 13.78 14.82 15.89 16.92 17.91 19.06 20.06 21.11 22.16 23.23 24.25 25.35 26.31
-0.1307 -0.1104 -0.0971 -0.0782 -0.0607 -0 .0396 -0.0254
0-0085 0.0081 0.0248 0.0419 0.0582 0.0761 0.0955 0.1148 0.1352 0.1551 0.1763 0.1922 0-2374 0.2835 0.3309 0-3738 0.4248 0.4702 0.5227 0-5710 0.6177 0.6720 0-7216 0.7705 0.8280 0.8788 0.9298 0.9819 1.0358 1.0825 1.1316 1.1741
0.0130 0-0110 0.0098 0.0084 0.0076 0.0070 0.0057 0.0046 0.0046 0.0055 0.0069 0.0075 0-0083 0-0096 0-0113 0-0134 0-0158 0-0187 0-0211 0.0288 0-0387 0.0502 0.0621 0.0780 0-0939 0-1144 0.1351 0.1570 0.1842 0.2106 0-2387 0.2746 0-3086 0.3453 0-3847 0-4274 0-4694 0-5152 0.5568
-0.1313 -0.1109 -0.0975 -0.0785 -0.0609 -0.0397 -0.0254 -0.0085 +0.0081
0.0248 0.0420 0.0584 0.0764 0.0959 0.1153 0.1358 0.1559 0.1773 0.1933 0.2391 0.2861 0.3347 0.3789 0.4319 0.4795 0.5351 0.5867 0.6373 0.6968 0.7516 0.8066 0.8722 0.9313 0.9918 1.0545 1.1203 1.1798 1.2432 1.2993
0.0041 0.0045 0.0050 0.0052 0.0056 0.0061 0.0054 0.0046 0.0046 0.0052 0.0059 0.0058 0.0052 0.0048 0-0045 0.0042 0.0037 0-0034 0.0029 0-0017 0.0013 0-0004
-0-0011 -0-0017 -0.0028 -0.0037 -0-0048 -0.0062 -0.0068 -0-0087 -0.0099 -0-0110 -0.0115 -0.0128 -0.0141 -0-0156 -0 .0166 -0.0189 -0.0213
CN/o~ K
Taper ratio = 0 0.00278 1.954 0.00243 1.897 0.00220 1.967 0.00175 1.859 0-00131 1.876 0.00096 1.763 0-00061 1.967
+0-00020 1.739 Coo = -0.00016 1 . 6 5 8 0.0064 - 0.00070 1.846 -0.00102 1.823 - 0.00139 !.859 - 0.00172 1 . 8 8 7 1.649 - 0.00224 1.935 1.746 - 0.00252 1.966 1.866 - 0.00288 2.006 1.926 -0.00313 2.017 1.964 - 0.00331 2.048 1.990 - 0.00337 3 . 0 5 1 2.000 -0.00399 2.101 1.998 -0-00412 2-183 2.020 -0.00421 2-243 2-011 - 0.00403 2-264 2-004 - 0.00388 2.319 1.994 - 0.00372 2-362 1.990 - 0.00342 2.409 1.987 - 0.00284 2-440 1-985 - 0.00204 2.464 1.984 -0.00018 2-513 1.979 + 0.00117 2.545 1.972
0.00258 2.581 1.967 0.00420 2.622 1-967 0.00611 2.660 1.967 0.00813 2.692 1.971 0.00991 2.726 1.973 0.01094 2-763 1.973 0.01246 2.788 1.986 0.01510 2.810 1.997 0.01721 2.830 2.007
13

TABLE 3 continued)
~deg C L C D C N
Aspect - 4.76 -4 .24 - 3.72 -3 .20 - 2-73 - 2-17 - 1 . 6 5
- 1 - 1 3
-0-62 -0-10 +0.41
0.93 1.50 1.96 2.48 2.99 3.56 4.03 4-55 5.07 5.59 6-63 7.73 8.72 9.76
10.81 11.85 12.90 13.95 15.05 16.05 t7-09 18-15 19-20 20.25 21-31 22.41 23.39 24.45 25.49 26.54
ratio = 1.4 -0.1678 -0-1464 -0.1250 -0.1092 -0.0890 -0.0695 -0.0518 - 0.0345 - 0.0192 - 0.0024 + 0.0142
0.0190 0.0160 0.0134 0.0120 0.0102 0.0091 0.0082 0.0074 0.0060 0.0055 0.0054
- 0.1688 -0.1472 -0.1256 -0.1097 -0.0894 -0-0698 -0.0520 -0-0346 -0.0192 -0-0024 +0-0142
C A Cmo.58 Cu/~ K
Ta ~er ratio = 0.0667 (square cut)
0-0310 0-0071 0.0486 0-0075 0-0619 0-0082 0-0802 0.0091 0-1004 0-0106 0.1204 0-0123 0.1406 0.0144 0.1566 0.0164 0.1777 0.0193 0.2000 0.0226 0.2454 0.0306 0.2919 0.0407 0.3341 0.0511 0.3846 0.0653 0.4356 0-0812 0-4804 0-0966 0.5323 0-1177 0-5780 0.1375 0.6353 0.1634 0-6871 0.1892 0.7333 0.2158 0.7888 0.2486 0.8398 0.2798 0.8982 0.3191 0.9555 0.3586 1.0062 0.3965 1.0441 0.4326 1.1047 0.4775 1.1476 0.5242 1-1977 0.5736
0-0050 0.0052 0.0053 0-0058 0-0059 0.0064 0.0067 0.0067 0-O058 0.0055 0.0053
0.00166 2.032 0-00148 1.989 0.00135 1.935 0.00119 1.964 0-00074 1.876 0.00029 1.844 0.00022 1-807 0.00028 1.754 0.00029 1-779 CDo = 0.00010 1 - 3 5 8 0.0068
+0.00001 1-984 --0.00027 1.916 --0.00040 1.864 --0.00046 1.818 1.607 --0-00069 1.860 1.572 --0-00121 1.932 1.658 --0-00131 1.948 1.668 --0-00150 2.009 1.691 --0.00164 1.982 1.722 --0.00183 2-020 1.741 --0.00199 2.062 1.737 --0.00244 2-137 1.738 --0.00251 2.185 1-750 --0.00237 2.221 1.746 --0.00208 2.290 1.739 --0.00185 2.349 1-725 --0-00142 2.369 1-709 --0-00099 2.421 1.721 +0-00042 2.440 1.720
0.00061 2-497 1.706 0.00134 2.544 1.699 0.00390 2.563 1.709 0.00596 2.611 1.708 0.00765 2.641 1.703 0.00924 2-697 1.702 0.01112 2-744 1.695 0.01376 2,765 1.693 0.01629 2.768 1-717 0.01796 2.820 1-696 0.02142 2-836 1.728 0.02442 2.867 1-738
0.0311 0.0066 0-0488 0.0062 0.0622 0.0061 0.0805 0.0056 0.1008 0.0054 0.1210 0.0048 0.1413 0.0045 0.1574 0.0039 0.1787 0.0035 0-2012 0.0030 0.2473 0.0021 0.2948 +0.0011 0-3380 -0.0001 0-3901 -0.0008 0.4431 -0.0019 0.4900 -0.0041 0.5451 -0.0041 0.5941 -0.0059 0.6559 -0.0071 0.7127 -0.0082 0.7643 -0-0093 0.8270 -0-0094 0.8851 -0-0119 0.9532 -0.0116 1-0205 -0.0131 1-0814 -0.0169 1-1301 -0.0175 1.2033 -0.0226 1-2614 - 0.0208 1.3277 -0-0220
14

TABLE 3 (continued)
~dog C L Co C N
Aspect -4 .79 -4 .22 - 3.70 - 3.19 -2 .67 - 2.15 - 1 . 6 3
- 1 . 0 7
-0-61 -0 .09 +0.42
0-94 1-45 1-96 2.53 3.00 3.52 4.03 4.55 5.08 6.60 6.64 7.68 8-73 9.77
10.82 11.86 12-92 13-95
15.01 16-07 17.11 18.16 19.27 20.27 21.32 22.38 23.48 24.47 25.52 26.57
ratio = !.2 -0.1551 -0 .1339 -0.1145 -0 .0989 -0 .0798 -0 .0615 -0.0451 -0 .0292 -0 .0180 -0 .0030 +0.0118
0-0179 0-0153 0.0130 0.0116 0.0101 0.0090 0.0082 0.0076 0.0063 0.0059 0.0057
-0.1561 -0 .1346 -0.1151 -0 .0994 -0 .0802 -0 .0618 -0.0453 -0 .0294 -0-0181 -0-0030 +0.0119
CA C.o.s - CN/o~ K
Taper ratio = 0.1429 (square cut)
0.0265 0.0072 0.0418 0-0077 0.0536 0.0082 0.0751 0-0093 0.0896 0.0102 0.1093 0.0118 0-1294 0.0138 0.1501 0.0163 0-1718 0.0192 0-1925 0.0223 0.2365 0.0299 0.2824 0.0396 0.3303 0.0515 0.3740 0.0635 0.4241 0.0794 0.4698 0.0952 0.5237 0.1163 0.5646 0.1321 0.6238 0.1585 0.6799 0.1868 0.7268 0.2132 0.7797 0-2454 0.8343 0.2785 0.8900 0.3139 0-9414 0.3510 0.9971 0.3904 1-0560 0.4351 1-0964 0.4743 1-1418 0.5172 1-1987 0.5686
O.OO48 0-0054 0-0056 0-0061 0.0064 0.0067 0.0069 0.0070 0.0061 O.0059 O.0056
-0.00128 1.867 -0.00137 1-828 -0.00135 1-782 -0.00141 1.785 -0.00143 1.721 -0.00143 1.647 -0.00109 1.592 - 0.00079 1.574 - 0.00036 1.700 -0.00016 1.910 CDo = + 0.00034 1.624 0.0072
0.00070 1.621 0.00095 1.660 0.00117 1.576 0.00129 1.708 1.404 0.00134 1.719 I,.409 0.00121 1-787 1.452 0.00129 1 - 8 4 8 1-486 0.00108 1.900 1-523 0.00113 1.950 1-533 0.00125 1.973 1.536 0.00135 2.057 1.530 0.00151 2.128 1.532 0.00197 2.194 1.531 0.00257 2.225 1.517 0-00306 2.285 1.509 0-00371 2.315 1.503 0.00456 2.380 1.500 0-00571 2.381 1.477 0.00672 2.457 1.466 0-00734 2.514 1.463 0.00916 2.536 1.470 0.01241 2.579 1.477 0.01445 2.615 1.469 0.01579 2.667 1.460 0.01831 2-700 1-462 0.02077 2.742 1.453 0.02325 2.787 1.447 0.02575 2-797 1-465 0.02878 2.814 1-475 0.03137 2.860 1-473
0.0266 0.0067 0.0420 0.0066 0.0539 0.0064 0.0754 0.0059 0.0900 0.0055 0.1098 0.0050 0.1300 0-0047 0.1509 0.0044 0.1728 0-0040 0.1938 0.0034 0.2384 0-0023 0.2852 0.0015 0.3342 +0.0008 0.3793 -0 .0009 0-4314 -0 .0016 0-4793 -0 .0034 0.5364 -0 .0037 0.5798 -0 .0080 0.6436 -0 .0085 0.7050 -0 .0087 0.7574 -0.0101 0.8174 -0 .0099 0.8795 -0 .0124 0.9437 -0 .0139 1.0046 -0 .0154 1.0707 -0 .0186 1.1420 -0-0217 1.1944 -0-0226 1.2532 -0-0252 1.3264 -0-0277
15

TABLE 3 (continued)
~deg [ CL CD CN CA C ..... ]
Aspect -4-74 - 2-67 -0 .55 +0.42
1.45 3.51 5.65 7-68 9.77
11-87 13.96 16-06 18.21 20-32 22.38 24.47 26.57
ratio = 1.2 - 0.1550 -0.0799 -0-0154 + 0.0111
0-0409 0-1069 0.1930 0.2782 0.3684 0.4733 0.5674 0.6787 0.7790 0.8917 1.0010 1.0971 1.1959
0.0178 0.0102 0.0058 0.0057 0.0078 0.0116 0.0224 0.0388 0.0624 0.0971 0.1354 0.1857 0.2458 0-3134 0.3891 0.4704 0.5690
-0-1560 -0-0803 -0.0155 +0-0112
0-0411 0.1074 0.1942 0.2809 0.3736 O.4832 0-5833 0.7036 0.8168 0.9451 1.0738 1-1934 1.3241
0.0049 0.0064 0.0057 0.0056 0-0067 0.0051 0-0033
+0-0013 -0-0010 -0.0023 -0-0055 -0.0093 -0.0100 - 0.0158 -0.0214 -0.0264 -0.0260
Taper -0.00153 -0.00178 - 0.00028 + 0-00022
0.00075 0.00151 0.00140 0.00199 0.00287 0.00416 0.00631 0.00823 0.01335 0.01659 0.02289 0.02623 0.03236
CN/O~ K
ratio = 0.1429 1.886 1.723 1-615 CDo = 1.528 0.0072 1-624 1.753 1.451 1.969 1.538 2-096 1.539 2-191 1.533 2-333 1.513 2.394 1.501 2.510 1.461 2.570 1.482 2.665 1-452 2.749 1-437 2.794 1-451 2.856 1.481
16

TABLE 3 (continued)
~deg C L C D C N
Aspect - 4 .74 -4 .22 -3 .70 -3 .19 -2 .67 -2 .15 - 1.64 - 1.13 -0-61 -0 .10 +0-41
0.92 1.44 1-95 2.46 2.98 3.49 4.06 4.53 5.05 5.57 6-61 7.65 8.69 9-74
10.83 11.83 12-88 13.98 14-97 16.08 17.07 18.13 19.18 20-28 21.31 22.33 23.39 24.49 25.49 26.54
ratio = 1.0 -0.1401 -0-1208 -0-1060 - 0.0886 - 0.0707 - O.0555 - 0.0408 - 0.0273 -0 .0146 - 0.0041 + 0-0095
0.0230 0.0366 0.0481 0.0631 0.0802 0.0978 0.1172 O. 1306 O- 1507 O. 1726 0.2121 0.2569 0-3039 0.3466 0.3960 0.4420 0.4929 0-5469 0.5889 0-6448 0.6941 0.7485 0.7989 0.8588 0.9100 0-9546 1.0138 1.0675 1-1208 1-1650
0.0172 0.0149 0.0133 0.0116 0.0102 0-0093 0.0085 0.0079 0.0064 0.0063 0-0063 0.0074 0.0083 0.0087 0.0094 0.0105 0.0119 0.0138 0.0153 0.0178 0.0210 0.0275 0-0366 0.0477 0.0596 0.0746 0-0901 0.1093 0.1317 0-1509 0-1787 0-2046 0.2334 0.2644 0.3023 0-3386 0.3732 0.4211 0.4662 0.5141 0.5574
-0-1411 -0 .1215 -0 .1066 -0.0891 -0-0711 -0 .0558 -0 .0410 -0 .0274 -0 .0146 -0-0041 +0.0095
0-0231 0.0368 0.0483 0.0635 0.0807 0-0984 0.1179 0.1314 0.1516 0-1738 0-2139 0.2595 0.3076 0.3517 0-4030 0.4511 0.5048 0.5625 0.6078 0.6691 0.7236 0.7840 0.8414 0.9103 0.9708 1.0248 1.0977 1.1647 1.2329 1.2913
C a C,,o.~8 Cu/~ K
Taper ratio = 0,2307 (square cut) -0.00593 1.706 -0.00544 1-650 -0.00497 1.651 -0-00445 1.600 -0.00387 1.526 -0.00317 1.487 -0.00251 1.433 -0.00165 1.389 - 0-00080 i. 371 - 0.00027 2.349 CDo = + 0,00058 1-328 0-0078
0-00139 1.439 0.00222 1.464 0.00283 1.419 0.00360 1.479 1.263 0.00420 1.552 1.319 0.00457 1.616 1.348 0-00515 1.664 1-371 0.00561 1-662 1.382 0.00597 1-720 1.384 0-00658 1.788 1.392 0-00766 1 - 8 5 4 1.376 0.00863 1.944 1-371 0.00924 2.028 1.357 0.01088 2-070 1-355 0.01198 2.132 1.336 0-01308 2-185 1,324 0.01462 2.246 1.313 0.01704 2.306 1-302 0.01874 2-326 1.296 0.02028 2-384 1-292 0.02310 2.429 1.283 0.02483 2.478 1.265 0-02722 2.514 1.263 0.02988 2.572 1.255 0.03222 2.610 1.255 0.03519 2-630 1-260 0.03805 2.689 1.263 0.04130 2.725 1.263 0.04438 2-771 1-266 0.04765 2.788 1.272
0.0056 0.0059 0.0064 0.0066 0.0069 0.0072 0.0073 0.0073 0.0062 0-0063 0-0062 0.0071 0.0073 0.0070 0.0067 0.0063 O.O059 0.0054 0.0050 0.0044 0.0041 0-0029 0-0020 0.0012
+0-0001 -0 .0012 -0-0024 -0.0033 -0-0043 -0 .0064 -0 .0068 -0 .0082 -0.0111 -0 .0126 -0 .0142 -0-0153 -0 .0174 -0 .0159 -0 .0183 -0 .0184 -0 .0218
17

TABLE 3 (continued)
0~deg [ CL
Aspect ratio = 0.8 -4 .70 -0.1171 -4-19 - 0.1009 - 3.67 -0.0878 - 3.16 -0.0732 - 2.65 -0-0605 - 2.13 - 0.0464 -1 .62 -0.0343 -- 1-11 -0.0225 -0 .60 -0.0123 - 0.09 -0.0003 + 0.42 +0.0095
0-93 0.0193 1.44 0.0313 1.95 0.0440 2.51 0.0570 2.97 0.0680 3.49 0.0835 4.00 0.1001 4,52 0-1172 5.04 0-1349 5.55 0.1501 6.59 0.1857 7.62 0-2269 8.67 0-2706 9.70 0.3109
10.75 0.3555 11.84 0.4024 12.84 0.4500 13.88 0.4958 14.98 0.5506 15.98 0-5963 17.03 0-6485 18.07 0.6978 19.12 0-7468 20-18 0.8049 21-23 0.8590 22.27 0.9046 23.33 0.9606 24.37 1.0080 25.43 1.0681 26.47 1.1144
Co
0.0166 0.0149 0.0135 0.0123 0.0114 0.0106 0.0099 0.0094 0.0082 0.0081 0-0080 0.0091 0.0098 0.0102 0.0109 0.0115 0.0128 0.0144 0-0164 0.0186 0-0208 0.0266 0-0347 0.0448 0.0556 0-0691 0.0847 0.1020 0.1204 0.1444 0-1668 0-1930 0.2203 0.2498 0.2864 0.3227 0.3565 0.3990 0.4383 0-4908 0-5344
C~
- 0 . 1 1 8 1
-0-1017 -0.0885 -0.0737 -0 .0610 -0.0468 -0.0345 -0.0226 -0.0123 - 0.0003 +0.0096
0-0194 0.0315 0.0443 0.0574 0.0685 0.0842 0-1008 0-1182 0.1360 0.1514 0.1875 0-2295 0.2742 0.3158 0.3621 0.4113 0.4614 0.5102 0.5692 0.6192 0.6766 0.7317 0.7875 0.8544 0.9176 0.9723 1.0401 1.0991 1.1753 1,2357
CA C,.o,~ CN/~ K
Ta ~er ratio = 0-3333 lsquare cut) -0.00986 1.440 -0-00879 1,391 -0.00789 1.382 -0.00713 1-336 -0.00611 1.319 -0-00488 1.259 - 0.00382 1.220 -0.00267 1.167 -0.00134 1-175 - 0.00021 0.191 CDo = +0-00101 1.310 0-0093
0.00213 1.195 0"00335 1-253 0.00449 1.302 0.00571 1.310 1'238 0-00672 1.322 1.196 0-00770 1.382 1'262 0.00881 1-444 1"279 0'00975 1 - 4 9 8 1"299 0.01082 1.546 1'285 0-01194 1.563 1.283 0"01392 1'630 1'261 0-01608 1.726 1-250 0.01842 1-812 1,219 0-02049 1.865 1,204 0"02289 1.930 1,189 0"02600 1.990 1,171 0.02793 2.059 1-151 0.02975 2.106 1-136 0.03267 2.177 1.120 0-03507 2.220 1.113 0.03746 2.277 1.098 0.04035 2.320 1.089 0-04352 2.360 1.084 0-04705 2-426 1,072 0.05085 2-477 1.068 0'05481 2.502 1.066 0.05859 2.555 1.062 0.06247 2,584 1.061 0"06653 2.648 1-061 0-07101 2,675 1-063
0.0070 0.0075 0.0078 0.0082 0-0086 0.0088 0.0089 0.0090 0-0081 0.0081 0.0080 0.0087 0.0090 0-0087 0-0084 0.0080 0.0077 0.0074 0.0071 0-0067 0.0061 0.0051 0,0043 0.0035 0.0024 0-0016
+0.OO04 -0.0005 -0.0020 -0.0028 -0.0038 -0.0053 - 0.0071 -0.0086 -0-0088 -0.0102 -0-0129 -0-0139 - 0.0167 - 0.0154 -0,0185
18

e d e g I C L
Aspectrat io = 0-8 - 4 . 7 4 -0-1209 -4 .23 -0 .1059 - 3-72 -0 .0912 - 3.20 -0 .0772 -2 .69 -0-0603 - 2.17 -0.0471 - 1.67 -0 .0370 - 1 - 1 5 -0.0235 -0 .64 -0 .0142 -0 .13 -0-0037
0.43 +0-0080 0-89 0.0163 1-40 0.0306 1.91 0.0413 2.47 0.0549 2.94 0.0694 3.45 0.0810 3-96 0.0965 4.48 0.1134 5.00 0.1323 5-51 0.1473 6.55 0.1861 7-63 0.2268 8.62 0.2655 9.66 0.3082
10.70 0.3499 11-80 0.3995 12-79 0.4415 13,83 0.4865 14,93 0-5422 15.92 0-5816 17.03 0.6391 18-02 0.6834 19.13 0.7422 20.12 0.7905 21-17 0.8370 22.23 0.9036 23,27 0-9464 24,38 1.0077 25.37 1.0515 26-42 1.0971
TABLE 3 (concluded)
Co
0.0166 0,0147 0.0132 0-0120 0.0108 0.0100 0.0095 0.0089
Cx
--0.1218 --0.1066 -0 .0919 --0,0778 --0.0608 --0.0474 --0-0373 --0.0237
CA
0-0066 0,0068 0.0073 0-0076 0.0080 0.0082 O.0O84 0.0085
0-0078 0.0075 0.0076 0,0088 0.0094 0-0099 0,0107 0,0119 0.0129 0.0144 0-0164 0.0188 0.0209 0.0275 0.0358 0.0448 0-0565 0-0692 0.0861 0.1015 0-1196 0.1431 0.1632 0.1921 0.2158 0-2503 0.2833 0.3141 0.3596 0.3950 0.4390 0.4818 0.5243
-0.0143 - 0.0037 + 0.0081
0-0164 0.0309 0.0416 0.0553 0.0699 0.0816 0.0973 0.1144 0.1334 0-1486 0.1880 0-2296 0.2692 0.3133 0.3566 0-4087 0.4530 0.5010 0.5608 0.6041 0-6674 0.7167 0.7833 0.8397 0.8940 0.9725 1.0254 1.0990 1.1565 1-2158
0.0076 0-O075 0-0075 0,0086 0.0086 0.0085 0.0083 0.0083 0.0080 0.0077 0.0075 0-0072 0.0067 0.0061 0,0053 0.0044 0-0040 0.0030 0,0026
+0-0012 -0 .0002 -0 .0015 -0-0026 -0 .0034 -0.0061 -0-0067 -0 .0059 -0 .0093 -0 .0090 -0-0111 -0 .0162 -0 .0153 -0 .0185
C,,o ,,
Taper - 0.00986 - 0.00869 - 0.00815 - 0.00692 - 0,00582 -- 0.00457 - 0-00382 - 0.00273 - 0.00136 -0.00016 + 0.00088
0-00200 0.00301 0.00415 0.00552 0.00640 0-00733 0.00839 0.00953 0.01048 0-01145 0.01375 0.01610 0.01821 0.02066 0.02313 0.02608 0-02849 0.03110 0.03369 0-03615 0-03893 0-04193 0.04528 0.04896 0.05283 0.05726 0.06128 0.06562 0.07019 0.07428
Cx/~ K
ratio = 0.3333 .472 .444 -416 .393 .295
•.252 1.280 1.181 1-280 1.631 1.079 Coo = 1,056 0.0090 !.265 1.248 1-283 1.420 1.362 1.513 1.355 1.494 1.408 1.458 1-463 1.446 1-529 1-407 1.545 1.379 1.645 1.343 1.724 1.310 1.789 1-277 1.858 1.257 1.91G 1.236 1.985 1.214 2.029 1.193 2-07~ 1-174 2.152 1-147 2-174 1-146 2.24( 1,127 2.27 c 1,113 2.347 1-101 2.39~ 1.103 2.420 1.095 2.507 1.079 2-525 1-083 2.583 1-064 2.612 1.075 2.637 1.076
19
A
1.6 1.4 (square) 1.2 (square) 1.0 (square) 0.8 (square) 0.8 (bevelled)
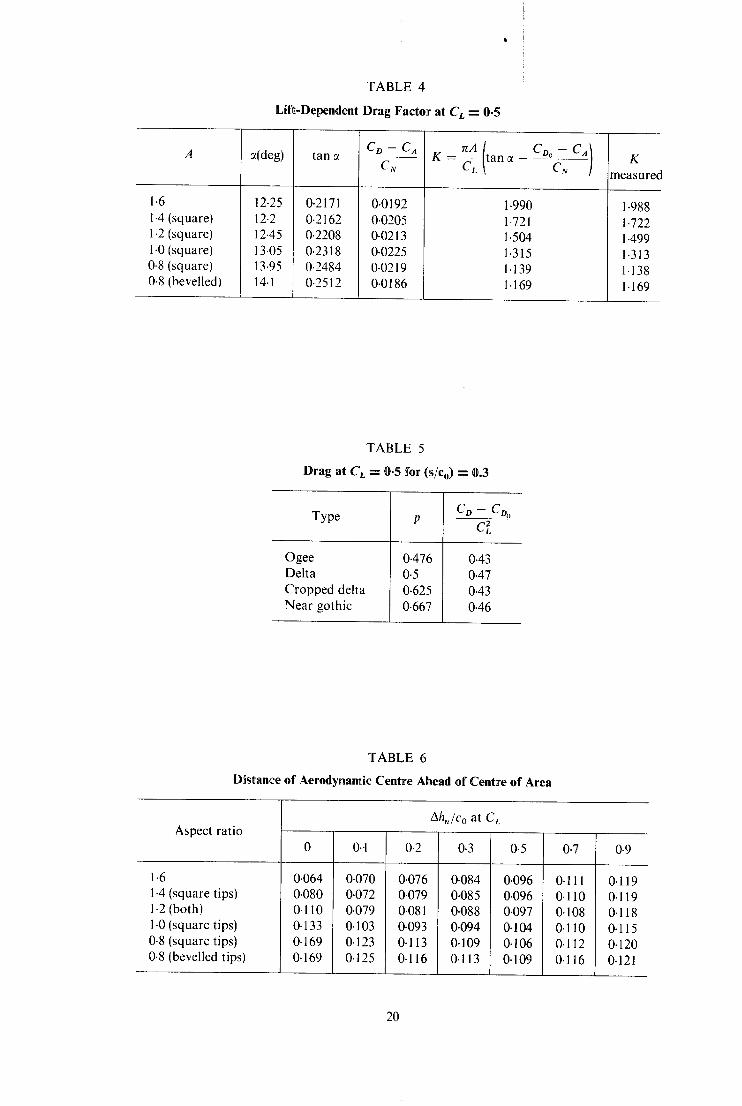
TABLE 4
Lift-Dependent Drag Factor at C L --- 0.5
7(deg)
12.25 12.2 12.45 13.05 13.95 14.1
tan c~
0.2171 0.2162 0-2208 0.2318 0.2484 0-2512
CD B CA
CN
0.0192 0.0205 0-0213 0-0225 0.0219 0.0186
rcA ' Co O - CA) K = CL tanct CN
1.990 1.721 1.504 1.315 1-139 1.169
K measured
1.988 1.722 1.499 1.313 1.138 1.169
TABLE 5
Drag at Ct = 0.5 for (s/co) - - 0.3
Type C D - CDo
Ogee 0.476 0.43 Delta 0-5 0.47 Cropped delta 0.625 0.43 Near gothic 0-667 0.46
TABLE 6
Distance of Aerodynamic Centre Ahead of Centre of Area
Aspect ratio
1.6 1-4 (square tips) 1.2 (both) 1.0 (square tips) 0.8 (square tips) 0.8 (bevelled tips)
Ah./co at C L
0 0.t 0.2 0.3 0.5 0.7
0.064 0.070 0.076 0.084 0.096 0.111 0.080 0.072 0.079 0.085 0.096 0.1 l0 0.110 0.079 0.081 0.088 0.097 0-108 0.133 0.103 0.093 0.094 0.104 0.110 0.169 0.123 0.113 0.109 0-106 0.112 0.169 0-125 0-116 0.113 0.109 0.116
0.9
0.119 0.119 0.118 0.115 0.120 0.121
20

TABLE 7
Distance of Aerodynamic Centre Ahead of Centre of Area
Wings (all with square cut tips
Ah./co
CL = 0.1 CL = 0.5
A Estimated Measured P S/Co
0.5333 0-3733 0-5714 0.3429 0.6153 0.3077 0.6667 0.2667
1.4 1.2 1.0 0.8
Estimated Measured
0.079 0.072 0-091 0.079 0-106 0.103 0.122 0.123
0.099 0.103 0.109 0.115
0.096 0-097 0.104 0-106
TABLE 8
Aha/co Aspect ratio
1.4 1.2 1.0
0.8
Estimated Measured
0.084 0.107 0.133
~0.169 (square) 0.161 (0.169 (bevelled)
0.080 (square) 0.110 (square) 0.133 (square)
TABLE 9
CL Co C,, Aspect ratio
1.2 0-8
Estimated Measured
0-656 0.673 0.615 0.590
Estimated Measured
0.181 0-185 0.173 0-165
Estimated Measured
0.015 0.007 0.040 0-036
TABLE 10
C L CD Cm Aspect
ratio Estimated Measured Estimated Measured Estimated Measured
1.2 0-670 0.673 0.185 0-185 0-015 0.007 0.8 0.593 0.590 0.167 0.165 0.038 0.036
21

TABLE 11
Est imates of Coeff ic ients at at - - 16 degrees
CL Co Cmo.s8 Aspect
ratio Measured Measured Measured
1.6 1.4 (square and
bevelled) !.2 (square and
bevelled) 1-0 (square) 1.0 (bevelled) 0-8 (square) 0-8 (bevelled)
Estimate 1
0.674
0.665
0.656
0.650
0.615
Estimate 2
0-674
0.680
0.670 0.646
0.600 0.593
0.678
0.682
0.673 0-641
0.600 0.590
Estimate Estimate 1 2
0.183 0.183
0.181 0.186
0.181 0-185 0.180
0.181 0.169
0.173 0.167
0-186
0.188
0.185 0.177
0.167 0.165
Estimate 1
-0 .006
+0.004
0-015
0.028
0-040
Estimate 2
-0 .006
+0.003
0.015 0-028
0.038 0.038
0
0.001
0.007 0.021
0.035 0.036
TABLE 12
Est imates o f Coeff ic ients at Aspect Rat ios of 1.2 and 0 .8
CL
Estimate Estimate 1 2
Measured
Aspect ratio = i.2 (square and bevelled tips) 0.291 0.670 1.082
0.286 0.656 1.058
0.296 0.673 1.078
0.243 0.241 0.600 0.590 0.992 0.984
C D
Estimate Estimate Measured 1 2
0.041 0.181 0'452
8 16 24
Aspect ratio = 0.8 8 (square)
(bevelled) 16 (square)
(bevelled) 24 (square)
(bevelled)
0.042 0.043 0.185 0-185 0.463 0.456
0.038 0.038 0.038 0-038 0.169 0.[67 0.167 0.165 0.428 0.426 0.424 0.423
0.249 0.258 0.247
0-600 0-615 0-593
0.986 1.011 0.976
0.039
0-173
0.439
Estimate 1
0-005 0.015 0-034
0.017
0.040
0-070
C t l l O • 5 8
Estimate 2
0.005 0.015 0-034
0.016 0.016 0.038 0-038 0-067 0-067
Measured
0.002 0.007 0.025
0-017 0.017 0-035 0.036 0.061 0.064
Note- -Es t imate 1 assumes all edges sharp and measurements showed no difference between square and bevelled tips for A = 1.2 so no difference is assumed for A = 1.4 also.
22

A s p e c t r m t i o I 4 1 .6_
,o , ~ ~ ~
Scold..
O ~ 4. in I I I
0 0-05 0-1 m
FIG. 1. Planform and centre-line section of models.
23

I'6
1.4
CL
1-2
1.0
0"8
0.6
0-4
/ /
O" 2 ~ !i'
/ 0 s IO
/
w i t h o u t woke blOCkOg¢ c o r r e c t i o n
Corrected for woke blocko9e
/
15 20 25 L i f t
® V o = 60.7 m/5¢c
x 5 0 m /5eC
3 0 3 5 4O 4 5 ~ o
0 . 0 4
0 . 0 5
Cm
0.02
0"01
0
- 0 . OI
Moment c e n t r e ot 0.58 Co
/ X
l/ ½
~ c ~ ~ 0 25
Pitchin 9 moment
I
,.x.-yx'~-~-x-x-X., "-
3,0 3.5 4 0 4
FIG. 2. Lift and pitching moment coefficients for basic wing, A = 1.6.
24
t , J
, ~ i 1,' ~
i ~,
A = 1 . 2 , ( x = 5 . 3 ° A = 0 . 8 , (~ = 6 . 0 ° A = 0 . 8 , ot = 9 . 6 °
FIc. 3. Upper surface flow patterns, Vo = 30 m/s.

- - 1 " 2
I - 0
CL
h 0 - 5
0 . 6
0.4
- - 0 . 2
- - - - 0 . 2
O B~velled t i p s
+ So~uore cut t i ps /
Aspect r a t i o = 1.6
) 5 !0
L_
Note:- coefficients' based on respective wing areas
C Z 15 20
A 25 3o
FIG. 4. Lift coefficient v incidence.

0,7
CL
0"6
0.5
0
0.571 0-553 Cropped del tas ~ -- -- -- -I-
--~ p = o.6,s.~ .~ . ~ - ~ i s , ~ . ~ ~
, ~- I p = 0 " 4 7 G / . ~
9 o t h i c s / / / . , ~
p=0"645 ~itot S
/ p=O.5
0.8 1,0 1.2
® B~velled tips + So uor~ cut tips
1.4 1.6 A (= 2s/pCo)
FIo . 5. Lift coeff ic ient at c~ = 16 ° v a spec t ra t io .
0-7
CL
0"6
0.5
I%
Cropped deltos ~" ~ ~ ~
~9othics
Plonform oreo porometer p os in Fi9.5
0.2 o-~5 0.3 0.35 0.4 Silo (= ApI~)
FIG. 6. Lift coef f ic ien t at c~ = 16 ° v s l e n d e r n e s s rat io.
27

1.4
1-3
(C k of cropped del ta)
CCL Of delta of same aspect ratio) I-P.
o( deg 8
12 16 20 24
iii/ 0 0,I
Symbol
x
A ® v ÷
, / So~uare
/.~.,~)~., cu t t i ps Bevel led
x t i ps
0.3 Toper ra t io
0.3 0.4
0 At c o n s t a n t a s p e c t r a t i o
1,2
(C L o f cropped delta)
(C L of delta of" some slenderness rat io)
i.I
I'0 / ' ' ~ 0 O.I 0.4
Toper rat io
v p, x
0.~ 0.3
b At ¢onstan% s lenderness r a t i o
O . So, uore
;, cut t ips
FIG. 7(a) and (b). Effect of cropping on lift coefficient at constant incidence (points are for square cut tips only).
28

t ~ ~0
1-4
CN/Ot- a
I'a
I-0
0"8
0"6
0-4
0"2
0
1.09 I
Aspect ra t io 0.8
// /._ //+
/ / / /
/
/ + /
/
/ F
F
I" 0
/ / ,.:,,- _/+ / # , . + ~ _..o
/ J / '4+ ,.0
t +// n( + / ' ~ o Bevelled t i ps
% / ~o" + Square cut t i ps
;~4" "oe/~ 0 from negative incidences
1"09
I 1"31
I 1"50
I
0 S I0 I I
1.69 I-'/S = a ( l i n e a r t e r m ) I I I I
I S 25 ~o 2O
I FIG. 8. Effect of cropping on non-linear normal force.
30

1.8
Q
I-6
1'4
I.Z
I '0
® +
I I Bevelled t i p s 5c~UQre-cut, t . ip~
I ' f J
J .A) f
.. J f J
J J
j J J
/ /
/ -
Full l ine is f o r d¢l%o wlngs o~" Ref.I
O'B 0 . 9 I -0 I.I I .Z I-3 1"4 1.5 1"6 A
F]6. 9. Variation of linear normal force slope with aspect ratio.
I.Z
CN/d,--Q
I '0
0"8
0-6
0.4-
. . . .
~ ÷ . . .
o ( = 1 6 °
o ~ = 8 °
0 . 2
0 .8 0 -9 t.O I.I 1.2 I-3 1.4 I 'S 1"6 A
FIG. 10. Variation of non-linear normal force component with aspect ratio.
30

l.S
C N/(~, --0 A
1.0
0.5
®
+ Bevelled t i p s
5%uore c u t tips t I
= 0-30
Z v
I I
^ = 0 . 1 5 L ~ ~ - -
Full l ines t o k e n f rom Re£1 D o t t e d line, s s h o w l i m i t s o f s c o t t e r o f p o i n t s in Ref, l
I i i 0 0-6 0.65 0.7 0.75 0.8 0.85 0.9 0.95 I.o
x I S q = a t Eo : -C%
FIG. 11. Variation of non-linear component of normal force with ~/, the correlating factor used in Ref. !.
31

O ' O I
0
0
- 0 " 0 1
- O . O Z
+
I - 0 - 0 5 ,
Aspect r a t i o = 0.8
_ 2 5
+
1"4
I'P.
PO 0
1.6
®
e
+
Beve l led t ips S%uore cut t, ips
I
3 3
F]G. 12. Axial force coefficient v incidence.
32

2.4
2.2
C o - C o O
c:/ A 2 " 0
1 .8
1.6
1.4
1.0
O Bevelled t i p s + So ua re c u t t i p s
P I I I
-4"¢'-~-÷..~
÷ I
Aspect. r o t i o = i " 6
I I I I r I I I I
I I
~ - - + - - + _
I
I I I I I
q . . . + . . - ~ + - ~ "
I
.+..+ 1"4
+
! I I
I I I I
¢t. = 0 .5 ~ ~ O-5
I I
O.7
I I
I I
~-~- +-+'---I-"
0.9
. -~ .~ 1.2
+--+ 1.0
0"8
0 5 I0 15 20 o/. o 2 5 3 0
FIG. 13. Lift-dependent drag factor v incidence.
33

0.6
Co--COo
C L ~ 0.5
0 .4
c.: 0.3
- ' Z ' ~ - . . J ~ Neor 9othics ~ ~ OeltaS " - I-C L_~. I ~ 09 ~ ' - e e s [--'-----.....~
~ ° ~ ? , t o r T ~ ~ .~ 4 _ : ~ 0 B e v e l l e d t i p s
~-4 ~ S~uorel CUt tipsl
0.8 0.9 I-O I-I 1.2 I '$ 1,4 1.5 1"6 A
0 .6
Co -Co o CL 2
0"5
0.4
O
p= 0.667
cropped deltos
~ - - ~ , . . C L = O ' 5
N¢or gothics ~'~--- DP.Itos
~ - ~ ' ~ ~-'~---., , - ~ 9 ee s p = O. 4_/ .~.~.._.._ ~ . _ -
0,5-/I 0-553
L 0.8 0-9 I'O I.I 1.2 1.5 1"4 1,5 1'6
A
0 .6
Co-Coo C L 2
0"5
O.Z
Neor 9othics
- - C r o p p e d de l tQS " O 9 e e s
. A
0 0-8 0 .9 1.0 I.I I.~ 1,3
C L = O ' 7
1.4 1.5 i.6 A
FIG. 14. Effect of p lanform shape and aspect ra t io on l i f t -dependent drag.
34

I.#° Ul~l
Moment centre ® I~v~llcd t ips / ~ . + / a t 0.58 C O + So uare cut t ips
oo, / /
0"06 7
/ O-O5
i,p~.ct r'at.i~ =0.6 +~./ /
0 " 0 4
o.o~ //~+/+/ , /
/ . t / " I ~ / / I , , ~ 4 " ""
~ - + . o:a o~ _ ~ ÷ o : ~ 0.8 ,.o , . i+'/ +..÷/
/ +-0.01
FIG. 15. Pitching-moment coefficient v lift coefficient.
35

0"18
O'lG
Ahn/Co
i
0-14
0'10
o xo,cosymbOo 7 o
1.4(square t ips) 0.665 + 0"( I-2 (both) 0.661 A
1.0 (so, uore t ips) 0.652 x 0.8 (so, uore tips) 0.639 [] 0.8 (bevelled tips) 0-639 0
I 0 0.2 0.4 0-6 0.8 1.0
C L 1.2
FK;. 16. Distance of aerodynamic centre ahead of centre of area v lift coefficient.
36

AhNL
Co
0 . I0
I 7 J
f
Ah L
Co
Z
A = I ' 6
I0 1,5 ?.0 o( o ~5
AhNL Co
0-I0
j + J
5 10
. . . . . . + J + ,.....+ J
- '~hL. A = I . 4 Co
15 ~.O ~o 25
AhNL Co
0"IO
O
+..,- j + 1
i + J
AhL . . . .
- + / A = I . 2
S I 0 15 2 0 o~o 2S
~hN L
Co
0.1o
Z~h L
Co
...,..- +
A=I,O --..____ + ....--
5 I0 15 20 cXO 25
A! L C,
O B e v e l l e d t i p s
+ S%uare c u t t i p s
AhN L Co
0-10
A = O . 8
FIG. ] 7.
0 5 IO 15 20 ~o ~S
Distance of points of action of linear and non-linear normal force components ahead of centre of area.
Printed in England for Her Majesty's Stationery Office by J. W. Arrowsmith Ltd., Bristol BS3 2NT Dd. 505715 K5 3/74
37

R° & M. NOo 3744
© ('town copyright 1974
tIER MAJESTY'S STATIONERY OFFICI:i
Government Bookshops
49 lligh llolborn, London WCIV 6IIB 13a Caslle Street, Edinburgh EH2 3AR
41 The Hayes, CardiffCFI IJW Brazennose Street, Manchester M60 8AS
Southey House, Wine Street, Brislol BS1 2BQ 258 Broad Street, Birmingham BI 2HE 80 Chichester Street, Belfast BT1 4JY
Government Publications are also availabh~ through booksellers
R, & M. No. 3744 I S B N 0 I I 470837 1