low risk portfolio mps defensive income/media/files/b/... · low risk portfolio mps defensive...
TRANSCRIPT

MPSLow Risk Portfolio Defensive Income29.02.2020Platform
Objective
The primary objective of this portfolio is to produce a higher level of income than the Bank of England base rate over the longer term by investing in a range of relatively defensive diversified UK and international investments. Equity exposure is likely to range between 0-30% and is likely to be limited to shares in companies paying higher than average dividends.
Key facts
Inception date* December 2013
No. of holdings (incl. cash) 22
Currency £
Overall portfolio yield 2.42%
Charges
Platforms provide a convenient way of holding and reporting on investments in your MPS portfolio.
Please refer to your platform of choice directly for the applicable fees, costs and charges.
Underlying charges may apply which will vary according to the specific assets within the MPS portfolio (for example internal fund manager charges on funds held within MPS).
Performance
Past performance data is not representative of past performance on different platforms. The past performance data detailed below relates to the Managed Portfolio Service (MPS) using Morningstar/‡MSCI WMA information. The past performance does not represent actual or simulated past performance of the MPS on all platforms. This is because MPS on platforms will vary in portfolio composition due to the differing availability of investments on different platforms.
Performance (%)
Feb-15 Aug-15 Feb-16 Aug-16 Feb-17 Aug-17 Feb-18 Aug-18 Feb-19 Aug-19 Feb-20
-5
0
5
10
15
20
25
MPS Low Risk (Defensive Income) 50:50 ‡MSCI WMA Income TR/Base Rate
Consumer Price Index (CPI)
Consumer Price Index (CPI) refers to the CPI All Items Index. The data for CPI is as at 31.01.20.
12-month performance to 29 February (%) 2016 2017 2018 2019 2020
MPS Low Risk (Defensive Income) -1.05 8.47 2.92 1.61 5.57
50:50 ‡MSCI WMA Income TR/Base Rate -0.49 8.80 2.18 1.45 2.93
UK Bank Rate 0.50 0.36 0.33 0.64 0.75
Relative performance -0.56 -0.33 0.74 0.16 2.64
Cumulative performance to 29.02.2020 (%) 3M 6M 1Y 3Y 5Y
Since inception*
MPS Low Risk (Defensive Income) -0.97 0.20 5.57 10.40 18.49 28.69
50:50 ‡MSCI WMA Income TR/Base Rate -1.69 -0.92 2.93 6.70 15.53 22.37
UK Bank Rate 0.19 0.37 0.75 1.74 2.61 3.21
Relative performance 0.72 1.12 2.64 3.70 2.96 6.32
Past performance is not a reliable indicator of future results.Sources: Brooks Macdonald/Morningstar/‡MSCI WMA as at 29.02.20. All performance figures shown on this factsheet are net of underlying fund charges but gross of Brooks Macdonald’s management fees and adviser charges. Deduction of these fees and charges will impact on the performance shown.

MPSLow Risk Portfolio Defensive Income
For further information:T: 02074085501
E: [email protected]: brooksmacdonald.com
Important informationThis document is intended for professional advisers authorised to give financial advice only and should not be relied upon by any persons who do not have professional experience in matters relating to investments.
Brooks Macdonald is responsible for managing the MPS model portfolio on a discretionary basis in accordance with the stated investment objectives and risk profile for the MPS portfolio. The professional adviser is responsible for advising the client as to the selection of an MPS portfolio and for assessing the suitability of the chosen MPS portfolio for the client on an ongoing basis.
Investors should be aware that the price of investments and the income from them can go down as well as up and that neither is guaranteed. Investors may not get back the amount invested. Past performance is not a reliable indicator of future results. Changes in rates of exchange may have an adverse affect on the value, price or income of an investment. Investors should be aware of the additional risks associated with funds investing in smaller companies.
The information in this document does not constitute advice or a recommendation and you should not make any investment decisions on the basis of it. This document is for the information of the recipient only and should not be reproduced, copied or made available to others. Brooks Macdonald, its subsidiaries and/or their officers, directors and employees may also own and trade in the underlying assets.
All performance figures shown on this factsheet are net of underlying funds' OCF but gross of Brooks Macdonald’s management fees and adviser charges. Deduction of these fees and charges will impact on the performance shown.
Please note that changes made within each risk portfolio will affect all clients within that profile simultaneously.
‡MSCI makes no express or implied warranties or representations and shall have no liability whatsoever with respect to any MSCI data contained herein. The MSCI data may not be further redistributed or used as a basis for other indexes or any securities or financial products. This report is not approved, endorsed, reviewed or produced by MSCI. None of the MSCI data is intended to constitute investment advice or a recommendation to make (or refrain from making) any kind of investment decision and may not be relied on as such.
© FinaMetrica Pty Ltd. Risk tolerance scores were mapped to the funds’ strategic asset allocations as at 31.12.2019. The mappings are only for use by financial advisers licensed to use FinaMetrica’s risk profiling system and do not constitute financial advice. Financial advisers must satisfy themselves that the funds’ current asset allocations reflect the risk/return expectations of the funds when mapped. Brooks Macdonald does pay FinaMetrica for the mappings in the table however these mappings are calculated independently by FinaMetrica. The stated ‘DT risk level’ is the risk level attributed to the model portfolio by a third party, Distribution Technology Limited (“DT”) following DT’s analysis. The stated ‘DT risk level’ is valid as at the stated date; however, market fluctuations can mean the level of risk in the portfolio might change over time. Brooks Macdonald has not verified the risk level attributed to the model portfolio by DT and makes no warranty as to its accuracy. Accordingly, Brooks Macdonald will not accept any liability arising from any reliance on the stated DT risk level.
This service is provided by Brooks Macdonald Asset Management Limited which is authorised and regulated by the Financial Conduct Authority. Registered in England No 3417519. Registered office: 21 Lombard Street, London, EC3V 9AH.
Brooks Macdonald is a trading name of Brooks Macdonald Group plc used by various companies in the Brooks Macdonald group of companies. Brooks Macdonald Group plc is registered in England No 4402058. Registered office: 21 Lombard Street, London, EC3V 9AH.
BMAM Feb - 20
Brooks Macdonald investment team
Jonathan Webster-SmithDirector,Head of Multi-Asset
Mark ShieldsInvestment Director,Multi-Asset
Frank AtkinsInvestment Manager,Multi-Asset
Alex ChittendenInvestment Manager, Multi-Asset
James HusseyAssistant Portfolio Manager, Multi-Asset
Ratings and awards
This portfolio was analysed by Distribution Technology in February 2020 as having a DT risk level of 3.
Overall sector breakdown
UK Fixed Interest
International Fixed Interest
UK Equities
North American Equities
International & Thematic Equities
Structured Return
Cash
38.24%
20.79%
11.74%
3.71%
11.31%
6.71%
7.51%
Portfolio holdingsFund %
Allianz Gilt Yield Fund 9.56
PIMCO Sel UK Income Bond Fund 10.14
Royal London Short Duration Gilts Fund 9.30
Royal London Sterling Credit Fund 9.24
Artemis Strategic Bond Fund 3.10
Hermes Multi Strategy Credit Fund 3.05
JPM Unconstrained Bond Fund 6.14
MI TwentyFour AM Dynamic Bond Fund 4.09
Vanguard US Government Bond Index Fund 4.41
JOHCM UK Equity Income Fund 2.66
Liontrust Special Situations Fund 2.77
Royal London UK Equity Income Fund 3.59
Vanguard FTSE UK All Share Index UT 2.72
Fidelity Index US Fund 3.71
BNY Mellon Global Income Fund 2.80
Fidelity Index World Fund 2.78
Guinness Global Equity Income 2.81
Lazard Global Listed Infras Eq Fd 2.92
AHFM Defined Returns 2.77
IFSL Brooks Macdonald Defensive Cptl Fd 1.97
Skyline Fortem Capital Progressive Gr Fd 1.97
Cash (£) 7.51

MPSLow-to-Medium Risk PortfolioIncome29.02.2020Platform
Objective
The primary objective of this portfolio is to produce a higher level of income than inflation. The portfolio gives limited exposure to capital markets through a diversified range of UK and international investments. Equity exposure is likely to range between 30-55% with limited exposure to international investments.
Key facts
Inception date* December 2013
No. of holdings (incl. cash) 20
Currency £
Overall portfolio yield 2.90%
Charges
Platforms provide a convenient way of holding and reporting on investments in your MPS portfolio.
Please refer to your platform of choice directly for the applicable fees, costs and charges.
Underlying charges may apply which will vary according to the specific assets within the MPS portfolio (for example internal fund manager charges on funds held within MPS).
Performance
Past performance data is not representative of past performance on different platforms. The past performance data detailed below relates to the Managed Portfolio Service (MPS) using Morningstar/‡MSCI WMA information. The past performance does not represent actual or simulated past performance of the MPS on all platforms. This is because MPS on platforms will vary in portfolio composition due to the differing availability of investments on different platforms.
Performance (%)
Feb-15 Aug-15 Feb-16 Aug-16 Feb-17 Aug-17 Feb-18 Aug-18 Feb-19 Aug-19 Feb-20
-10
-5
0
5
10
15
20
25
30
35
40
MPS Low-to-Medium Risk (Income) ‡MSCI WMA Income TR
Consumer Price Index (CPI)
Consumer Price Index (CPI) refers to the CPI All Items Index. The data for CPI is as at 31.01.20.
12-month performance to 29 February (%) 2016 2017 2018 2019 2020
MPS Low-to-Medium Risk (Income) -1.61 15.28 2.89 0.81 4.13
‡MSCI WMA Income TR -1.56 17.79 4.00 2.15 5.02
Relative performance -0.05 -2.51 -1.11 -1.34 -0.89
Cumulative performance to 29.02.2020 (%) 3M 6M 1Y 3Y 5Y
Since inception*
MPS Low-to-Medium Risk (Income) -3.01 -1.49 4.13 8.01 22.51 34.60
‡MSCI WMA Income TR -3.58 -2.25 5.02 11.56 29.36 44.16
Relative performance 0.57 0.76 -0.89 -3.55 -6.85 -9.56
Past performance is not a reliable indicator of future results.Sources: Brooks Macdonald/Morningstar/‡MSCI WMA as at 29.02.20. All performance figures shown on this factsheet are net of underlying fund charges but gross of Brooks Macdonald’s management fees and adviser charges. Deduction of these fees and charges will impact on the performance shown.

MPSLow-to-Medium Risk PortfolioIncome
For further information:T: 02074085501
E: [email protected]: brooksmacdonald.com
Important informationThis document is intended for professional advisers authorised to give financial advice only and should not be relied upon by any persons who do not have professional experience in matters relating to investments.
Brooks Macdonald is responsible for managing the MPS model portfolio on a discretionary basis in accordance with the stated investment objectives and risk profile for the MPS portfolio. The professional adviser is responsible for advising the client as to the selection of an MPS portfolio and for assessing the suitability of the chosen MPS portfolio for the client on an ongoing basis.
Investors should be aware that the price of investments and the income from them can go down as well as up and that neither is guaranteed. Investors may not get back the amount invested. Past performance is not a reliable indicator of future results. Changes in rates of exchange may have an adverse affect on the value, price or income of an investment. Investors should be aware of the additional risks associated with funds investing in smaller companies.
The information in this document does not constitute advice or a recommendation and you should not make any investment decisions on the basis of it. This document is for the information of the recipient only and should not be reproduced, copied or made available to others. Brooks Macdonald, its subsidiaries and/or their officers, directors and employees may also own and trade in the underlying assets.
All performance figures shown on this factsheet are net of underlying funds' OCF but gross of Brooks Macdonald’s management fees and adviser charges. Deduction of these fees and charges will impact on the performance shown.
Please note that changes made within each risk portfolio will affect all clients within that profile simultaneously.
‡MSCI makes no express or implied warranties or representations and shall have no liability whatsoever with respect to any MSCI data contained herein. The MSCI data may not be further redistributed or used as a basis for other indexes or any securities or financial products. This report is not approved, endorsed, reviewed or produced by MSCI. None of the MSCI data is intended to constitute investment advice or a recommendation to make (or refrain from making) any kind of investment decision and may not be relied on as such.
© FinaMetrica Pty Ltd. Risk tolerance scores were mapped to the funds’ strategic asset allocations as at 31.12.2019. The mappings are only for use by financial advisers licensed to use FinaMetrica’s risk profiling system and do not constitute financial advice. Financial advisers must satisfy themselves that the funds’ current asset allocations reflect the risk/return expectations of the funds when mapped. Brooks Macdonald does pay FinaMetrica for the mappings in the table however these mappings are calculated independently by FinaMetrica. The stated ‘DT risk level’ is the risk level attributed to the model portfolio by a third party, Distribution Technology Limited (“DT”) following DT’s analysis. The stated ‘DT risk level’ is valid as at the stated date; however, market fluctuations can mean the level of risk in the portfolio might change over time. Brooks Macdonald has not verified the risk level attributed to the model portfolio by DT and makes no warranty as to its accuracy. Accordingly, Brooks Macdonald will not accept any liability arising from any reliance on the stated DT risk level.
This service is provided by Brooks Macdonald Asset Management Limited which is authorised and regulated by the Financial Conduct Authority. Registered in England No 3417519. Registered office: 21 Lombard Street, London, EC3V 9AH.
Brooks Macdonald is a trading name of Brooks Macdonald Group plc used by various companies in the Brooks Macdonald group of companies. Brooks Macdonald Group plc is registered in England No 4402058. Registered office: 21 Lombard Street, London, EC3V 9AH.
BMAM Feb - 20
Brooks Macdonald investment team
Jonathan Webster-SmithDirector,Head of Multi-Asset
Mark ShieldsInvestment Director,Multi-Asset
Frank AtkinsInvestment Manager,Multi-Asset
Alex ChittendenInvestment Manager, Multi-Asset
James HusseyAssistant Portfolio Manager, Multi-Asset
Ratings and awards
This portfolio was analysed by Distribution Technology in February 2020 as having a DT risk level of 4.
Overall sector breakdown
UK Fixed Interest
International Fixed Interest
UK Equities
North American Equities
European Equities
Japan/Far East/Emerging …
International & Thematic Equities
Structured Return
Cash
28.62%
11.79%
17.44%
6.65%
2.91%
3.71%
15.33%
7.76%
5.80%
Portfolio holdingsFund %
Allianz Gilt Yield Fund 7.63
PIMCO Sel UK Income Bond Fund 8.32
Royal London Short Duration Gilts Fund 5.30
Royal London Sterling Credit Fund 7.37
Hermes Multi Strategy Credit Fund 4.17
Vanguard Global Bond Index Fund 4.23
Vanguard US Government Bond Index Fund 3.39
JOHCM UK Equity Income Fund 4.54
Man GLG UK Income Fund 3.66
Royal London UK Equity Income Fund 5.53
Vanguard FTSE UK All Share Index UT 3.71
Fidelity Index US Fund 6.65
ASI Europe ex UK Income Equity 2.91
L&G Asian Income Trust 3.71
BNY Mellon Global Income Fund 4.79
Fidelity Index World Fund 4.76
Guinness Global Equity Income 5.78
AHFM Defined Returns 4.73
IFSL Brooks Macdonald Defensive Cptl Fd 3.03
Cash (£) 5.80

MPSLow-to-Medium Risk PortfolioIncome and Growth29.02.2020Platform
Objective
The objective of this portfolio is to provide a combination of income and capital growth. The portfolio gives limited exposure to capital markets through a diversified range of UK and international investments and aims to achieve above inflation investment returns over the longer term. Equity exposure is likely to range between 30-55% with limited exposure to international investments.
Key facts
Inception date* December 2013
No. of holdings (incl. cash) 21
Currency £
Overall portfolio yield 2.54%
Charges
Platforms provide a convenient way of holding and reporting on investments in your MPS portfolio.
Please refer to your platform of choice directly for the applicable fees, costs and charges.
Underlying charges may apply which will vary according to the specific assets within the MPS portfolio (for example internal fund manager charges on funds held within MPS).
Performance
Past performance data is not representative of past performance on different platforms. The past performance data detailed below relates to the Managed Portfolio Service (MPS) using Morningstar/‡MSCI WMA information. The past performance does not represent actual or simulated past performance of the MPS on all platforms. This is because MPS on platforms will vary in portfolio composition due to the differing availability of investments on different platforms.
Performance (%)
Feb-15 Aug-15 Feb-16 Aug-16 Feb-17 Aug-17 Feb-18 Aug-18 Feb-19 Aug-19 Feb-20
-10
-5
0
5
10
15
20
25
30
35
40
MPS Low-to-Medium Risk (Income and Growth) ‡MSCI WMA Income TR
Consumer Price Index (CPI)
Consumer Price Index (CPI) refers to the CPI All Items Index. The data for CPI is as at 31.01.20.
12-month performance to 29 February (%) 2016 2017 2018 2019 2020
MPS Low-to-Medium Risk (Income and Growth) -0.05 14.57 3.27 1.27 4.30
‡MSCI WMA Income TR -1.56 17.79 4.00 2.15 5.02
Relative performance 1.51 -3.22 -0.73 -0.88 -0.72
Cumulative performance to 29.02.2020 (%) 3M 6M 1Y 3Y 5Y
Since inception*
MPS Low-to-Medium Risk (Income and Growth) -2.84 -1.87 4.30 9.07 24.90 38.28
‡MSCI WMA Income TR -3.58 -2.25 5.02 11.56 29.36 44.16
Relative performance 0.74 0.38 -0.72 -2.49 -4.46 -5.88
Past performance is not a reliable indicator of future results.Sources: Brooks Macdonald/Morningstar/‡MSCI WMA as at 29.02.20. All performance figures shown on this factsheet are net of underlying fund charges but gross of Brooks Macdonald’s management fees and adviser charges. Deduction of these fees and charges will impact on the performance shown.

MPSLow-to-Medium Risk PortfolioIncome and Growth
For further information:T: 02074085501
E: [email protected]: brooksmacdonald.com
Important informationThis document is intended for professional advisers authorised to give financial advice only and should not be relied upon by any persons who do not have professional experience in matters relating to investments.
Brooks Macdonald is responsible for managing the MPS model portfolio on a discretionary basis in accordance with the stated investment objectives and risk profile for the MPS portfolio. The professional adviser is responsible for advising the client as to the selection of an MPS portfolio and for assessing the suitability of the chosen MPS portfolio for the client on an ongoing basis.
Investors should be aware that the price of investments and the income from them can go down as well as up and that neither is guaranteed. Investors may not get back the amount invested. Past performance is not a reliable indicator of future results. Changes in rates of exchange may have an adverse affect on the value, price or income of an investment. Investors should be aware of the additional risks associated with funds investing in smaller companies.
The information in this document does not constitute advice or a recommendation and you should not make any investment decisions on the basis of it. This document is for the information of the recipient only and should not be reproduced, copied or made available to others. Brooks Macdonald, its subsidiaries and/or their officers, directors and employees may also own and trade in the underlying assets.
All performance figures shown on this factsheet are net of underlying funds' OCF but gross of Brooks Macdonald’s management fees and adviser charges. Deduction of these fees and charges will impact on the performance shown.
Please note that changes made within each risk portfolio will affect all clients within that profile simultaneously.
‡MSCI makes no express or implied warranties or representations and shall have no liability whatsoever with respect to any MSCI data contained herein. The MSCI data may not be further redistributed or used as a basis for other indexes or any securities or financial products. This report is not approved, endorsed, reviewed or produced by MSCI. None of the MSCI data is intended to constitute investment advice or a recommendation to make (or refrain from making) any kind of investment decision and may not be relied on as such.
© FinaMetrica Pty Ltd. Risk tolerance scores were mapped to the funds’ strategic asset allocations as at 31.12.2019. The mappings are only for use by financial advisers licensed to use FinaMetrica’s risk profiling system and do not constitute financial advice. Financial advisers must satisfy themselves that the funds’ current asset allocations reflect the risk/return expectations of the funds when mapped. Brooks Macdonald does pay FinaMetrica for the mappings in the table however these mappings are calculated independently by FinaMetrica. The stated ‘DT risk level’ is the risk level attributed to the model portfolio by a third party, Distribution Technology Limited (“DT”) following DT’s analysis. The stated ‘DT risk level’ is valid as at the stated date; however, market fluctuations can mean the level of risk in the portfolio might change over time. Brooks Macdonald has not verified the risk level attributed to the model portfolio by DT and makes no warranty as to its accuracy. Accordingly, Brooks Macdonald will not accept any liability arising from any reliance on the stated DT risk level.
This service is provided by Brooks Macdonald Asset Management Limited which is authorised and regulated by the Financial Conduct Authority. Registered in England No 3417519. Registered office: 21 Lombard Street, London, EC3V 9AH.
Brooks Macdonald is a trading name of Brooks Macdonald Group plc used by various companies in the Brooks Macdonald group of companies. Brooks Macdonald Group plc is registered in England No 4402058. Registered office: 21 Lombard Street, London, EC3V 9AH.
BMAM Feb - 20
Brooks Macdonald investment team
Jonathan Webster-SmithDirector,Head of Multi-Asset
Mark ShieldsInvestment Director,Multi-Asset
Frank AtkinsInvestment Manager,Multi-Asset
Alex ChittendenInvestment Manager, Multi-Asset
James HusseyAssistant Portfolio Manager, Multi-Asset
Ratings and awards
This portfolio was analysed by Distribution Technology in February 2020 as having a DT risk level of 4.
Overall sector breakdown
UK Fixed Interest
International Fixed Interest
UK Equities
North American Equities
European Equities
Japan/Far East/Emerging …
International & Thematic Equities
Structured Return
Cash
28.63%
11.76%
17.57%
6.64%
2.89%
3.70%
15.31%
7.75%
5.76%
Portfolio holdingsFund %
Allianz Gilt Yield Fund 8.71
PIMCO Sel UK Income Bond Fund 7.27
Royal London Short Duration Gilts Fund 5.29
Royal London Sterling Credit Fund 7.36
MI TwentyFour AM Dynamic Bond Fund 4.15
Vanguard Global Bond Index Fund 4.22
Vanguard US Government Bond Index Fund 3.39
JOHCM UK Equity Income Fund 4.53
Liontrust Special Situations Fund 4.73
Royal London UK Equity Income Fund 4.60
Vanguard FTSE UK All Share Index UT 3.71
Fidelity Index US Fund 6.64
LF Miton European Opportunities Fund 2.89
L&G Asian Income Trust 3.70
BNY Mellon Global Income Fund 2.87
Fidelity Index World Fund 4.75
Fundsmith Equity 3.85
Guinness Global Equity Income 3.84
AHFM Defined Returns 4.73
IFSL Brooks Macdonald Defensive Cptl Fd 3.02
Cash (£) 5.76
MPSLow-to-Medium Risk PortfolioIncome and Growth (Passive)29.02.2020Platform
Objective
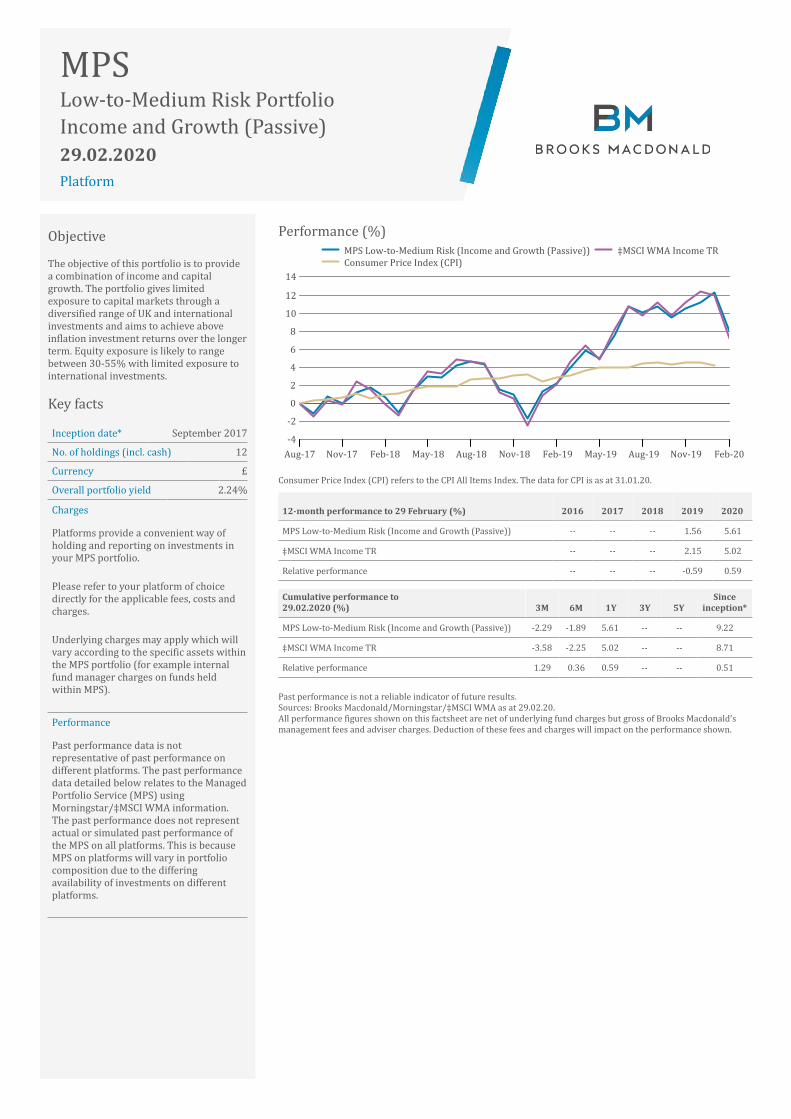
The objective of this portfolio is to provide a combination of income and capital growth. The portfolio gives limited exposure to capital markets through a diversified range of UK and international investments and aims to achieve above inflation investment returns over the longer term. Equity exposure is likely to range between 30-55% with limited exposure to international investments.
Key facts
Inception date* September 2017
No. of holdings (incl. cash) 12
Currency £
Overall portfolio yield 2.24%
Charges
Platforms provide a convenient way of holding and reporting on investments in your MPS portfolio.
Please refer to your platform of choice directly for the applicable fees, costs and charges.
Underlying charges may apply which will vary according to the specific assets within the MPS portfolio (for example internal fund manager charges on funds held within MPS).
Performance
Past performance data is not representative of past performance on different platforms. The past performance data detailed below relates to the Managed Portfolio Service (MPS) using Morningstar/‡MSCI WMA information. The past performance does not represent actual or simulated past performance of the MPS on all platforms. This is because MPS on platforms will vary in portfolio composition due to the differing availability of investments on different platforms.
Performance (%)
Aug-17 Nov-17 Feb-18 May-18 Aug-18 Nov-18 Feb-19 May-19 Aug-19 Nov-19 Feb-20
-4
-2
0
2
4
6
8
10
12
14
MPS Low-to-Medium Risk (Income and Growth (Passive)) ‡MSCI WMA Income TR
Consumer Price Index (CPI)
Consumer Price Index (CPI) refers to the CPI All Items Index. The data for CPI is as at 31.01.20.
12-month performance to 29 February (%) 2016 2017 2018 2019 2020
MPS Low-to-Medium Risk (Income and Growth (Passive)) -- -- -- 1.56 5.61
‡MSCI WMA Income TR -- -- -- 2.15 5.02
Relative performance -- -- -- -0.59 0.59
Cumulative performance to 29.02.2020 (%) 3M 6M 1Y 3Y 5Y
Since inception*
MPS Low-to-Medium Risk (Income and Growth (Passive)) -2.29 -1.89 5.61 -- -- 9.22
‡MSCI WMA Income TR -3.58 -2.25 5.02 -- -- 8.71
Relative performance 1.29 0.36 0.59 -- -- 0.51
Past performance is not a reliable indicator of future results.Sources: Brooks Macdonald/Morningstar/‡MSCI WMA as at 29.02.20. All performance figures shown on this factsheet are net of underlying fund charges but gross of Brooks Macdonald’s management fees and adviser charges. Deduction of these fees and charges will impact on the performance shown.

MPSLow-to-Medium Risk PortfolioIncome and Growth (Passive)
For further information:T: 02074085501
E: [email protected]: brooksmacdonald.com
Important informationThis document is intended for professional advisers authorised to give financial advice only and should not be relied upon by any persons who do not have professional experience in matters relating to investments.
Brooks Macdonald is responsible for managing the MPS model portfolio on a discretionary basis in accordance with the stated investment objectives and risk profile for the MPS portfolio. The professional adviser is responsible for advising the client as to the selection of an MPS portfolio and for assessing the suitability of the chosen MPS portfolio for the client on an ongoing basis.
Investors should be aware that the price of investments and the income from them can go down as well as up and that neither is guaranteed. Investors may not get back the amount invested. Past performance is not a reliable indicator of future results. Changes in rates of exchange may have an adverse affect on the value, price or income of an investment. Investors should be aware of the additional risks associated with funds investing in smaller companies.
The information in this document does not constitute advice or a recommendation and you should not make any investment decisions on the basis of it. This document is for the information of the recipient only and should not be reproduced, copied or made available to others. Brooks Macdonald, its subsidiaries and/or their officers, directors and employees may also own and trade in the underlying assets.
All performance figures shown on this factsheet are net of underlying funds' OCF but gross of Brooks Macdonald’s management fees and adviser charges. Deduction of these fees and charges will impact on the performance shown.
Please note that changes made within each risk portfolio will affect all clients within that profile simultaneously.
‡MSCI makes no express or implied warranties or representations and shall have no liability whatsoever with respect to any MSCI data contained herein. The MSCI data may not be further redistributed or used as a basis for other indexes or any securities or financial products. This report is not approved, endorsed, reviewed or produced by MSCI. None of the MSCI data is intended to constitute investment advice or a recommendation to make (or refrain from making) any kind of investment decision and may not be relied on as such.
© FinaMetrica Pty Ltd. Risk tolerance scores were mapped to the funds’ strategic asset allocations as at 31.12.2019. The mappings are only for use by financial advisers licensed to use FinaMetrica’s risk profiling system and do not constitute financial advice. Financial advisers must satisfy themselves that the funds’ current asset allocations reflect the risk/return expectations of the funds when mapped. Brooks Macdonald does pay FinaMetrica for the mappings in the table however these mappings are calculated independently by FinaMetrica. The stated ‘DT risk level’ is the risk level attributed to the model portfolio by a third party, Distribution Technology Limited (“DT”) following DT’s analysis. The stated ‘DT risk level’ is valid as at the stated date; however, market fluctuations can mean the level of risk in the portfolio might change over time. Brooks Macdonald has not verified the risk level attributed to the model portfolio by DT and makes no warranty as to its accuracy. Accordingly, Brooks Macdonald will not accept any liability arising from any reliance on the stated DT risk level.
This service is provided by Brooks Macdonald Asset Management Limited which is authorised and regulated by the Financial Conduct Authority. Registered in England No 3417519. Registered office: 21 Lombard Street, London, EC3V 9AH.
Brooks Macdonald is a trading name of Brooks Macdonald Group plc used by various companies in the Brooks Macdonald group of companies. Brooks Macdonald Group plc is registered in England No 4402058. Registered office: 21 Lombard Street, London, EC3V 9AH.
BMAM Feb - 20
Brooks Macdonald investment team
Jonathan Webster-SmithDirector,Head of Multi-Asset
Mark ShieldsInvestment Director,Multi-Asset
Frank AtkinsInvestment Manager,Multi-Asset
Alex ChittendenInvestment Manager, Multi-Asset
James HusseyAssistant Portfolio Manager, Multi-Asset
Ratings and awards
This portfolio was analysed by Distribution Technology in February 2020 as having a DT risk level of 4.
Overall sector breakdown
UK Fixed Interest
International Fixed Interest
UK Equities
North American Equities
European Equities
Japan/Far East/Emerging …
International & Thematic Equities
Structured Return
Cash
28.76%
12.08%
17.61%
6.62%
2.85%
3.87%
15.15%
7.54%
5.51%
Portfolio holdingsFund %
L&G Sterling Corporate Bond Index Fund 13.68
Vanguard UK Government Bond Index Fund 15.08
Vanguard Global Bond Index Fund 6.45
Vanguard US Government Bond Index Fund 5.63
HSBC FTSE 250 Index Fund 7.44
Vanguard FTSE UK All Share Index UT 10.17
Fidelity Index US Fund 6.62
L&G European Index Trust 2.85
Vanguard Pacific ex-Japan Stock Index Fd 3.87
Fidelity Index World Fund 15.15
AHFM Defined Returns 7.54
Cash (£) 5.51
MPSMedium Risk PortfolioIncome29.02.2020Platform
Objective
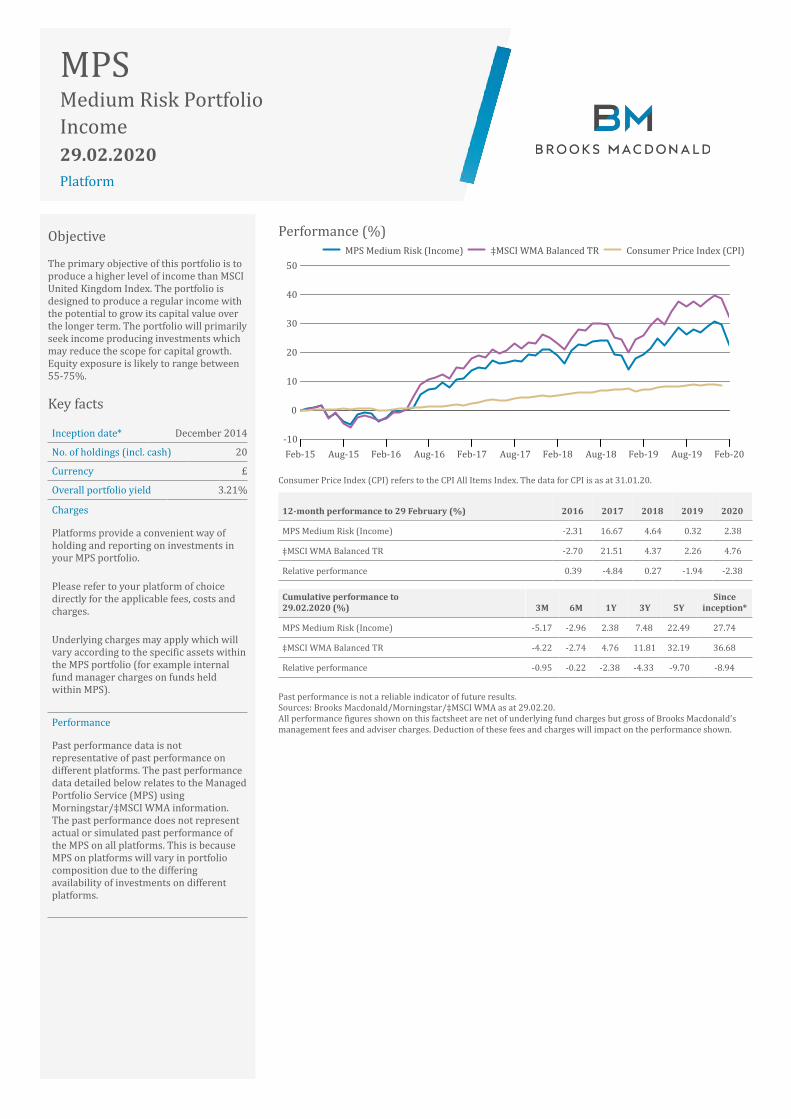
The primary objective of this portfolio is to produce a higher level of income than MSCI United Kingdom Index. The portfolio is designed to produce a regular income with the potential to grow its capital value over the longer term. The portfolio will primarily seek income producing investments which may reduce the scope for capital growth. Equity exposure is likely to range between 55-75%.
Key facts
Inception date* December 2014
No. of holdings (incl. cash) 20
Currency £
Overall portfolio yield 3.21%
Charges
Platforms provide a convenient way of holding and reporting on investments in your MPS portfolio.
Please refer to your platform of choice directly for the applicable fees, costs and charges.
Underlying charges may apply which will vary according to the specific assets within the MPS portfolio (for example internal fund manager charges on funds held within MPS).
Performance
Past performance data is not representative of past performance on different platforms. The past performance data detailed below relates to the Managed Portfolio Service (MPS) using Morningstar/‡MSCI WMA information. The past performance does not represent actual or simulated past performance of the MPS on all platforms. This is because MPS on platforms will vary in portfolio composition due to the differing availability of investments on different platforms.
Performance (%)
Feb-15 Aug-15 Feb-16 Aug-16 Feb-17 Aug-17 Feb-18 Aug-18 Feb-19 Aug-19 Feb-20
-10
0
10
20
30
40
50
MPS Medium Risk (Income) ‡MSCI WMA Balanced TR Consumer Price Index (CPI)
Consumer Price Index (CPI) refers to the CPI All Items Index. The data for CPI is as at 31.01.20.
12-month performance to 29 February (%) 2016 2017 2018 2019 2020
MPS Medium Risk (Income) -2.31 16.67 4.64 0.32 2.38
‡MSCI WMA Balanced TR -2.70 21.51 4.37 2.26 4.76
Relative performance 0.39 -4.84 0.27 -1.94 -2.38
Cumulative performance to 29.02.2020 (%) 3M 6M 1Y 3Y 5Y
Since inception*
MPS Medium Risk (Income) -5.17 -2.96 2.38 7.48 22.49 27.74
‡MSCI WMA Balanced TR -4.22 -2.74 4.76 11.81 32.19 36.68
Relative performance -0.95 -0.22 -2.38 -4.33 -9.70 -8.94
Past performance is not a reliable indicator of future results.Sources: Brooks Macdonald/Morningstar/‡MSCI WMA as at 29.02.20. All performance figures shown on this factsheet are net of underlying fund charges but gross of Brooks Macdonald’s management fees and adviser charges. Deduction of these fees and charges will impact on the performance shown.

MPSMedium Risk PortfolioIncome
For further information:T: 02074085501
E: [email protected]: brooksmacdonald.com
Important informationThis document is intended for professional advisers authorised to give financial advice only and should not be relied upon by any persons who do not have professional experience in matters relating to investments.
Brooks Macdonald is responsible for managing the MPS model portfolio on a discretionary basis in accordance with the stated investment objectives and risk profile for the MPS portfolio. The professional adviser is responsible for advising the client as to the selection of an MPS portfolio and for assessing the suitability of the chosen MPS portfolio for the client on an ongoing basis.
Investors should be aware that the price of investments and the income from them can go down as well as up and that neither is guaranteed. Investors may not get back the amount invested. Past performance is not a reliable indicator of future results. Changes in rates of exchange may have an adverse affect on the value, price or income of an investment. Investors should be aware of the additional risks associated with funds investing in smaller companies.
The information in this document does not constitute advice or a recommendation and you should not make any investment decisions on the basis of it. This document is for the information of the recipient only and should not be reproduced, copied or made available to others. Brooks Macdonald, its subsidiaries and/or their officers, directors and employees may also own and trade in the underlying assets.
All performance figures shown on this factsheet are net of underlying funds' OCF but gross of Brooks Macdonald’s management fees and adviser charges. Deduction of these fees and charges will impact on the performance shown.
Please note that changes made within each risk portfolio will affect all clients within that profile simultaneously.
‡MSCI makes no express or implied warranties or representations and shall have no liability whatsoever with respect to any MSCI data contained herein. The MSCI data may not be further redistributed or used as a basis for other indexes or any securities or financial products. This report is not approved, endorsed, reviewed or produced by MSCI. None of the MSCI data is intended to constitute investment advice or a recommendation to make (or refrain from making) any kind of investment decision and may not be relied on as such.
© FinaMetrica Pty Ltd. Risk tolerance scores were mapped to the funds’ strategic asset allocations as at 31.12.2019. The mappings are only for use by financial advisers licensed to use FinaMetrica’s risk profiling system and do not constitute financial advice. Financial advisers must satisfy themselves that the funds’ current asset allocations reflect the risk/return expectations of the funds when mapped. Brooks Macdonald does pay FinaMetrica for the mappings in the table however these mappings are calculated independently by FinaMetrica. The stated ‘DT risk level’ is the risk level attributed to the model portfolio by a third party, Distribution Technology Limited (“DT”) following DT’s analysis. The stated ‘DT risk level’ is valid as at the stated date; however, market fluctuations can mean the level of risk in the portfolio might change over time. Brooks Macdonald has not verified the risk level attributed to the model portfolio by DT and makes no warranty as to its accuracy. Accordingly, Brooks Macdonald will not accept any liability arising from any reliance on the stated DT risk level.
This service is provided by Brooks Macdonald Asset Management Limited which is authorised and regulated by the Financial Conduct Authority. Registered in England No 3417519. Registered office: 21 Lombard Street, London, EC3V 9AH.
Brooks Macdonald is a trading name of Brooks Macdonald Group plc used by various companies in the Brooks Macdonald group of companies. Brooks Macdonald Group plc is registered in England No 4402058. Registered office: 21 Lombard Street, London, EC3V 9AH.
BMAM Feb - 20
Brooks Macdonald investment team
Jonathan Webster-SmithDirector,Head of Multi-Asset
Mark ShieldsInvestment Director,Multi-Asset
Frank AtkinsInvestment Manager,Multi-Asset
Alex ChittendenInvestment Manager, Multi-Asset
James HusseyAssistant Portfolio Manager, Multi-Asset
Ratings and awards
This portfolio was analysed by Distribution Technology in February 2020 as having a DT risk level of 5.
Overall sector breakdown
UK Fixed Interest
International Fixed Interest
UK Equities
North American Equities
European Equities
Japan/Far East/Emerging Market Equities
International & Thematic Equities
Structured Return
Cash
16.28%
5.80%
23.50%
11.53%
4.96%
8.60%
18.61%
7.05%
3.69%
Portfolio holdingsFund %
Allianz Gilt Yield Fund 5.58
PIMCO Sel UK Income Bond Fund 6.39
Royal London Sterling Credit Fund 4.31
Vanguard US Government Bond Index Fund 5.80
JOHCM UK Equity Income Fund 6.51
Man GLG UK Income Fund 5.62
Royal London UK Equity Income Fund 5.66
Vanguard FTSE UK All Share Index UT 5.71
Fidelity Index US Fund 5.84
JPM US Equity Income Fund 2.87
JPM US Equity Income Fund (Hedged) 2.82
ASI Europe ex UK Income Equity 4.96
Fidelity Index Japan Fund 2.91
L&G Asian Income Trust 5.69
BNY Mellon Global Income Fund 4.91
Fidelity Index World Fund 7.79
Guinness Global Equity Income 5.91
AHFM Defined Returns 2.91
IFSL Brooks Macdonald Defensive Cptl Fd 4.14
Cash (£) 3.69

MPSMedium Risk PortfolioIncome and Growth29.02.2020Platform
Objective
The primary objective of this portfolio is to generate income and capital growth over the longer term. The portfolio will give significant exposure to a range of UK and international investments. Equity exposure is likely to range between 55-75%.
Key facts
Inception date* December 2013
No. of holdings (incl. cash) 24
Currency £
Overall portfolio yield 2.05%
Charges
Platforms provide a convenient way of holding and reporting on investments in your MPS portfolio.
Please refer to your platform of choice directly for the applicable fees, costs and charges.
Underlying charges may apply which will vary according to the specific assets within the MPS portfolio (for example internal fund manager charges on funds held within MPS).
Performance
Past performance data is not representative of past performance on different platforms. The past performance data detailed below relates to the Managed Portfolio Service (MPS) using Morningstar/‡MSCI WMA information. The past performance does not represent actual or simulated past performance of the MPS on all platforms. This is because MPS on platforms will vary in portfolio composition due to the differing availability of investments on different platforms.
Performance (%)
Feb-15 Aug-15 Feb-16 Aug-16 Feb-17 Aug-17 Feb-18 Aug-18 Feb-19 Aug-19 Feb-20
-10
0
10
20
30
40
50
MPS Medium Risk (Income and Growth) ‡MSCI WMA Balanced TR
Consumer Price Index (CPI)
Consumer Price Index (CPI) refers to the CPI All Items Index. The data for CPI is as at 31.01.20.
12-month performance to 29 February (%) 2016 2017 2018 2019 2020
MPS Medium Risk (Income and Growth) -2.86 17.84 7.90 0.97 3.08
‡MSCI WMA Balanced TR -2.70 21.51 4.37 2.26 4.76
Relative performance -0.16 -3.67 3.53 -1.29 -1.68
Cumulative performance to 29.02.2020 (%) 3M 6M 1Y 3Y 5Y
Since inception*
MPS Medium Risk (Income and Growth) -4.33 -2.91 3.08 12.30 28.55 41.11
‡MSCI WMA Balanced TR -4.22 -2.74 4.76 11.81 32.19 47.31
Relative performance -0.11 -0.17 -1.68 0.49 -3.64 -6.20
Past performance is not a reliable indicator of future results.Sources: Brooks Macdonald/Morningstar/‡MSCI WMA as at 29.02.20. All performance figures shown on this factsheet are net of underlying fund charges but gross of Brooks Macdonald’s management fees and adviser charges. Deduction of these fees and charges will impact on the performance shown.

MPSMedium Risk PortfolioIncome and Growth
For further information:T: 02074085501
E: [email protected]: brooksmacdonald.com
Important informationThis document is intended for professional advisers authorised to give financial advice only and should not be relied upon by any persons who do not have professional experience in matters relating to investments.
Brooks Macdonald is responsible for managing the MPS model portfolio on a discretionary basis in accordance with the stated investment objectives and risk profile for the MPS portfolio. The professional adviser is responsible for advising the client as to the selection of an MPS portfolio and for assessing the suitability of the chosen MPS portfolio for the client on an ongoing basis.
Investors should be aware that the price of investments and the income from them can go down as well as up and that neither is guaranteed. Investors may not get back the amount invested. Past performance is not a reliable indicator of future results. Changes in rates of exchange may have an adverse affect on the value, price or income of an investment. Investors should be aware of the additional risks associated with funds investing in smaller companies.
The information in this document does not constitute advice or a recommendation and you should not make any investment decisions on the basis of it. This document is for the information of the recipient only and should not be reproduced, copied or made available to others. Brooks Macdonald, its subsidiaries and/or their officers, directors and employees may also own and trade in the underlying assets.
All performance figures shown on this factsheet are net of underlying funds' OCF but gross of Brooks Macdonald’s management fees and adviser charges. Deduction of these fees and charges will impact on the performance shown.
Please note that changes made within each risk portfolio will affect all clients within that profile simultaneously.
‡MSCI makes no express or implied warranties or representations and shall have no liability whatsoever with respect to any MSCI data contained herein. The MSCI data may not be further redistributed or used as a basis for other indexes or any securities or financial products. This report is not approved, endorsed, reviewed or produced by MSCI. None of the MSCI data is intended to constitute investment advice or a recommendation to make (or refrain from making) any kind of investment decision and may not be relied on as such.
© FinaMetrica Pty Ltd. Risk tolerance scores were mapped to the funds’ strategic asset allocations as at 31.12.2019. The mappings are only for use by financial advisers licensed to use FinaMetrica’s risk profiling system and do not constitute financial advice. Financial advisers must satisfy themselves that the funds’ current asset allocations reflect the risk/return expectations of the funds when mapped. Brooks Macdonald does pay FinaMetrica for the mappings in the table however these mappings are calculated independently by FinaMetrica. The stated ‘DT risk level’ is the risk level attributed to the model portfolio by a third party, Distribution Technology Limited (“DT”) following DT’s analysis. The stated ‘DT risk level’ is valid as at the stated date; however, market fluctuations can mean the level of risk in the portfolio might change over time. Brooks Macdonald has not verified the risk level attributed to the model portfolio by DT and makes no warranty as to its accuracy. Accordingly, Brooks Macdonald will not accept any liability arising from any reliance on the stated DT risk level.
This service is provided by Brooks Macdonald Asset Management Limited which is authorised and regulated by the Financial Conduct Authority. Registered in England No 3417519. Registered office: 21 Lombard Street, London, EC3V 9AH.
Brooks Macdonald is a trading name of Brooks Macdonald Group plc used by various companies in the Brooks Macdonald group of companies. Brooks Macdonald Group plc is registered in England No 4402058. Registered office: 21 Lombard Street, London, EC3V 9AH.
BMAM Feb - 20
Brooks Macdonald investment team
Jonathan Webster-SmithDirector,Head of Multi-Asset
Mark ShieldsInvestment Director,Multi-Asset
Frank AtkinsInvestment Manager,Multi-Asset
Alex ChittendenInvestment Manager, Multi-Asset
James HusseyAssistant Portfolio Manager, Multi-Asset
Ratings and awards
This portfolio was analysed by Distribution Technology in February 2020 as having a DT risk level of 5.
Overall sector breakdown
UK Fixed Interest
International Fixed Interest
UK Equities
North American Equities
European Equities
Japan/Far East/Emerging Market Equities
International & Thematic Equities
Structured Return
Cash
16.26%
5.78%
23.74%
11.55%
4.92%
8.58%
18.43%
7.06%
3.68%
Portfolio holdingsFund %
Allianz Gilt Yield Fund 5.57
PIMCO Sel UK Income Bond Fund 5.31
Royal London Sterling Credit Fund 5.38
Vanguard US Government Bond Index Fund 5.78
JOHCM UK Equity Income Fund 4.64
Liontrust Special Situations Fund 3.87
Man GLG Undervalued Assets Fund 3.77
Merian UK Smaller Companies Focus Fund 2.96
Royal London UK Equity Income Fund 3.76
Vanguard FTSE UK All Share Index UT 4.74
Fidelity Index US Fund 8.74
JPM US Equity Income Fund (Hedged) 2.81
LF Miton European Opportunities Fund 4.92
Fidelity Index Japan Fund 2.90
Schroder ISF Asian Total Return 2.65
Stewart Investors Asia Pacific Ldrs Fd 3.03
ASI Global Smaller Companies 2.86
Fidelity Index World Fund 5.83
Fundsmith Equity 3.94
L&G Global Health & Pharma Idx Tr 2.92
L&G Global Technology Index Trust 2.88
AHFM Defined Returns 2.93
IFSL Brooks Macdonald Defensive Cptl Fd 4.13
Cash (£) 3.68

MPSMedium Risk PortfolioIncome and Growth (Passive)29.02.2020Platform
Objective
The primary objective of this portfolio is to generate income and capital growth over the longer term. The portfolio will give significant exposure to a range of UK and international investments. Equity exposure is likely to range between 55-75%.
Key facts
Inception date* June 2011
No. of holdings (incl. cash) 16
Currency £
Overall portfolio yield 2.18%
Charges
Platforms provide a convenient way of holding and reporting on investments in your MPS portfolio.
Please refer to your platform of choice directly for the applicable fees, costs and charges.
Underlying charges may apply which will vary according to the specific assets within the MPS portfolio (for example internal fund manager charges on funds held within MPS).
Performance
Past performance data is not representative of past performance on different platforms. The past performance data detailed below relates to the Managed Portfolio Service (MPS) using Morningstar/‡MSCI WMA information. The past performance does not represent actual or simulated past performance of the MPS on all platforms. This is because MPS on platforms will vary in portfolio composition due to the differing availability of investments on different platforms.
Performance (%)
Feb-15 Aug-15 Feb-16 Aug-16 Feb-17 Aug-17 Feb-18 Aug-18 Feb-19 Aug-19 Feb-20
-10
0
10
20
30
40
50
MPS Medium Risk (Income and Growth (Passive)) ‡MSCI WMA Balanced TR
Consumer Price Index (CPI)
Consumer Price Index (CPI) refers to the CPI All Items Index. The data for CPI is as at 31.01.20.
12-month performance to 29 February (%) 2016 2017 2018 2019 2020
MPS Medium Risk (Income and Growth (Passive)) -4.90 21.67 5.10 1.46 4.02
‡MSCI WMA Balanced TR -2.70 21.51 4.37 2.26 4.76
Relative performance -2.20 0.16 0.73 -0.80 -0.74
Cumulative performance to 29.02.2020 (%) 3M 6M 1Y 3Y 5Y
Since inception*
MPS Medium Risk (Income and Growth (Passive)) -4.13 -2.98 4.02 10.92 28.34 73.34
‡MSCI WMA Balanced TR -4.22 -2.74 4.76 11.81 32.19 80.15
Relative performance 0.09 -0.24 -0.74 -0.89 -3.85 -6.81
Past performance is not a reliable indicator of future results.Sources: Brooks Macdonald/Morningstar/‡MSCI WMA as at 29.02.20. All performance figures shown on this factsheet are net of underlying fund charges but gross of Brooks Macdonald’s management fees and adviser charges. Deduction of these fees and charges will impact on the performance shown.

MPSMedium Risk PortfolioIncome and Growth (Passive)
For further information:T: 02074085501
E: [email protected]: brooksmacdonald.com
Important informationThis document is intended for professional advisers authorised to give financial advice only and should not be relied upon by any persons who do not have professional experience in matters relating to investments.
Brooks Macdonald is responsible for managing the MPS model portfolio on a discretionary basis in accordance with the stated investment objectives and risk profile for the MPS portfolio. The professional adviser is responsible for advising the client as to the selection of an MPS portfolio and for assessing the suitability of the chosen MPS portfolio for the client on an ongoing basis.
Investors should be aware that the price of investments and the income from them can go down as well as up and that neither is guaranteed. Investors may not get back the amount invested. Past performance is not a reliable indicator of future results. Changes in rates of exchange may have an adverse affect on the value, price or income of an investment. Investors should be aware of the additional risks associated with funds investing in smaller companies.
The information in this document does not constitute advice or a recommendation and you should not make any investment decisions on the basis of it. This document is for the information of the recipient only and should not be reproduced, copied or made available to others. Brooks Macdonald, its subsidiaries and/or their officers, directors and employees may also own and trade in the underlying assets.
All performance figures shown on this factsheet are net of underlying funds' OCF but gross of Brooks Macdonald’s management fees and adviser charges. Deduction of these fees and charges will impact on the performance shown.
Please note that changes made within each risk portfolio will affect all clients within that profile simultaneously.
‡MSCI makes no express or implied warranties or representations and shall have no liability whatsoever with respect to any MSCI data contained herein. The MSCI data may not be further redistributed or used as a basis for other indexes or any securities or financial products. This report is not approved, endorsed, reviewed or produced by MSCI. None of the MSCI data is intended to constitute investment advice or a recommendation to make (or refrain from making) any kind of investment decision and may not be relied on as such.
© FinaMetrica Pty Ltd. Risk tolerance scores were mapped to the funds’ strategic asset allocations as at 31.12.2019. The mappings are only for use by financial advisers licensed to use FinaMetrica’s risk profiling system and do not constitute financial advice. Financial advisers must satisfy themselves that the funds’ current asset allocations reflect the risk/return expectations of the funds when mapped. Brooks Macdonald does pay FinaMetrica for the mappings in the table however these mappings are calculated independently by FinaMetrica. The stated ‘DT risk level’ is the risk level attributed to the model portfolio by a third party, Distribution Technology Limited (“DT”) following DT’s analysis. The stated ‘DT risk level’ is valid as at the stated date; however, market fluctuations can mean the level of risk in the portfolio might change over time. Brooks Macdonald has not verified the risk level attributed to the model portfolio by DT and makes no warranty as to its accuracy. Accordingly, Brooks Macdonald will not accept any liability arising from any reliance on the stated DT risk level.
This service is provided by Brooks Macdonald Asset Management Limited which is authorised and regulated by the Financial Conduct Authority. Registered in England No 3417519. Registered office: 21 Lombard Street, London, EC3V 9AH.
Brooks Macdonald is a trading name of Brooks Macdonald Group plc used by various companies in the Brooks Macdonald group of companies. Brooks Macdonald Group plc is registered in England No 4402058. Registered office: 21 Lombard Street, London, EC3V 9AH.
BMAM Feb - 20
Brooks Macdonald investment team
Jonathan Webster-SmithDirector,Head of Multi-Asset
Mark ShieldsInvestment Director,Multi-Asset
Frank AtkinsInvestment Manager,Multi-Asset
Alex ChittendenInvestment Manager, Multi-Asset
James HusseyAssistant Portfolio Manager, Multi-Asset
Ratings and awards
This portfolio was analysed by Distribution Technology in February 2020 as having a DT risk level of 5.
Overall sector breakdown
UK Fixed Interest
International Fixed Interest
UK Equities
North American Equities
European Equities
Japan/Far East/Emerging Market Equities
International & Thematic Equities
Structured Return
Cash
16.40%
5.61%
23.75%
11.68%
4.87%
8.94%
18.39%
6.82%
3.52%
Portfolio holdingsFund %
L&G Sterling Corporate Bond Index Fund 7.54
Vanguard UK Government Bond Index Fund 8.86
Vanguard Global Bond Index Fund 3.30
Vanguard US Government Bond Index Fund 2.31
HSBC FTSE 250 Index Fund 11.44
Vanguard FTSE UK All Share Index UT 12.31
Fidelity Index US Fund 7.75
Vanguard US Equity Index Fund 3.93
L&G European Index Trust 4.87
Fidelity Index Japan Fund 2.90
Vanguard Pacific ex-Japan Stock Index Fd 6.04
Fidelity Index World Fund 12.61
L&G Global Health & Pharma Idx Tr 2.91
L&G Global Technology Index Trust 2.87
AHFM Defined Returns 6.82
Cash (£) 3.52

MPSMedium-to-High Risk PortfolioGrowth29.02.2020Platform
Objective
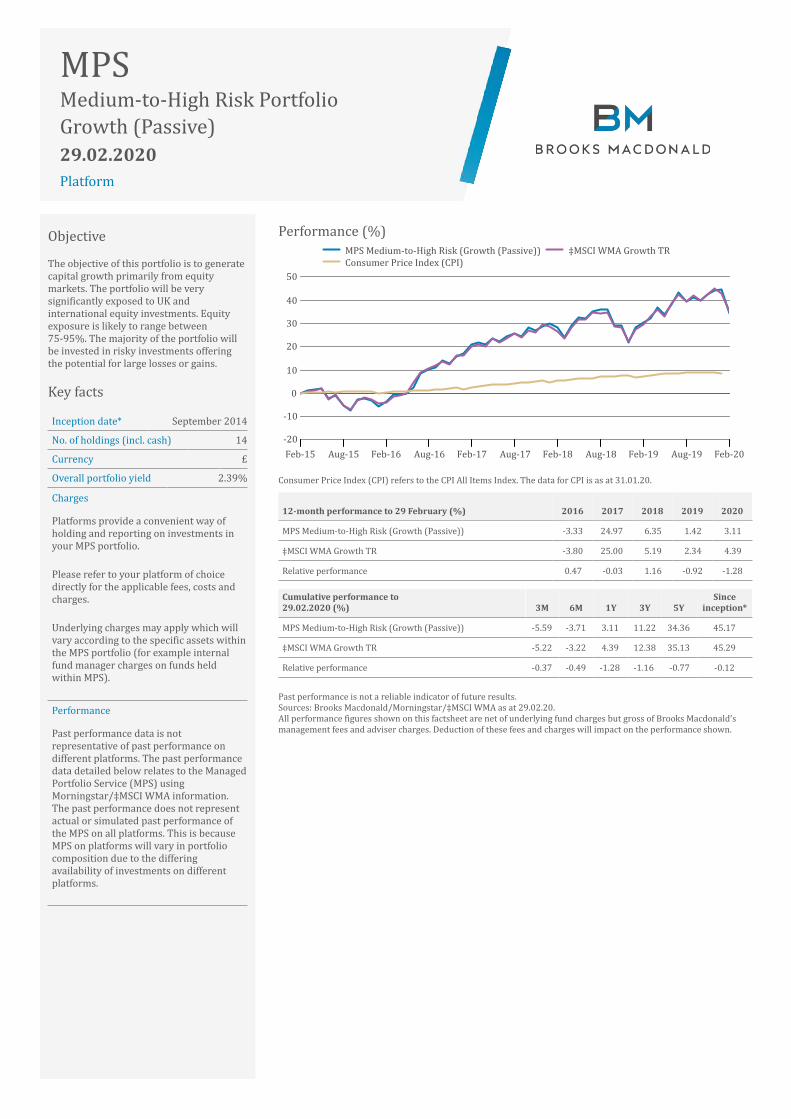
The objective of this portfolio is to generate capital growth primarily from equity markets. The portfolio will be very significantly exposed to UK and international equity investments. Equity exposure is likely to range between 75-95%. The majority of the portfolio will be invested in risky investments offering the potential for large losses or gains.
Key facts
Inception date* December 2013
No. of holdings (incl. cash) 25
Currency £
Overall portfolio yield 1.87%
Charges
Platforms provide a convenient way of holding and reporting on investments in your MPS portfolio.
Please refer to your platform of choice directly for the applicable fees, costs and charges.
Underlying charges may apply which will vary according to the specific assets within the MPS portfolio (for example internal fund manager charges on funds held within MPS).
Performance
Past performance data is not representative of past performance on different platforms. The past performance data detailed below relates to the Managed Portfolio Service (MPS) using Morningstar/‡MSCI WMA information. The past performance does not represent actual or simulated past performance of the MPS on all platforms. This is because MPS on platforms will vary in portfolio composition due to the differing availability of investments on different platforms.
Performance (%)
Feb-15 Aug-15 Feb-16 Aug-16 Feb-17 Aug-17 Feb-18 Aug-18 Feb-19 Aug-19 Feb-20
-10
0
10
20
30
40
50
MPS Medium-to-High Risk (Growth) ‡MSCI WMA Growth TR
Consumer Price Index (CPI)
Consumer Price Index (CPI) refers to the CPI All Items Index. The data for CPI is as at 31.01.20.
12-month performance to 29 February (%) 2016 2017 2018 2019 2020
MPS Medium-to-High Risk (Growth) -1.36 20.08 9.14 1.68 3.02
‡MSCI WMA Growth TR -3.80 25.00 5.19 2.34 4.39
Relative performance 2.44 -4.92 3.95 -0.66 -1.37
Cumulative performance to 29.02.2020 (%) 3M 6M 1Y 3Y 5Y
Since inception*
MPS Medium-to-High Risk (Growth) -5.90 -3.72 3.02 14.31 35.41 48.93
‡MSCI WMA Growth TR -5.22 -3.22 4.39 12.38 35.13 50.17
Relative performance -0.68 -0.50 -1.37 1.93 0.28 -1.24
Past performance is not a reliable indicator of future results.Sources: Brooks Macdonald/Morningstar/‡MSCI WMA as at 29.02.20. All performance figures shown on this factsheet are net of underlying fund charges but gross of Brooks Macdonald’s management fees and adviser charges. Deduction of these fees and charges will impact on the performance shown.

MPSMedium-to-High Risk PortfolioGrowth
For further information:T: 02074085501
E: [email protected]: brooksmacdonald.com
Important informationThis document is intended for professional advisers authorised to give financial advice only and should not be relied upon by any persons who do not have professional experience in matters relating to investments.
Brooks Macdonald is responsible for managing the MPS model portfolio on a discretionary basis in accordance with the stated investment objectives and risk profile for the MPS portfolio. The professional adviser is responsible for advising the client as to the selection of an MPS portfolio and for assessing the suitability of the chosen MPS portfolio for the client on an ongoing basis.
Investors should be aware that the price of investments and the income from them can go down as well as up and that neither is guaranteed. Investors may not get back the amount invested. Past performance is not a reliable indicator of future results. Changes in rates of exchange may have an adverse affect on the value, price or income of an investment. Investors should be aware of the additional risks associated with funds investing in smaller companies.
The information in this document does not constitute advice or a recommendation and you should not make any investment decisions on the basis of it. This document is for the information of the recipient only and should not be reproduced, copied or made available to others. Brooks Macdonald, its subsidiaries and/or their officers, directors and employees may also own and trade in the underlying assets.
All performance figures shown on this factsheet are net of underlying funds' OCF but gross of Brooks Macdonald’s management fees and adviser charges. Deduction of these fees and charges will impact on the performance shown.
Please note that changes made within each risk portfolio will affect all clients within that profile simultaneously.
‡MSCI makes no express or implied warranties or representations and shall have no liability whatsoever with respect to any MSCI data contained herein. The MSCI data may not be further redistributed or used as a basis for other indexes or any securities or financial products. This report is not approved, endorsed, reviewed or produced by MSCI. None of the MSCI data is intended to constitute investment advice or a recommendation to make (or refrain from making) any kind of investment decision and may not be relied on as such.
© FinaMetrica Pty Ltd. Risk tolerance scores were mapped to the funds’ strategic asset allocations as at 31.12.2019. The mappings are only for use by financial advisers licensed to use FinaMetrica’s risk profiling system and do not constitute financial advice. Financial advisers must satisfy themselves that the funds’ current asset allocations reflect the risk/return expectations of the funds when mapped. Brooks Macdonald does pay FinaMetrica for the mappings in the table however these mappings are calculated independently by FinaMetrica. The stated ‘DT risk level’ is the risk level attributed to the model portfolio by a third party, Distribution Technology Limited (“DT”) following DT’s analysis. The stated ‘DT risk level’ is valid as at the stated date; however, market fluctuations can mean the level of risk in the portfolio might change over time. Brooks Macdonald has not verified the risk level attributed to the model portfolio by DT and makes no warranty as to its accuracy. Accordingly, Brooks Macdonald will not accept any liability arising from any reliance on the stated DT risk level.
This service is provided by Brooks Macdonald Asset Management Limited which is authorised and regulated by the Financial Conduct Authority. Registered in England No 3417519. Registered office: 21 Lombard Street, London, EC3V 9AH.
Brooks Macdonald is a trading name of Brooks Macdonald Group plc used by various companies in the Brooks Macdonald group of companies. Brooks Macdonald Group plc is registered in England No 4402058. Registered office: 21 Lombard Street, London, EC3V 9AH.
BMAM Feb - 20
Brooks Macdonald investment team
Jonathan Webster-SmithDirector,Head of Multi-Asset
Mark ShieldsInvestment Director,Multi-Asset
Frank AtkinsInvestment Manager,Multi-Asset
Alex ChittendenInvestment Manager, Multi-Asset
James HusseyAssistant Portfolio Manager, Multi-Asset
Ratings and awards
This portfolio was analysed by Distribution Technology in February 2020 as having a DT risk level of 6.
Overall sector breakdown
UK Fixed Interest
UK Equities
North American Equities
European Equities
Japan/Far East/Emerging Market Equities
International & Thematic Equities
Structured Return
Cash
6.74%
27.44%
15.96%
7.05%
14.72%
21.82%
4.01%
2.25%
Portfolio holdingsFund %
Allianz Gilt Yield Fund 3.43
Royal London Sterling Credit Fund 3.31
JOHCM UK Equity Income Fund 4.76
Liontrust Special Situations Fund 4.97
Man GLG Undervalued Assets Fund 4.85
Merian UK Smaller Companies Focus Fund 5.07
Vanguard FTSE UK All Share Index UT 7.79
Fidelity Index US Fund 9.97
JPM US Equity Income Fund (Hedged) 2.89
Morgan Stanley US Advantage Fund 3.10
L&G European Index Trust 3.01
LF Miton European Opportunities Fund 4.04
Baillie Gifford Emerging Markets Gr Fd 1.95
Baillie Gifford Japanese Smaller Coms Fd 2.70
Fidelity Index Japan Fund 2.98
Schroder ISF Asian Total Return 3.97
Stewart Investors Asia Pacific Ldrs Fd 3.12
ASI Global Smaller Companies 3.92
ES R&M Global Recovery Fund 2.89
Fidelity Index World Fund 2.00
Fundsmith Equity 6.07
L&G Global Health & Pharma Idx Tr 3.00
L&G Global Technology Index Trust 3.94
AHFM Defined Returns 4.01
Cash (£) 2.25
MPSMedium-to-High Risk PortfolioGrowth (Passive)29.02.2020Platform
Objective
The objective of this portfolio is to generate capital growth primarily from equity markets. The portfolio will be very significantly exposed to UK and international equity investments. Equity exposure is likely to range between 75-95%. The majority of the portfolio will be invested in risky investments offering the potential for large losses or gains.
Key facts
Inception date* September 2014
No. of holdings (incl. cash) 14
Currency £
Overall portfolio yield 2.39%
Charges
Platforms provide a convenient way of holding and reporting on investments in your MPS portfolio.
Please refer to your platform of choice directly for the applicable fees, costs and charges.
Underlying charges may apply which will vary according to the specific assets within the MPS portfolio (for example internal fund manager charges on funds held within MPS).
Performance
Past performance data is not representative of past performance on different platforms. The past performance data detailed below relates to the Managed Portfolio Service (MPS) using Morningstar/‡MSCI WMA information. The past performance does not represent actual or simulated past performance of the MPS on all platforms. This is because MPS on platforms will vary in portfolio composition due to the differing availability of investments on different platforms.
Performance (%)
Feb-15 Aug-15 Feb-16 Aug-16 Feb-17 Aug-17 Feb-18 Aug-18 Feb-19 Aug-19 Feb-20
-20
-10
0
10
20
30
40
50
MPS Medium-to-High Risk (Growth (Passive)) ‡MSCI WMA Growth TR
Consumer Price Index (CPI)
Consumer Price Index (CPI) refers to the CPI All Items Index. The data for CPI is as at 31.01.20.
12-month performance to 29 February (%) 2016 2017 2018 2019 2020
MPS Medium-to-High Risk (Growth (Passive)) -3.33 24.97 6.35 1.42 3.11
‡MSCI WMA Growth TR -3.80 25.00 5.19 2.34 4.39
Relative performance 0.47 -0.03 1.16 -0.92 -1.28
Cumulative performance to 29.02.2020 (%) 3M 6M 1Y 3Y 5Y
Since inception*
MPS Medium-to-High Risk (Growth (Passive)) -5.59 -3.71 3.11 11.22 34.36 45.17
‡MSCI WMA Growth TR -5.22 -3.22 4.39 12.38 35.13 45.29
Relative performance -0.37 -0.49 -1.28 -1.16 -0.77 -0.12
Past performance is not a reliable indicator of future results.Sources: Brooks Macdonald/Morningstar/‡MSCI WMA as at 29.02.20. All performance figures shown on this factsheet are net of underlying fund charges but gross of Brooks Macdonald’s management fees and adviser charges. Deduction of these fees and charges will impact on the performance shown.

MPSMedium-to-High Risk PortfolioGrowth (Passive)
For further information:T: 02074085501
E: [email protected]: brooksmacdonald.com
Important informationThis document is intended for professional advisers authorised to give financial advice only and should not be relied upon by any persons who do not have professional experience in matters relating to investments.
Brooks Macdonald is responsible for managing the MPS model portfolio on a discretionary basis in accordance with the stated investment objectives and risk profile for the MPS portfolio. The professional adviser is responsible for advising the client as to the selection of an MPS portfolio and for assessing the suitability of the chosen MPS portfolio for the client on an ongoing basis.
Investors should be aware that the price of investments and the income from them can go down as well as up and that neither is guaranteed. Investors may not get back the amount invested. Past performance is not a reliable indicator of future results. Changes in rates of exchange may have an adverse affect on the value, price or income of an investment. Investors should be aware of the additional risks associated with funds investing in smaller companies.
The information in this document does not constitute advice or a recommendation and you should not make any investment decisions on the basis of it. This document is for the information of the recipient only and should not be reproduced, copied or made available to others. Brooks Macdonald, its subsidiaries and/or their officers, directors and employees may also own and trade in the underlying assets.
All performance figures shown on this factsheet are net of underlying funds' OCF but gross of Brooks Macdonald’s management fees and adviser charges. Deduction of these fees and charges will impact on the performance shown.
Please note that changes made within each risk portfolio will affect all clients within that profile simultaneously.
‡MSCI makes no express or implied warranties or representations and shall have no liability whatsoever with respect to any MSCI data contained herein. The MSCI data may not be further redistributed or used as a basis for other indexes or any securities or financial products. This report is not approved, endorsed, reviewed or produced by MSCI. None of the MSCI data is intended to constitute investment advice or a recommendation to make (or refrain from making) any kind of investment decision and may not be relied on as such.
© FinaMetrica Pty Ltd. Risk tolerance scores were mapped to the funds’ strategic asset allocations as at 31.12.2019. The mappings are only for use by financial advisers licensed to use FinaMetrica’s risk profiling system and do not constitute financial advice. Financial advisers must satisfy themselves that the funds’ current asset allocations reflect the risk/return expectations of the funds when mapped. Brooks Macdonald does pay FinaMetrica for the mappings in the table however these mappings are calculated independently by FinaMetrica. The stated ‘DT risk level’ is the risk level attributed to the model portfolio by a third party, Distribution Technology Limited (“DT”) following DT’s analysis. The stated ‘DT risk level’ is valid as at the stated date; however, market fluctuations can mean the level of risk in the portfolio might change over time. Brooks Macdonald has not verified the risk level attributed to the model portfolio by DT and makes no warranty as to its accuracy. Accordingly, Brooks Macdonald will not accept any liability arising from any reliance on the stated DT risk level.
This service is provided by Brooks Macdonald Asset Management Limited which is authorised and regulated by the Financial Conduct Authority. Registered in England No 3417519. Registered office: 21 Lombard Street, London, EC3V 9AH.
Brooks Macdonald is a trading name of Brooks Macdonald Group plc used by various companies in the Brooks Macdonald group of companies. Brooks Macdonald Group plc is registered in England No 4402058. Registered office: 21 Lombard Street, London, EC3V 9AH.
BMAM Feb - 20
Brooks Macdonald investment team
Jonathan Webster-SmithDirector,Head of Multi-Asset
Mark ShieldsInvestment Director,Multi-Asset
Frank AtkinsInvestment Manager,Multi-Asset
Alex ChittendenInvestment Manager, Multi-Asset
James HusseyAssistant Portfolio Manager, Multi-Asset
Ratings and awards
This portfolio was analysed by Distribution Technology in February 2020 as having a DT risk level of 6.
Overall sector breakdown
UK Fixed Interest
UK Equities
North American Equities
European Equities
Japan/Far East/Emerging Market Equities
International & Thematic Equities
Structured Return
Cash
6.74%
27.09%
15.89%
6.94%
15.02%
21.68%
3.97%
2.65%
Portfolio holdingsFund %
Vanguard UK Government Bond Index Fund 6.74
HSBC FTSE 250 Index Fund 14.56
Vanguard FTSE UK All Share Index UT 12.53
Fidelity Index US Fund 7.89
Vanguard US Equity Index Fund 8.00
L&G European Index Trust 6.94
Fidelity Index Emerging Markets Fund 1.97
Fidelity Index Japan Fund 5.90
Vanguard Pacific ex-Japan Stock Index Fd 7.15
Fidelity Index World Fund 14.82
L&G Global Health & Pharma Idx Tr 2.96
L&G Global Technology Index Trust 3.90
AHFM Defined Returns 3.97
Cash (£) 2.65

MPSHigh Risk PortfolioGrowth29.02.2020Platform
Objective
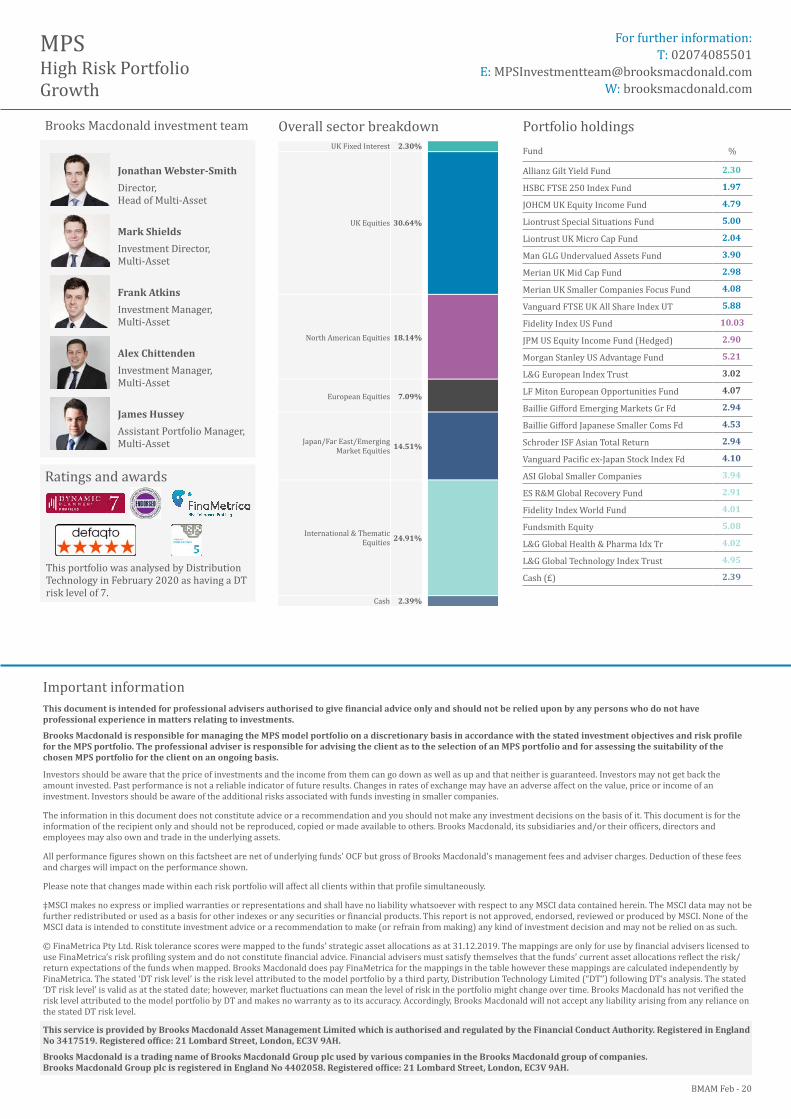
The objective of the portfolio is to grow its value, primarily by investing in equity markets. Equity exposure is likely to range between 90-100%. The portfolio is likely to be fully invested at all times in equities that produce capital growth, with particular emphasis on international equities and on investments that borrow money (leverage) in order to achieve a higher potential investment return. Investing in international equities, which exposes the portfolio to currency fluctuations, and investment techniques that involve borrowing money, both substantially increase the risk that the portfolio represents.
Key facts
Inception date* June 2014
No. of holdings (incl. cash) 25
Currency £
Overall portfolio yield 1.86%
Charges
Platforms provide a convenient way of holding and reporting on investments in your MPS portfolio.
Please refer to your platform of choice directly for the applicable fees, costs and charges.
Underlying charges may apply which will vary according to the specific assets within the MPS portfolio (for example internal fund manager charges on funds held within MPS).
Performance
Past performance data is not representative of past performance on different platforms. The past performance data detailed below relates to the Managed Portfolio Service (MPS) using Morningstar/‡MSCI WMA information. The past performance does not represent actual or simulated past performance of the MPS on all platforms. This is because MPS on platforms will vary in portfolio composition due to the differing availability of investments on different platforms.
Performance (%)
Feb-15 Aug-15 Feb-16 Aug-16 Feb-17 Aug-17 Feb-18 Aug-18 Feb-19 Aug-19 Feb-20
-10
0
10
20
30
40
50
60
MPS High Risk (Growth) ‡MSCI WMA Growth TR Consumer Price Index (CPI)
Consumer Price Index (CPI) refers to the CPI All Items Index. The data for CPI is as at 31.01.20.
12-month performance to 29 February (%) 2016 2017 2018 2019 2020
MPS High Risk (Growth) -3.66 22.48 10.57 1.30 3.89
‡MSCI WMA Growth TR -3.80 25.00 5.19 2.34 4.39
Relative performance 0.14 -2.52 5.38 -1.04 -0.50
Cumulative performance to 29.02.2020 (%) 3M 6M 1Y 3Y 5Y
Since inception*
MPS High Risk (Growth) -5.98 -3.72 3.89 16.37 37.32 52.26
‡MSCI WMA Growth TR -5.22 -3.22 4.39 12.38 35.13 46.06
Relative performance -0.76 -0.50 -0.50 3.99 2.19 6.20
Past performance is not a reliable indicator of future results.Sources: Brooks Macdonald/Morningstar/‡MSCI WMA as at 29.02.20. All performance figures shown on this factsheet are net of underlying fund charges but gross of Brooks Macdonald’s management fees and adviser charges. Deduction of these fees and charges will impact on the performance shown.
MPSHigh Risk PortfolioGrowth
For further information:T: 02074085501
E: [email protected]: brooksmacdonald.com
Important informationThis document is intended for professional advisers authorised to give financial advice only and should not be relied upon by any persons who do not have professional experience in matters relating to investments.
Brooks Macdonald is responsible for managing the MPS model portfolio on a discretionary basis in accordance with the stated investment objectives and risk profile for the MPS portfolio. The professional adviser is responsible for advising the client as to the selection of an MPS portfolio and for assessing the suitability of the chosen MPS portfolio for the client on an ongoing basis.
Investors should be aware that the price of investments and the income from them can go down as well as up and that neither is guaranteed. Investors may not get back the amount invested. Past performance is not a reliable indicator of future results. Changes in rates of exchange may have an adverse affect on the value, price or income of an investment. Investors should be aware of the additional risks associated with funds investing in smaller companies.
The information in this document does not constitute advice or a recommendation and you should not make any investment decisions on the basis of it. This document is for the information of the recipient only and should not be reproduced, copied or made available to others. Brooks Macdonald, its subsidiaries and/or their officers, directors and employees may also own and trade in the underlying assets.
All performance figures shown on this factsheet are net of underlying funds' OCF but gross of Brooks Macdonald’s management fees and adviser charges. Deduction of these fees and charges will impact on the performance shown.
Please note that changes made within each risk portfolio will affect all clients within that profile simultaneously.
‡MSCI makes no express or implied warranties or representations and shall have no liability whatsoever with respect to any MSCI data contained herein. The MSCI data may not be further redistributed or used as a basis for other indexes or any securities or financial products. This report is not approved, endorsed, reviewed or produced by MSCI. None of the MSCI data is intended to constitute investment advice or a recommendation to make (or refrain from making) any kind of investment decision and may not be relied on as such.
© FinaMetrica Pty Ltd. Risk tolerance scores were mapped to the funds’ strategic asset allocations as at 31.12.2019. The mappings are only for use by financial advisers licensed to use FinaMetrica’s risk profiling system and do not constitute financial advice. Financial advisers must satisfy themselves that the funds’ current asset allocations reflect the risk/return expectations of the funds when mapped. Brooks Macdonald does pay FinaMetrica for the mappings in the table however these mappings are calculated independently by FinaMetrica. The stated ‘DT risk level’ is the risk level attributed to the model portfolio by a third party, Distribution Technology Limited (“DT”) following DT’s analysis. The stated ‘DT risk level’ is valid as at the stated date; however, market fluctuations can mean the level of risk in the portfolio might change over time. Brooks Macdonald has not verified the risk level attributed to the model portfolio by DT and makes no warranty as to its accuracy. Accordingly, Brooks Macdonald will not accept any liability arising from any reliance on the stated DT risk level.
This service is provided by Brooks Macdonald Asset Management Limited which is authorised and regulated by the Financial Conduct Authority. Registered in England No 3417519. Registered office: 21 Lombard Street, London, EC3V 9AH.
Brooks Macdonald is a trading name of Brooks Macdonald Group plc used by various companies in the Brooks Macdonald group of companies. Brooks Macdonald Group plc is registered in England No 4402058. Registered office: 21 Lombard Street, London, EC3V 9AH.
BMAM Feb - 20
Brooks Macdonald investment team
Jonathan Webster-SmithDirector,Head of Multi-Asset
Mark ShieldsInvestment Director,Multi-Asset
Frank AtkinsInvestment Manager,Multi-Asset
Alex ChittendenInvestment Manager, Multi-Asset
James HusseyAssistant Portfolio Manager, Multi-Asset
Ratings and awards
This portfolio was analysed by Distribution Technology in February 2020 as having a DT risk level of 7.
Overall sector breakdownUK Fixed Interest
UK Equities
North American Equities
European Equities
Japan/Far East/Emerging Market Equities
International & Thematic Equities
Cash
2.30%
30.64%
18.14%
7.09%
14.51%
24.91%
2.39%
Portfolio holdingsFund %
Allianz Gilt Yield Fund 2.30
HSBC FTSE 250 Index Fund 1.97
JOHCM UK Equity Income Fund 4.79
Liontrust Special Situations Fund 5.00
Liontrust UK Micro Cap Fund 2.04
Man GLG Undervalued Assets Fund 3.90
Merian UK Mid Cap Fund 2.98
Merian UK Smaller Companies Focus Fund 4.08
Vanguard FTSE UK All Share Index UT 5.88
Fidelity Index US Fund 10.03
JPM US Equity Income Fund (Hedged) 2.90
Morgan Stanley US Advantage Fund 5.21
L&G European Index Trust 3.02
LF Miton European Opportunities Fund 4.07
Baillie Gifford Emerging Markets Gr Fd 2.94
Baillie Gifford Japanese Smaller Coms Fd 4.53
Schroder ISF Asian Total Return 2.94
Vanguard Pacific ex-Japan Stock Index Fd 4.10
ASI Global Smaller Companies 3.94
ES R&M Global Recovery Fund 2.91
Fidelity Index World Fund 4.01
Fundsmith Equity 5.08
L&G Global Health & Pharma Idx Tr 4.02
L&G Global Technology Index Trust 4.95
Cash (£) 2.39