low reynolds number flow dynamics of a thin airfoil with...
TRANSCRIPT

Low Reynolds Number Flow Dynamics of a Thin
Airfoil with an Actuated Leading Edge
Kevin J. Drost∗ Heather Johnson∗ Sourabh V. Apte†
James A. Liburdy‡
School of Mechanical Industrial and Manufacturing Engineering, Oregon State University, Corvallis, OR 97331
Use of oscillatory actuation of the leading edge of a thin, flat, rigid airfoil, as a poten-tial mechanism for control or improved performance of a micro-air vehicle (MAV), wasinvestigated by performing direct numerical simulations and experimental measurementsat low Reynolds numbers. The leading edge of the airfoil is hinged at 30% of the chordlength allowing dynamic variations in the effective angle of attack through specified oscilla-tions (flapping). This leading edge actuation results in transient variations in the effectivecamber and angle of attack that can be used to alleviate the strength of the leading edgevortex at high angles of attack. A fictitious-domain based finite volume approach [Apte etal., JCP 2009] was used to compute the moving boundary problem on a fixed backgroundmesh. The flow solver is three-dimensional, parallel, second-order accurate, capable ofusing structured or arbitrarily shaped unstructured meshes and has been validated for arange of canonical test cases including flow over cylinder and sphere at different Reynoldsnumbers, and flow-induced by inline oscillation of a cylinder, as well as flow over a plungingSD7003 airfoil at two Reynolds numbers (1000 and 10,000).
To assess the effect of an actuated leading edge on the flow field and aerodynamic loads,parametric studies were performed on a thin, flat airfoil at 20 degrees angle of attackat low Reynolds number of 14,700 (based on the chord length) using the DNS studies;whereas, wind-tunnel measurements were conducted at higher Reynolds number of 42,000.The actuator was dynamically moved by sinusoidally oscillating around the hinge over arange of reduced frequencies (k=0.57-11.4) and actuation amplitudes. It was found thathigh-frequency, low-amplitude actuation of the leading edge significantly alters the leadingedge boundary-layer and vortex shedding and increases the mean lift-to-drag ratio. Thisstudy indicates that the concept of an actuated leading-edge has potential for developmentof control techniques to stabilize and maneuver MAVs at low Reynolds numbers.
Nomenclature
`a Leading edge actuator length, mc Chord length, mθ Actuator angle, degree∆θ Actuation amplitude, degreef Actuation frequency, Hertzα Angle of attack, degreeαeff Effective angle of attack, degreeRe Reynolds numberCD Drag coefficientCL Lift coefficientk Reduced frequency
∗Graduate Student, Mechanical Engineering, Corvallis OR 97331, and Student Member.†Corresponding Author, Assistant Professor, Mechanical Engineering, 308 Rogers Hall, Corvallis OR 97331, Email:
[email protected].‡James R. Welty Chaired Professor of Fluid Mechanics, Mechanical Engineering, 310 Rogers Hall, Corvallis OR 97331.
1 of 20
American Institute of Aeronautics and Astronautics

SubscriptD DragL Lifta Actuatoreff Effective
I. Introduction
The desire to advance the use of thin, low Re wings at small scales introduces flow dynamics that signif-icantly influence their performance and flow control. At sufficiently high angles of attack during transients,flow over an airfoil separates, which can lead to a ‘dynamic stall’ condition. Dynamic stall, identified by anabrupt change of lift for airfoils in motion and undergoing maneuvers, plays a crucial role in developing acontrol mechanism to maintain large lift-to-drag ratios for thin airfoils. Solutions to this problem will havea variety of applications ranging from newly emerging micro air vehicle (MAV) development to hydrofoils,sails, stabilizers, as well as rotary or flapping wing development.
Figure 1. Schematic of a thin, flat airfoil with a lead-ing edge actuator. An actuator of length (`a) approx-imately 30% of the chord (c) is hinged to the airfoilbody to facilitate change in actuator angle (θ) and theangle of attack (α).
The primary objective of the proposed workis to investigate the potential benefits to the liftand drag characteristics of a flapping leadingedge on thin, flat airfoils at low Reynolds num-bers [O(104)] with and without pitching maneu-vers. In this work, high-fidelity direct numeri-cal simulations (DNS) as well as experimentallift and drag measurements on a thin, flat wingare used to understand the effects of a movablefront actuator on the leading edge vortex shed-ding, separation bubble dynamics and dynamicstall conditions. This work focusses on a fixedwing concept in which a leading edge actuatoris utilized to achieve a weaker separation bub-ble by conditioning the leading edge boundarylayer development during maneuvers (see Fig-ure 1). A thin, flat wing with a movable frontactuator is chosen, since (i) thin airfoil designhas been shown to provide adequate lift conditions for many possible applications, (ii) the leading edge in-stability resulting in unsteady, dynamic stall conditions occurs for this design as well as other more complexairfoils, (iii) a movable front actuator provides a means to directly influence the leading edge stall conditionand unsteady lift behavior while not adding complexities associated with blowing or suction that may notbe practical, for small wings with weight constraints.
As the first step, the chief aim in this work is to parameterize the flow field and vortex dynamics overa range of angles of attack and flap angle for a fixed flap-length to chord ratio at low Reynolds numbersunder steady flow conditions representative of micro-air vehicle operation. The central hypotheses drivingthis work are:
• A movable leading edge actuator provides an effective mechanism to control transients in lift, drag,and pitching moment during steady and transient flow conditions at low Reynolds numbers [O(104)]by reducing the strength of the generated vortex and weakening the separation bubble;
• Actuation time scales and waveforms associated with the actuator motion can positively influencethe lift characteristics by altering the leading-edge vortex shedding, separation-bubble dynamics, anddynamic stall conditions.
The leading edge actuator concept provides (i) camber and a static form modifying the leading edgevortex, and (ii) a dynamic effect when the leading edge is flapped or actuated. The latter is of criticalimportance as recent numerical studies at AFRL1,2 on low Re plunging airfoils indicate that plungingmotion significantly alters the dynamic stall vortex by breaking down the vortex as it plunges against theairfoil surface. High-frequency small-amplitude plunging oscillations of stalled airfoil resulted in elimination
2 of 20
American Institute of Aeronautics and Astronautics

of coherent vortex structures propagating along the airfoil surface. The proposed leading edge actuatormechanism can essentially provide similar modification of the leading edge vortex. Modulating the angularposition of the leading edge actuator, one can modify the effective angle of attack to provide improvedstability under airfoil maneuvers. Control strategies based on the above mentioned leading edge actuatorare of direct relevance to small-size MAVs undergoing maneuvers and are pragmatic as designing simplepiezo-based actuators is straightforward. It is thus crucial to investigate the flow dynamics of the thin airfoilin the presence of an actuator to exploit its potential benefits in designing control strategies. If successful,this simple modification to the wing configuration also facilitates development of actuators and controllersfor airfoils with considerable size and weight restrictions. For instance, typical characteristic lengths forMAV are in the range of 8–15 cm, with operating speeds on the order of 50 km/h. Improving the flightperformance of these vehicles can enhance surveillance, search and rescue, and sensor mobility, while yieldingvehicles that are more disposable.
In this work, direct numerical simulations are performed to investigate the influence of the leading edgeactuation on lift and drag characteristics of high aspect ratio (two-dimensional) wings at a Reynolds numberof [O(104)] with a fixed actuator-length to chord ratio of 0.3. The high aspect ratio wing is selected in order toisolate the effect of the leading edge actuator and not complicate the flow dynamics by tip-vortex interactions,which may be important in some applications. The range of parameters to be considered (α = 00–200, andθ = 00–200, Re = 104–7 × 10⁴) are of direct relevance to the design of unmanned micro-air vehicles atlow Reynolds numbers. Flow parameterization is performed under steady upstream flow conditions. Thenumerical simulations need handling of complex moving boundaries to capture the motion of the actuator.This is accomplished by using a fictitious domain based numerical approach developed by Apte et al.3 Thisapproach is similar to immersed boundary methods and allows simulations of moving boundaries on a fixedgrid. This approach has been implemented into a second-order, co-located grid finite-volume solver.4 Testingand validation of the approach for flow over thin airfoils is conducted by comparing results with high-fidelityapproaches using higher-order immersed boundary methods.
After detailed validation of the numerics as applied to plunging airfoils, effect of variations in the actuatorangles (θ) on the coefficients of lift and drag are obtained for a fixed angle of attack (α); i.e. (CL, CD =G(θ, θ, t)). In order to validate the numerical findings, an experimental setup with actuated leading edge isdeveloped in a wind tunnel allowing detailed lift and drag measurements. In this proof-of-concept study,the numerical simulations are typically restricted to low Reynolds numbers (∼ 10000), owing to the two-dimensionality assumption as well as large grid and computing time requirement. Experimental data, on theother hand, shows low uncertainty and noise at the higher range of low Reynolds number studies (40000–70000).
The paper is arranged as follows. A detailed review and background on past relevant work is discussed insection (II). Details of the computational approach as well as experimental setup are described in section (III).Verification and validation studies of the numerical approach as applied to SD7003 airfoil are discussed next inthe results section (IV). Parametric studies varying the actuation frequency and amplitude at low Reynoldsnumbers (using DNS) and higher Reynolds numbers using (experimental data) are documented next. Finally,the results and conclusions are summarized in section (V).
II. Background
One major concern of thin airfoil design, when operating at high lift and stall conditions, is the unsteadynature of separation at the leading edge resulting in a Kelvin-Helmhotlz type flow instability.5–7 This causesthe generation and convection of low frequency large vortical structures that have a strong influence onunsteady lift. Very early works on flow over hydrofoils and wings8,9 have shown a strong correlation ofpressure in the separation bubble with the onset of stall conditions.
There has been fairly extensive work, both experimental and computational, on flow separation andcontrol for thin airfoils at moderate-to-high Reynolds numbers (Re ≥ 105).7,10–12 A critical angle of attackexists for the occurrence of dynamic stall.11 Separation of the turbulent boundary layer typically is spread,in time and space, and involves a spectrum of states. By mapping the separation into incipient, transitory,and complete detachment,13 the unsteady properties of the separation zone, including the oscillation of thelength of the separation region, have been correlated with the surface pressure.7 Application of suctionnear the leading edge has been shown to delay flow separation and inhibit dynamic stall on thin airfoils.10
Direct numerical studies14,15 on flow over cylinders have shown considerable reduction in lift variation by
3 of 20
American Institute of Aeronautics and Astronautics
using suction to control the vortex shedding. There is a large literature dealing with pulsed and syntheticjets,16–20 plasma discharge based actuation21–26 for flow control applications resulting in increased lift-to-dragratio.
For very low Re [O(100)], the unsteady flow characteristics of thin wings undergoing plunge maneuversshow downstream advection of the leading edge vortex and resultant unsteady lift.27 Other studies duringpitching28–31 and recent computational work based on immersed boundary technique at CalTech on animpulsively started wing32–34 show that vortex shedding, advection, and strength is highly dependent on themaneuvering characteristics.
Extensive studies at low Re [O(102 − 105)] have been carried out to better understand the flow dynamiccharacteristics for stability and control considerations, including pitching and heaving airfoils. The characterof laminar separation, transition and dynamic stall through simulations indicate the role of vortex generation,separation bubble turbulence generation during heaving and that a time averaged laminar separation bubblereacts to changing angle of attack.1,2 At low Re the separation bubble growth increases drag. Correspondingexperimental studies using the same airfoil35,36 provide details of the separation bubble during plunging andits effects on transition. Pitching and plunging has been the focus of low Reynolds number flight37,38 withemphasis on vortex development. Simulations of plunging have also found that vortex advection duringdynamic stall can be greatly influenced by plunge conditions.1
Thin flat airfoils actually delay stall to higher angles of attack when operating at low Re and low aspectratios, although the lift is smaller at lower angles of attack.39 It has been shown that a cambered plate (4%)performs better for Re of 104–105,39 and has a low sensitivity to the trailing edge geometry and turbulenceintensities.40 Although thin airfoils show many advantages at low Re, such as high lift-to-drag ratio, theyexhibit wide fluctuations in lift mainly caused by the unsteady flow separation at the leading edge (41 andreferences therein). The character of this separation is highly unsteady, at fairly low frequencies, and withoutreattachment if the angle of attack is sufficiently large.41 However, most of this work is at comparativelylarger Re (∼ 3×10⁵). As the angle of attack is increased to the stall condition there is a rise in the unsteadycharacter of the lift coefficient, with normalized rms fluctuations on the order of 0.1–0.2. This is in contrastto the unsteady lift coefficients which are on the order of 0.03 for trailing edge stall. The thin airfoil stallversus increasing angle of attack is associated with a drop in lift coefficient, a rise in unsteadiness and asubsequent rise in lift, and it is asserted that the unsteadiness in lift is a direct consequence of the leadingedge separation.41 Effect of impressed acoustic excitation of the airfoil as a method of flow control42 hasbeen investigated to reduce the unsteadiness in lift oscillations. Vorticity mapping, to quantify unsteadyflow associated with airfoil motion, has been used to correlate thrust with shedding frequency.43
For low Re conditions, high lift could be obtained by applying a concave pressure recovery and aftloading,44 using flexible airfoils,45 and/or using boundary layer trips with transition ramps46 leading tofurther improvements in lift-to-drag ratios. Consistent with these observations, it has been shown that thinairfoils can be optimized at ultra-low Reynolds numbers (Re ∼ 103) by modifying the leading edge shapesand conditions. Airfoil shapes with a ‘droop’ near the leading edge provide an increase in effective camberand result in improved lift-to-drag ratios (greater than 16%).47 This may be a result of reducing the leadingedge instability and strongly points to the potential advantages of using a leading edge actuator for controlpurposes.
III. Methodology
In this section, brief descriptions of the computational and experimental methodologies are provided.
A. Computational Approach
The computational algorithm for flow over immersed objects on simple Cartesian grids is based on a fictitiousdomain approach.3,48 In this approach, the entire fluid-rigid body domain is assumed to be an incompressible,but variable density, fluid. The flow inside the fluid region is constrained to be divergence-free for anincompressible fluid, whereas the flow inside the particle (or rigid body) domain is constrained to undergorigid body motion (i.e. involving translation and rotational motions only). For specified motion of the rigidbody, the rigidity constraint force can be readily obtained once the location of the boundary of the rigidbody is identified by making use of Lagrangian marker points (LP) in a banded region surrounding therigid body surface (figure 2). The marker points provide subgrid scale resolution, improving the accuracy
4 of 20
American Institute of Aeronautics and Astronautics

of interpolations between the Lagrangian points and the background grid. Due to rigidity of the movingobject, there is no relative motion between the marker points, and all points move with the same, specifiedvelocity field. The rigidity constaint force is then enforced in a standard fractional step scheme. The basicsof the computational algorithm are given below; for details refer to Apte et al.3,48
The momentum equations together with the incompressibility constraint are:
∂uj
∂xj= 0;
∂ui
∂t+∂ujui
∂xj= −1
ρ
∂p
∂xi+
1ρ
∂τij∂xj
+ gi +1ρFR,i (1)
where τij is the viscous stress tensor, and FR,i is the rigidity constraint force that is present only inside theparticle region to enforce the rigid body motion. These equations are solved using a three-level fractional stepalgorithm. First, the momentum equations are solved, using symmetric, energy conserving discretization.49
The incompressibility constraint is then imposed by solving a pressure Poisson equation (obtained by takingthe divergence of the momentum equation). The algorithm uses symmetric, central differencing for momen-tum fluxes and eliminates the need for any upwind biased stencil for stability. Since rigid objects do notdeform, mass of the two phases are conserved and it has been shown that this scheme has good conservationproperties necessary for turbulent flow simulations.3,48
Figure 2. Use of banded marker pointsto identify the rigid body surface in afictitious-domain approach.3,50
The resultant velocity field can be decomposed into a rigidbody component (uRBM ) and a deformational component (u′);u = uRBM + u′, where uRBM = UT
p + Ωp × r, RBM stands forrigid body motion consisting of translational (UT
p ) and rotationalcomponents, Ωp is the angular rotation rate, and r is the positionvector of an LP with respect to the immersed object centroid.The RBM and rigidity constraint force can be obtained by re-quiring 5·
(D[un+1]
)= 0 in P(t) and D[un+1] ·n = 0 on ∂P(t).
Here, P(t) is the region of the background grid occupied by theobject, ∂P(t) the boundary of the immersed object, D[un+1] isthe symmetric part of the velocity gradient field and n is theunit outward normal on the object surface. The deformation-rate tensor is constrained to be zero making the motion of theregion within rigid domain a RBM. In the present simulations,the rigid body motion of the immersed object is specified andthus UT
p and Ωp are completely known at each time-step. Thisgives the rigid body motion and rigidity constraint force (non-zero only inside the immersed object) as:
FR = −ρpu′/∆t. (2)
The above approach has been implemented in a fully parallel and conservative finite-volume scheme4 foraccurate prediction of turbulent flows and has been verified on a variety of canonical test cases such as flowover a cylinder, sphere and a NACA airfoil to show good predictive capability.3,50 In order to verify thesolver and also assess its predictive capability as applied to flow over airfoils over a range of Reynolds numbers[O(102− 105)], relevant to the operating conditions of micro-air vehicles, a systematic grid refinement studywas performed on a standard test case of flow over SD7003 airfoil. The results are also compared withAFRL’s very high-fidelity solver FDL3DI developed by Visbal and co-workers1,2 and are given below.
B. Experimental Approach
A motor-controlled two-dimensional wing with an actuated leading edge that can be mounted on a stingbalance has been designed for the typical operating conditions of low-Re wings (α0 = 0–20, and θ = 0–20,and tested in the wind tunnel at OSU (figure 3a). A test rig has also been built for wind-tunnel experimentswith simultaneous pitching of the airfoil and flapping of the leading edge. The wind tunnel experimentsfacilitate accurate lift and drag measurements, flow visualization studies and validation data, especially athigher Reynolds numbers of 40000–70000.
The experimental studies were carried out in the low speed recirculating wind tunnel (1.2 m × 1.4 m) atOregon State University with turbulence levels under 1.0%. For measurement of the lift, drag, and pitchingmoment, the wind tunnel is equipped with a Aerolab six component strain gage sting balance with 0.01 lb
5 of 20
American Institute of Aeronautics and Astronautics

Figure 3. Airfoil setup: (a) photograph of the wing mounted in the wind tunnel, (b) side view ofthe wing showing the flapping mechanism for the leading edge actuator, (c) close-up of the ellipticalleading edge.
resolution, maximum 10 lb load and 15 in-lb pitching moment. The system has been reconfigured to collectdata at 1 kHz for transient data analysis (although the present data are collected at 300 Hz). The wing usedin the experimental studies has a chord length of 20 cm and span of 77 cm and was fabricated from a 6.3mm thick Divinycell HT110 core between two 0.6 mm thick carbon fiber sheets. The leading and trailingedges use a 1.5 mm rod to form, through proper sanding of the wing core and surface material, a 1:5 ellipticedge. A leading edge actuator forms the front 30% of the total chord length which can rotate about a 8 mmdiameter fiberglass tube with Robart hinges which provide a smooth transition between the actuator andwing surface. For these studies the wing is held stationary at a prescribed angle of attack while the leadingedge actuator is controlled through a servo-motor system capable of providing an actuator angle from 30
down to 12 up as measured relative to the chord line. Oscillations can be obtained up to 5 Hz using aprescribed input waveform. The data presented used a sine wave with ∆θ = ±5 amplitude centered aboutthe horizontal position. Side plates were positioned along the wing tips to help eliminate any tip effects.
To understand the impact of the actuator performance, a regime map based on experimental measure-ments of CL, CD = F(α, θ, t) is first obtained under steady flow conditions (no actuation). For certain highangles of attack, the lift force on an airfoil varies with time owing to the dynamics of vortex shedding andleading edge separation. The flow characteristics at the leading edge of a thin, flat, low aspect ratio wing atrelatively high angles involving flow separation, vortex generation, and vortex convection have been studiedby the authors in the past at various angles of attack (15-20) using a three-component, time-resolvedPIV.51–55 This study was performed for a static wing without any actuation (i.e. θ = 0).
Static results (i.e. the actuator is not activated, but is held stationary at different angles relative to theangle of attack) of lift for varying actuator angle and angle of attack are shown in figure 4. For large angles ofattack, there exists an actuator angle, that increases with increasing angle of attack, yielding the maximumlift force. This suggests possibilities of a novel control strategy using the leading actuator for improved liftand stability of a thin airfoil undergoing maneuvers. In the present study, for an angle of attack of 20, themean actuator angle was kept at θ = 20 for static as well as dynamic actuation. This configuration is closeto the optimal position for high lift based on the data shown in figure 4.
IV. Results
This section is arranged as follows. First, the computational studies involving verification tests as well asgrid refinement studies on a SD7003 plunging airfoil and comparisons to the work by Visbal and co-workers1,2
are present. Next, validation and parametric studies of leading edge actuation for a thin, flat airfoil arepresented in two parts. First, a static actuation test is considered wherein the actuator is held stationary atan optimal actuation attack relative to the angle of attack. Validation data comparing lift coefficients withavailable experimental data is also presented. Dynamic actuations with prescribed sinusoidal oscillations of
6 of 20
American Institute of Aeronautics and Astronautics

Figure 4. Lift versus angle of attack (α) and actuator (or flap) angle (θ) indicating existence of anoptimal actuator angle for large angles of attack at Re = 70, 000: (a) surface map, (b) contour mapshowing optimal actuator angle for a given angle of attack.
the actuator at different frequencies and amplitudes around the mean actuator position are presented nextfor Re = 14700. Finally, experimental data with dynamic actuation of the leading edge is presented forhigher Reynolds number of Re = 42000.
A. Verification Tests
The fictitious-domain approach was used to simulate flow over a plunging SD7003 airfoil, corresponding tothe high-fildeity simulations by Visbal.1,2 This configuration has also been a subject of several experimentaland numerical studies.37 The case with chord Reynolds numbers of 103 and 104 were investigated. Thistest case is crucial to establish predictive capability of the present solver compared to AFRL’s high-fidelityFDL3DI solver. In addition, it also allows to establish minimum grid resolution requirements to obtaingrid converged results for flat airfoils studied next. This airfoil has a maximum thickness of 8.5% and amaximum camber of 1.45% at 35% chord length. The original sharp trailing edge was rounded with acircular arc of radius (r/c ≈ 0.0004, c is the chord length) corresponding to the simulations by Visbal.2 Theflow conditions correspond to angle of attack (α) of 4, non-dimensional plunge amplitude h0 = h/c = 0.05,reduced frequency of plunging motion, k = πfc/U∞ = 3.93, where U∞ is the free-stream velocity. A rampfunction was used to allow smooth transition to the periodic plunging motion:
h(t) = h0sin[2kF (t)t]; F (t) = 1− e−at; a = 4.6/t0; t0 = 0.5. (3)
Table 1. Grid and time-step resolutions for the SD7003 case used in present study (first three rows) andcomputations by Visbal and co-workers2 (bottom two rows).
Grid ∆x/c (or ∆s/c) ∆y/c (or ∆n/c) ∆tU∞/cBaseline 0.00275 0.00275 0.0002Coarse 0.005 0.005 0.0004
Non-uniform 0.005 0.0008 0.0002Baseline2 0.005 0.00005 0.00005Coarse2 0.01 0.001 0.0001
The grid resolution and time-step used for the present study are given in Table 1. A simple Cartesian gridrefined in a small patch around the airfoil was used. Two grid points were used in the spanwise direction, withperiodic conditions, for this two-dimensional study. Visbal2 used a body-fitted, moving grid, and a sixth-order accurate algorithm with wall-normal resolution of 0.00005 and 0.0001 (non-dimensionalized by chord
7 of 20
American Institute of Aeronautics and Astronautics

Figure 5. Instantaneous, out-of-plane vorticity contours (ωzc/U∞, range ±40) for Re = 10, 000: (a) results byVisbal2 on their baseline grid, (b) present results on baseline grid, (c) present results on non-uniform grid,and (d) present results on coarse grid.
Figure 6. Two-dimensional loads on SD7003 airfoil at two different Reynolds numbers compared with thehigh-fidelity solver, FDL3DI:2 (a,b) Drag and lift coefficients at Re = 1000, (c,d) drag and lift coefficients atRe = 10000. Predictions for baseline, coarse and non-uniform grids are shown.
8 of 20
American Institute of Aeronautics and Astronautics
length) for baseline and coarse grids, respectively. The corresponding resolutions along the airfoil surfacewere 0.005 and 0.01, respectively. For the present simulations, a baseline grid resolution of 0.00275×0.00275was used in axial and vertical directions. The grids were cubical whereas those used by Visbal and co-workers were highly stretched in the wall-normal direction with very high aspect ratio. In the present study,a uniform coarse grid (twice as coarse compared to the baseline grid) was also used. In addition, non-cubicgrids with much finer resolution in vertical direction compared to the axial direction were also used as shownin Table 1. Use of finer resolutions are feasible in the present solver; however, the simulations on thin, flatairfoil as planned in this study used similar resolutions as for the SD7003 case, in order to facilitate severalparametric studies in reasonable time. The time-step used for the present incompressible flow simulations isalso 4-times larger than those used by Visbal2 in his compressible flow solver. The incompressible, pressure-based solver used in the present work allows for large time-steps (CFL ∼ 0.2) with good accuracy withoutany numerical instabilities.
Figure 5 shows contour plots of out-of-plane vorticity at four different phase angles (plotted at midspan)for Re = 10, 000 compared with corresponding plots by Visbal2 showing very good qualitative comparison ofthe vortex structures on the baseline grid. The phases shown correspond to the positions of maximum upwarddisplacement (Phase 0), maximum downward velocity (Phase 1/4), maximum downward displacement (Phase1/2), and maximum upward velocity (Phase 3/4). Due to large effective angle of attack induced by theplunging motion during the downward stroke, leading edge separation occurs on the upper surface creatingcoherent dynamic-stall-like vortices. Two distinct leading-edge vortices are formed above the upper surface.Owing to high-frequency of plunging, these leading edge vortices travel close to the upper surface and preventstall conditions. Due to the vortex-surface interaction, ejection of vorticity of opposite sign from the uppersurface is also observed similar to the work by Visbal and co-workers. Formation of a single leading-edgevortex on the airfoil lower surface is also observed during the upstroke due to large negative angle of attack.All these features relate closely on the present baseline grid compared to those observed by Visbal and co-workers. Some deviations of vortex structures in the wake region are observed for the non-uniform or coarsegrids; however, around the airfoil surface, all grids seem to provide similar flow structures. This is furtherconfirmed by comparing the temporal evolution of lift and drag coefficients for Re = 1000 and Re = 10, 000.
Quantitative comparison of the lift and drag coefficients were also obtained for Re = 103, 104 as shownin figure 6. It is seen that, for both Reynolds numbers the loads are well predicted. The drag coefficient isslightly under-predicted for Re = 10000, near the phase 3/4 of the periodic cycle. This may be attributedto the coarser wall-normal resolution in the present simulations compared to those by Visbal.2 However,the asymmetric nature of the drag coefficient (especially for Re = 10000) is capture by present simulations.This asymmetry actually results in mean thrust for these high-frequency plunging cases. This case study alsoverifies the predictive capability of the present solver on grids comparable to those used in the thin airfoilstudy described below.
B. Flow Over Thin Flat Airfoil With and Without Leading Edge ActuationFlow over a thin, flat airfoil at Re = 14700 and an angle of attack (α) of 20 is investigated. The chordlength (c) is 20 cm, the thickness to chord ratio is 0.02, and the actuator length to chord ratio is 0.3. Theairfoil has elliptical rounded edges with a height to length ratio of 1:5. In order to run simulations on anairfoil, first a computational model must be generated. Figure 3b shows the existing physical model.
The numerical model of the airfoil was created by distributing material points along the surface of theairfoil. The airfoil surface was defined by breaking the airfoil up into simpler shapes. The entire airfoil isgenerated at an angle of attack of zero with an actuator angle of zero. The material points are then rotatedto the appropriate angle of attack. The five component shapes are an ellipse for the trailing edge, a linesegment for the body of the airfoil, a semicircle for the hinge joint, a line segment for the flap body, andan ellipse for the leading edge. The origin for the airfoil is located at the trailing edge with the front of theairfoil pointed to the left (negative x direction). Due to the symmetry of the airfoil, for each point placedon the top surface of the airfoil, another is placed on the bottom surface by mirroring the top point acrossthe x-axis. The airfoil is given depth by copying the points from the first cross-section to make additionalcross-sections in the spanwise direction. The ellipses for the leading and trailing edges are generated usingthe following equation for an ellipse, the thickness of the airfoil, and the ratio of length to height:
(x− xo)2
12rt
2c
+ y2/t2c = 1, (4)
9 of 20
American Institute of Aeronautics and Astronautics

where xo is the x location of the center of the ellipse, r is the length-to-height ratio (5 in this case) of theellipse, and tc is the thickness of the airfoil. The x locations of the material points are spaced evenly betweenthe tip of the ellipse and the center. The y location is solved for using the above equation. The xc for thetrailing edge and leading edge are (−tcr/2) and (tcr/2c), respectively, where c is the chord length. Nextthe flat airfoil and actuator sections are added. Each flat section is generated by equally spacing materialpoints along the flat surface. The airfoil flat surface extends from the end of the trailing edge ellipse to thestart of the actuator hinge, and similarly, from the end of the actuator hinge to the end of the leading edgeellipse. Next the hinge material points are added. The hinge height and width are equal to the thicknessof the airfoil. The hinge is formed by fitting two semi-circles into the gap between the airfoil surface andthe flap surface. The semicircles are created tangent to both the flap and airfoil surfaces to create a smoothtransition. The upper and lower semicircles are concentric. While adding the semi-circle to the underside ofthe airfoil does not match the shape of an actual hinge, the benefit is that the front actuator can be movedsmoothly without the need to add material points. The final step is to rotate all the material points aroundthe trailing edge by the specified angle of attack.
Grid resolutions used in the present calculations are given in Table 2. The baseline resolution is finerthan that used for corresponding studies on the plunging SD7003 as discussed earlier. A coarse grid is alsoemployed wherein, the grid resolution is coarsened in the streamwise direction. The effect of leading edgeactuation is studied in two-steps: (i) static actuation; wherein, the leading edge actuator is held static at anangle relative to the angle of attack and altering the effective angle of attack, and (ii) dynamic actuation;wherein, the leading edge actuator is oscillated sinusoidally at different frequencies and amplitudes arounda mean actuator position.
Table 2. Cartesian grid resolution and time-steps for thin, flat airfoil studies.
Grid ∆x/c ∆y/c ∆tU∞/cBaseline 0.00166 0.00166 0.000125
Coarse (Non-Uniform) 0.005 0.00166 0.00025
1. Static Actuation Tests
As the first step, effect of the static actuation of the leading edge on the flowfield is investigated. Theactuation angle (θ) (measured anti-clockwise from the axis of the airfoil) is set to 20, giving an effectiveangle of attack of αeff = 13.77. This static actuation provides an effective camber to the airfoil and isexpected to reduce flow separation and drag. Effect on the lift coefficient and mean lift-to-drag ratio areinvestigated. In order to provide a baseline case for aerodynamic load comparison, flow over a thin flat airfoilwith no actuation (i.e. θ = 0) is considered in the numerical studies at Re = 14700. Obtaining experimentaldata at low Reynolds numbers is difficult in a wind-tunnel owing to small values of the drag and lift forcesand thus increased uncertainty in their measurement. Maintaining constant low flow rate is also of concern.Hence, experimental data was collected at Re = 42000 and 70000 and different angles of attack and actuatorangles. Table 3 compares the predicted lift coefficients for two different angles of attack and actuator angleset at θ = 10 with the experimental values. The comparison is reasonable and is within the uncertainty ofthe experimental measurement.
Table 3. Comparison of lift coefficients between present numerical and experimental studies for different anglesof attack and actuator angle of θ = 10 at Re = 70, 000.
Angle of Attack CL experimental CL numerical10 0.79 0.8514 1.06 1.16
Having established a baseline validation for aerodynamic loads on the thin, flat airfoil; the static actuationtest was computed at lower Reynolds number of Re = 14, 700. The effect of static actuation of the leadingedge, with θ = 20 for an angle of attack (α) of 20, was first investigated. In this configuration, the leadingedge remains horizontal and parallel to the incoming flow. The effective angle of attack is reduced to 13.77.
10 of 20
American Institute of Aeronautics and Astronautics

This allows the flow to develop on the leading edge and results in a smaller wake region. Figure 7 showstemporal evolution of out-of-plane vorticity contours for θ = 0 (no actuation) and θ = 20 (static actuation).With no actuation at an angle of attack of 20, highly separated and stalled flowfield is observed. The flowseparates at the tip of the leading edge and the resultant vortices are convected downstream, parallel to theflow. A strong trailing edge vortex is also formed which interferes with the traveling vortex on the leadingedge, giving rise to complex vortical flow features. When the leading edge is actuated in a static manner (i.e.θ = 20), the flow comes parallel to the leading edge. Flow separation is not as drastic as in the no actuationcase. In this case, three distinct vortices are formed on the upper surface. These vortices travel very closeto the upper surface, reducing the extent of the wake region. As the vortices pass the hinge region, they arethrown away from the surface and some vortex pairing is observed. These traveling vortices then interactwith trailing edge vortex; however, remain fairly close to the upper surface of the wing.
Figure 7. Effect of static actuation of the leading edge on flow structure as well as lift and drag for α = 20,Re = 14700. Top panel: out-of-plane vorticity contours (ωzc/U∞ = ±60) for θ = 0, Bottom pannel: out-of-planevorticity for θ = 20 (snapshots are tU∞/c = 2.06 apart).
Figure 8 shows the effect of static actuation on the aerodynamic loads. For no actuation, the lift and dragcoefficients vary significantly for this high angle of attack, showing fluctuations due to passage of vorticalstructures past the leading edge. The flow is highly separated and stalled with a large wake region resultinglarge fluctuations in the aerodynamic loads. With simple static actuation, the magnitude of the mean dragcoefficient is reduced (from 0.502 without actuation to 0.369 with actuation), whereas the mean lift coefficientis not altered significantly (from 1.03 without actuation to 0.97 with actuation). Also with static actuation,the range over which the lift and drag coefficients oscillate are reduced significantly. The mean lift-to-dragratio is increased from 2.06 (without actuation) to 2.63 (with actuation), a 27.67% increase. However, boththe lift and drag coefficients indicate rapid temporal variations due to passage of vortical structures andvortex-surface interactions. These results are obtained on the baseline grid, with similar levels of increase inmean lift-to-drag ratio shown by the coarse grid.
2. Dynamic Actuation Tests
Based on the static actuation of the leading edge, the effective angle of attack was altered which loweredthe drag coefficient without significantly altering the lift coefficient. In addition, the extent of fluctuationsin drag and lift coefficients were reduced significantly compared to no actuation. However, aerodynamicloads fluctuate rapidly in an uncontrolled manner. By flapping the leading edge actuator dynamically, itis hypothesized that the lift and drag coefficients can be varied in a more controlled manner. In order toinvestigate this, as the second step, sinusoidal actuation of the leading edge at different frequencies (1, 3, 5,10, and 20 Hz), corresponding to the reduced frequencies of k = πfc/U∞ = 0.57, 1.71, 2.86, 5.71, and 11.4,respectively, is performed.
For the SD7003 plunging case, it was observed that low amplitude, high frequency plunging motionresults in a net negative drag (or thrust) owing to the plunging motion.2 However, plunging the entire wingfor a MAV is difficult in practice owing to high power requirements. In order to investigate if the morepractical flapping motion of the leading edge actuator can result in net thrust, the airfoil was placed at zeroangle of attack (α = 0), and the leading edge is flapped around the mean horizontal position at differentfrequencies and amplitudes.
Figure 9 shows the flow structure and evolution of the out-of-plane vorticity at different phase angles
11 of 20
American Institute of Aeronautics and Astronautics
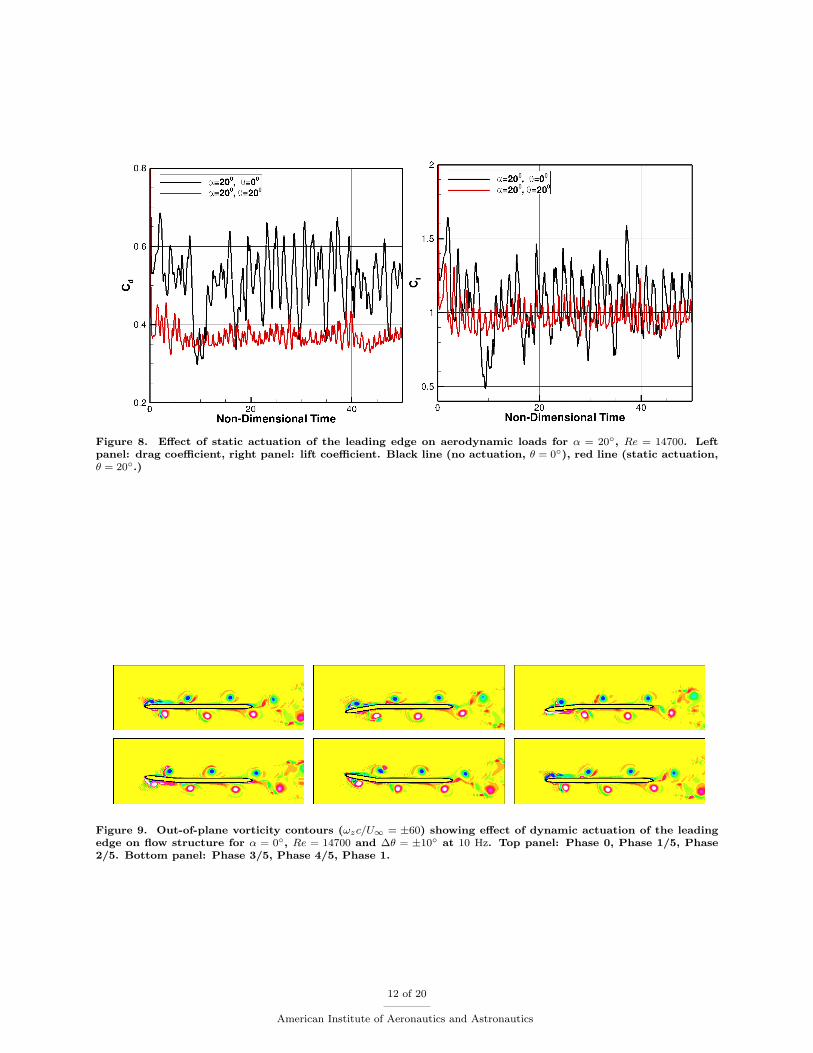
Figure 8. Effect of static actuation of the leading edge on aerodynamic loads for α = 20, Re = 14700. Leftpanel: drag coefficient, right panel: lift coefficient. Black line (no actuation, θ = 0), red line (static actuation,θ = 20.)
Figure 9. Out-of-plane vorticity contours (ωzc/U∞ = ±60) showing effect of dynamic actuation of the leadingedge on flow structure for α = 0, Re = 14700 and ∆θ = ±10 at 10 Hz. Top panel: Phase 0, Phase 1/5, Phase2/5. Bottom panel: Phase 3/5, Phase 4/5, Phase 1.
12 of 20
American Institute of Aeronautics and Astronautics

(a) Phase 0, 10 Hz (b) Phase 0, 5 Hz (c) Phase 0, 1 Hz
(d) Phase 1/5, 10 Hz (e) Phase 1/5, 5 Hz (f) Phase 1/5, 1 Hz
(g) Phase 2/5, 10 Hz (h) Phase 2/5, 5 Hz (i) Phase 2/5, 1 Hz
(j) Phase 3/5, 10 Hz (k) Phase 3/5, 5 Hz (l) Phase 3/5, 1 Hz
(m) Phase 4/5, 10 Hz (n) Phase 4/5, 5 Hz (o) Phase 4/5, 1 Hz
Figure 10. Out-of-plane vorticity contours (ωzc/U∞ = ±60) showing effect of dynamic actuation of the leadingedge (∆θ = ±5) on flow structure for α = 20, Re = 14700. Left panel: 10 Hz (k = 5.71), middle panel: 5 Hz(k = 2.86), right panel: 1 Hz (k = 0.57) showing different phases of the actuation cycle.
13 of 20
American Institute of Aeronautics and Astronautics

for an actuation at 10 Hz and amplitude of 10 at Re = 14700. It is observed from the vorticity contoursthat the oscillatory actuation creates periodic vorticies which pass along the airfoil resulting in oscillatoryvariations in lift and drag coefficients. For the actuator length to chord ratio of 30%, it was found that thesinusoidal actuation resulted in a small net mean drag and also a positive mean lift. This study shows thatthe present actuation does not result in a mean thrust. A longer actuator may be necessary to obtain thrust;however, as shown later, this simple actuation can indeed provide increased mean lift-to-drag ratio at higherangles of attack. In addition, a predictable pattern for lift and drag variations is obtained.
Next, the angle of attack is kept at α = 20 and the mean actuator angle of θ = 20. In this configuration,the leading edge remains parallel to the flow direction. The actuator is sinusoidally oscillated about thismean position. The actuation frequency is varied from 1, 3, 5, 10, to 20 Hz. The actuation amplitudes arevaried over range of (∆θ = 2.5,5, and 10). These vary the effective angles of attack over a wide range:αeff = 12.92−14.6, 12.04−15.4 and 10.2−17, respectively. The oscillatory actuations are about the meanactuator angle of θ = 20. Figure 10 shows the flow structure over one cycle of actuation for an amplitudeof ∆θ = ±5 at three different frequencies. It is seen that for the high frequency of 10 Hz (k = 5.71),strong vortical structures created near the leading edge travel downstream. Vortex pairing mechanisms areobserved with the vortices remaining close to the airfoil surface resulting in a smaller wake region. Downwardmotion of the leading edge leads to the formation of two strong leading edge vortices, very similar to theplunging SD7003 case studied earlier. These leading edge vortices travel downstream and as they come closeto the hinge location, they are thrown away from the upper surface of the airfoil. It is also observed that, inaddition to the creation of leading edge vortices, surface-vortex interaction leads to the ejection of vorticity ofopposite sign. This ejected vorticity is prominent between the two leading-edge vortices, very similar to thehigh frequency plunging case of SD7003. Owing to the short cycle time (high frequency), new leading edgevortices are created before the old ones have chance to completely travel the chord length. Upward motion ofthe actuator creates a very weak vortex (unlike the plunging case of SD7003) on the bottom surface. Thesefeatures result in increased mean lift-to-drag ratio as shown later.
For lower frequencies (5 and 1 Hz), the separated flow near the leading edge and the shear layer oscillatewith the actuator motion. The flow remains separated over most of the cycle giving a larger wake, and thestrong leading edge vortices observed in the high-frequency case are absent. With low frequency forcing, thevortex-surface interaction is not significant compared to the high frequency case. The ejection of oppositesign vorticity observed in high frequency case was absent for these frequencies.
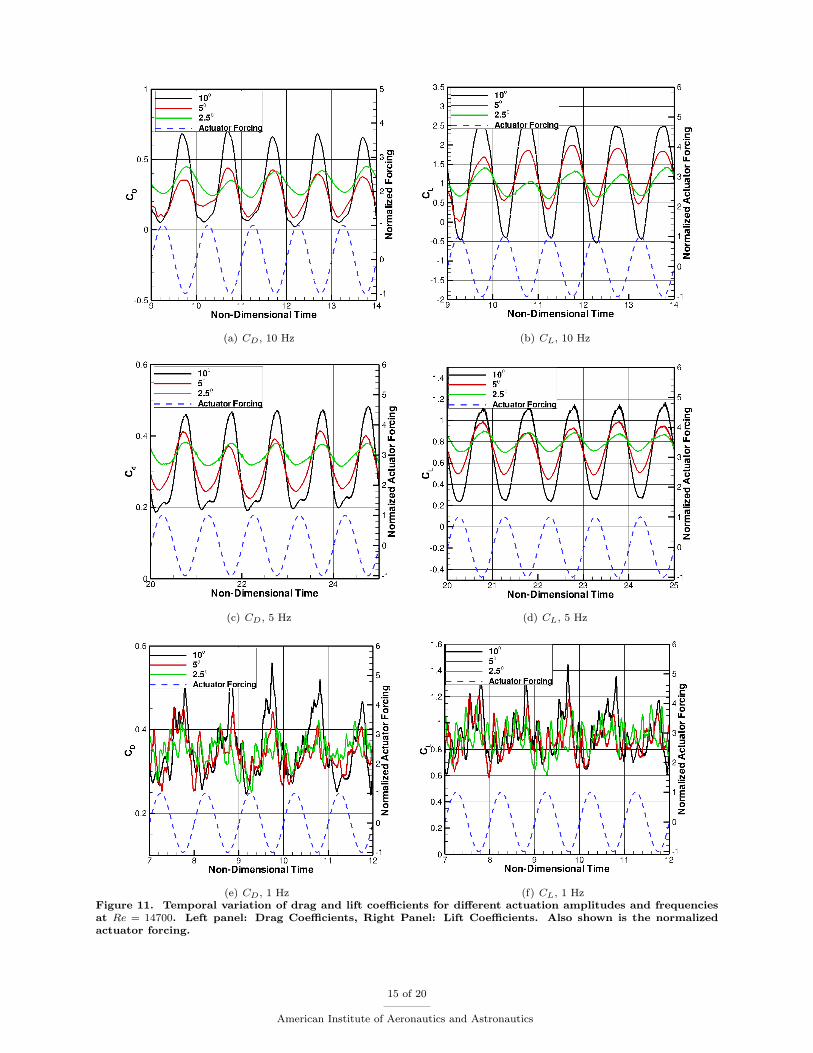
Figure 11 shows the temporal variations of lift and drag coefficients for different frequencies and actuationamplitudes over a range of cycles. It is observed that for frequencies of 10 and 5 Hz, the lift/drag coefficientsare periodic with a phase difference compared to the actuator motion. For large amplitude actuations(10), the variations in lift and drag around a mean are also large. For lower frequencies of 1 Hz and also3 Hz (not shown), the drag and lift coefficients oscillate, however, several periods appear superimposed.The fluctuations show similar characteristics as the static-actuation, especially for low frequency and lowamplitude oscillations.
Tables 1–3 summarize the effect of static and dynamic actuation of the leading edge on the mean lift anddrag coefficients for different actuation frequencies and amplitudes. Also compared are the mean lift-to-dragratios to that obtained with no actuation. It is observed that any actuation (static or dynamic) results inan increase of mean lift-to-drag ratio compared to no actuation. With static actuation (i.e. θ = 20 forα = 20), an increase of 27.7% was observed. As shown in figure 8, the temporal variation of the lift anddrag coefficients have a range of frequencies superimposed. With dynamic actuation at high frequencies (10and 20 Hz) further increase in mean lift-to-drag ratios were observed. Specifically, for actuation amplitudesof ∆θ = ±5 and ±2.5 at high frequencies, an increase in mean lift-to-drag ratio of more than 50% wasobserved. In addition, for dynamic actuation, the temporal behavior of the lift and drag coefficients areperiodic and predictable corresponding to the actuation frequency. With higher amplitudes of actuatormotion, the range over which the lift and drag coefficients varied also increased. For lower frequencies(1, 3 and 5 Hz), the increase in mean lift-to-drag ratio is lower and the temporal variation in drag andlift coefficients show multiple frequencies superimposed similar to that observed in static actuation. Theseresults suggest that high frequency actuation of the leading edge (either as designed or flow-induced) providestrong potential for development of control strategies. Specifically, these effects need to be investigated forairfoils undergoing transient maneuvers such as pitching or heaving.
14 of 20
American Institute of Aeronautics and Astronautics
(a) CD, 10 Hz (b) CL, 10 Hz
(c) CD, 5 Hz (d) CL, 5 Hz
(e) CD, 1 Hz (f) CL, 1 HzFigure 11. Temporal variation of drag and lift coefficients for different actuation amplitudes and frequenciesat Re = 14700. Left panel: Drag Coefficients, Right Panel: Lift Coefficients. Also shown is the normalizedactuator forcing.
15 of 20
American Institute of Aeronautics and Astronautics
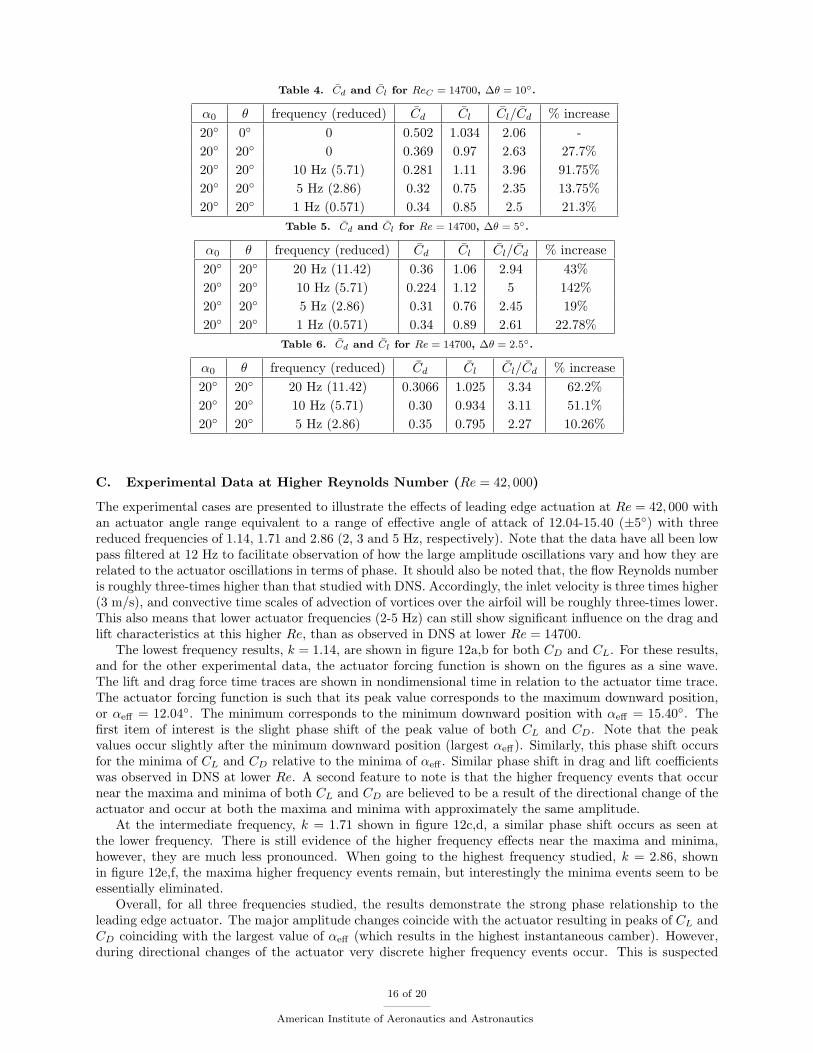
Table 4. Cd and Cl for ReC = 14700, ∆θ = 10.
α0 θ frequency (reduced) Cd Cl Cl/Cd % increase20 0 0 0.502 1.034 2.06 -20 20 0 0.369 0.97 2.63 27.7%20 20 10 Hz (5.71) 0.281 1.11 3.96 91.75%20 20 5 Hz (2.86) 0.32 0.75 2.35 13.75%20 20 1 Hz (0.571) 0.34 0.85 2.5 21.3%
Table 5. Cd and Cl for Re = 14700, ∆θ = 5.
α0 θ frequency (reduced) Cd Cl Cl/Cd % increase20 20 20 Hz (11.42) 0.36 1.06 2.94 43%20 20 10 Hz (5.71) 0.224 1.12 5 142%20 20 5 Hz (2.86) 0.31 0.76 2.45 19%20 20 1 Hz (0.571) 0.34 0.89 2.61 22.78%
Table 6. Cd and Cl for Re = 14700, ∆θ = 2.5.
α0 θ frequency (reduced) Cd Cl Cl/Cd % increase20 20 20 Hz (11.42) 0.3066 1.025 3.34 62.2%20 20 10 Hz (5.71) 0.30 0.934 3.11 51.1%20 20 5 Hz (2.86) 0.35 0.795 2.27 10.26%
C. Experimental Data at Higher Reynolds Number (Re = 42, 000)
The experimental cases are presented to illustrate the effects of leading edge actuation at Re = 42, 000 withan actuator angle range equivalent to a range of effective angle of attack of 12.04-15.40 (±5) with threereduced frequencies of 1.14, 1.71 and 2.86 (2, 3 and 5 Hz, respectively). Note that the data have all been lowpass filtered at 12 Hz to facilitate observation of how the large amplitude oscillations vary and how they arerelated to the actuator oscillations in terms of phase. It should also be noted that, the flow Reynolds numberis roughly three-times higher than that studied with DNS. Accordingly, the inlet velocity is three times higher(3 m/s), and convective time scales of advection of vortices over the airfoil will be roughly three-times lower.This also means that lower actuator frequencies (2-5 Hz) can still show significant influence on the drag andlift characteristics at this higher Re, than as observed in DNS at lower Re = 14700.
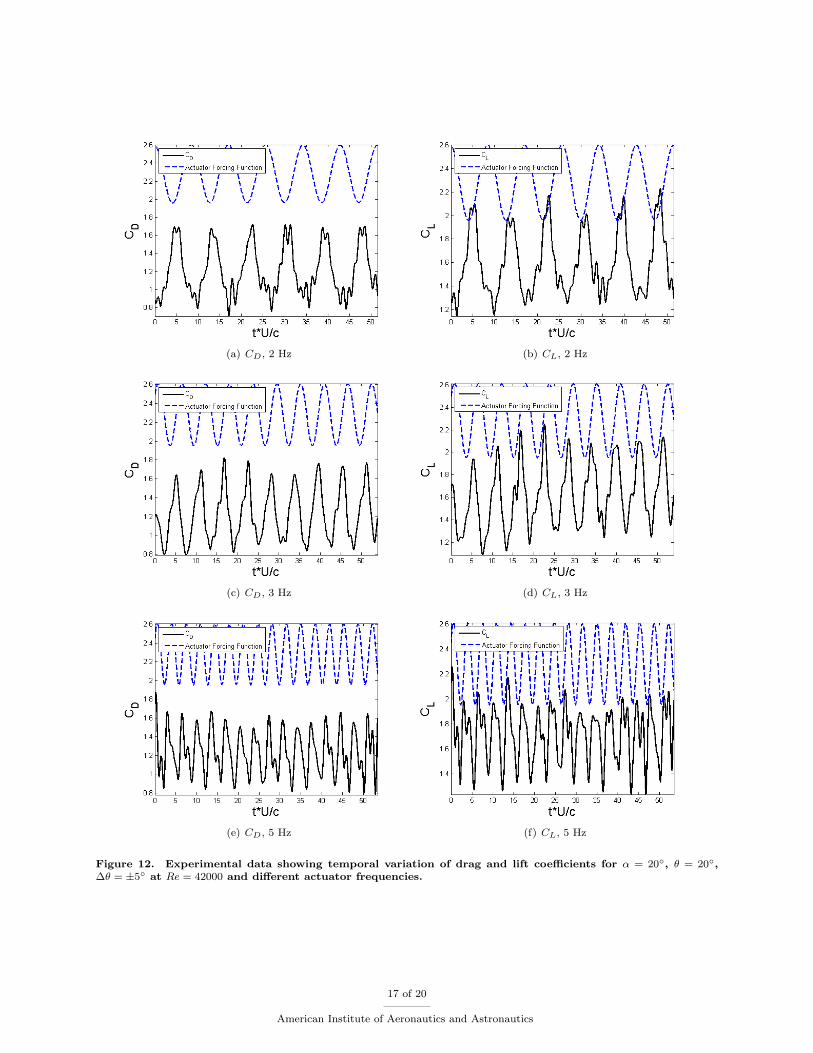
The lowest frequency results, k = 1.14, are shown in figure 12a,b for both CD and CL. For these results,and for the other experimental data, the actuator forcing function is shown on the figures as a sine wave.The lift and drag force time traces are shown in nondimensional time in relation to the actuator time trace.The actuator forcing function is such that its peak value corresponds to the maximum downward position,or αeff = 12.04. The minimum corresponds to the minimum downward position with αeff = 15.40. Thefirst item of interest is the slight phase shift of the peak value of both CL and CD. Note that the peakvalues occur slightly after the minimum downward position (largest αeff). Similarly, this phase shift occursfor the minima of CL and CD relative to the minima of αeff . Similar phase shift in drag and lift coefficientswas observed in DNS at lower Re. A second feature to note is that the higher frequency events that occurnear the maxima and minima of both CL and CD are believed to be a result of the directional change of theactuator and occur at both the maxima and minima with approximately the same amplitude.
At the intermediate frequency, k = 1.71 shown in figure 12c,d, a similar phase shift occurs as seen atthe lower frequency. There is still evidence of the higher frequency effects near the maxima and minima,however, they are much less pronounced. When going to the highest frequency studied, k = 2.86, shownin figure 12e,f, the maxima higher frequency events remain, but interestingly the minima events seem to beessentially eliminated.
Overall, for all three frequencies studied, the results demonstrate the strong phase relationship to theleading edge actuator. The major amplitude changes coincide with the actuator resulting in peaks of CL andCD coinciding with the largest value of αeff (which results in the highest instantaneous camber). However,during directional changes of the actuator very discrete higher frequency events occur. This is suspected
16 of 20
American Institute of Aeronautics and Astronautics
(a) CD, 2 Hz (b) CL, 2 Hz
(c) CD, 3 Hz (d) CL, 3 Hz
(e) CD, 5 Hz (f) CL, 5 Hz
Figure 12. Experimental data showing temporal variation of drag and lift coefficients for α = 20, θ = 20,∆θ = ±5 at Re = 42000 and different actuator frequencies.
17 of 20
American Institute of Aeronautics and Astronautics

to be associated with vortex generation and convection along the surface, which then in turn affects theinstantaneous lift and drag. At the lowest frequency the fluctuations during the highest αeff are mostsignificant. These are no longer seen at the higher frequency.
Consequently, one may conclude that the lower frequency actuation near the minima of αeff results inmore dominant generated vortices that convect along the actuator. It is speculated that at higher frequenciesthese vortices are not as strong, due to more rapid transition through the directional change of the actuatorand consequently do not appear to influence the measured instantaneous lift and drag.
V. Summary and Conclusion
Effect of oscillatory actuation of the leading edge of a thin, flat, rigid airfoil on MAV performance wasinvestigated using two-dimensional simulations at low Reynolds number of 14700 and experimental data atRe = 42000 and 20 angle of attack. A second-order accurate, fictitious domain method was used for thismoving boundary problem on a fixed background mesh. The numerical method was thoroughly verified forits accuracy and predictive capability on canonical problems of flow over a cylinder and sphere at differentReynolds numbers, flow over a NACA hydrofoil, flow generated by an inline oscillation of the cylinder andflow over a plunging SD7003 airfoil. Good comparison was obtained for plunging studies of SD7003 airfoilcompared to AFRLs high-fidelity solver FDL3DI for Reynolds numbers of 103 and 104.
Flow over a thin, flat airfoil at high angle of attack was studied with and without actuation of the leadingedge. Leading edge actuation involving rotation around a hinge located at 30% chord length can be usedto reduce the effective angle of attack without significantly reducing the lift. Reduction in effective angle ofattack and the added camber, results in reduced drag. A 27% increase in mean lift-to-drag ratio was observedfor static actuation cases, wherein the leading edge flap was horizontal (θ = 20). Actuated leading edgeat different reduced frequencies (0.57-11.42) and amplitudes (2.5 -10) were also studied. It was observedthat high frequency actuation of 10, 20 Hz (k = 5.71, 11.42), further increases the mean lift-to-drag ratio(> 50%). It also provides predictable pattern of lift and drag variations. Further analysis to study effecton mean flow/pressure, accounting for three-dimensional, transition effects as well as experimental data areneeded to corroborate these findings.
The present work indicated that the leading edge actuation using a hinged flapping actuator providesa means to directly influence the leading edge stall condition and unsteady lift behavior while not addingcomplexities associated with blowing or suction that may not be practical, for small wings with weightconstraints. Control strategies based on the present leading edge actuation are of direct relevance to small-sizeMAVs undergoing maneuvers and are pragmatic as designing simple piezo-based actuators is straightforward.The present simple modification to the wing configuration also facilitates development of actuators andcontrollers for airfoils with considerable size and weight restrictions. For instance, typical characteristiclengths for MAV are in the range of 8–15 cm, with operating speeds on the order of 50 km/h. Improving theflight performance of these vehicles can enhance surveillance, search and rescue, and sensor mobility, whileyielding vehicles that are more disposable.
Although this work investigated rigid airfoils, the results are of direct relevance to other forms of leadingedge flow control which are more amenable to small scale MAV implementation; for example, surface defor-mations via piezo-electric actuators or aero-elastically tailored structures. In addition, concepts of passivecontrol, with spring mounted hinge are also feasible leading to flow-induced actuation of the leading edge.By designing spring constants that result in flow-induced actuator motion that is periodic may result inadded advantage of increased lift-to-drag ratio without any need to supply power for actuator motion.
Acknowledgments
Part of this work was conducted under the ASEE’s Summer Faculty Fellowship Program (ASEE SFFP)at the Wright-Patterson Air Force Base. KJD and SVA gratefully acknowledge support through ASEE’sSummer Faculty Fellowship Program 2010. Interactions and discussions with Dr. Miguel Visbal and re-searchers at the Computational Sciences Division of Wright Patterson Airforce Base were invaluable for thesuccessful completion of this work. Authors also thank Dr. Visbal for providing useful data for comparisonof numerical studies on SD7003 airfoil. Computations were performed on Lonestar machine at the TexasAdvanced Computing Center.
18 of 20
American Institute of Aeronautics and Astronautics
References
1Visbal, M., “High-fidelity simulation of transitional flows past a plunging airfoil,” AIAA paper , Vol. 391, 2009, pp. 2009.2Visbal, M., Gordnier, R., and Galbraith, M., “High-fidelity simulations of moving and flexible airfoils at low Reynolds
numbers,” Experiments in Fluids, Vol. 46, No. 5, 2009, pp. 903–922.3Apte, S., Martin, M., and Patankar, N., “A numerical method for fully resolved simulation (FRS) of rigid particle-flow
interactions in complex flows,” Journal of Computational Physics, 2008, pp. doi:10.1016/j.jcp.2008.11.034.4Moin, P. and Apte, S., “Large eddy simulation of multiphase reacting flows in complex combustors,” AIAA J. (special
issue on ‘Combustion Modeling and LES: Development and Validation Needs for Gas Turbine Combustors), Vol. 44, 2006,pp. 698–710.
5Hoarau, Y., Braza, M., Ventikos, Y., Faghani, D., and Tzabiras, G., “Organized modes and the three dimensionaltransition to turbulence in the incompressible flow around a NACA0012 wing,” J. Fluid Mech., Vol. 496, 2003, pp. 63–72.
6Nishimura, H. and Taniike, Y., “Aerodynamic characteristics of fluctuating forces on a circular cylinder,” J. Wind Eng.,Ind. Aerodynamics, Vol. 89, 2001, pp. 713–723.
7Sicot, C., Auburn, S., Loyer, S., and Devinant, P., “Unsteady characteristics of the static stall of an airfoil sujected tofreestream turbulence level up to 16%,” Exp. in Fluids, Vol. 41, 2006, pp. 641–648.
8Fabula, A., “This airfoil theory applied to hydrofoils with a single finite cavity and arbitrary free-streamline detatchment,”J. Fluid Mech., Vol. 12, 1962, pp. 227–240.
9Kao, H., “Some aspects of airfoil stall in low speed flow,” J. Aircraft , Vol. 11, No. 3, 1974, pp. 177–180.10Atik, H., Kim, C., van Dommelen, L., and Walker, J., “Boundary-layer separation control on a thin airfoil using local
suction,” J. Fluid Mech., Vol. 535, 2005, pp. 414–443.11Degani, A., Li, Q., and Walker, J., “Unsteady separation from teh leading edge of a thin airfoil,” Phy. Fluids, Vol. 8,
No. 3, 1996, pp. 704–714.12Zaitsev, O. and Sychev, V., “Steady flow with separation past a thin airfoil at high Reynolds numbers,” J. Fluid
Dynamics, Vol. 29, No. 2, 1994, pp. 277–281.13Simpson, R., Chew, Y., and Shivaprasad, B., “The structure of a separating turbulent boundary layer: Part I, mean flow
and Reynolds stresses and Part II, higher order turbulence results,” J. Fluid Mech., Vol. 113, 1981, pp. 23–73.14Min and Choi, H., “Suboptimal feedback control of vortex shedding at low Reynolds numbers,” J. Fluid Mech., Vol. 401,
1999, pp. 123–156.15Cheng, M. and Chen, B., “A numerical study on fluid forced reduction of a square cylinder by flow control,” FEDSM2007-
37025, Proc. FEDSM2007, Joint ASME/JSME Fluids Engineering Conf., San Diego, CA, 2007.16McManus, K. and Magill, J., “Separation control in incompressible and compressible flows using pulsed jets,” AIAA
96-1948, AIAA Fluids Dyn. Conf., New Orleans, LA, 1996.17Florent, R., Pascal, M., and Didier, B., “Experimental control of vortex breakdown by pulsed blowing over a delta wing
with rounded leading-edge,” FEDSM2002-31039, Proc. of ASME FEDSM2002, Montreal, CA, 2002.18Gallas, Q., Holman, R., Nishida, T., Carroll, B., Sheplak, M., and Cattafesta, L., “Lumped element modeling of
piezoelectric-driven synthetic jets,” AIAA J., Vol. 41, 2003, pp. 240–247.19Baysal, O., Koklu, M., and Erbas, N., “Design optimization of micro synthetic jet acutators for flow separation control,”
J. Fluids Eng., Vol. 128, 2006, pp. 1053–1062.20Scholz, P., Ortmanns, J., Kahler, C., and Radespiel, R., “Leading edge separation control by means of pulsed jet
actuators,” 3rd AIAA Flow Cont. Conf., 2006-2000 , 2006.21Corke, T., Enloe, C., and Wilkinson, S., “Dielectric Barrier Discharge Plasma Actuators for Flow Control*,” Annual
Review of Fluid Mechanics, Vol. 42, 2010, pp. 505–529.22Visbal, M., Gaitonde, D., and Roy, S., “Control of transitional and turbulent flows using plasma-based actuators,” AIAA
paper , Vol. 3230, 2006, pp. 2006.23Grundmann, S. and Tropea, C., “Experimental transition delay using glow-discharge plasma actuators,” Experiments in
fluids, Vol. 42, No. 4, 2007, pp. 653–657.24Gang, L., Chaoqun, N., Yiming, L., Junqiang, Z., and Yanji, X., “Experimental Investigation of Flow Separation Control
Using Dielectric Barrier Discharge Plasma Actuators,” Plasma Science and Technology, Vol. 10, 2008, pp. 605.25Dong, B., Bauchire, J., Pouvesle, J., Magnier, P., and Hong, D., “Experimental study of a DBD surface discharge for the
active control of subsonic airflow,” Journal of Physics D: Applied Physics, Vol. 41, 2008, pp. 155201.26Rizzetta, D. and Visbal, M., “Numerical Investigation of Plasma-Based Control for Low-Reynolds Number Airfoil Flows,”
AIAA Paper 2010-4255, 5th AIAA Flow Control Conference, Chicago, IL.27Brunton, S., Rowley, C., Taira, K., Colonius, T., Collins, J., and Williams, D., “Unsteady aerodynamic forces on small-
scale wings: experiments, simulations and models,” 46 th AIAA Aerospace Sciences Meeting and Exhibit , American Instituteof Aeronautics and Astronautics, 1801 Alexander Bell Drive, Suite 500, Reston, VA, 20191-4344, USA,, 2008.
28Geissler, W., Sobieczky, H., and Vollmers, H., “Numerical study of the unsteady flow on a pitching airfoil with oscillatingflap,” European Rotorcraft Forum, 24 th, Marseilles, France, 1998.
29Lu, Y., Shen, G., and Lai, G., “Dual leading-edge vortices on flapping wings,” Journal of Experimental Biology, Vol. 209,No. 24, 2006, pp. 5005.
30Muijres, F., Johansson, L., Barfield, R., Wolf, M., Spedding, G., and Hedenstrom, A., “Leading-edge vortex improves liftin slow-flying bats,” Science, Vol. 319, No. 5867, 2008, pp. 1250.
31Dickinson, M., Lehmann, F., and Sane, S., “Wing rotation and the aerodynamic basis of insect flight,” Science, Vol. 284,No. 5422, 1999, pp. 1954.
32Taira, K., Dickson, W., Colonius, T., Dickinson, M., and Rowley, C., “Unsteadiness in flow over a flat plate at angle-of-attack at low Reynolds numbers,” 45 th Aerospace Sciences Meeting and Exhibit, AIAA,(AIAA 2007-710).
19 of 20
American Institute of Aeronautics and Astronautics

33Taira, K. and Colonius, T., “Three-dimensional flows around low-aspect-ratio flat-plate wings at low Reynolds numbers,”Journal of Fluid Mechanics, Vol. 623, 2009.
34Colonius, T., Rowley, C., Tadmor, G., Williams, D., Taira, K., Dickson, W., Gharib, M., and Dickinson, M., “Closed-loopcontrol of leading-edge and tip vortices for small UAV,” Conference on Active Flow Control , 2006.
35Ol, M., McAuliffe, B., Hanff, E., Scholz, U., and Kaehler, C., “Comparison of laminar separation bubble measurementson a low Reynolds number airfoil in three facilities,” AIAA paper , Vol. 5149, 2005, pp. 2005.
36Radespiel, R., Windte, J., and Scholz, U., “Numerical and experimental flow analysis of moving airfoils with laminarseparation bubbles,” AIAA journal , Vol. 45, No. 6, 2007, pp. 1346.
37McGowan, G., Gopalarathnam, A., Ol, M., Edwards, J., and Fredberg, D., “Computation vs. experiment for high-frequency low-reynolds number airfoil pitch and plunge,” AIAA, Vol. 653, 2008, pp. 2008.
38Sahoo, D., Srinivasan, R., and Bowersox, R., “Examination of the Leading Edge Flow Structure of a DynamicallyPitching NACA 0012 Airfoil,” 47 th AIAA Aerospace Sciences Meeting Including the New Horizons Forum and AerospaceExposition(Disc 1), American Institute of Aeronautics and Astronautics, 1801 Alexander Bell Drive, Suite 500, Reston, VA,20191-4344, USA,, 2009.
39Mueller, T. and DeLaurier, J., “An overview of micro air vehicle aerodynamics.’ Fixed and flapping wing aerodynamicsfor micro air vehicle applications,” Progress in Astronautics and Aeronautics, Vol. 195, 2001, pp. 1–10.
40Pelletier, A. and Mueller, T., “Low Reynolds number aerodynamics of low-aspect ratio, thin/flat/cambered-plate wings,”J. of Aircraft , Vol. 37, No. 5, 2000, pp. 825–832.
41Broeren, A. and Bragg, M., “Unsteady stalling characteristics of thin airfoils at low Reynolds numbers. Fixed and flappingwing aerodynamics for micro air vehicle applications,” Progress in Astronautics and Aeronautics, Vol. 195, 2001, pp. 191–213.
42Yarusevych, S., Sullivan, P., and Kawall, J., “Airfoil boundary layer separation and control at low Reynolds numbers,”Exp. Fluids, Vol. 38, 2005, pp. 545–547.
43Fuchiwaka, M., Tanaka, K., and Nakashima, M., “Characteristics of dynamic thrust on an unsteady airfoil in pitchingand heaving motions,” FEDSM2007-37222, Proc. FEDSM20007, Joint ASME/JSME Fluids Engineering Conf., San Diego,CA, 2007.
44Selig, M. and Guglielmo, J., “High lift low Reynolds number airfoil design,” J. of Aircraft , Vol. 34, No. 1, 1997, pp. 72–79.45Shyy, W., Klevebring, F., Nilsson, M., Sloan, J., Carroll, B., and Fuentes, C., “Rigid and flexible low Reynolds number
airfoils,” J. of Aircraft , Vol. 36, No. 3, 1999, pp. 523–529.46Gopalarathnam, A., Broughton, B., McGrananhan, B., and Selig, M., “Design of low Reynolds number airfoils with
trips,” J. of Aircraft , Vol. 40, No. 4, 2003, pp. 768–775.47Kunz, P. and Kroo, I., “Analysis and design of airfoils for use at ultra-low Reynolds numbers. Fixed and flapping wing
aerodynamics for micro air vehicle applications,” Progress in Astronautics and Aeronautics, Vol. 195, 2001, pp. 35–60.48Apte, S. and Finn, J., “A variable density fictitious domain method for fully resolved simulation of high-density ratio
fluid-particle systems,” ICMF2010, Seventh International Conference on Multiphase Flow, Tampa Bay, FL.49Mahesh, K., Constantinescu, G., and Moin, P., “A new time-accurate finite-volume fractional-step algorithm for prediction
of turbulent flows on unstructured hybrid meshes,” J. Comp. Phy., Vol. 197, 2004, pp. 215–240.50Apte, S. and Patankar, N., “A formulation for fully resolved simulation (FRS) of particle–turbulence interactions in
two-phase flows,” International Journal of Numerical Analysis and Modeling, Vol. 5, Suppl, 2008, pp. 1–16.51Morse, D. R. and Liburdy, J. A., “Vortex Dynamics and Shedding of a Low Aspect Ratio, Flat Wing at Low Reynolds
Numbers and High Angles of Attack,” Journal of Fluids Engineering, Vol. 131, No. 5, 2009, pp. 051202.52Morse, D. and Liburdy, J., “Dynamic characteristics of flow separation from a low Reynolds number airfoil,” FEDSM2007-
37083, Fluids Eng. Conf, San Diego, CA., 2007.53Morse, D. and Liburdy, J. A., “Vortex detection and characterization in low Reynolds number separation,” IMECE2007-
43011, ASME Int. Mech. Eng. Cong. & Exp., Seattle, WA, 2007b.54Chen, G., Lin, Z., Morse, D., Snider, S., Apte, S., Liburdy, J., and Zhang, E., “Multiscale feature detection in unsteady
separated flows,” International Journal of Numerical Analysis and Modeling, Vol. 5, 2008, pp. 1–16.55Morse, D., Snider, S., Chen, G., Apte, S., Liburdy, J., and Zhang, E., “Detection and Analysis of Separated Flow Induced
Vortical Structures,” to appear in 46th AIAA Aerospace Sciences Meeting and Exhibit, Reno, NV , January 2008.
20 of 20
American Institute of Aeronautics and Astronautics