low-level detection of ethanol, 1,4-dioxane, and other ... · chromatograms of ethanol and...
TRANSCRIPT

Application Note 25370206
Keywords1,4-DioxaneEclipseEthanolFuel OxygenatesMethanolModel 4552Purge and TrapSample ConcentratorWater ManagementWater/Soil Autosampler
Presented at the 2006 Pittsburgh Conference on Analytical Chemistry and Applied
Spectroscopy, Orlando, FLMarch 12–17, 2006
Low-level Detection of Ethanol, 1,4-Dioxane, and Other Oxygenates Using
the Eclipse Purge-and-Trap Sample Concentrator
IntroductionFuel oxygenates such as methyl tert-butyl ether (MTBE) and tert-butyl alcohol (TBA) have been used as additives in reformulated gasoline to boost octane ratings and make the fuel burn more cleanly. Approximately 30% of the nation's gasoline contain some type of oxygenate additive. Concerns have been raised about the toxicity of MTBE and other additives as they enter the water table due to a spill or leak from underground storage tanks. As a result, several states have been requiring the use of ethanol as an alternative fuel additive.
Replacing MTBE with ethanol has led to the need for a reliable analytical method that can be fully automated and provide low detection limits for ethanol in water. Using ethanol as an alternative fuel in the future will also require new test methods. Standard purge-and-trap (P&T) methods can be used to concentrate and analyze for ethanol and other fuel oxygenates. However, low ethanol concentrations are difficult to detect using conventional P&T settings due to ethanol's high solubility in water and low purge efficiency.
Before now, the practical limit of detection for ethanol has been approximately 100 ppb (µg/L). This application note describes how the detection limits for ethanol and 1,4-dioxane can be lowered to 10 ppb by modifying standard P&T operating conditions. Variables such as trap adsorbent material, sample temperature, analytical trap temperature during purge, and water management fitting temperature during desorb were investigated for their effects on detection limits and peak shapes. The selective ion-monitoring (SIM) mode on a gas chromatograph/mass spectrometer (GC/MS) was also examined as a potential technique to further enhance sensitivity. Chromatograms of ethanol and 1,4-dioxane at 10 ppb are shown and all instrument operating parameters are provided.
ExperimentalThese experiments were conducted using the OI Analytical Model 4660 Eclipse Purge-and-Trap Sample Concentrator (Figure 1) and Model 4552 Water/Soil Autosampler. Analyses were performed using an Agilent® 6890N GC and 5975 Inert MS with ChemStation® to acquire and process
Figure 1. OI Analytical Eclipse 4660 Purge-and-Trap
Sample Concentrator

2
the data. Table 1 lists all instrument operating conditions before they were optimized for low-level detection of ethanol and 1,4-dioxane.
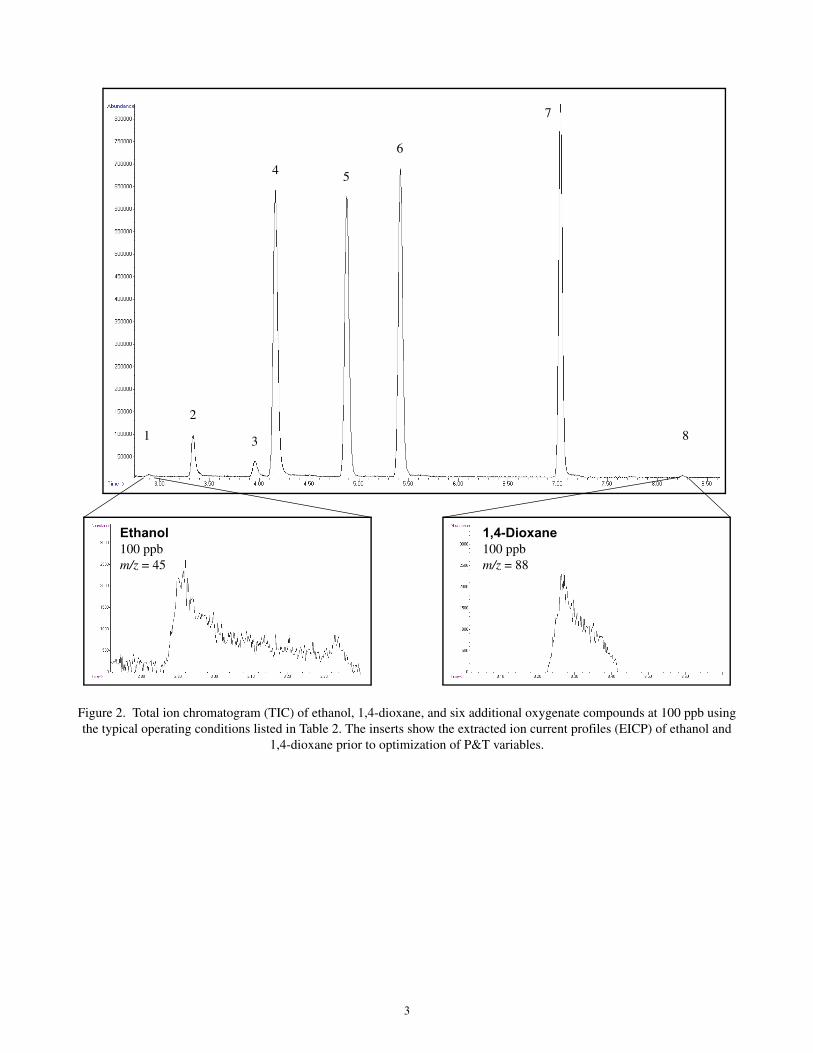
A standard mixture was prepared for the P&T optimization tests which contained ethanol, 1,4-dioxane, and six additional oxygenate compounds. The initial variable testing was performed using this standard mixture at a concentration of 100 ppb. Two internal standards, fluorobenzene and 1-bromo-3-chloropropane, were added at 20 ppb for the calibration and statistical MDL studies. Figure 2 shows a typical total ion chromatogram (TIC) of ethanol, 1,4-dioxane, and the oxygenate compounds listed in Table 2. The inserts illustrate the chromatography of ethanol and 1,4-dioxane prior to optimization of the selected P&T variables.
Table 1. Typical operating conditions for analysis of volatile organic compounds (VOC) before conditions were optimized to enhance responses of ethanol and 1,4-dioxane. Asterisks mark the variables chosen for adjustment.
Eclipse Purge-and-Trap Sample ConcentratorTrap* #10 Tenax®/silica gel/carbon molecular sievePurge time and trap temperature* 11 minutes at ambient laboratory temperature
Dry purge Not necessary with the patented Cyclone Water Management™ fittingDesorb preheat temperature On at 180 °CDesorb time and trap temperature 0.5 minutes at 190 °C Bake time and temperature 10 minutes at 210 °CCyclone Water Management* 110 °C at purge, 0 °C (ambient) at desorb, 240 °C at bakeSparge mount temperature 40 °CSample temperature* 40 °CValve oven temperature 110 °CTransfer line temperature 110 °C
Agilent 6890N GC and 5973 Inert MSColumn Restek Rtx®-624, 30 m x 0.25 mm x 1.4-µm filmInlet Split/splitless, 35:1 split ratio, 28 mL/minute split flow, 1-mm linerInlet temperature 240 °CCarrier gas Helium at 0.8 mL/minuteOven program 45 °C (hold for 4.5 minutes), 12 °C/minute to 100 °C (hold for
0 minute), 25 °C/minute to 240 °C (hold for 1.3 minutes)Solvent delay 1.5 minutesMS acquisition mode* Scan 35–260 amuMS quad temperature 150 °CMS source temperature 230 °C
3
Figure 2. Total ion chromatogram (TIC) of ethanol, 1,4-dioxane, and six additional oxygenate compounds at 100 ppb using the typical operating conditions listed in Table 2. The inserts show the extracted ion current profiles (EICP) of ethanol and
1,4-dioxane prior to optimization of P&T variables.
1
2
3
4 5
6
7
8
Ethanol100 ppbm/z = 45
1,4-Dioxane100 ppbm/z = 88
4
Results and Discussion
Optimization of Purge-and-Trap VariablesSeveral variables of the Eclipse Sample Concentrator were selected to determine their effects on the detection limits and peak shapes of ethanol and 1,4-dioxane. The other six oxygenate compounds can usually be detected at 1 ppb or lower with excellent chromatography using normal P&T conditions.1 Previous studies revealed that retention of water by the adsorbent material of the analytical trap can be detrimental to the chromatography of polar compounds.2 Water can interfere with the fast desorption of polar compounds from the analytical trap, creating a wide thermal desorption band and producing irregular peak shapes. P&T variables, such as trap type, sample temperature, trap temperature during purge, and water management fitting temperature during desorb, were selected for optimization due to their impact on water retention by the trap and subsequent chromatography.
Trap TypeThree traps, #7, #10, and #11, were chosen to determine their effects on peak shapes and recoveries of ethanol and 1,4-dioxane.
The #7 trap consists of Tenax as its only component. Tenax traps compounds with boiling points above 35 °C, and is highly nonpolar and hydrophobic compared to other trap adsorbent materials.
The #10 trap contains three layers of adsorbent materials, Tenax, silica gel, and carbon molecular sieve. Carbon molecular sieve and silica gel are excellent trapping materials for highly volatile compounds such as the six light gases, but silica gel actively retains water due to its hydrophilic nature.
The #11 trap, also called the VOCARB® 3000, contains Carbopack B, Carboxen™ 1000, and Carboxen 1001. It is known for its ability to bind a wide range of compounds from the six light gases to the higher boiling compounds such as naphthalene. It also resists absorption of water and methanol, but in some instruments may require a dry purge of one to six minutes to completely remove the retained water.
Figure 3 illustrates the relative recoveries of ethanol and 1,4-dioxane using all three trap types, and the amount of water thermally desorbed to the GC from each trap (m/z 18). The relative recoveries for ethanol and 1,4-dioxane were highest using the #7 trap. Compared to the #10 or #11 traps, the #7 trap retained the least amount of water, produced the best peak shapes, and provided the highest response. This result can be attributed to the chemical properties of Tenax, the only adsorbent material in the #7 trap, which has a lower affinity for water than silica gel, carbon molecular sieve, or the VOCARB trap.2
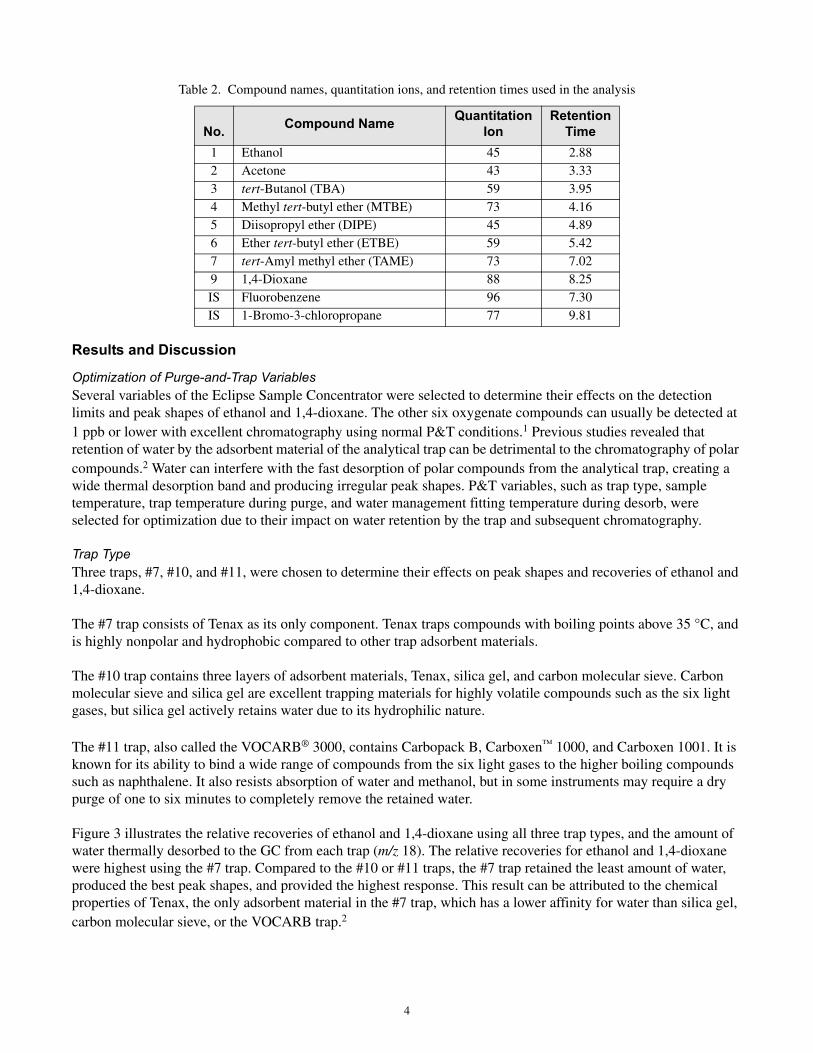
Table 2. Compound names, quantitation ions, and retention times used in the analysis
No. Compound Name Quantitation
IonRetention
Time1 Ethanol 45 2.882 Acetone 43 3.333 tert-Butanol (TBA) 59 3.954 Methyl tert-butyl ether (MTBE) 73 4.165 Diisopropyl ether (DIPE) 45 4.896 Ether tert-butyl ether (ETBE) 59 5.427 tert-Amyl methyl ether (TAME) 73 7.029 1,4-Dioxane 88 8.25IS Fluorobenzene 96 7.30IS 1-Bromo-3-chloropropane 77 9.81

5
Figure 3. Overlaid EICP for ethanol and 1,4-dioxane using the #7, #10, and #11 traps. The bottom chromatogram shows the overlaid EICP for water (m/z = 18) using all three traps. The #7 trap (Tenax) produced the best peak shapes and highest
responses for ethanol and 1,4-dioxane, and transferred the least amount of water to the GC. The #11 trap was run with and without a dry purge step, and transferred the same amount of water using both sets of conditions illustrating the effectiveness
of the patented Cyclone Water Management device.
EICP Color Trap
Black #7Green #11Red #11 + dry purgeBlue #10
Ethanolm/z = 45
1,4-Dioxanem/z = 88
Waterm/z = 18
#7 Trap
#7 Trap
#7 Trap

6
Sample TemperatureEthanol and 1,4-dioxane are extremely polar compounds with low purge efficiency (recovery) due to their high solubility in water. Their purge efficiencies can be significantly improved by heating the sample which forces the volatile compounds out of the liquid and into the gas phase for collection on the trap. The test mixture was analyzed using three sample temperatures: ambient laboratory temperature, 40 °C, and 60 °C. Figure 4 shows that using a 60 °C sample temperature during purge improved recoveries noticeably and produced the highest responses for both ethanol and 1,4-dioxane. Further heating of the sample can produce even higher responses, but the additional water transferred to the trap causes peak shape to deteriorate, offsetting the advantage of increased response.
Figure 4. Overlaid EICP of ethanol and 1,4-dioxane using three different sample temperatures (ambient laboratory temperature, 40 °C, and 60 °C) and a #7 trap. The Eclipse’s patented Infra-Sparge™ Sample Heater provided accurate and
reliable sample heating, and direct temperature feedback through a thermocouple located directly in the sample.
Ethanolm/z = 45
1,4-Dioxanem/z = 88
60 °C
60 °C
40 °C
Ambient
40 °C
Ambient

7
Trap Temperature During PurgeWhen the analytical trap retains a significant amount of water during purge, the water can create interference by widening the thermal desorption band for the polar compounds, and become a major cause of peak tailing. Previous investigations have found that increasing the trap temperature during purge minimized the amount of water retained on the trap and improved peak shape of some polar compounds32 To determine the optimum trap temperature for ethanol and 1,4-dioxane during purge, three trap temperatures were tested: ambient laboratory temperature, 30 °C, and 40 °C. A 10-ppb standard mix was analyzed to determine the effects of trap temperature on peak shapes and responses of the two test compounds. Figure 5 illustrates how increasing trap temperature produces improved peak shapes for these two polar compounds. Increasing the trap temperature during purge from the ambient laboratory temperature (standard condition) to 40 °C resulted in the most improved peak shapes, and peak area counts remained approximately constant. It is important to note that although this technique may improve performance for selected polar compounds, when the trap is held at even slightly elevated temperatures during the purge step, some of the most volatile compounds, such as the six gases, can be lost due to trap breakthrough.
Figure 5. EICP of ethanol and 1,4-dioxane at 10 ppb using three different trap temperatures during purge (ambient laboratory temperature, 30 °C, and 40 °C). The slight increase in trap temperature during purge minimized water retention on the trap and
narrowed the thermal desorption band for each analyte, but could also cause loss of the gases due to trap breakthrough.
Ethanol10 ppb
m/z = 45
1,4-Dioxane10 ppb
m/z = 88Ambient
30 °C
40 °C
Ambient
30 °C
40 °C
8
Water Management TemperatureThe Eclipse Sample Concentrator is equipped with the patented Cyclone Water Management fitting (WMF), which efficiently removes the water transferred to and retained on the analytical trap during the purge step. The WMF employs an inert, nickel-plated, near-ambient cyclone chamber positioned at the exit of the adsorbent trap during the desorb step to maximize water removal.
During the purge step the WMF is held at 110 °C, and all water purged from the sample is transferred directly onto or through the trap, depending on the adsorbent chosen. The WMF is then cooled to the ambient laboratory temperature prior to the desorb step, and the water present in the desorption gas is condensed as it passes through the WMF. In addition to condensation, the cyclone chamber has a unique geometry that forces the desorbing gas into a turbulent vortex that aids in the physical separation of the gas and liquid (water) phases. Finally, during bake, the WMF is heated to 240 °C, removing the condensed water and reconditioning the device for the next sample. Since polar compounds such as ethanol are hydrophilic, some portion of these analytes may also be cold-trapped along with the water. This is one of the causes of the high detection limits for ethanol when using standard conditions.
The normal setting for the WMF during desorb is 0 °C (ambient laboratory temperature). Raising this temperature above ambient transfers more water to the GC during desorb, and it can also noticeably increase the mass of some polar compounds transferred as well. Three WMF temperatures (ambient laboratory temperature, 40 °C, and 70 °C) during desorb were tested to determine the effect on recoveries of ethanol and 1,4-dioxane.
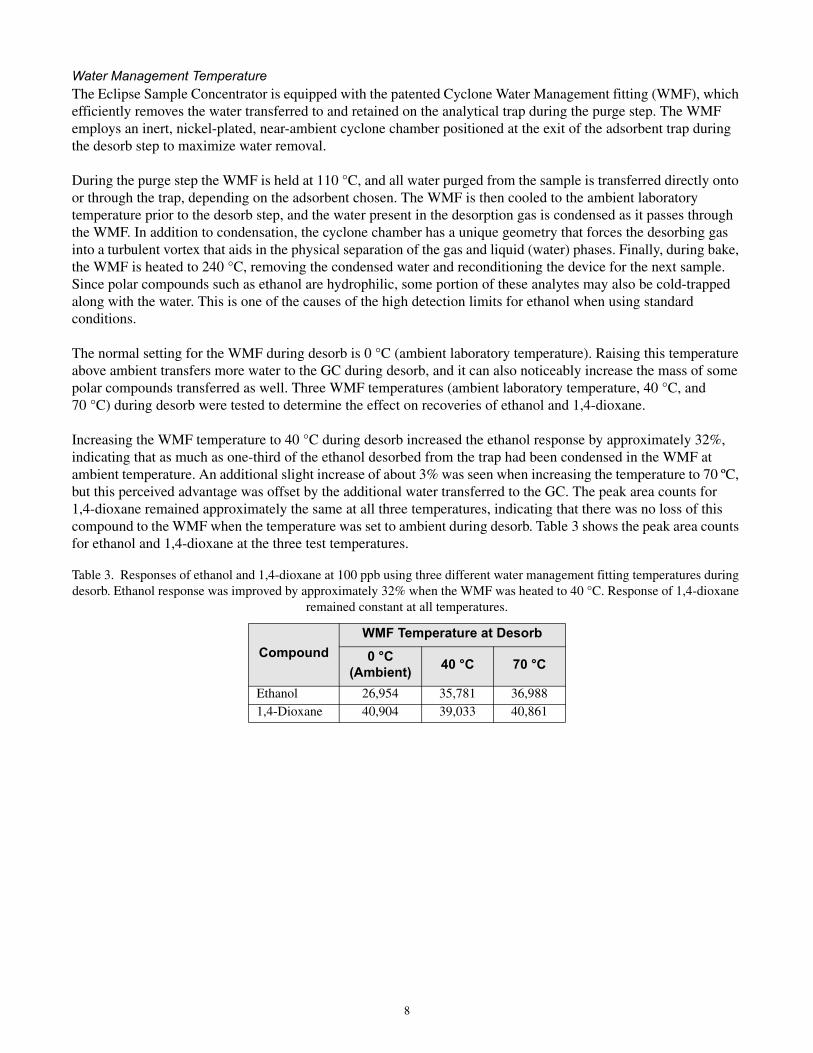
Increasing the WMF temperature to 40 °C during desorb increased the ethanol response by approximately 32%, indicating that as much as one-third of the ethanol desorbed from the trap had been condensed in the WMF at ambient temperature. An additional slight increase of about 3% was seen when increasing the temperature to 70 ºC, but this perceived advantage was offset by the additional water transferred to the GC. The peak area counts for 1,4-dioxane remained approximately the same at all three temperatures, indicating that there was no loss of this compound to the WMF when the temperature was set to ambient during desorb. Table 3 shows the peak area counts for ethanol and 1,4-dioxane at the three test temperatures.
Table 3. Responses of ethanol and 1,4-dioxane at 100 ppb using three different water management fitting temperatures during desorb. Ethanol response was improved by approximately 32% when the WMF was heated to 40 °C. Response of 1,4-dioxane
remained constant at all temperatures.
CompoundWMF Temperature at Desorb
0 °C (Ambient) 40 °C 70 °C
Ethanol 26,954 35,781 36,9881,4-Dioxane 40,904 39,033 40,861
9
Figure 6 illustrates that the WMF at ambient temperature during desorb transferred the least amount of water to the GC, and that higher temperatures transferred greater amounts of water. The relative difference in water transferred illustrates the effectiveness of the WMF under standard conditions.
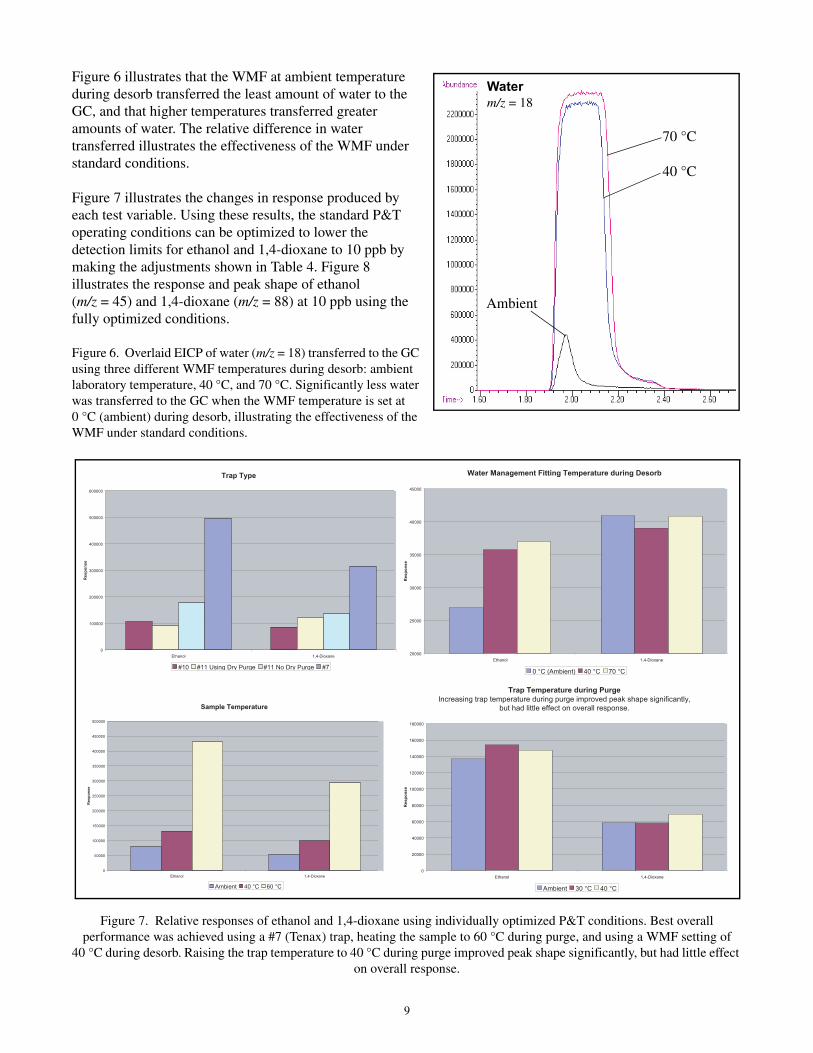
Figure 7 illustrates the changes in response produced by each test variable. Using these results, the standard P&T operating conditions can be optimized to lower the detection limits for ethanol and 1,4-dioxane to 10 ppb by making the adjustments shown in Table 4. Figure 8 illustrates the response and peak shape of ethanol (m/z = 45) and 1,4-dioxane (m/z = 88) at 10 ppb using the fully optimized conditions.
Figure 6. Overlaid EICP of water (m/z = 18) transferred to the GC using three different WMF temperatures during desorb: ambient laboratory temperature, 40 °C, and 70 °C. Significantly less water was transferred to the GC when the WMF temperature is set at 0 °C (ambient) during desorb, illustrating the effectiveness of the WMF under standard conditions.
Figure 7. Relative responses of ethanol and 1,4-dioxane using individually optimized P&T conditions. Best overall performance was achieved using a #7 (Tenax) trap, heating the sample to 60 °C during purge, and using a WMF setting of
40 °C during desorb. Raising the trap temperature to 40 °C during purge improved peak shape significantly, but had little effect on overall response.
Ambient
40 °C
70 °C
Waterm/z = 18
Water Management Fitting Temperature during Desorb
20000
25000
30000
35000
40000
45000
Ethanol 1,4-Dioxane
Re
sp
on
se
0 °C (Ambient) 40 °C 70 °C
Sample Temperature
0
50000
100000
150000
200000
250000
300000
350000
400000
450000
500000
Ethanol 1,4-Dioxane
Re
sp
on
se
Ambient 40 °C 60 °C
Trap Temperature during Purge
Increasing trap temperature during purge improved peak shape significantly,
but had little effect on overall response.
0
20000
40000
60000
80000
100000
120000
140000
160000
180000
Ethanol 1,4-Dioxane
Re
sp
on
se
Ambient 30 °C 40 °C
Trap Type
0
100000
200000
300000
400000
500000
600000
Ethanol 1,4-Dioxane
Re
sp
on
se
#10 #11 Using Dry Purge #11 No Dry Purge #7
10
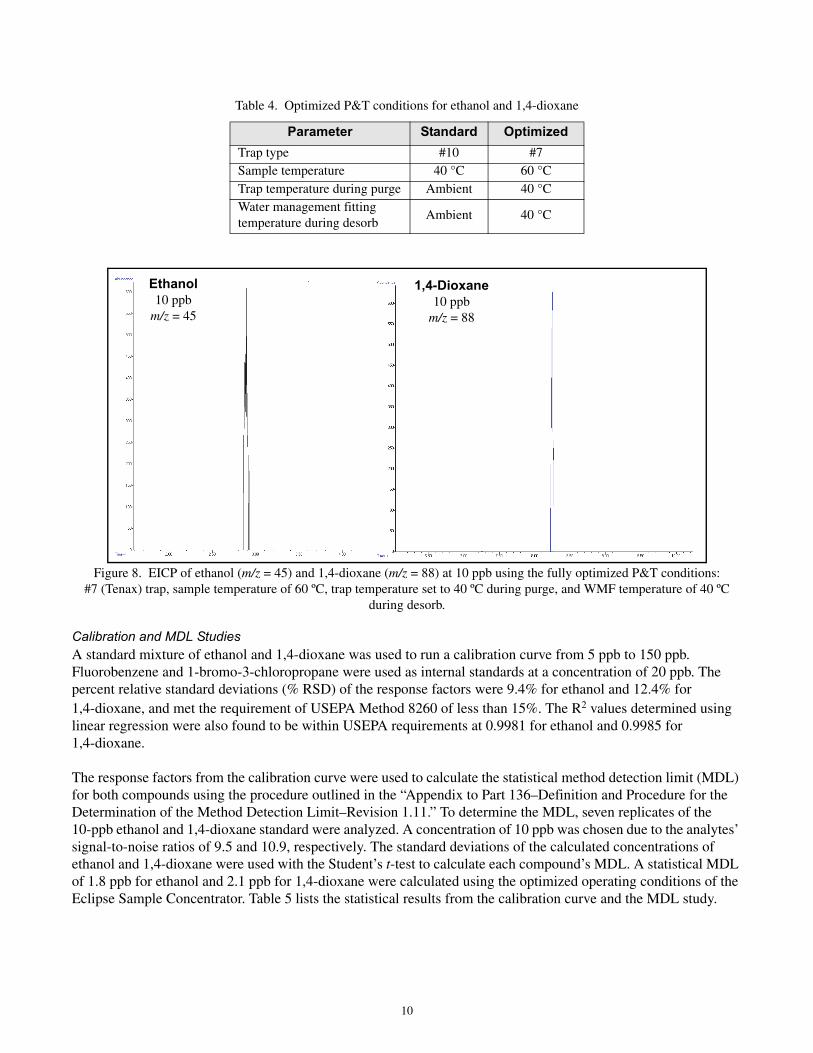
Figure 8. EICP of ethanol (m/z = 45) and 1,4-dioxane (m/z = 88) at 10 ppb using the fully optimized P&T conditions: #7 (Tenax) trap, sample temperature of 60 ºC, trap temperature set to 40 ºC during purge, and WMF temperature of 40 ºC
during desorb.
Calibration and MDL StudiesA standard mixture of ethanol and 1,4-dioxane was used to run a calibration curve from 5 ppb to 150 ppb. Fluorobenzene and 1-bromo-3-chloropropane were used as internal standards at a concentration of 20 ppb. The percent relative standard deviations (% RSD) of the response factors were 9.4% for ethanol and 12.4% for 1,4-dioxane, and met the requirement of USEPA Method 8260 of less than 15%. The R2 values determined using linear regression were also found to be within USEPA requirements at 0.9981 for ethanol and 0.9985 for 1,4-dioxane.
The response factors from the calibration curve were used to calculate the statistical method detection limit (MDL) for both compounds using the procedure outlined in the “Appendix to Part 136–Definition and Procedure for the Determination of the Method Detection Limit–Revision 1.11.” To determine the MDL, seven replicates of the10-ppb ethanol and 1,4-dioxane standard were analyzed. A concentration of 10 ppb was chosen due to the analytes’ signal-to-noise ratios of 9.5 and 10.9, respectively. The standard deviations of the calculated concentrations of ethanol and 1,4-dioxane were used with the Student’s t-test to calculate each compound’s MDL. A statistical MDL of 1.8 ppb for ethanol and 2.1 ppb for 1,4-dioxane were calculated using the optimized operating conditions of the Eclipse Sample Concentrator. Table 5 lists the statistical results from the calibration curve and the MDL study.
Table 4. Optimized P&T conditions for ethanol and 1,4-dioxane
Parameter Standard OptimizedTrap type #10 #7Sample temperature 40 °C 60 °CTrap temperature during purge Ambient 40 °CWater management fitting temperature during desorb
Ambient 40 °C
Ethanol10 ppb
m/z = 45
1,4-Dioxane10 ppb
m/z = 88

11
Estimated Limit of Quantitation in the SIM ModeThe Agilent 5975 Inert MS was switched to the Selected Ion Monitoring (SIM) mode to determine whether the limit of quantitation for ethanol could be lowered further. Monitoring ions 45, 31, and 32 during the elution of a 0.5-ppb ethanol standard resulted in a peak with signal-to-noise ratio of approximately 35, indicating that when using the SIM mode, ethanol can be detected and quantified at single-digit ppb concentrations. Figure 9 illustrates the repeatability of ethanol at 0.5 ppb using the SIM mode. Percent RSDs of the area counts over the seven replicates analyses were 3.6% for ethanol and 5.1% for 1,4-dioxane.
Figure 9. Overlaid EICP (m/z = 45) from seven replicate analyses of ethanol at 0.5 ppb analyzed using the optimized P&T conditions and Selected Ion Monitoring (SIM)
Table 5. Calibration results from 5 to 150 ppb and MDL study of seven replicates of 10-ppb ethanol and 1,4-dioxane using the fully optimized P&T conditions
Compound
Calibration MDL Study
% RSD R2Average
Conc. (ppb)
Standard Deviation
(ppb)
Statistical MDL (ppb)
Ethanol 9.4 0.9981 9.6 0.58 1.81,4-Dioxane 12.4 0.9985 10.3 0.68 2.1
Ethanol10 ppb
SIM modem/z = 45
% RSD = 3.6

�������������� � ��������������������
� �������������� �!"��������������� �###���$��$�%
Agilent and ChemStation are registered trademarks of Agilent Technologies, Inc.Carboxen is a trademark of Supelco, Inc.Rtx is a registered trademark of Restek Corporation.Tenax is a registered trademark of Enka Research Institute Arnhem.VOCARB is a registered trademark of U.S. Filter Corporation.
Analysis of Methanol Using Optimized Purge-and-Trap Operating ConditionsThe optimized conditions were also used to evaluate the performance of methanol when analyzed by P&T. The scan range on the MS was changed to 29 to 260 amu to capture methanol’s quantitation ions of 31, 32, and 29. Figure 10 illustrates the EICP of methanol at 250 ppb using the fully optimized conditions shown in Table 4. Using the operating conditions before optimization (Table 1), methanol could not be detected at 250 ppb.
Figure 10. EICPs for methanol at 250 ppb analyzed on the Eclipse Sample Concentrator using the fully
optimized conditions described in Tables 1 and 4. The ions shown are m/z 29, 31, and 32.
ConclusionsIncreasing demands for cleaner burning fuels and use of ethanol as both a fuel additive and a potential alternative to gasoline have led to the need for an analytical method that is capable of detecting and reliably quantifying ethanol at extremely low concentrations. By optimizing the operating conditions of the Eclipse P&T Sample Concentrator both ethanol and 1,4-dioxane can be detected at 10 ppb with no degradation of peak shape. A calibration curve from 5 to 150 ppb passed all acceptance criteria for USEPA Method 8260, and statistical MDLs were 1.8 ppb and 2.1 ppb, respectively. Using the SIM mode allowed detection of ethanol in the single-digit ppb range.
References1. OI Analytical Application Note 1996, Analysis of Fuel Oxygenates Using the Eclipse Purge-and-Trap Sample
Concentrator. Available from OI Analytical, P.O. Box 9010, College Station, TX, 77842-9010.
2. McCaffrey, C. A.; MacLachlan, J.; Brookes, B. I. Analyst 1994, 119, 897–902.
3. Helmig, D.; Greenberg, J. P. Journal of Chromatography 1994, 677, 123–132.
4. Volatile Organic Compounds by Gas Chromatography/Mass Spectrometry (GC/MS), Revision 2. Test Methods for Evaluating Solid Waste, Physical/Chemical Methods; SW-846; U.S. Environmental Protection Agency, Office of Solid Waste (OSW) Methods Team: Washington, DC; December 1996; Method 8260B.
Methanol250 ppb
m/z = 31, 32, and 29