low-income and minority families face more credit constraints
TRANSCRIPT


Access DenieDLow-Income and Minority Families Face More Credit
Constraints and Higher Borrowing Costs
christian e. WellerSen ior Fe l low, Center fo r Amer i can Progress
August 2007

w w w . a m e r i c a n p r o g r e s s . o r g
�
Center for American Progress
Introduction
Few families in the United States today could pay cash for a home, their children’s college education, a new car, or a major family medical emergency. Most families need to borrow money to create economic opportunities for themselves or protect
their financial security. Access to credit helps families get ahead in life—to start a new business or pursue an education—and ensure that unforeseen setbacks, such as a tempo-rary decline in income, do not result in unpaid bills or sharp cuts in living standards.
For many families, especially minorities and those with low incomes, access to credit opens doors that were previously closed—literally so in the case of homeownership. In the wake of the recent subprime home lending crisis, however, access to credit is be-coming more restrictive across all credit products, from credit cards to home mortgages, car loans to consumer installment lines of credit, even while persistent differences in ac-cess to credit and in the cost of that credit are still based on race, ethnicity and income.
Specifically, African-American and Hispanic families are still denied credit more often than white families with the same income, and low-income families are more often denied access to credit than middle-income and higher-income families—even when low-income families apply for credit in line with their income and creditworthiness. This type of discrimination in the credit marketplace remains pervasive despite a number of regula-tory efforts to make access to credit non-discriminatory and to make access to credit for low-income families on par with that for wealthier families.
This report extrapolates from the most recent data and existing literature two overarch-ing reasons for persistent discrimination: product steering, in which financial institutions decide which products to offer to which borrowers and on which terms; and industry segmentation, in which different financial institutions specialize in lending to different kinds of customers. Some of these discriminatory patterns appear to be intentional; others are the result of the growth and breadth of today’s credit markets.
The laws of our nation and our common values dictate that access to credit and the costs of credit should not be determined by one’s race, ethnicity or even income. If someone is creditworthy, that person should have access to credit at the same price as everyone else. As the detailed findings of this report demonstrate, there is clear evidence of continuing discrimination. Specifically:

w w w . a m e r i c a n p r o g r e s s . o r gA U G U S T 2 0 0 7
2
Loan denials are more likely for low-income and minority fami-lies. African-American families were about twice as likely as white fami-lies to be denied credit in 2004, the last year in which complete data are available. Hispanics and low-income families are also more likely than their white or wealthier counterparts to be denied credit. These differences in loan denial rates persist even after other factors, such as credit history, are taken into account.
Minority families and low-in-come families feel discouraged from applying for loans. The share of minority families who felt discour-aged from applying for a loan was more than four times larger than that of white families in 2004. And the share of low-income families who felt discouraged from applying for credit was more than twice that of middle-income families and almost nine times that of high-income families. Large dif-ferences persist even after accounting for other factors, such as credit history.
Differences in credit constraints by race and ethnicity persist. The difference between African Americans and whites with respect to credit con-straints—loan denials and being dis-couraged from applying for a loan—widened to a gap of 95.8 percent between 1998 and 2004 from a gap of 82.9 percent between 1989 and 1995.
Credit constraints affect a wide range of loans. The most frequent denials of credit because of race and ethnicity occur with credit card appli-cations (43.5 percent), but other forms of credit also make up substantial shares of loan denials. For instance,
ß
ß
ß
ß
22.5 percent of denied applications for Hispanics were for car loans between 1995 and 2004.
Minority families and lower-in-come families face higher costs of borrowing. Both the share of debt payments to debt as well as the rate of interest charged on that debt tend to be higher for minority families and lower-income families. These dif-ferences in the costs of credit persist even after controlling for other factors.
Cost differences persist over time: Minority families and lower-in-come families were consistently more likely than their white or wealthier counterparts to have higher debt pay-ments relative to debt. The difference in borrowing costs for African Ameri-cans and for whites has diminished over time but is still evident.
Higher costs of borrowing are tied to different credit products: Minority families and lower-income families have larger shares of loans in the form of credit card debt and consumer installment loans. Eleven percent of Hispanic families, for exam-ple, borrowed from finance companies in 2004, compared to only 7.3 percent for whites. The cost of this credit was also higher for Hispanic families than for white families. The median interest rate on installment loans was 9.9 per-cent for whites in 2004 in contrast to 13.3 percent for Hispanics.
Clearly, fair and equitable access to credit remains a problem for low-income and minority families. The data point toward persistent differences across race, ethnic-ity, and income even though there are certain trends that show progress in some
ß
ß
ß

w w w . a m e r i c a n p r o g r e s s . o r g A U G U S T 2 0 0 7
�
areas. For example, while credit market discrimination with respect to loan deni-als has remained high for African-Ameri-can families, the cost differential with white families has decreased.
Still, the data indicate that lower-income and minority families had less access to credit than white families and higher-in-come families. In the wake of recent finan-cial market turmoil, especially in the home mortgage marketplace, there are concerns that credit access will decrease and espe-cially affect those who may need it the most—low-income and minority families.
One fear is that the deterioration of loan quality will lead banks to restrict their lending. Indeed, since the middle of 2006, the quality of banks’ loan portfolios has deteriorated as foreclosures and loan defaults have risen. Data from the Federal Deposit Insurance Corporation show that the share of mortgages that were delin-quent in the first quarter of 2007 was the highest since FDIC began collecting these data in 1990.
In addition, the Mortgage Bankers As-sociation reported recently that the share of mortgages that entered into the
foreclosure process in the first quarter of 2007 was the highest since 1979. Other measures of household economic distress, such as credit card default rates and bank-ruptcy rates, also rose throughout 2006.
Faced with this decline in loan qual-ity, banks have begun to tighten credit standards. Data from the Federal Reserve show that loan officers have become stricter in their mortgage lending stan-dards than at any point since 1991.
Given the findings in this report that low-income and minority families have less credit access than more wealthy families and white families, it is reasonable to assume that minorities and low-income families will disproportionately feel the effects of the current credit tightening. These families will have fewer chances to create economic opportunities for themselves or build assets to ensure their future economic security.
In the following pages, the analysis will first examine the most sweeping data on credit access to establish a baseline for more a detailed multivariate analysis of the same data to highlight continuing dis-crimination in the credit marketplace.
w w w . a m e r i c a n p r o g r e s s . o r gJ U L Y 2 0 0 7
�
Credit Access by the Numbers
To analyze access to credit and the quality of credit, this report relies on a household survey conducted periodically by the Federal Reserve Board, This data set, known as the Survey of Consumer Finances, includes comprehensive information on household debt and assets. The SCF surveys a cross-section of the U.S. population every three years. The survey covers all forms of financial and non-financial assets as well as many forms of credit, such as credit card debt, mortgages, margin debt, loans against pension plans, and life insurances, among others.
The last available survey year is 2004. Consistent data are available since 1989. Al-though the interest of the survey is to compile an accurate picture of financial assets and debt in the United States, the SCF tends to over-sample high-income families. This means the SCF may miss less formal financial interactions—such as those with pawn-brokers or check cashing outlets, which may be more prevalent among lower income families—but capture those families’ interactions with formal financial markets.
This study of the SCF data will first examine how many families have access to any credit.1 Specifically, the study will analyze data on the denial rates of loan applications, the reasons for loan denial, and the types of loans for which applications are most often denied. Second, the report will study the costs of credit for people who have debt and the contributing factors to these cost differences, such as the types and sources of loans. In each case, the differences by income, race, and educational level are considered.
Loan denial rates stay high for low-income and minority families
A first indicator of credit access is whether a family has been denied an application for a loan. Based on the SCF, our analysis considers a borrower to have been denied credit if he or she applied for credit, was turned down, and could not secure the full amount afterwards. Bear in mind as we examine these data that the economic literature suggests two relevant hypotheses when it comes to access to credit:
Due to financial market deregulation, increased competition, and better use of tech-nology, it is possible that loan denial rates for everybody, but especially for low-in-come and minority families, have declined over time.
ß
Access Denied

w w w . a m e r i c a n p r o g r e s s . o r g A U G U S T 2 0 0 7
�
Loan denial rates are expected to be higher for lower-income and minor-ity families than for their wealthier or white counterparts, although again it is possible that these differences may have shrunk over time as greater com-petition may have reduced financial market discrimination.
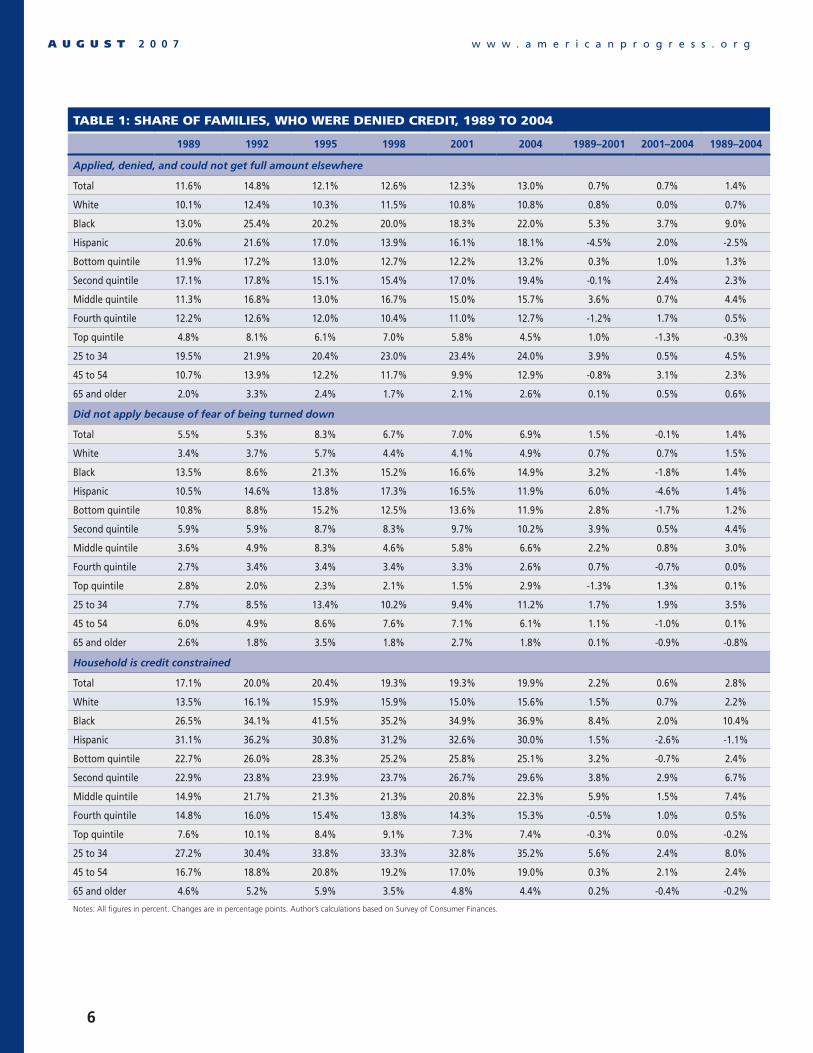
The SCF data show that the share of loan denials has been stable over time. In 2004, the share of families with loan denials was 13 percent, up from 11.6 percent in 1989 and from 12.3 percent in 2001 (see Table 1).2 There is no sign that loan denial rates have declined over the years.
As expected, loan denial rates vary by race and ethnicity. The denial rate for African-American families in 2004 was about twice as large as that for white families—22 percent as compared with 10.8 percent. For Hispanic families, the ratio was closer to one in six compared with white families who could not get the full credit amount for which they had ap-plied (see Table 1).
Denial rates also tend to decline at higher income levels. Families with incomes in the top fifth of the income distribution, or those earning more than $88,030 in 2004 dollars, had denial rates of 4.5 percent in 2004, compared to 15.7 percent for families in the mid-dle quintile, or those earning between $34,738 and $55,331 in 2004 dollars. For lower income families, the situation is even worse—families earning between $18,500 and $34,738 in 2004 dollars faced denial rates of 19.4 percent.
Finally, denial rates tend to decline with age. Older applicants had a better chance of obtaining the loan they applied for than younger ones. Families with a head
ß of household between the ages of 25 and 34 had a loan denial rate of 24.0 percent, almost one in four, while families between the ages of 45 and 54 had loan denial rates of about half that percentage, at 12.9 percent (see Table 1).
Minority families, young families, and moderate-income families tend to have higher loan denial rates than their coun-terparts, and there is no clear sign that denial rates have declined over time. On the contrary, for almost all groups, loan denial rates were higher in 2004 than in 1989 and in 2001.
In addition, differences in denial rates seem to have widened by age and by income. Over time, families in the top 40 percent of income distribution have had increasingly lower denial rates than the rest of the income distribution. The same pattern is true between African-American families and white families, although the gap has narrowed between Hispanic and white families (See Ta-ble 1, page 6).
The analysis so far ignores the possibility that some families may feel discouraged from applying for a loan since they expect to be turned down anyway. If access to credit has increased over time then the share of families who feel discouraged from borrowing should also decline.
The SCF data can shed light on this issue as well. The SCF asks families if they thought about applying for a loan in the previous five years but did not do so because they thought they would be turned down. The figures show that for most families, the share of families who felt discouraged from applying for a loan either increased over time or remained constant.3 For the population as a whole,
w w w . a m e r i c a n p r o g r e s s . o r gA U G U S T 2 0 0 7
�
Table 1: Share of familieS, who were denied crediT, 1989 To 2004
�989 �992 �99� �998 200� 200� �989–200� 200�–200� �989–200�
Applied, denied, and could not get full amount elsewhere
Total 11.6% 14.8% 12.1% 12.6% 12.3% 13.0% 0.7% 0.7% 1.4%
White 10.1% 12.4% 10.3% 11.5% 10.8% 10.8% 0.8% 0.0% 0.7%
Black 13.0% 25.4% 20.2% 20.0% 18.3% 22.0% 5.3% 3.7% 9.0%
Hispanic 20.6% 21.6% 17.0% 13.9% 16.1% 18.1% -4.5% 2.0% -2.5%
Bottom quintile 11.9% 17.2% 13.0% 12.7% 12.2% 13.2% 0.3% 1.0% 1.3%
Second quintile 17.1% 17.8% 15.1% 15.4% 17.0% 19.4% -0.1% 2.4% 2.3%
Middle quintile 11.3% 16.8% 13.0% 16.7% 15.0% 15.7% 3.6% 0.7% 4.4%
Fourth quintile 12.2% 12.6% 12.0% 10.4% 11.0% 12.7% -1.2% 1.7% 0.5%
Top quintile 4.8% 8.1% 6.1% 7.0% 5.8% 4.5% 1.0% -1.3% -0.3%
25 to 34 19.5% 21.9% 20.4% 23.0% 23.4% 24.0% 3.9% 0.5% 4.5%
45 to 54 10.7% 13.9% 12.2% 11.7% 9.9% 12.9% -0.8% 3.1% 2.3%
65 and older 2.0% 3.3% 2.4% 1.7% 2.1% 2.6% 0.1% 0.5% 0.6%
Did not apply because of fear of being turned down
Total 5.5% 5.3% 8.3% 6.7% 7.0% 6.9% 1.5% -0.1% 1.4%
White 3.4% 3.7% 5.7% 4.4% 4.1% 4.9% 0.7% 0.7% 1.5%
Black 13.5% 8.6% 21.3% 15.2% 16.6% 14.9% 3.2% -1.8% 1.4%
Hispanic 10.5% 14.6% 13.8% 17.3% 16.5% 11.9% 6.0% -4.6% 1.4%
Bottom quintile 10.8% 8.8% 15.2% 12.5% 13.6% 11.9% 2.8% -1.7% 1.2%
Second quintile 5.9% 5.9% 8.7% 8.3% 9.7% 10.2% 3.9% 0.5% 4.4%
Middle quintile 3.6% 4.9% 8.3% 4.6% 5.8% 6.6% 2.2% 0.8% 3.0%
Fourth quintile 2.7% 3.4% 3.4% 3.4% 3.3% 2.6% 0.7% -0.7% 0.0%
Top quintile 2.8% 2.0% 2.3% 2.1% 1.5% 2.9% -1.3% 1.3% 0.1%
25 to 34 7.7% 8.5% 13.4% 10.2% 9.4% 11.2% 1.7% 1.9% 3.5%
45 to 54 6.0% 4.9% 8.6% 7.6% 7.1% 6.1% 1.1% -1.0% 0.1%
65 and older 2.6% 1.8% 3.5% 1.8% 2.7% 1.8% 0.1% -0.9% -0.8%
Household is credit constrained
Total 17.1% 20.0% 20.4% 19.3% 19.3% 19.9% 2.2% 0.6% 2.8%
White 13.5% 16.1% 15.9% 15.9% 15.0% 15.6% 1.5% 0.7% 2.2%
Black 26.5% 34.1% 41.5% 35.2% 34.9% 36.9% 8.4% 2.0% 10.4%
Hispanic 31.1% 36.2% 30.8% 31.2% 32.6% 30.0% 1.5% -2.6% -1.1%
Bottom quintile 22.7% 26.0% 28.3% 25.2% 25.8% 25.1% 3.2% -0.7% 2.4%
Second quintile 22.9% 23.8% 23.9% 23.7% 26.7% 29.6% 3.8% 2.9% 6.7%
Middle quintile 14.9% 21.7% 21.3% 21.3% 20.8% 22.3% 5.9% 1.5% 7.4%
Fourth quintile 14.8% 16.0% 15.4% 13.8% 14.3% 15.3% -0.5% 1.0% 0.5%
Top quintile 7.6% 10.1% 8.4% 9.1% 7.3% 7.4% -0.3% 0.0% -0.2%
25 to 34 27.2% 30.4% 33.8% 33.3% 32.8% 35.2% 5.6% 2.4% 8.0%
45 to 54 16.7% 18.8% 20.8% 19.2% 17.0% 19.0% 0.3% 2.1% 2.4%
65 and older 4.6% 5.2% 5.9% 3.5% 4.8% 4.4% 0.2% -0.4% -0.2%
Notes: All figures in percent. Changes are in percentage points. Author’s calculations based on Survey of Consumer Finances.

w w w . a m e r i c a n p r o g r e s s . o r g A U G U S T 2 0 0 7
7
6.9 percent felt discouraged from apply-ing for a loan in 2004, marginally down from 7.0 percent in 2001 and up from 5.5 percent in 1989 (see Table 1). Again there is no indication that families be-came less credit constrained.
Just as with denial rates, however, the share of discouraged families varied with race, income, and age. Minorities were substantially more likely to feel discour-aged from applying than whites; lower-in-come families tended to be more dis-couraged than higher-income ones; and younger families felt that they would be denied credit more frequently than older families. These gaps have either stayed constant or widened over time, rather than declined (see Table 1).
The results of the analysis so far indi-cate that credit access has not materially changed between 1989 and 2004. To be sure, the rise in denial rates may also reflect a growing share of applications, which could increase the likelihood that more people are denied credit, all else be-ing equal, because people who previously had not even contemplated applying for a loan now apply. To control for changes in denial rates, this study calculated the ratio of denials to applications, since improvements in credit access would not be measured by smaller denial rates but rather by a decline in denials relative to applications (see Table 2).
The result of that analysis: the ratio of denials to applications was essentially unchanged between 1995 and 2004. In 1995, the first year for which these data are available, the ratio of denials to appli-cations was 19.1 percent, while nine years later it was 18.9 percent. At least in the aggregate, there is not much evidence of greater access to credit.
Furthermore, the gap in credit access widened by race, income, and age. For instance, in 2004, whites had the lowest ratio of denials to applications of any year, at 15 percent, down from 16 percent in 2001 and 15.7 percent in 1995. In con-trast to this small improvement for whites, African Americans saw their denials rela-tive to applications increase to 39.2 per-cent in 2004, up from 30.6 percent in 2001 and from 35.9 percent in 1995.
Similarly, the ratio of denials to applica-tions for Hispanics was unchanged be-tween 2001 and 2004 at 30.8 percent, a slight increase from 28.9 percent in 1995. In addition, the gap between moder-ate-income and higher-income families widened and younger families became in-creasingly more likely to be denied credit relative to applications.
Reasons for denial reflect credit history, low income, and low wealth
The SCF data provide some information on the reasons for loan denials. Assuming that the reasons are reported accurately, or at least with no systematic error, by the families who were denied credit, these data can shed some light on the obstacles that families face in improving credit ac-cess and what may be done to increase credit access.
The main reason for the loan denials was that borrowers did not meet a lender’s criteria for a specific loan, either because the borrower had a spotty or limited credit history or because the loan was too large, among other, similar reasons. Close to three-quarters of people were denied credit because they did not meet a bank’s criteria for the loan for which they

w w w . a m e r i c a n p r o g r e s s . o r gA U G U S T 2 0 0 7
8
applied. Among them, almost one-third of families who had been denied credit in the past five years had not gotten the desired credit because of their potentially spotty record and another 13.2 percent were denied credit because they had no credit history (see Table 3).
Next, about one in five families were denied their loan applications because of financial reasons, such as insufficient income or wealth. Thus credit histories and lack of financial resources, either by themselves or relative to the size of the loan, explained 80.4 percent of all loan
Table 2: Share of familieS, who applied for crediT, 1995 To 2004
�99� �998 200� 200� �99�–200� 200�–200� �99�–200�
Total 63.6% 63.5% 64.8% 68.7% 1.2% 3.9% 5.0%
White 65.3% 65.9% 67.5% 72.1% 2.3% 4.6% 6.8%
Black 56.4% 54.1% 59.8% 56.1% 3.4% -3.7% -0.3%
Hispanic 58.8% 54.8% 52.2% 58.7% -6.6% 6.5% -0.1%
Bottom quintile 35.0% 37.6% 36.2% 44.2% 1.2% 8.0% 9.2%
Second quintile 61.2% 56.8% 61.0% 60.2% -0.2% -0.8% -1.0%
Middle quintile 72.5% 73.3% 73.0% 73.0% 0.6% 0.0% 0.6%
Fourth quintile 82.1% 80.4% 77.6% 81.8% -4.5% 4.2% -0.3%
Top quintile 79.4% 79.2% 80.4% 85.0% 1.0% 4.6% 5.6%
25 to 34 78.7% 76.1% 80.0% 78.6% 1.3% -1.4% -0.2%
45 to 54 74.7% 72.0% 72.9% 78.6% -1.8% 5.7% 3.9%
65 and older 27.5% 25.6% 28.5% 41.6% 1.0% 13.1% 14.1%
Ratio of denials to applications
Total 19.1% 19.9% 19.0% 18.9% -0.1% 0.0% -0.1%
White 15.7% 17.5% 16.0% 15.0% 0.3% -1.1% -0.8%
Black 35.9% 37.0% 30.6% 39.2% -5.3% 8.6% 3.3%
Hispanic 28.9% 25.4% 30.8% 30.8% 1.9% 0.0% 1.9%
Bottom quintile 37.3% 33.8% 33.7% 29.8% -3.5% -4.0% -7.5%
Second quintile 24.7% 27.1% 27.8% 32.2% 3.1% 4.4% 7.5%
Middle quintile 17.9% 22.8% 20.5% 21.5% 2.6% 1.0% 3.6%
Fourth quintile 14.6% 13.0% 14.1% 15.5% -0.4% 1.3% 0.9%
Top quintile 7.7% 8.8% 7.2% 5.3% -0.5% -1.9% -2.4%
25 to 34 25.9% 30.2% 29.3% 30.5% 3.4% 1.2% 4.6%
45 to 54 16.3% 16.2% 13.6% 16.5% -2.8% 2.9% 0.1%
65 and older 8.8% 6.7% 7.4% 6.3% -1.4% -1.1% -2.6%
Notes: All figures in percent. Changes are in percentage points. Author’s calculations based on Survey of Consumer Finances.
denials between 1995 and 2004. There are few differences in the reasons given for loan denials by demographic char-acteristics, which seems to suggest that getting a loan application approved is mainly tied to credit history and finan-cial resources.
But that’s not the end of the story. Our analysis shows that families are denied credit not just for perfectly sound busi-ness reasons, such as bad credit or trying to borrow too much. Often when families are denied credit it is for a credit card application. A little over 40 percent of all

w w w . a m e r i c a n p r o g r e s s . o r g A U G U S T 2 0 0 7
9
families were denied a credit card ap-plication between 1995 and 2004 (see Table 4), but credit card loan denial rates were particularly high for low-income and high-income families. This com-parison between the least wealthy and the wealthiest in our society is mislead-ing, however, since low-income families depend disproportionately more on credit card debt than high-income families. Thus the denial of a credit card appli-cation to a low-income family is likely a more serious barrier to overall credit ac-cess than it is for a high-income family.
The remaining loan denials were spread out broadly among a number of forms of credit. Sixteen percent of the denied applications were for car loans, 12 per-cent were for installment or consumer loans, 9.7 percent were for mortgages, and 8.0 percent were for lines of credit, such as home equity lines of credit (see
Table 4). Among these types of bor-rowings, there were some variations by demographic characteristic. Hispanic families, middle-class families with in-comes in the fourth quintile, and families with head or heads of household be-tween the ages of 45 and 54 had relative-ly high loan denial rates for mortgages. The same is true for installment loans. In comparison, Hispanic families, low-income families and young families had relatively high denial rates for car loans. And the denial rates for lines of credit are comparatively high for high-income families and families with head or heads of household 65 and older.
All of these small variations indicate there is no simple one-size-fits-all rule that explains why different groups of borrowers had easier access than oth-ers to one particular form of credit. Yet, despite the variety of conclusions based
Table 3: Share of loan Type ThaT waS denied Since 1995
PersoNAl ChArACterIstICs
CreDIt ChArAterIstICs
FINANCIAl ChArACterIstICs
TotalPrevious records, other institution,
possibly bankruptcy
Amount of debt/ability to repay
No credit history
�� �� �2
Total 2.0% 73.5% 32.8% 14.1% 13.2% 20.4%
White 2.0% 74.4% 33.5% 14.9% 11.7% 18.9%
Black 1.8% 73.1% 35.9% 13.0% 12.8% 21.7%
Hispanic 1.9% 66.9% 23.7% 12.9% 22.5% 28.5%
Bottom quintile 2.6% 62.3% 25.6% 8.4% 17.8% 29.5%
Second quintile 1.8% 72.5% 31.6% 11.5% 17.0% 21.4%
Middle quintile 1.3% 77.8% 36.3% 15.5% 11.3% 18.0%
Fourth quintile 2.7% 79.4% 37.6% 20.8% 6.2% 14.0%
Top quintile 2.0% 73.5% 36.2% 20.9% 6.7% 20.4%
25 to 34 1.1% 76.7% 36.3% 11.5% 15.4% 19.1%
45 to 54 1.7% 73.3% 34.2% 15.4% 7.5% 22.8%
65 and older 10.9% 53.5% 23.5% 18.2% 2.6% 25.4%
Notes: All figures in percent. Author’s calculations based on Survey of Consumer Finances.

w w w . a m e r i c a n p r o g r e s s . o r gA U G U S T 2 0 0 7
�0
on the descriptive statistics, there is still significant evidence of credit market discrimination as our detailed analysis below demonstrates.4
Credit access also means credit affordability
Aside from getting a loan application approved, the other aspect of credit access is the cost of credit. As the re-cent experience in the marketplace for subprime home mortgages has shown, many borrowers can often secure some form of credit, albeit at often unsus-tainable costs. When the costs of credit are high or very volatile, borrowers can often find themselves unable to ser-vice their debts in a timely, consistent fashion. The recent wave of subprime mortgage lending is now being followed by record high foreclosure rates as many borrowers find themselves burdened with unaffordable loans.
The best way to approximate the cost of credit is to calculate the ratio of debt pay-ments to outstanding debt. The sum of all debt payments captures a number of com-ponents of the costs of debt: interest, fees, and other payment terms. Debt payments are then added up for all forms of out-standing credit, in essence creating a pay-ment measure that is a weighted average across all loans. This method of calculating the cost of credit is preferable to a simple interest rate measure, which only reflects one condition on the most recent loan.
Since the payments-to-debt ratio is a composite measure that captures all pay-ments and all loan values, it is important to keep in mind that there are several fac-tors at play here. First, this ratio is likely influenced by the age of the borrower. Older families are more likely to have paid off a larger share of their debt. Yet payments may not decline with age be-cause payments include a growing share of principle over time.
Table 4: Share of loan Type ThaT waS denied
MortgAge CAr loANother
INstAllMeNt loAN
CreDIt CArD
lINe oF CreDIt
stuDeNt loAN
PersoNAl loAN
other
Total 9.7% 16.0% 12.0% 43.5% 8.0% 0.9% 4.0% 6.0%
White 10.0% 14.9% 12.0% 43.9% 8.7% 0.6% 2.8% 7.2%
Black 7.2% 16.8% 13.2% 42.7% 7.4% 0.9% 6.7% 5.2%
Hispanic 12.0% 22.5% 10.2% 41.2% 4.9% 1.1% 3.4% 4.7%
Bottom quintile 7.2% 18.8% 11.2% 47.0% 3.7% 1.0% 0.0% 11.1%
Second quintile 8.9% 17.2% 11.7% 43.5% 7.1% 0.7% 5.6% 5.3%
Middle quintile 9.7% 15.9% 13.1% 41.3% 10.0% 1.1% 3.3% 5.6%
Fourth quintile 13.7% 14.5% 13.5% 38.7% 9.7% 1.0% 2.1% 6.8%
Top quintile 11.0% 7.5% 9.2% 48.5% 13.5% 0.0% 1.6% 8.8%
25 to 34 9.0% 18.7% 10.6% 45.1% 6.7% 1.1% 3.7% 5.2%
45 to 54 12.8% 8.8% 15.2% 40.9% 8.9% 1.0% 3.8% 8.5%
65 and older 6.9% 14.0% 12.2% 42.3% 16.7% 0.0% 3.4% 4.4%
Notes: All figures in percent. Author’s calculations based on Survey of Consumer Finances.

w w w . a m e r i c a n p r o g r e s s . o r g A U G U S T 2 0 0 7
��
Second, the composition of debt mat-ters.5 Mortgage debt tends to be cheaper than other forms of credit, while credit card debt tends to be more expensive than mortgages and home equity lines. Mort-gages tend to be secured by real assets and not just income. In addition, lenders can reduce their risk exposure by bundling and selling their mortgages to a third party through securitization. Hence, mortgages tend to cost less than other forms of credit.
Importantly, the cost difference between mortgage credits and other forms of credit is often nuanced, as the recent ex-perience in subprime lending has shown. In recent years, a growing share of mortgage borrowers have received loans in the subprime market, where costs tend to be higher. Many subprime loans, though, were also adjustable rate mort-gages, or ARMs, which offered borrow-ers initially lower interest payments. The upshot, for the purposes of our analysis, is that over the time period under inves-tigation there are two competing forces
at work: a growing share of subprime mortgages, which would imply higher costs, as well as more ARMs, which, at least initially, mean lower payments.
Third, payment conditions are included in the ratio of payments to debt. Some families may deliberately seek condi-tions, such as longer repayment peri-ods, to reduce their monthly payments. Lower principle payments due to a longer payment period can offset higher interest rates to combine to lower total debt payments.
How important are payment condi-tions? One way to gauge people’s choices for payment conditions is the share of ARMs, since they initially offer lower payments.6,7 There is no systematic differ-ence in the average share of ARMs out of total mortgages between whites, Afri-can Americans, and Hispanics.8 This is important, since the results of our analy-sis show that if the shares of ARMs are an appropriate indicator of the likelihood
Table 5: median debT paymenTS
�989 �992 �99� �998 200� 200� �989–200� 200�–200� �989–200�
Relative to debt
Total 28.2% 24.9% 23.7% 21.6% 20.8% 16.8% -7.4% -4.0% -11.4%
White 25.5% 23.0% 22.0% 20.4% 19.6% 15.7% -5.9% -3.8% -9.7%
Black 36.0% 30.0% 30.0% 29.4% 28.6% 22.1% -7.5% -6.4% -13.9%
Hispanic 29.9% 30.0% 25.0% 29.7% 25.9% 19.7% -4.0% -6.2% -10.2%
Bottom quintile 36.6% 30.0% 30.0% 30.0% 30.0% 27.7% -6.6% -2.3% -8.9%
Second quintile 30.0% 30.0% 30.0% 30.0% 30.0% 23.2% 0.0% -6.8% -6.8%
Middle quintile 30.0% 27.3% 25.7% 24.0% 24.6% 17.4% -5.4% -7.1% -12.6%
Fourth quintile 23.1% 22.0% 20.0% 17.8% 18.7% 16.0% -4.5% -2.7% -7.2%
Top quintile 20.3% 17.6% 17.1% 16.7% 15.9% 13.3% -4.3% -2.6% -7.0%
25 to 34 25.4% 26.6% 22.7% 20.7% 20.3% 15.0% -5.2% -5.3% -10.5%
45 to 54 28.0% 22.8% 21.0% 20.1% 19.6% 16.1% -8.4% -3.5% -11.9%
65 and older 30.0% 30.0% 30.0% 30.0% 30.0% 25.9% 0.0% -4.1% -4.1%
Notes: All figures in percent. Changes are in percentage points. Author’s calculations based on Survey of Consumer Finances.

w w w . a m e r i c a n p r o g r e s s . o r gA U G U S T 2 0 0 7
�2
Table 6: Summary STaTiSTicS on inTereST raTeS in 2004
CreDIt CArDs MortgAges CAr loANseDuCAtIoN
loANslINe oF CreDIt
INstAllMeNt loANs
WeIghteD AverAge
Median interest rates on specified loans
Total 12.0% 6.0% 6.9% 4.0% 5.0% 11.0%
White 12.0% 5.9% 6.5% 4.0% 5.0% 9.9%
Black 12.0% 6.5% 9.0% 4.6% 5.0% 12.0%
Hispanic 12.9% 6.2% 8.0% 4.0% 4.8% 13.3%
Bottom quintile 12.9% 6.5% 8.0% 4.0% 5.0% 13.5%
Second quintile 12.9% 6.5% 7.9% 4.0% 5.5% 13.0%
Middle quintile 12.0% 6.1% 7.5% 4.0% 5.3% 11.0%
Fourth quintile 12.0% 5.9% 6.5% 4.1% 5.0% 9.4%
Top quintile 12.0% 5.6% 5.5% 4.3% 4.5% 7.9%
25 to 34 12.0% 5.9% 6.9% 4.1% 5.4% 10.0%
45 to 54 12.5% 6.0% 6.0% 4.1% 4.8% 11.7%
65 and older 12.0% 6.0% 6.5% 5.0% 4.8% 14.7%
Average interest rates on specified loans
Total 12.7% 6.3% 7.7% 4.9% 5.7% 12.3% 6.6%
White 12.6% 6.2% 7.2% 4.7% 5.7% 12.1% 6.5%
Black 13.2% 7.4% 10.0% 5.7% 6.4% 12.6% 8.1%
Hispanic 13.6% 6.7% 9.2% 4.6% 5.8% 12.7% 7.0%
Bottom quintile 13.3% 7.2% 9.0% 5.2% 5.6% 14.2% 8.9%
Second quintile 13.4% 7.0% 8.9% 5.3% 6.6% 14.0% 8.4%
Middle quintile 13.0% 6.6% 8.8% 4.8% 6.4% 11.3% 7.3%
Fourth quintile 12.4% 6.2% 7.3% 4.6% 5.8% 11.1% 6.8%
Top quintile 12.0% 5.7% 5.9% 4.8% 5.1% 9.7% 5.4%
25 to 34 13.0% 6.2% 8.1% 4.9% 6.8% 11.8% 7.1%
45 to 54 12.9% 6.3% 7.5% 5.4% 5.9% 12.7% 6.3%
65 and older 12.6% 6.1% 6.9% 4.8% 4.8% 13.0% 7.0%
Shares of families with interest rates 8 pct. pt. above prime rate in 2004
Total 46.7% 1.6% 11.2% 1.6% 3.9% 40.4%
White 46.0% 0.9% 8.9% 0.9% 3.8% 37.1%
Black 47.3% 7.7% 23.3% 5.4% 7.8% 48.7%
Hispanic 53.1% 2.2% 18.5% 0.7% 0.0% 51.3%
Bottom quintile 52.5% 4.2% 13.6% 3.8% 2.1% 52.4%
Second quintile 50.9% 4.0% 16.5% 4.3% 8.2% 51.6%
Middle quintile 48.2% 1.7% 16.5% 1.3% 8.4% 37.1%
Fourth quintile 43.8% 1.7% 10.0% 0.5% 2.9% 28.9%
Top quintile 43.2% 0.2% 3.3% 0.0% 2.0% 25.1%
25 to 34 47.2% 1.4% 13.5% 2.3% 12.2% 34.0%
45 to 54 49.1% 1.6% 10.8% 0.3% 4.3% 41.4%
65 and older 48.3% 0.0% 5.4% 0.0% 0.0% 61.5%
Notes: All figures in percent. Author’s calculations based on Survey of Consumer Finances.
w w w . a m e r i c a n p r o g r e s s . o r g A U G U S T 2 0 0 7
��
of families to choose lower principal pay-ments, then all else being equal, the data drawn from the SCF and analyzed by the ratio of debt payments to outstanding debt captures differences in higher fees and interest rates by race and ethnicity.
In contrast, the share of ARMs out of total mortgages tends to be high for low-income families and high-income families and lower in the middle of the income scale. This trend would suggest that dif-ferences in other costs of credit between low-income and middle-income families may be understated.
Minority families and low- income families pay more for their debt
The median ratio of debt payments to debt for all families has declined over time. In 2004, the typical borrower had payments equal to 16.8 percent of their total debt, down from 28.2 percent in 1989 (see Table 5). This suggests that lower interest rates translated into lower payments for the typical family—and this trend of declining payments per outstanding debt holds for all groups. Indeed, the trend is most pronounced among African-American families, middle-income families, and families with head or heads of household between the ages of 45 and 54. For instance, African-American borrowers paid 22.1 percent of their debt in debt payments annually in 2004, down from 36.0 percent in 1989.
Even after the decline in debt payments relative to total debt, large differences in the costs of debt persist. Most impor-tantly minorities pay more for their debt relative to the amount of their debt than whites; low-income families pay more
than higher-income ones; and families over the age of 65 pay more than their younger counterparts, relative to their remaining amount of debt.
In particular, African Americans paid 22.1 percent of their debt in debt pay-ments in 2004, compared to 19.7 per-cent for Hispanics, and 15.7 percent for whites. That is, for each dollar of debt they owed, whites paid $0.06 less than African-Americans. On a $100,000 loan, this means $640 less in debt payments over the course of a year.
For minority families and low-income families, these differences likely reflect higher costs of debt. In contrast, though, the lower payments relative to debt by age may also reflect the fact that older families likely have less outstanding debt, while their payments on many forms of credit may be constant over time.
To get at these cost differences, we consid-er the interest rates charged for loans to see if there are systematic differences across groups. This comparison is only sugges-tive of the cost differences because interest rates are only recorded for the most recent loan in a particular loan category and be-cause interest rates do not include fees and other non-interest costs of loans.
The result of this analysis: interest rates tend to be higher for minorities than for whites, and higher for low-income fami-lies than for higher-income ones (see Ta-ble 6). Specifically, median interest rates are either equal or higher for minorities than for whites, and for low-income fami-lies compared with higher-income ones. A similar pattern emerges when average interest rates, instead of median interest rates, are considered (see Table 6).

w w w . a m e r i c a n p r o g r e s s . o r gA U G U S T 2 0 0 7
��
This trend also means that the average rate of interest across all forms of debt, weighted by the respective forms of credit, was higher for minority families, low-in-come families and young families than for their respective counterparts. For example, African-American families had an average interest rate of 8.1 percent on all of their debt in 2004, compared with 6.5 percent for whites and 7.0 percent for Hispanics. Indeed, the share of minority families and low-income and moderate-income fami-lies with very high interest on their debt is greater than for their counterparts (see Table 6). For example, the share of Afri-can Americans with mortgages that had interest rates that were at least eight per-cent above the prime rate was 7.7 percent in 2004, compared with 2.2 percent for Hispanics and only 0.9 percent for whites.
In addition, the share of Hispanics with credit card interest rates that were at least eight percent above the prime was 53.1 percent, compared with 47.3 percent for African Americans and 46 percent for
whites. A similar pattern exists for low-income and moderate-income families. While 52.5 percent of families in the bot-tom income quintile had credit card in-terest rates that were at least eight percent above the prime rate, only 43.2 percent of families in the top quintile had such high interest rates in 2004 (see Table 6).
Higher debt payments likely reflect high-er-cost loans for minority families and low-income families. This suggests that minority families and low-income families are both more likely to be denied credit and face higher costs for their credit than their counterparts.
Minorities and low-income fami-lies have more high-cost debt
The relatively higher debt payments of minorities also reflect a larger share of loans from more costly sources, particular-ly installment loans, and a smaller share from less costly sources, such as mortgag-
Table 7: average ShareS of Specified debT in 2004
MortgAgesother resIDeNtIAl reAl estAte Debt
other lINes oF CreDIt
CreDIt CArD bAlANCes
INstAllMeNt CreDIt
other Debt
Total 75.3% 8.6% 0.7% 3.0% 10.8% 1.6%
White 75.8% 8.2% 0.8% 2.9% 10.5% 1.8%
Black 70.5% 6.2% 0.0% 3.7% 18.2% 1.4%
Hispanic 76.8% 7.9% 0.5% 3.3% 10.9% 0.6%
Bottom quintile 60.4% 5.6% 1.2% 5.9% 25.0% 2.8%
Second quintile 70.6% 3.6% 0.6% 5.3% 18.7% 1.5%
Middle quintile 76.8% 3.9% 0.5% 4.7% 13.5% 0.9%
Fourth quintile 79.6% 3.9% 0.8% 3.3% 12.4% 0.5%
Top quintile 74.6% 13.1% 0.4% 1.7% 7.2% 2.2%
25 to 34 77.2% 3.1% 0.7% 2.7% 15.8% 1.1%
45 to 54 76.2% 11.7% 0.6% 2.9% 7.4% 4.4%
65 and older 62.2% 9.5% 2.0% 4.6% 17.4% 2.8%
Notes: All figures in percent. Author’s calculations based on Survey of Consumer Finances.

w w w . a m e r i c a n p r o g r e s s . o r g A U G U S T 2 0 0 7
��
es. For instance, the average share of in-stallment loans was 18.2 percent for Afri-can Americans, but only 10.5 percent for whites and 10.9 percent for Hispanics (see Table 7). Similarly, lower-income families had one-fourth of their debt in install-ment loans, compared to 13.5 percent for middle-income families and 7.7 percent for families in the top fifth of the income distribution (see Table 7).
The figures show that lower-income fami-lies and minority families tend to receive relatively more credit than their coun-terparts from sources that are typically more expensive, such as installment loans, whereas other groups rely more heavily on cheaper sources, such as mortgages. It is important to keep in mind, however, that the varying reliance on different sources of income reflects differing economic fundamentals. Specifically, higher-income families can offer more collateral, both in the form of income and wealth, which tends to give them more access than low-er-income families to lower-cost debt.
Yet this cost increase from the composi-tion of credit comes in addition to minor-ity families and lower-income families be-ing charged higher interest on the same types of loans as their counterparts. This interest rate differential may in part re-flect differences in credit history, but it is also in part a reflection of credit market discrimination.
Minorities and low-income families depend on more costly lenders
It is possible that the institution from which the loan originates can have an effect on the costs of credit. In particu-lar, credit unions tend to offer lower-cost
forms of credit than many other institu-tions. To simplify the discussion, financial institutions are combined into three cat-egories: credit unions, traditional lenders, and consumer lenders. Traditional lend-ers comprise commercial banks, savings and loan institutions, and non-deposit-taking mortgage banks, while consumer lenders are credit card companies and finance companies.
Credit unions, which may offer lower-cost credit, account for only 3.6 percent of all debt (see Table 8). White families tend to have more credit from credit unions than non-white families; middle-income families tend to have more credit from credit unions than either low-income or high-income families; and families in the middle of the age range owe more debt to credit unions than either younger or older families.
Traditional lenders are less important to African Americans, lower-income fami-lies, and older families than their coun-terparts. Strikingly, Hispanics receive 46 percent of their loans from real estate lenders, a greater share than for any other group. In contrast, whites and Afri-can Americans receive only 34 percent of their loans from real estate lenders.
This statistic means that the Hispanic community’s total share of loans from traditional lenders amounts to more than 80 percent, while the combined share is only 72.3 percent for African Americans. The combined share of credit from traditional lenders increases with income. At the same time, families with head or heads of household be-tween the ages of 45 and 54 receive the largest combined share of credit from these three sources.

w w w . a m e r i c a n p r o g r e s s . o r gA U G U S T 2 0 0 7
��
Finally, only minorities receive a dispro-portionate share of credit from consumer lenders (see Table 8). Only white families, high-income families, and families with head or heads of household between the ages of 45 and 54 receive a relatively low share of credit from finance compa-nies and credit card lenders. Insofar as the cost of credit increases from credit unions to traditional lenders to consumer lenders, it is minorities, especially Afri-can-American families and lower-income families, who may rely on more costly institutions than their counterparts do.
Multivariate analysis for loan denial and credit constraints
So far, our analysis has demonstrated that there are indications of discrimina-tion in access to credit. Yet many interac-tions between income, age, race, ethnicity, and other factors make it hard to arrive at conclusive answers on credit denials.
The data show that in the aggregate, loan denial rates did not decline and that the share of families who were credit con-strained—either denied credit or discour-aged from applying—may have increased, if it changed at all. What was the exact experience for African-American and other minority families, for young fami-lies, for low-income families, after other important factors are controlled for?
To answer this question, I conducted a multivariate analysis in which the influ-ence of more than one variable on credit access is examined at the same time. In such an analysis, a logit regression is es-timated whereby the dependent variable is a binary variable that takes the value of “1” if the family was denied credit at some point in the prior five years, and “0” otherwise.9 A similar regression is estimat-ed for the chance that a family was credit constrained (denied credit or discouraged from applying for a credit). A final logit regression is estimated for the chance of being discouraged from applying.
Table 8: average ShareS of loanS from Specified inSTiTuTionS
CreDIt uNIoN
CoMMerCIAl bANks
sAvINgs & loAN
reAl estAte leNDer
totAl, trADItIoNAl
leNDers
FINANCe CoMPANy
CreDIt CArD
leNDer
totAl, CoNsuMer
FINANCeother
Total 3.6% 34.8% 7.3% 35.5% 77.6% 8.0% 3.3% 11.2% 7.5%
White 4.0% 36.0% 7.6% 34.0% 77.7% 7.3% 3.2% 10.5% 7.9%
Black 3.9% 31.3% 7.1% 34.0% 72.3% 8.3% 4.2% 12.4% 11.3%
Hispanic 1.6% 28.6% 6.4% 46.0% 81.0% 11.0% 3.7% 14.7% 2.8%
Bottom quintile 2.7% 35.6% 6.9% 24.3% 66.8% 7.4% 5.9% 13.2% 17.4%
Second quintile 4.0% 27.8% 4.5% 35.5% 67.8% 8.5% 5.4% 13.9% 14.4%
Middle quintile 3.8% 30.9% 5.8% 37.4% 74.0% 10.4% 4.9% 15.3% 6.9%
Fourth quintile 4.4% 34.6% 7.5% 36.6% 78.7% 9.0% 3.6% 12.6% 4.3%
Top quintile 3.3% 37.0% 8.1% 35.3% 80.4% 6.7% 2.2% 8.9% 7.4%
25 to 34 2.3% 31.2% 5.1% 41.0% 77.2% 9.2% 2.8% 11.9% 8.6%
45 to 54 3.4% 35.7% 8.4% 34.2% 78.3% 8.5% 3.4% 11.9% 6.5%
65 and older 3.1% 34.8% 9.3% 30.9% 75.0% 4.4% 4.8% 9.2% 12.7%
Notes: All figures in percent. Author’s calculations based on Survey of Consumer Finances.

w w w . a m e r i c a n p r o g r e s s . o r g A U G U S T 2 0 0 7
�7
In each case, the value of the dependent variables is equal to one if the answer is “yes” and zero otherwise. This approach shows the trends for the share of credit constraints and highlights whether loan denials or loan discouragement are more likely contributors to changes in credit constraints. The explanatory variables that are included in this multivariate analysis fall into three categories:
Personal characteristics, such as age, education, family size, marital status, race, and ethnicity
Credit history, specifically an indica-tion if a family has been delinquent for 60 days or more on any bill in the past five years, the number of institutions with whom the family has a financial relationship, the types of institutions from which the family has borrowed, and an indication if a family sees itself more as a saver or non-saver.10
Financial background, particularly in-come, assets, and homeownership.11
The reason for choosing these sets of variables is to discover the effect of age, income, race, and ethnicity on loan deni-als and credit constraints. The descriptive statistics detailed in the first part of this report suggest that minorities, lower-in-come families, and younger families have less credit access than their counterparts and that these differences have increased over time. If these results hold with re-spect to minorities when several variables are controlled for simultaneously, then it would be more fully clear that financial market discrimination exists and that it may have increased over time.12
The logit regression analysis is con-ducted over two periods of time, 1989 to
ß
ß
ß
1995 and 1998 to 2004 since those split the years exactly in half. The reason for this separation is to see the differences of the likelihood of being denied credit over time.13
Lending discrimination still exists, but its effect diminishes over time
The results show that, over time, differ-ences in credit access by income have diminished. In the past, a one percent decline in inflation-adjusted income translated into an increase in the proba-bility of being denied a credit application (see Table 9). In the latter years, income differences had no statistically significant effect on the chance of loan applications being denied.
In addition, there are indications of discrimination based on race and ethnic-ity between 1989 and 1995 and between 1998 and 2004. Specifically, the estimated coefficients for African-American families are positive and statistically significant in both subperiods, while the coefficient for Hispanics is only positive and significant in the earlier period.
That is, minorities are more likely to be denied credit, even after controlling for all other factors. Odds ratios indicate that African Americans had a 58 per-cent greater chance than whites in the earlier period to be denied credit, while Hispanics had a 55.3 percent greater likelihood than whites of being denied credit between 1989 and 1995.14 In the latter period, African Americans still had a larger probability (51.6 percent) than whites to be denied credit, while there was no statistical difference between His-panics and whites.

w w w . a m e r i c a n p r o g r e s s . o r gA U G U S T 2 0 0 7
�8
Table 9: logiT regreSSion of loan denial raTeS
exPlANAtory vArIAble beFore �998 AFter �99�AFter �99� extrA
vArIAbles
Personal characteristics CoefficientStandard Deviation
CoefficientStandard Deviation
CoefficientStandard Deviation
Household head has less than high school degree -0.025 0.159 0.354** 0.141 0.335** 0.142
Household head has high school degree 0.076 0.112 0.271*** 0.096 0.244** 0.096
Household head has some college 0.237** 0.117 0.468*** 0.100 0.437*** 0.101
Age 0.073*** 0.020 0.029* 0.017 0.019 0.017
Age2 -0.001*** 0.000 -0.001*** 0.000 -0.001*** 0.000
Family size 0.053 0.037 0.059** 0.029 0.050* 0.030
Married -0.193 0.141 0.025 0.124 0.025 0.124
Single women -0.143 0.136 0.198* 0.117 0.191 0.118
African-American 0.458*** 0.121 0.416*** 0.099 0.375*** 0.099
Hispanic 0.440*** 0.167 -0.014 0.130 -0.006 0.132
Other race or ethnicity 0.192 3.317 -0.266 3.317 -0.239 3.317
Credit history CoefficientStandard Deviation
CoefficientStandard Deviation
CoefficientStandard Deviation
Household has been delinquent on payments 1.301*** -0.155 1.309*** 0.111 1.245*** 0.112
Household has declared bankruptcy in the past 0.904*** 0.142
Number of financial institutions 0.049* 0.026 0.036 0.026 0.037 0.026
Household has banking relationship with credit union -0.073 0.134 -0.033 0.112 -0.003 0.112
Household has banking relationship with traditional lender -0.160* 0.094 0.038 0.088 0.035 0.089
Household has banking relationship with consumer lender 0.241*** 0.091 0.536*** 0.080 0.511*** 0.081
Household self-identifies as saver -0.455*** 0.091 -0.505*** 0.079 -0.480*** 0.080
Household collects debt information itself 0.099 0.098
Household relies on professionals for debt information -0.194** 0.076
Household relies on advertisements for debt information 0.295*** 0.086
Household financials CoefficientStandard Deviation
CoefficientStandard Deviation
CoefficientStandard Deviation
Natural logarithm of income (in 2004 dollars) -0.104* 0.061 0.018 0.052 0.008 0.053
Natural logarithm of assets (in 2004 dollars) -0.112*** 0.026 -0.076*** 0.023 -0.069*** 0.023
Household is home owner -0.180 0.128 -0.407*** 0.116 -0.397*** 0.116
Control variables CoefficientStandard Deviation
CoefficientStandard Deviation
CoefficientStandard Deviation
Constant -0.581 0.628 -1.697*** 0.529 -1.550*** 0.538
N 10705 12623 12623
F-Statistic 142.86 232.13 205.98
P-Value 0.0000 0.0000 0.0000
Notes: * denotes significance at the 10 percent level, ** denotes significance at the 5 percent level, and *** denotes significance at the 1 percent level. Omitted categories are college education, single men, and whites.

w w w . a m e r i c a n p r o g r e s s . o r g A U G U S T 2 0 0 7
�9
The upshot: Hispanics managed to erase the difference between their group and whites with respect to denial rates, but the difference between African Americans and whites dropped only marginally.15
Loan denials, however, ignore families who felt discouraged from even applying for a loan. So the same equation is employed for the likelihood of feeling discouraged (see Table 10). The analysis shows that families’ incomes do affect whether they feel discouraged about applying for credit, but that feeling has decreased over time relative to income. Significantly, though, there are differences in the data depending on race and ethnicity.
Both Hispanics and African Americans were more likely than whites to feel dis-couraged about applying for credit in both subperiods examined in the analysis. In fact, the difference between African Americans and whites increases over time, while the difference between whites and Hispanics diminishes over time. In the earlier period, African Americans were 70.8 percent more likely than whites to feel discouraged, compared to a 100 per-cent difference in the latter period. The difference between Hispanics and whites declined from 54.7 percent between 1989 and 1995 to 44.2 percent between 1998 and 2004. Still, after controlling for other relevant factors, minorities were signifi-cantly more likely to be discouraged from applying for a loan than whites.
When these two measures are combined into one indicator of credit constraints, there remains significant evidence of credit market discrimination against African Americans (see Table 11). The ef-fect of income declines over time, so that it is statistically insignificant during the years 1998 to 2004. Also, the differences
between Hispanics and whites decline over time, so that there is no statistically significant difference between 1998 and 2004. In contrast, the difference between African Americans and whites widened from a gap of 82.9 percent in the earlier period to a gap of 95.8 percent in the latter period. That is, financial market discrimination against African Americans seems to have increased over time.16
Multivariate analysis for loan payments relative to debt
A similar multivariate test performed to assess the cost of debt reveals similar patterns of discrimination. In this case, a weighted ordinary least squares regres-sion is used, which shows the simulta-neous effects of a series of variables on the ratio of debt payments to total debt. The dependent variable is the ratio of debt payments to debt. The explanatory variables that are included here fall again into three broad categories:
Personal characteristics, such as age, education, family size, marital status, race, and ethnicity
Credit history, specifically the number of institutions with whom a family has a financial relationship, and an indica-tion if a family sees itself more as a saver or non-saver
Financial background, particularly income and the share of mortgages out of total debt as a proxy for debt composition.17
The results of the analysis illustrate that income used to have a distinct inverse re-lationship with debt payments relative to
ß
ß
ß

w w w . a m e r i c a n p r o g r e s s . o r gA U G U S T 2 0 0 7
20
Table 10: logiT regreSSion of ShareS of familieS feeling diScouraged from applying for a loan
exPlANAtory vArIAble beFore �998 AFter �99�AFter �99� extrA
vArIAbles
Personal characteristics CoefficientStandard Deviation
CoefficientStandard Deviation
CoefficientStandard Deviation
Household head has less than high school degree 0.615*** 0.201 0.789*** 0.174 0.784*** 0.174
Household head has high school degree 0.231 0.156 0.363*** 0.136 0.355*** 0.137
Household head has some college 0.244 0.178 0.297** 0.150 0.289* 0.150
Age 0.092*** 0.026 0.093*** 0.022 0.090*** 0.022
Age2 -0.001*** 0.000 -0.001*** 0.000 -0.001*** 0.000
Family size 0.029 0.044 0.070** 0.033 0.069** 0.033
Married 0.077 0.196 0.088 0.155 0.083 0.156
Single women 0.278 0.175 0.312** 0.149 0.305** 0.149
African-American 0.535*** 0.153 0.693*** 0.126 0.689*** 0.126
Hispanic 0.436** 0.204 0.366** 0.158 0.353** 0.159
Other race or ethnicity 0.351 3.317 0.206 3.317 0.222 3.317
Credit history CoefficientStandard Deviation
CoefficientStandard Deviation
CoefficientStandard Deviation
Household has been delinquent on payments 0.382* 0.201 0.503*** 0.155 0.474*** 0.156
Household has declared bankruptcy in the past 0.279 0.172
Number of financial institutions -0.164*** 0.046 -0.221*** 0.043 -0.220*** 0.043
Household has banking relationship with credit union -0.234 0.210 -0.350* 0.187 -0.337* 0.186
Household has banking relationship with traditional lender -0.184 0.129 -0.172 0.129 -0.174 0.130
Household has banking relationship with consumer lender 0.308** 0.126 -0.100 0.107 -0.121 0.108
Household self-identifies as saver -0.209 0.130 -0.166 0.107 -0.155 0.107
Household collects debt information itself 0.164 0.124
Household relies on professionals for debt information -0.138 0.106
Household relies on advertisements for debt information 0.086 0.124
Household financials CoefficientStandard Deviation
CoefficientStandard Deviation
CoefficientStandard Deviation
Natural logarithm of income (in 2004 dollars) -0.276*** 0.075 -0.110* 0.066 -0.118* 0.066
Natural logarithm of assets (in 2004 dollars) -0.018 0.036 -0.068*** 0.025 -0.066*** 0.026
Household is home owner -0.321* 0.176 -0.495*** 0.158 -0.484*** 0.158
Control variables CoefficientStandard Deviation
CoefficientStandard Deviation
CoefficientStandard Deviation
Constant -1.180 0.828 -2.184*** 0.709 -2.166*** 0.712
N 10705 12623 12623
F-Statistic 67.08 152.53 127.05
P-Value 0.0000 0.0000 0.0000
Notes: * denotes significance at the 10 percent level, ** denotes significance at the 5 percent level, and *** denotes significance at the 1 percent level. Omitted categories are college education, single men, and whites.

w w w . a m e r i c a n p r o g r e s s . o r g A U G U S T 2 0 0 7
2�
Table 11: logiT regreSSion analySiS of crediT conSTrainTS
exPlANAtory vArIAble beFore �998 AFter �99�AFter �99� extrA
vArIAbles
Personal characteristics CoefficientStandard Deviation
CoefficientStandard Deviation
CoefficientStandard Deviation
Household head has less than high school degree 0.233* 0.136 0.645*** 0.121 0.634*** 0.122
Household head has high school degree 0.135 0.098 0.338*** 0.085 0.317*** 0.086
Household head has some college 0.259** 0.107 0.467*** 0.091 0.440*** 0.091
Age 0.084*** 0.017 0.053*** 0.015 0.045*** 0.015
Age2 -0.001*** 0.000 -0.001*** 0.000 -0.001*** 0.000
Family size 0.062* 0.036 0.085*** 0.026 0.077*** 0.026
Married -0.123 0.129 0.054 0.109 0.051 0.109
Single women 0.014 0.119 0.301*** 0.104 0.291*** 0.104
African-American 0.604*** 0.108 0.672*** 0.089 0.638*** 0.089
Hispanic 0.527*** 0.149 0.151 0.114 0.155 0.115
Other race or ethnicity 0.270 3.317 -0.113 3.317 -0.089 3.317
Credit history CoefficientStandard Deviation
CoefficientStandard Deviation
CoefficientStandard Deviation
Household has been delinquent on payments 1.335*** 0.155 1.405*** 0.115 1.334*** 0.116
Household has declared bankruptcy in the past 0.890*** 0.135
Number of financial institutions -0.010 0.026 -0.036 0.027 -0.037 0.027
Household has banking relationship with credit union -0.142 0.122 -0.141 0.108 -0.119 0.108
Household has banking relationship with traditional lender -0.201** 0.082 -0.054 0.081 -0.059 0.082
Household has banking relationship with consumer lender 0.278*** 0.080 0.324*** 0.069 0.294*** 0.070
Household self-identifies as saver -0.423*** 0.080 -0.447*** 0.069 -0.426*** 0.069
Household collects debt information itself 0.148* 0.085
Household relies on professionals for debt information -0.205*** 0.067
Household relies on advertisements for debt information 0.277*** 0.079
Household financials CoefficientStandard Deviation
CoefficientStandard Deviation
CoefficientStandard Deviation
Natural logarithm of income (in 2004 dollars) -0.187*** 0.056 -0.014 0.049 -0.024 0.050
Natural logarithm of assets (in 2004 dollars) -0.102*** 0.024 -0.108*** 0.020 -0.100*** 0.020
Household is home owner -0.248** 0.111 -0.475*** 0.102 -0.466*** 0.102
Control variables CoefficientStandard Deviation
CoefficientStandard Deviation
CoefficientStandard Deviation
Constant 0.399 0.570 -0.899* 0.500 -0.803 0.506
N 10705 12623 12623
F-Statistic 179.46 333.60 288.02
P-Value 0.0000 0.0000 0.0000
Notes: * denotes significance at the 10 percent level, ** denotes significance at the 5 percent level, and *** denotes significance at the 1 percent level. Omitted categories are college education, single men, and whites.

w w w . a m e r i c a n p r o g r e s s . o r gA U G U S T 2 0 0 7
22
Table 12: regreSSion eSTimaTeS for debT paymenTS relaTive To ToTal debT
beFore �998 AFter �99�AFter �99� extrA
vArIAbles
Personal characteristics CoefficientStandard Deviation
CoefficientStandard Deviation
CoefficientStandard Deviation
Household head has less than high school degree 0.172** 0.073 0.133** 0.060 0.132** 0.060
Household head has high school degree 0.118*** 0.031 0.036 0.025 0.036 0.026
Household head has some college 0.027 0.042 0.003 0.033 0.003 0.033
Age 0.001 0.008 0.010** 0.004 0.010** 0.005
Age2 0.000 0.000 -0.000 0.000 -0.000* 0.000
Family size 0.007 0.013 0.011 0.009 0.011 0.009
Married 0.063 0.051 0.035 0.039 0.035 0.039
Single women 0.035 0.062 -0.017 0.039 -0.016 0.039
African-American 0.155** 0.074 0.074* 0.045 0.075* 0.046
Hispanic -0.025 0.084 0.028 0.058 0.03 0.058
Other race or ethnicity 0.029 0.061 -0.016 0.056 -0.016 0.056
Credit history CoefficientStandard Deviation
CoefficientStandard Deviation
CoefficientStandard Deviation
Household has been delinquent on payments 0.054 -0.106 -0.088** 0.038 -0.084** 0.038
Household has declared bankruptcy in the past -0.033 0.043
Number of financial institutions -0.025*** 0.010 -0.012 0.008 -0.012 0.008
Household has banking relationship with credit union 0.031 0.035 0.010 0.026 0.009 0.026
Household has banking relationship with traditional lender 0.007 0.035 -0.014 0.032 -0.015 0.032
Household has banking relationship with consumer lender -0.198*** 0.038 -0.183*** 0.037 -0.183*** 0.037
Household self-identifies as saver 0.026 0.028 0.044** 0.022 0.043* 0.022
Household collects debt information itself -0.020 0.036
Household relies on professionals for debt information 0.010 0.024
Household relies on advertisements for debt information -0.001 0.024
Household financials CoefficientStandard Deviation
CoefficientStandard Deviation
CoefficientStandard Deviation
Natural logarithm of income (in 2004 dollars) -0.060* 0.034 -0.007 0.018 -0.007 0.018
Natural logarithm of assets (in 2004 dollars) -0.002 0.017 -0.021* 0.011 -0.021* 0.011
Household is home owner -0.057 0.069 0.039 0.067 0.038 0.067
Share of mortgages out of total debt -0.395 3.317 -0.439 3.317 -0.437 3.317
Control variables CoefficientStandard Deviation
CoefficientStandard Deviation
CoefficientStandard Deviation
Constant 1.318*** 0.365 0.672*** 0.170 0.686*** 0.168
N 8009 9475 9475
F-Statistic 66.42 77.29 67.09
P-Value 0.0000 0.0000 0.0000
Notes: * denotes significance at the 10 percent level, ** denotes significance at the 5 percent level, and *** denotes significance at the 1 percent level. Omitted categories are college education, single men, and whites.

w w w . a m e r i c a n p r o g r e s s . o r g A U G U S T 2 0 0 7
2�
debt, meaning that the costs of debt de-cline with rising incomes. This is not true in the later subperiod, when the effect of income becomes statistically insignificant. What’s more, African-Americans tend to have higher debt payments relative to debt than whites in both subperiods (see Table 10). This likely reflects almost uni-versally higher interest rates for minori-ties than for whites (see Table 6).18 The important point here is that discrimina-tion in the cost of credit based on race is clearly evident, even though its effect has diminished over time.
Yet there are also more subtle differences evident in the data analysis. The changes for minorities show two divergent trends. African Americans who saw increasing discrimination with respect to credit con-straints also experienced a declining differ-ence in the cost of credit relative to whites. It seems that greater self-selection (by not applying for a loan) may have contributed to African Americans with debt shrinking the gap in credit payments relative to total debt when compared with whites.
Two other variables exhibit odd results. Specifically, the estimated coefficient for families that have been delinquent on any payment in the past five years—a calculation that is meant to control for a family’s credit history—is negative in the latter period, which implies that delin-
quent families had lower payments on their credit. At the same time, self-identi-fied savers showed an estimated coeffi-cient that was positive in the same period, which implies they paid more for their credit lines. In both cases, the estimated coefficients may have picked up fami-lies’ decisions to alter their payments by systematically choosing payment condi-tions that give delinquent families lower payments, all else being equal, and saver families higher payments.
On its face, this conclusion may seem paradoxical. After all, why would families who are presumably more able to access cheaper credit because of their greater savings pay more for their credit than families who are less creditworthy?
These results, however, may reflect the fact that delinquent families and non-saver families may seek to lower their payments by choosing particular payment options such as (initially) less costly adjustable interest rate loans. One indicator of this phenomenon: both delinquent families and non-saver families had larger shares of adjustable rate mortgages out of total mortgages in the period after 1995, when these data first became available. That is, delinquent and non-saver families appear to choose payment options that systemati-cally lower their payments, even though their interest rates tend to be higher.

w w w . a m e r i c a n p r o g r e s s . o r gJ U L Y 2 0 0 7
2�
After years of an unprecedented expansion of credit to all borrowers, some doors are being shut to those families most in need of credit. Lenders worried about rising default rates are beginning to restrict access to some borrowers, raising
the fear that borrowers who traditionally had a harder time gaining access to afford-able (or in fact any kind of) credit may be shut out again. This may be especially true for low-income families and minority families. As a result, families with less access to credit could have a harder time taking advantage of economic opportunities such as buying a home, starting a business, or gaining an education.
The results of our analysis show that minority families and low-income families still have less access to credit than their counterparts, even after controlling for many other factors. Specifically, minorities are more likely than whites to be credit-constrained—ei-ther denied credit or discouraged from applying. This difference has actually grown for African Americans, but declined for Hispanics. Also, lower-income families continue to feel more discouraged from applying for a loan than higher-income families, even after controlling for other factors.
In some instances, the improvements in credit constraints are offset by changes in the cost of credit. Specifically, cost differences have shrunk over time by income and for Hispanics relative to whites, so that there was no statistically significant difference. Yet, African Americans still had significantly higher debt payments relative to total debt lev-els than whites, although the gap has shrunk over time.
Combined with the earlier results, this suggests that credit access for lower-income families has improved over time. For African Americans, it meant that the level of dis-crimination with respect to credit access increased, while the cost differential to whites shrank. In comparison, discrimination against Hispanics decreased, although they still felt significantly more discouraged from applying for credit than white families.
Conclusion

w w w . a m e r i c a n p r o g r e s s . o r g J U L Y 2 0 0 7
2�
There is a rich economic literature, both theoretical and empirical, that deals with the issue of access to credit. In this section, the relevant literature is reviewed to illustrate the following conclusions. First, credit access is critical to investment and to handling income fluctuations. Second, credit access encompasses two important aspects—getting a loan application approved, especially when a family needs it the most, and getting an affordable loan approved—both instances of which suggest that minority families and low-income families may have less credit access than their counterparts in part because of financial market discrimination. Third, there is some suggestion that these obstacles can be reduced, either by families establishing banking relationships with lower-cost, more stable lenders, by relying on more stable and more affordable forms of credit, by families gathering more and better financial information, or by policymakers fostering more financial market competition.
Credit to finance investments and consumption smoothing
Household debt can play an important role for the economic security and mobility of families. It allows families to purchase goods and services that they otherwise couldn’t afford. For one, families borrow to invest in their own economic security. For instance, homeownership can offer income and wealth security since neighborhoods with a larger share of homeowners tend to have better-maintained properties, better schools, and ul-timately more stable property values than neighborhoods with a smaller share of hom-eowners.19 Hence, the biggest reason for families to go into debt is for a home, either its purchase or its expansion and renovation.20 Other loans that fall into this category are loans for investment properties, education loans, and car loans.21
Moreover, household debt allows families to master short-term income fluctuations. By borrowing, families can still pay for most of their basic needs, even if their income temporarily drops.22 Families are especially in need of this added help to master short-term swings in income if they have little personal wealth to fall back onto.23,24
Getting credit when you need it
Credit markets are essentially markets for promises. Borrowers receive money today in exchange for the promise to repay the lender in the future. Because this promise is fraught with uncertainty, lenders try to assess the chances of repayment based on ob-servable characteristics of the borrower, such as income growth and collateral.
As a result of the inherent uncertainty associated with extending credit, lenders end up restricting access to some borrowers. Lenders can never really know how good a credit risk a particular borrower is. Only the borrower will know if he or she plans to default on their loan obligations. The lender can only know how good a credit risk the average, similarly situated borrower is.
Appendix �: literature review

w w w . a m e r i c a n p r o g r e s s . o r gA U G U S T 2 0 0 7
2�
Yet there are many borrowers with above-average default risk. If lenders tried to charge the costs of lending to these par-ticular borrowers to all borrowers, good borrowers will not want to borrow at these rates. The lender would end up with only borrowers that have a high chance of defaulting on their loans, thereby re-ducing the income to the lender. Because lenders are aware of this problem, they prefer to set the terms of their loans be-low the true costs of borrowers with high default risk. In exchange, lenders limit the amount of loans they give out, based on observable characteristics.
This phenomenon is known as credit ra-tioning.25 Importantly, some groups of bor-rowers are more likely than others to be shut out of the market. This is especially true for lower-income and minority fami-lies, often because of lower-income growth and fewer assets to offer as collateral.
As lenders try to evaluate the chances of particular groups of borrowers to repay a loan, the reasons for loan denials can be manifold. They can include personal characteristics of the borrower—such as family size, marital status, living arrange-ments, among others—and financial char-acteristics such as credit history, income, and wealth. Also, a credit application may be denied because of issues associated with a loan—a lender may be prohibited from making a particular loan. And fi-nally, there are reasons specific to a lender for denying credit, e.g. a requirement to have had a past banking relationship with a lender26 and outright discrimination.27,28
Access to affordable credit
Getting a lender to say “yes” is only one aspect of credit access. Loan terms also
have to be affordable. High-cost loans often include payday lending, car title loans, and overdraft loans, among others. For instance, payday loans are among the highest cost forms of debt that borrowers can receive. Interest rates on payday loans average typically about 400 percent.29,30 According to the Center for Responsible Lending, the typical payday borrower pays back $793 for a $325 loan.31
Especially low-income families and minority families tend to borrow more from high-cost sources.32 Specifically, it appears that payday lenders are target-ing African American families, low-in-come families, and military families.33 Also, repeat users of overdraft loans seem more likely than not to be lower-income and non-white.34 And car title loans seem to be more prevalent among lower-income families and military fami-lies than among others.35
Credit card debt, which has expanded among previously underserved groups, is another form of credit that tends to have above-average costs associated with it. 36 Credit card debt tends to be compara-tively costly since credit card balances often not only incur interest that is higher than other forms of credit, e.g. mort-gages, but also result in borrowers being charged a slew of fees.37
Credit card debt is relatively more preva-lent among lower-income and minority families than among other families.38 For instance, the ratio of credit card balances carried forward relative to income tended to decline with income, so that low-in-come families have the largest credit card balances relative to income.39 Moreover, the terms and conditions of credit cards tend to be worse for low-income families than for higher-income ones.40
w w w . a m e r i c a n p r o g r e s s . o r g A U G U S T 2 0 0 7
27
It matters who the gatekeeper is
The cost of debt can vary based on the institution that makes the loan, since credit markets tend to be segmented. For one, lenders build on their experience with particular groups of borrowers and tailor their products to them. At the same time, families do not have the necessary resources to collect and digest all of the necessary information, thereby allowing niche markets to be created.41
Second, regulatory restrictions can lead to market segmentation. Examples of regu-latory restrictions on particular activities are predatory loans42 and credit unions.43
Third, not all lenders will have the resourc-es to establish a presence everywhere, thus resulting in geographical segmentation.44
Fourth, there is some evidence of dis-crimination. This can include red-lining, whereby borrowers are denied credit based on where they live, but it can also include worse loan terms based on per-sonal characteristics such as gender, race, ethnicity and age.45
The segmentation of credit markets manifests itself either in greater denial rates of loan applications and higher costs of loans for some groups of bor-rowers, especially lower-income families and minority families.
Policy changes intended to increase financial market access
The United States has undergone large scale financial market changes since the early 1990s. For instance, the end of interstate banking prohibitions in 1994 resulted in a wave of merger and acqui-
sition activities and consolidation in the financial services industry.46 Consolida-tion in the financial services industry was further aided by the passage of the Gramm-Leach-Bliley Financial Services Modernization Act of 1999, which elimi-nated several barriers to cross-ownership in the financial service industry.47
Concerns have been voiced about the impact on communities that greater con-solidation may ultimately lead to fewer services for already underserved com-munities. An often-studied example is the access of small businesses to bank credit, which may serve as a bellwether for credit access for other communities, particu-larly minorities and young families, due to some similarities such as shorter credit histories. It seems that small businesses did not see their access to credit shrink in the wake of bank consolidations, possibly aided by other policies such as the Com-munity Reinvestment Act and the intro-duction of new technologies.48,49
There is no clear evidence that deregu-lation in the financial services industry harmed credit access to groups that had less access to credit than their counter-parts. At the same time, policy changes were implemented that were intended to increase credit access for groups that were typically more likely than their coun-terparts to be denied credit, especially minority borrowers. These policy efforts included more investments in financial education, regulatory support for loans to underserved communities such as through the use of the Community Reinvestment Act, and government lending programs.
In the wake of several policy changes over the past two decades, access to credit, particularly for minority borrow-ers, should have improved.

w w w . a m e r i c a n p r o g r e s s . o r gJ U L Y 2 0 0 7
28
Financial education can be an important tool for wealth creation, especially for minor-ity and low-income families. Yet because the development of effective financial educa-tion is still filled with holes, many families, especially low-income and minorities, seem to lack the tools to evaluate credit market choices.
The SCF asks families about their sources of financial information. For simplicity, the answers are grouped here into three categories: self information, professional advice, and advertisements. Self information indicates that a family has gathered information by itself from the newspaper, from radio and television programs, from the Internet, and from friends and colleagues, among other sources. Professional advice includes lawyers, accountants, and insurance agents, among others. Advertisements comprise all forms of ads, including telemarketers. Survey respondents can indicate more than one source of information.
All groups rely on their own information gathering as the primary source of financial information relating to household debt (see Table A-1). In 2004, almost three-quarters of families said that they collected information themselves. Importantly, there is little variation by race and ethnicity, when it comes to getting informed. But only 65.4 per-cent of families in the bottom fifth of the income distribution gather information them-selves, while more than 80 percent in the top 40 percent of the income distribution do.
With respect to the other sources of information, people are increasingly relying on pro-fessionals and a lot less on advertisements than they did in the past.
How does this relate to loan denial rates? Only when a family consults with a pro-fessional do loan denial rates decrease. The value of the information collected from professionals seems to have reduced the chance of a loan application being denied be-tween 1998 and 2004, after loan denial rates for this group of families jumped sharply between 1995 and 1998 (see Table A-2). This seems encouraging with respect to credit access since families rely increasingly on professionals in making their credit choices.
However, in the other two instances more information collection is associated with high-er denial rates. One explanation may be that families who collect information them-selves or who rely on advertisements may overestimate their financial savvy and become more likely than their counterparts to apply for loans they cannot qualify for (see Table A-2). As far as their reliance on advertisements goes, this appears to be less of a concern since fewer and fewer families consult advertisements in their decision-making.
At the same time, though, families increasingly rely on themselves to collect the infor-mation they need. Whenever they do so and additionally consult with a professional,
Appendix 2: the link between financial education and loan denial

w w w . a m e r i c a n p r o g r e s s . o r g A U G U S T 2 0 0 7
29
Table a-1: Source of financial educaTion
�99� �998 200� 200� �99�–200� 200�–200� �99�–200�
Self-information
Total 64.6% 72.8% 73.9% 74.5% 9.2% 0.7% 9.9%
White 65.2% 71.6% 73.3% 73.5% 8.1% 0.2% 8.3%
Black 64.7% 72.4% 72.8% 77.5% 8.1% 4.7% 12.8%
Hispanic 57.6% 83.3% 80.0% 76.3% 22.4% -3.7% 18.8%
Bottom quintile 45.2% 63.1% 62.0% 65.4% 16.8% 3.4% 20.2%
Second quintile 59.5% 70.5% 71.2% 69.6% 11.7% -1.6% 10.1%
Middle quintile 69.9% 76.8% 75.0% 75.6% 5.2% 0.6% 5.8%
Fourth quintile 78.0% 80.6% 82.1% 82.2% 4.0% 0.2% 4.2%
Top quintile 80.0% 76.7% 80.8% 80.3% 0.8% -0.5% 0.3%
25 to 34 72.2% 85.3% 82.3% 84.7% 10.2% 2.4% 12.6%
45 to 54 72.9% 76.7% 79.7% 81.1% 6.9% 1.4% 8.2%
65 and older 40.2% 46.5% 49.6% 48.9% 9.4% -0.6% 8.8%
Professional advice
Total 30.8% 41.5% 40.6% 41.3% 9.8% 0.6% 10.4%
White 31.4% 45.2% 44.1% 45.7% 12.7% 1.6% 14.4%
Black 27.1% 31.1% 31.1% 27.7% 4.0% -3.4% 0.6%
Hispanic 31.6% 22.4% 23.8% 27.2% -7.8% 3.4% -4.4%
Bottom quintile 41.1% 26.1% 27.8% 25.4% -13.3% -2.4% -15.7%
Second quintile 32.5% 38.2% 37.0% 35.5% 4.5% -1.5% 3.0%
Middle quintile 26.0% 44.6% 42.6% 43.8% 16.7% 1.2% 17.8%
Fourth quintile 21.1% 50.2% 44.2% 46.4% 23.1% 2.2% 25.3%
Top quintile 29.1% 54.1% 53.6% 55.3% 24.5% 1.7% 26.2%
25 to 34 20.4% 36.0% 38.7% 36.5% 18.2% -2.1% 16.1%
45 to 54 25.0% 47.1% 42.7% 42.8% 17.7% 0.1% 17.8%
65 and older 51.0% 39.7% 39.5% 40.6% -11.6% 1.1% -10.5%
Advertisements
Total 32.1% 19.6% 15.7% 14.4% -16.4% -1.3% -17.7%
White 31.3% 18.6% 14.5% 14.8% -16.8% 0.3% -16.5%
Black 40.2% 28.9% 23.5% 14.4% -16.8% -9.1% -25.8%
Hispanic 28.6% 12.9% 14.0% 12.3% -14.6% -1.7% -16.3%
Bottom quintile 33.5% 13.1% 10.1% 9.3% -23.4% -0.8% -24.2%
Second quintile 28.8% 18.3% 14.2% 13.1% -14.6% -1.1% -15.7%
Middle quintile 33.1% 25.3% 17.4% 17.2% -15.8% -0.1% -15.9%
Fourth quintile 33.2% 24.5% 21.4% 16.6% -11.8% -4.8% -16.6%
Top quintile 32.3% 18.5% 16.4% 16.1% -15.9% -0.3% -16.1%
25 to 34 45.2% 22.2% 16.8% 13.5% -28.4% -3.3% -31.7%
45 to 54 32.1% 23.2% 18.8% 18.6% -13.4% -0.1% -13.5%
65 and older 18.2% 9.1% 7.5% 11.6% -10.7% 4.1% -6.6%
Notes: All figures in percent. Changes are in percentage points. Author’s calculations based on Survey of Consumer Finances.

w w w . a m e r i c a n p r o g r e s s . o r gA U G U S T 2 0 0 7
�0
though, the chances of their loan being denied appears to drop (see Table A-2). Still, the loan denial rates remain higher for families who collect their own infor-mation than for those who do not. The
two tentative implications are that consul-tation with a professional seems to be ben-eficial for credit access, while families may need more education to correctly evaluate the information they gather.
Table a-2: denial raTeS by Source of financial educaTion
�99� �998 200� 200� �99�–200� 200�–200� �99�–200�
Household did not collect information itself 9.4% 9.0% 9.0% 7.3% -0.5% -1.6% -2.1%
Household collected information itself 13.6% 14.0% 13.5% 15.0% -0.2% 1.5% 1.4%
Household did not rely on professionals 14.1% 14.1% 14.1% 15.7% 0.0% 1.6% 1.6%
Household relied on professionals 7.7% 10.7% 9.7% 9.3% 2.0% -0.4% 1.6%
Household did not rely on advertisements 10.3% 11.0% 11.3% 12.3% 1.1% 0.9% 2.0%
Household relied on advertisements 16.1% 19.4% 17.5% 17.6% 1.3% 0.1% 1.5%
Self-info and professional info combined
Household collects information itself and does not consult professional 14.0% 15.6% 15.0% 17.7% 1.0% 2.7% 3.6%
Household collects information itself and consults professional 10.8% 11.6% 10.9% 10.6% 0.1% -0.3% -0.2%
Household does not collect information itself and does not consult professional 14.5% 9.7% 10.7% 8.3% -3.8% -2.5% -6.3%
Household does not collect information itself and consults professional 6.6% 8.1% 7.2% 6.5% 0.6% -0.7% -0.1%
Notes: All figures in percent. Changes are in percentage points. Author’s calculations based on Survey of Consumer Finances.

w w w . a m e r i c a n p r o g r e s s . o r g A U G U S T 2 0 0 7
��
Akerlof, G., 1970, The Market for ‘Lemons’: Quality Uncertainty and the Market Mechanism, Quarterly Journal of Economics, 84, No.3: 488–500.
Ausubel, L. 1997, Credit card defaults, credit card profits, and bankruptcy, American Bankruptcy Law Journal, 71, pp. 249–270.
Avery, R.B., and Samolyk, K.A., 2004, Bank Consolidation and Small Business Lend-ing: The Role of Community Banks, Journal of Financial Services Research 25, No.2–3: 291–325.
Barr, M., 2001, Five Opportunities for the Bush Administration and the 107th Congress, Washington, D.C.: Brookings Institution Center on Urban and Metropolitan Policy.
Bates, T., 2000, Financing the Development of Urban Minority Communities: Lessons of History, Economic Development Quarterly 14, No.3: 227–41.
Berger, A.N., 2003, The Economic Effects of Technological Progress: Evidence from the Banking Industry, Journal of Money, Credit and Banking 35, No.2: 141–176.
Bird, E. J., Hagstrom, P.A. & Wild, R., 1999, Credit card debts of the poor: high and rising, Journal of Policy Analysis and Management, 18 (1), pp. 125–33.
Black, S. & Morgan, D., 1999, Meet the new borrowers, Current Issues in Economics and Finance, 5(3), pp. 1–6.
Blanchflower, D.G., Levine, P.B., and Zimmerman, D.J., 2003, Discrimination in the Small-Business Credit Market, Review of Economics and Statistics 85, No.4: 930–943.
Bloemen, H.G. and Stancanelli, E.G.F., 2005, Financial Wealth, Consumption Smooth-ing and Income Shocks Arising from Job Loss, Economica Vol.72, No.287: 431–52.
Bostic, R., Mehren, H., Paulson, A., and Saidenberg, M., 2002, Regulatory Incen-tives and Consolidation: The Case of Commercial Bank Mergers and the Community Reinvestment Act, Federal Reserve Bank of Chicago, Working Paper Series WP-02-06, Chicago, IL: Federal Reserve Bank of Chicago.
Canner, G.B., Passmore, W., and Smith, D., 1994, Residential Lending to Low-income and Minority Families: Evidence from the 1992 HMDA Data, Federal Reserve Bulletin 80, No.2: 79–109.
Carow, K.A., Kane, E.J., and Narayanan, R.P., 2006, How Have Borrowers Fared in Banking Megamergers?, Journal of Money, Credit and Banking 38, No.3: 821–836.
references

w w w . a m e r i c a n p r o g r e s s . o r gA U G U S T 2 0 0 7
�2
Cavalluzzo, K.S., and Cavalluzzo, L.C., 1998, Market Structure and Discrimination: The Case of Small Businesses, Journal of Money, Credit, and Banking 30, No.4: 771–792.
Cavalluzzo, K.S., Cavalluzzo, L.C., and Wolken, J.D., 2002, Competition, Small Busi-ness Financing, and Discrimination: Evidence from a New Survey, Journal of Business 75, No.4:641-76.
Cavalluzzo, K. and Wolken, J., 2005, Small Business Loan Turndowns, Personal Wealth, and Discrimination, Journal of Business 78, No.6: 2153–2177.
Center for Responsible Lending, 2006, Financial Quicksand: Payday Lending Sinks Borrowers in Debt with $4.2 billion in Predatory Fees Every Year, Durham, NC: CRL.
Center for Responsible Lending, 2005, Race Matters: The Concentration of Payday Lenders in African-American Neighborhoods in North Carolina, Durham, NC: CRL.
Chakravarty, S., 2002, Relationships and Rationing in Consumer Loans: Evidence from the Nineties, Purdue University, Purdue, IN, Department of Economics, Working Paper No. 38.
Choudhury, S., 2002, Racial and Ethnic Differences in Wealth and Asset Choices, So-cial Security Bulletin 64, No.4: 1–15.
Consumer Federation of America, 1998, The Growth of Legal Loan Sharking: A Report on the Payday Loan Industry, Washington, D.C.: Consumer Federation of America.
Consumer Federation of America, 1999, Safe Harbor for Usury: Recent Developments in Payday Lending, Washington, D.C.: Consumer Federation of America.
Consumer Union, 2003, Payday Lenders Burden Working Families and the U.S. Armed Forces, Washington, D.C.: CU.
Crook, J., 1996, Credit Constraints and U.S. Families, Applied Financial Economics 6: 477–485.
Degryse, H., and Ongena, S., 2004, The Impact of Technology and Regulation on the Geographical Scope of Banking, Oxford Review of Economic Policy, Vol. 20, No. 4: 571–590.
Duby, J., Halperin, E., and James, L., 2005, High Cost and Hidden From View: The $10 Billion Overdraft Loan Market, CRL Issue Paper No. 9, Durham, NC: Center for Responsible Lending.
Dymski, G.A., 2001, Is Discrimination Disappearing? Residential Credit Market Evi-dence, 1992-98, International Journal of Social Economics 28, No.10-11-12: 1025–1045.

w w w . a m e r i c a n p r o g r e s s . o r g A U G U S T 2 0 0 7
��
Elliehausen, G., and Staten, M.E., 2004, Regulation of Subprime Mortgage Products: An Analysis of North Carolina’s Predatory Lending Law, Journal of Real Estate Fi-nance and Economics 29, No.4: 411–433.
Ely, D.P., and Robinson, K.J., 2001, Consolidation, Technology, and the Changing Structure of Bank’s Small Business Lending, Federal Reserve Bank of Dallas Economic and Financial Review, 1st Quarter: 23–32.
Emmons, W.R. and Schmid, F.A., 2000, Bank Competition and Concentration: Do Credit Unions Matter? Federal Reserve Bank of St. Louis Review 82, No.3: 29–42.
Feinberg, R.M., 2001, The Competitive Role of Credit Unions in Small Local Finan-cial Services Markets, Review of Economics and Statistics 83, No.3: 560–563.
Feinberg, R.M., and Rahman A.F.M.A., 2001, A Causality Test of the Relationship be-tween Bank and Credit Union Lending Rates in Local Markets, Economics Letters 71, No.2: 271–275.
Finke, M., Huston, S., Siman, E., and Corlija, M., 2005, Characteristics of Recent Ad-justable-Rate Mortgage Borrowers, Financial Counseling and Planning 16, No.2:17–28.
Fox, J., Bartholomae, S., and Jinkook, L., 2005, Building the Case for Financial Educa-tion, Journal of Consumer Affairs 39, No.1: 195–214.
Fox, J.A., and Guy, E., 2005, Driven into Debt: CFA Car Title Loan Store and Online Survey, Washington, DC: Consumer Federation of America.
Fox., L., and Hoffman, J., 2004, Federal Reserve Personal Financial Education Initia-tives, Federal Reserve Bulletin 90, No.4: 447–457.
Gabriel, S.A., and Rosenthal, S.S., 1991, Credit Rationing, Race, and the Mortgage Market, Journal of Urban Economics 29, No.3: 371–379.
Goddard, J.A., McKillop, D.G., and Wilson, J.O.S., 2002, The Growth of US Credit Unions, Journal of Banking and Finance 26, No.12: 2327–2356.
Graves, S., and Peterson, C.L., 2005, Predatory Lending and the Military: The Law and Geography of “Payday” Loans in Military Towns, unpublished manuscript, Uni-versity of Florida, College of Law, Gainesville, FL.
Hein, S.E., Koch, T.W., and MacDonald, S.S., 2005, On the Uniqueness of Commu-nity Banks, Federal Reserve Bank of Atlanta Economic Review 90, No.2: 15–36.
Hilgert, M.A., Hogarth, J.M., and Beverly, S.G., 2003, Household Financial Manage-ment: The Connection between Knowledge and Behavior, Federal Reserve Bulletin 89, No.7: 309–322.

w w w . a m e r i c a n p r o g r e s s . o r gA U G U S T 2 0 0 7
��
Ho, G., and Pennington-Cross, A., 2007, The Varying Effects of Predatory Lending Laws on High-Cost Mortgage Applications, Federal Reserve Bank of St. Louis Review 89, No.1: 39–59.
Ho, G., and Pennington-Cross, A., 2006, The Impact of Local Predatory Lending Laws on the Flow of Subprime Credit, Journal of Urban Economics 60, No.2: 210–228.
Holloway, S.R., and Wyly, E.K., 2001, “The Color of Money” Expanded: Geographi-cally Contingent Mortgage Lending in Atlanta, Journal of Housing Research 12, No.1: 55–90.
James, L. and Smith, P., 2006, Overdraft Loans: Survey Finds Growing Problems for Consumers, CRL Issue Paper No. 13, Durham, NC: Center for Responsible Lending.
Kaushik, S.K., and Lopez, R.H., 1994, The Structure and Growth of the Credit Union Industry in the United States: Meeting Challenges of the Market, American Journal of Economics and Sociology 53, No.2: 219–243.
Krueger, D., and Perri, F., 2005, Understanding Consumption Smoothing: Evidence from the U.S. Consumer Expenditure Data, Journal of the European Economic Asso-ciation, Vol. 3, No. 2-3: 340–49.
Krueger, D., and Perri, F., 2002, Does Income Inequality Lead to Consumption In-equality? Evidence and Theory, NBER Working Paper No. 9202, Cambridge, MA: National Bureau of Economic Research.
Leggett, K.J., and Strand, R.W., 2002, Membership Growth, Multiple Membership Groups and Agency Control at Credit Unions, Review of Financial Economics 11, No.1: 37–46.
Lyons, A.C., 2003, How Credit Access Has Changed Over Time for U.S. Families, Journal of Consumer Affairs 37, No.2: 231–255.
Lyons, A.C., Chang, Y., and Scherpf, E.M., 2006, Translating Financial Education into Behavior Change for Low-Income Populations, Financial Counseling and Planning 17, No.2: 27–45.
Lyons,A.C., Palmer, L., and Jayaratne, K.S.U., and Scherpf, E., 2006, Are We Mak-ing the Grade? A National Overview of Financial Education and Program Evaluation, Journal of Consumer Affairs 40, No.2: 208–235.
Lyons, A.C., and Scherpf, E., 2004, Moving from Unbanked to Banked: Evidence from Money Smart Program, Financial Services Review 13, No.3: 215–31.
Manning, R., 2000, Credit Card Nation: The Consequences of America’s Addiction to Credit, New York: Basic Books.
w w w . a m e r i c a n p r o g r e s s . o r g A U G U S T 2 0 0 7
��
Munnell, A., Browne, L.E., and McEneaney, J., 1996, Mortgage Lending in Boston: Interpreting the HMDA Data, American Economic Review 86, No.1: 25–53.
Newman, K., and Wyly, E.K., 2004, Geographies of Mortgage Market Segmentation: The Case of Essex County, New Jersey, Housing Studies 19, No.1: 83–83.
Rauch, J.H., and Hendrickson, J.M., 2004, Does Bank Consolidation Hurt the Small Business Borrower?, Small Business Economics 23, No.3: 219–226.
Rhoades, S.A., Bank Mergers and Banking Structure in the U.S., 1980-1998, Staff Study No. 174, Washington, D.C.: Board of Governors, Federal Reserve System.
Rose, J.T., 1993, Interstate Banking, Bank Consolidation, and Bank Lending to Small Business, Small Business Economics 5, No 3: 197–206.
Ross, S., 2005, The Continuing Practice and Impact of Discrimination, University of Connecticut, Storrs, CT, Department of Economics Working Paper No. 19.
Schug, M.C., Niederjohn, M.S., and Wood, W.C., 2006, Your Credit Counts Chal-lenge: A Model Program for Financial Education for Low and Moderate Income Adults, Journal of Private Enterprise 21, No.2: 196–208.
Stavins, J., 2000, Credit card borrowing, delinquency, and personal bankruptcy, New England Economic Review, July/August, pp. 15–30.
Stegman, M.A. and Faris, R., 2003, Payday lending: A business model that encourages chronic borrowing, Economic Development Quarterly, 17 (1), pp. 8–32.
Stiglitz, J., and Weiss, A., 1981, Credit Rationing in Markets with Imperfect Informa-tion, American Economic Review, 71, No.3: 393–410.
Tanik, O., 2005, Payday Lenders Target the Military, CRL Issue Paper No. 11, Dur-ham, NC: Center for Responsible Lending.
Tripp, J.D., and Smith, S.D., 1993, U.S. Credit Union Motivation for Involvement in the First-Mortgage Market, Journal of Real Estate Finance and Economics 7, No.3: 229–236.
U.S. Census Bureau, 2006, American Housing Survey 2005, Washington, DC: Census.
U.S. Department of Defense, 2006, Report on Predatory Lending Practices Directed at Members of the Armed Forces and their Families, Washington, DC: DOD.
Weinberg, J.A., Borrowing by U.S. Families, Federal Reserve Bank of Richmond Eco-nomic Quarterly 92, No.3: 177–194.

w w w . a m e r i c a n p r o g r e s s . o r gA U G U S T 2 0 0 7
��
Weller, C., 2007, Risks Rise for Middle Class: Economic Security Continues to Fall, CAP Economic Policy Report, Washington, DC: Center for American Progress.
Weller, C., 2006a, The End of the Great American Housing Boom, CAP Economic Policy Report, Washington, DC: Center for American Progress
Weller, C., 2006b, Pushing the Limit: Credit Card Debt Burdens American Families, CAP Economic Policy Report, Washington, DC: Center for American Progress.
Weller, C., and Douglas, D., 2007, One Nation Under Debt, Challenge, Vol. 50, No.1: 54–75.
Weller, C., and Sabatini, K., 2007, Changes in Homeowners’ Financial Security during the Recent Housing and Mortgage Boom, PERI Working Paper No. 125, University of Massachusetts, Amherst, MA, Political Economy Research Institute.
Westrich, T., and Bush, M., 2005, Blindfolded into Debt: A Comparison of Credit Card Costs and Conditions at Banks and Credit Unions, Chicago, IL: Woodstock Institute.
Wheelock, D.C., and Wilson, P.W., 2004, Consolidation in US Banking: Which Banks Engage in Mergers?, Review of Financial Economics 13, No.1-2: 7–39.
White, L., 2002, Financial Modernization after Gramm-Leach-Bliley: What About Communities?, New York University, Leonard N. Stern School of Business, Depart-ment of Economics, Working Paper No. 02-02.
Wyly, E.K., and Hammel, D.J., Gentrification, Segregation, and Discrimination in the American Urban System, Environment and Planning 36, No.7: 1215–1241.
Yao, R., Gutter, M.S., and Hanna, S.D., 2005, The Financial Risk Tolerance of Blacks, Hispanics, and Whites, Financial Counseling and Planning 16, No.1: 51–62.
Yoo, P., 1996, Charging up a mountain of debt: families and their credit cards, Federal Reserve Bank of St. Louis Working Paper #96-015A.
w w w . a m e r i c a n p r o g r e s s . o r g J U L Y 2 0 0 7
�7
endnotes
1 The appendix provides a detailed literature review on the importance of credit and on the various facets of credit access.
2 The years 1989 and 2001 are chosen as reference points since they are the closest data years to the last two business cycle peaks.
3 To avoid double counting, only families who felt discouraged and were not denied credit are included here. See also Lyons (2003) for more details.
4 Although credit history and financial resources—and income and wealth—are linked to each other, it may be possible to improve borrowers’ credit history without substantial improvements in income or wealth through financial education. In fact, relying on financial information from professionals, such as brokers, accountants, lawyers, among others, tends to lower the denial rate. See the appendix for a discussion of the link between financial education and loan denials.
5 See the appendix for a review of the relevant literature.
6 The share of ARMs out of total mortgages is only used here as an indicator for a family’s desire to have lower monthly pay-ment options. It is not an argument that families with ARMs have higher fees.
7 ARMs do not have universally lower cost. This is only true before interest rates reset to a fixed and presumably higher rate.
8 See Weller (2006) for details.
9 The regression results are based on weighted regressions to resemble the descriptive results of the rest of the paper and to take into account that the SCF over-samples high-income families.
10 Families are classified as “saver” if they indicated that they “save income of one family member, spend the other,”, “spend regular income, save other income,”, or “Savesave regularly by putting money aside each month.”. They are classified as “non-saver” if they “Don’t save—usually spend more than income they,”, “don’t save—usually spend about as much as income,”, or “save whatever is left over at the end of the month—no regular plan.”.
11 To test for the robustness of the results, the following variables are added for the latter time period, where the data are available: an indicator variable if the household had declared bankruptcy over the past five years, an indicator variable if the household relied on itself for financial information on debt, an indicator variable if the household relied on professional for financial information on debt, and an indicator variable if the household relied on advertisements for financial information. In each case, the indicator variable takes the value of one if the answer is “yes” and zero otherwise.
12 Economists typically consider markets discriminatory if, after controlling for all relevant effects, there is still a statistically and economically significant difference by race, gender, or ethnicity. See Dymski (2001) for a discussion of theoretical concepts of discrimination in economics. Blanchflower, Levine and Zimmerman (2003), Cavalluzzo and Cavaluzzo (1998), Cavalluzzo, Cavalluzzo, and Wolken (2002), Cavalluzzo and Wolken (2005), and Dymski (2001) for examples of empirical tests of finan-cial market discrimination.
13 A likelihood ratio Chow test rejects the null hypotheses that the estimated parameters are identical for the two subperiods in all instances. Details are available from the author.
14 Odds ratios are not shown here, but calculated based on the estimated coefficients.
15 All results for the latter period are robust as the specification with additional variables shows. Additional regressions with additional explanatory variables, e.g. the type of credit that was denied and the reason for the denial, did not alter the findings here.
16 An important side note is that discrimination by gender seems to also have increased over time. In the earlier period, there is no evidence of a statistically significant difference between single men and single women. In the latter period, for example, single women were 35.0 percent more likely than single men to be credit constrained.
17 To test for the robustness of the regression results, the following variables are added for the latter time period, where the data are available. The additional control variables included here are indicator variables for the type of bank, with which the borrower has a lending relationship and one for the family having an adjustable rate mortgage. All indicator variables equal “one” if the answer is “yes” and zero otherwise. The indicator variable for ARMs is included to proxy for a family’s desire to lower payments in the short run.
18 Following Cavalluzzo and Cavalluzzo (1998) and estimating the regression with mortgage interest rates as the dependent variable and the debt composition variable omitted as explanatory variable, for instance, shows a statistically significant dif-ference between minorities and whites.

w w w . a m e r i c a n p r o g r e s s . o r gA U G U S T 2 0 0 7
�8
19 See Weller and Sabatini (2007) for a detailed literature review.
20 See Weller and Douglas (2007) for details on the data.
21 The vast majority of people, 79 percent in 2005, drove themselves to work, according to the Census (2006), thereby making a car a necessary tool for income stability.
22 Families cannot fully replace all of their lost income. Only, income volatility may be greater than consumption volatility as families replace part of their income by borrowing more. See Krueger and Perri (2002) for a detailed discussion of the link between income volatility, financial markets, and consumption volatility and Krueger and Perri (2005) for evidence on con-sumption smoothing in the USUnited States.
23 Consumption smoothing is one of the primary reasons for the creation of social safety nets, such as unemployment insur-ance, which tend to be of greater assistance to those with less personal wealth than to those with more personal wealth (Bloemen and Stancanelli, 2005).
24 See Weller (2007a) for data on the economic security of U.S. families, which shows that the share of families who have suf-ficient financial wealth to sustain a spell of unemployment or any other emergency has dropped precipitously since 2000.
25 This argument was developed by Stiglitz and Weiss (1981) based on the original work by Akerlof (1970).
26 Chakravarty (2002) shows that a prior existing relationship with a bank matters for a number of consumer loans, but does not matter for credit cards and lines of credit, and that the importance of a pre-existing relationship has declined over time.
27 See Canner, Passmore, and Smith (1994), Gabriel and Rosenthal (1991), and Munnell, Browne, Lynn, and McEneaney (1996) for details on differences in loan denial rates by race. Crook (1996) finds that, in addition to race, income and age matter, with lower-income and older families being less likely to see their loan applications being denied. Lyons (2003) finds that between 1992 and 1998 all families saw improved credit access with particularly strong improvements for black families and families with low earnings.
28 The uneven access to credit, especially low access by minorities, low-income families and small businesses, has led to a proliferation of government programs and institutions to fill the gap (Bates, 2000).
29 Fox and Guy (2005) estimate that the median annual interest rate for car title loans is about 300 percent.
30 Duby, Halperin, and James (2005) argue that overdraft fees can quickly translate into triple-digit annualized interest rates.
31 See CRL (2006) for details.
32 See Barr (2001), CFA (1998, 1999) and Stegman and Faris (2003) for an overview.
33 See CRL (2005; DOD, 2006; Graves and Peterson, 2005; Tanik , 2005) for details.
34 See James and Smith (2006) for details.
35 See Fox and Guy (2005) for details.
36 See Manning (2000) for details.
37 See Westrich and Bush (2005) for an analysis of the costs of credit cards at banks and credit unions.
38 See Bird, Hagstrom, and Wild (1998), Black and Morgan (1999), Manning (2000), and Yoo (1996) for details.
39 See Weller (2006) for details.
40 See Ausubel (1999) and Stavins (2000) for details.
41 There has been increasing attention on financial education since the lack thereof has been recognized as an important ob-stacle to adequate wealth creation and a contributing factor to families’ economic distress (Fox, and Hoffman, 2004; Hilgert, Hogarth, and Beverly, 2003; Weinberg, 2006). The benefits of financial education appear to be especially pronounced for minorities and low-income families (Choudhury, 2002; Finke, Huston, Siman, and Corlija, 2005; Lyons and Scherpf, 2004; Lyons, Chang, and Scherpf, 2006; Schug, Niederjohn, and Wood, 2006; Yao, Gutter, and Hanna, 2005). Effective financial education, though, is still developing, especially since consistent and comprehensive evaluation tools are not yet available (Fox and Hoffman, 2004: Fox, Bartholomae, and Lee, 2005; Lyons, Palmer, Jayaratne, and Scherpf, 2006). For the time being, many families, especially low-income families and minoritiesy families, seem to be lacking the appropriate level of financial education to evaluate the choices offered in the financial market.
42 See Ho and Pennington-Cross (2007) for an overview of the effects of predatory lending laws. Ho and Pennington-Cross (2006) and Elliehausen and Staten (2004) conclude that the predatory lending law in North Carolina had the effect of reduc-ing predatory lending, but also access to credit for lower-income families.
43 Limitations on credit unions’ scope and activities with respect to personal finance have decreased over time. For instance, in the 1980s, credit unions were permitted to offer first mortgages, and in the late 1990s, credit unions have beenwere allowed to offer membership to multiple groups (Leggett and Strand, 2002; Tripp and Smith, 1993). Following the greater scope of credit unions, they have experienced strong growth (Goddard, McKillop, and Wilson, 2002; Kaushik and Lopez, 1994). Even if families are not credit union members, they may be able to enjoy the benefits of this strong growth since the competition with credit unions seems to have lowered the costs of financial services at banks that directly compete with credit unions (Emmons and Schmid, 2000; Feinberg, 2001; Feinberg and Rahman, 2001).
44 With the arrival of new technology, this has become less of an obstacle, but it remains a contributing factor. Degryse and Ongena (2004) discuss the impact of technology on banking dispersion in Europe.

w w w . a m e r i c a n p r o g r e s s . o r g A U G U S T 2 0 0 7
�9
45 For more details on redlining and discrimination in lending see Blanchflower, Levine, and Zimmerman (2003), Cavalluzzo and Cavalluzzo (1998), Cavalluzzo, Cavalluzzo, and Wolken (2002), Cavalluzzo and Wolken (2005), Dymski (2001), Holloway and Wyly (2001), Munnell, Browne, and McEneany (1996), Newman and Wyly (2004), Ross (2005), and Wyly and Hammel (2004). The overwhelming evidence points towards the existence of at least some discrimination towards minority borrow-ers, low-income borrowers, and possibly small business owners. There is, though, a question if discrimination has been on the decline over the decade.
46 See Rhoades (2000) for more details on bank consolidation following the enactment of the Riegle-Neal Interstate Banking and Branching Efficiency Act of 1994. Wheelock and Wilson (2004) provide an overview of bank merger activity after the passage of the Gramm-Leach-Bliley Financial Services Modernization Act of 1999.
47 See Akhigbe and Madura (2004), Akhigbe, Johnston, and Madura (2004), Al Mamun,, Hassan, and Maroney (2005), and Yildrim, Kwag, and Collins (2006) for more details on the profitability and risk of financial service providers after passage of the Gramm-Leach-Bliley Financial Services Modernization Act of 1999.
48 See Avery and Samolyk (2004), Hein, Koch, and MacDonald (2005), Carow, Kane, and Narayanan (2006), Rauch and Henderson (2004) and Rose (1993) on bank lending to small businesses during two recent bank consolidation phases. The limited empirical evidence suggests that small business access to credit did not shrink in the wake of financial service consoli-dation over the past two decades.
49 See Berger (2003), Ely and Robinson (2001), and White (2002) for the link between new technologies, bank consolidation and credit access, leading to the conclusion that the introduction of new technologies has helped to maintain credit access for small businesses during bank consolidation waves. Bostic, Mehran, Paulson, and Saidenberg (2002) show the beneficial effect of the Community Reinvestment Act in stabilizing credit access during bank consolidations.

w w w . a m e r i c a n p r o g r e s s . o r gA U G U S T 2 0 0 7
�0
Dr. Christian E. Weller is a Senior Fellow at the Center for American Progress. His expertise is in the area of retirement income security, macroeconomics, and interna-tional finance. Prior to joining the Center, he was on the research staff at the Economic Policy Institute, where he remains a research associate. Dr. Weller has also worked at the Center for European Integration Studies at the University of Bonn in Germany, under the Department of Public Policy of the AFL-CIO in Washington, D.C., and in banking in Germany, Belgium and Poland. Dr. Weller is a respected academic with close to 100 publications in academic and popular publications. His academic publications have ap-peared in the Journal of Policy Analysis and Management, the Journal of Development Studies, the Cambridge Journal of Economics, the Journal of International Business Studies, the Journal of Aging and Social Policy, and the Journal of Economic Issues, among others. His popular writings have been published in the New York Times, USA Today, and the Atlanta Journal Constitution. In 2006, he was awarded the Outstand-ing Scholar-Practitioner Award from the Labor and Employment Relations Associa-tion. His work is frequently cited in the press and he is often a guest on national TV and radio programs. Dr. Weller holds a Ph.D. in economics from the University of Massa-chusetts at Amherst.
About the Author
